Abstract
Tourist perceived value is an important antecedent to loyalty by enhancing satisfaction, revisiting intentions, and recommendations, thereby promoting sustainable development of forest parks. However, existing research has not sufficiently examined the configurations of perceived value in relation to increasing tourist loyalty specifically in the context of forest parks, representing a notable gap in the existing literature that requires further investigation. To address this gap, both covariance-based structural equation model (CB-SEM) and fuzzy-set qualitative comparative analysis (fsQCA) models were conducted to explore the joint effects of perceived value on tourist loyalty and identify pathways of perceived value dimensions to increase tourist loyalty, based on the Value-Satisfaction-Loyalty Chain model. A total of 404 valid questionnaires were collected from 436 visitors to the Yingde National Forest Park in southern China. Among the respondents, 54.2% were male, nearly 50% were over 36 years old, and 60% held a university degree. The results indicate that perceived value significantly influences tourist loyalty, with satisfaction playing a crucial mediating role between perceived value and loyalty. Notably, the indirect effect mediated by satisfaction was found to be greater than the direct effect of perceived value on loyalty. Five distinct pathways were identified for enhancing tourist loyalty, categorized into three models: the economic value-driven model, the functional value and epistemic value dual-core driven model, and the emotional and social value dual-core driven model. Additionally, four pathways were identified for enhancing tourist satisfaction, which subsequently improves tourist loyalty. These four pathways were grouped into two modes: the economic value-driven model and the functional value plus driven model. This study introduces an innovative perspective on the relationship between tourist perceived value and loyalty in forest parks, identifying key factors and configurations within the five dimensions of perceived value that enhance both tourist loyalty and satisfaction. Moreover, it extends the application of the Value-Satisfaction-Loyalty Chain theory to a forest park context. The findings provide valuable insights for forest park managers, guiding them in enhancing perceived value through targeted pathways to increase tourist revisit intentions and recommendations, ultimately supporting the park’s sustainable development. The influence of individual items on tourist satisfaction and loyalty, along with the identification of optimal item combinations to enhance loyalty, necessitates further investigation. Furthermore, a deeper exploration of the heterogeneity of factors and pathways for improving tourist loyalty is required.
1. Introduction
Forest parks have evolved as significant natural and recreational spaces, contributing to both ecological conservation and human well-being. Historically, the establishment of forest parks was driven by the need to preserve biodiversity and provide controlled public access to natural landscapes [1,2]. Many countries have designated forest parks to balance conservation with recreation, ensuring that visitors can experience nature while minimizing environmental degradation [3]. Over the past few decades, the expansion of protected areas and eco-tourism initiatives has led to a steady increase in forest park visitation worldwide [4].
Forest parks play a critical role in global sustainability by maintaining ecosystem functions, preserving biodiversity, and serving as carbon sinks [5]. They also provide cultural, aesthetic, and psychological benefits, contributing to public health and well-being [6]. Beyond their ecological significance, forest parks serve as important economic assets, supporting local economies through tourism, employment, and community-based conservation initiatives [6,7,8].
Tourism in forest parks has become an essential component of sustainable development strategies, fostering environmental awareness and financial support for conservation efforts [9,10,11]. The tourist potential of forests is determined by various factors, such as the forest’s age, habitat moisture, terrain slope, stand density, the presence of undergrowth and underbrush, soil coverage, and species composition [12]. Nature-based tourism, including activities such as hiking, wildlife observation, and camping, enhances visitors’ appreciation of natural landscapes and promotes responsible environmental behavior [13,14]. Studies have indicated that well-managed tourism in forest parks can contribute significantly to local and national economies while ensuring the protection of natural resources [15,16]. In some forest parks, tourism has surpassed the carrying capacity, leading to environmental protection issues, as observed in HengTou Mountain National Forest Park in northeast China [17]. A similar situation has occurred in Mount Rinjani National Park and Lombok Island and other forest parks [18,19,20]. One potential solution to this issue is the implementation of tourist restrictions, as seen in the Five Mountains of China and Yellowstone National Park in the USA. Some forest parks face the opposite challenge, where the number of tourists is insufficient to support the tourism services offered, leading to concerns about the sustainability of these parks [21]. Zhou et al. found that government economic support alone cannot sustain the development of Qiandao Lake National Forest Park, China, while tourism revenue is an important economic supplement, and the relaxation and health benefits for tourists can increase their willingness to pay more [22]. Zhang et al. indicated that competition among urban forest parks is intensifying, and improving tourist satisfaction, which enhances their likelihood of revisiting, is key to promoting the growth of forest tourism [23]. Therefore, the challenge remains in improving visitor loyalty to increase repeat visits and recommendations for attracting more tourists in most forest parks [24,25,26].
With the increasing demand for recreational opportunities in natural settings, understanding how to enhance tourist loyalty has become a critical issue for park management [27,28,29]. Tourist loyalty, which represents repeat visits and recommendations, is essential in sustaining a stable long-term market and advancing sustainable development of forest parks [27,30].
Extensive research has been conducted on the factors influencing tourist loyalty across various tourism contexts. One of the most critical determinants of tourist loyalty is perceived value, which encompasses multiple dimensions, including emotional, functional, epistemic, social, and monetary value [31,32,33,34,35,36]. Each of these dimensions shapes tourists’ overall experiences and their likelihood of revisiting or recommending the park. Studies have shown that perceived value influences tourist satisfaction and loyalty positively [27,37]. Different dimensions of perceived value, including functional, emotional, and social value, exhibit varying effects on tourist loyalty and satisfaction, depending on the context [38]. Joung & Yang et al., indicated that satisfaction serves as a mediator in the relationship between perceived value and loyalty, reinforcing the importance of visitor contentment in loyalty formation [39,40,41].
Despite the extensive literature on perceived value and tourist loyalty, several critical research gaps persist. While much of the existing research focuses on urban tourism, heritage sites, and hospitality, there is a paucity of studies examining tourist loyalty in nature-based tourism settings, such as forest parks [8,13,28,42,43]. Traditional statistical methods, such as SEM and regression analysis, primarily examine linear relationships but fail to capture synergistic interactions among multiple value dimensions that influence tourist loyalty [44]. The relative importance of different perceived value dimensions remains context-dependent, necessitating further exploration in the specific setting of forest parks [43]. While satisfaction has been recognized as a mediator in tourism research, its specific role in the perceived value-loyalty relationship within forest parks requires further empirical validation [8].
While perceived value has been widely acknowledged in tourism research, the precise mechanisms through which it influences tourist loyalty, particularly in forest park settings, remain underexplored.
To bridge these research gaps, this study will focus on answering the following questions:
- (1)
- Does tourist perceived value have significant positive effects on tourist loyalty and tourist satisfaction in a National Forest Park context?
- (2)
- Does tourist satisfaction have a perceived value that has significant positive impacts on tourist loyalty, and does it have a mediating role in the relationship between tourist perceived value and tourist loyalty?
- (3)
- What are the key factors and combinations to improve tourist loyalty in a National Forest Park context?
By integrating Structural Equation Modeling (SEM) with Fuzzy Set Qualitative Comparative Analysis (FsQCA), this study seeks to advance theoretical understanding while providing evidence-based strategies to enhance tourist loyalty in forest parks. The insights will be valuable to park administrators, policymakers, and tourism stakeholders aiming to foster more engaging and sustainable visitor experiences. These findings will be crucial in the development of targeted strategies to improve visitor satisfaction and loyalty, ultimately contributing to the sustainability of forest parks and enriching the overall visitor experience.
The remainder of our study is organized as follows. In Section 2, the literature on tourist perceived value, satisfaction, and tourist loyalty is explored. Then the hypotheses and the conceptual model are presented. In Section 3, the research site is firstly introduced, and then the measurement instrument and data collection process are demonstrated. The data summary is then presented. In Section 4, the measurement model is firstly tested, and then the hypotheses are examined. The configuration analysis to improve tourist satisfaction and loyalty is then conducted with fuzzy set quantitative comparative analysis (FsQCA). At last, the results are discussed, and the limitations and further research are highlighted in Section 5.
2. Literature Review and Hypothesis
2.1. Tourist Perceived Value
Perceived value has become a central concept in tourism research, as it is crucial in shaping tourists’ attitudes, satisfaction, and loyalty. Perceived value originated in early economic and marketing literature, where it was initially viewed as a trade-off relationship between benefits and costs. Zeithaml further advanced a seminal extension of this concept, defining perceived value as the consumer’s overall assessment of the utility of a product based on perceptions of what is received and what is given [45]. This definition emphasized the subjective nature of value, which varies across individuals and contexts.
Researchers recognized that perceived value is not a unidimensional construct but rather a complex interplay of multiple dimensions. Sheth et al. proposed a theory of consumption values, identifying five dimensions of perceived value, including emotional value (EV), epistemic value (EpV), social value (SV), functional value (FV), and conditional value (CV) [46]. The studies show that emotional value relates to the affective responses tourists experience, such as enjoyment and relaxation, while epistemic value concerns the knowledge or learning gained from the visit. Social value is linked to the social interactions and status gained from the experience, while functional value refers to the practical benefits derived from the visit, such as the quality of services and facilities. Conditional value is the utility derived from specific situational contexts. Holbrook further expanded the conceptualization by introducing a typology of consumer value, which included intrinsic/extrinsic, self-oriented/other-oriented, and active/reactive dimensions [47]. This framework highlighted the experiential and symbolic aspects of value beyond mere functional utility. Moreover, studies advised that the perceived value has been adapted to specific contexts, such as service context, which should emphasize the role of service quality, sacrifice, and perceived risk [48], while environmental and ethical dimensions should be incorporated into perceived value, reflecting growing consumer interest in sustainable consumption [49]. In hospitality service, Vandamme & Leunis proposed that price/value dimensions need to be incorporated into perceived value [50].
Perceived value plays a crucial role in shaping tourists’ loyalty and satisfaction. The scale of perceived value, including dimensions such as emotional value, epistemic value, social value, functional value, and conditional value proposed by Sheth et al. [46], has been widely applied in various contexts within tourism research. Zhao and Weng studied the effects of tourist perceived value on tourist satisfaction in urban forest parks [11]. Lu et al. studied tourist perceived value on destination loyalty in Grand Canal Forest Park [51]. The five-dimensional framework of perceived value has been adapted across different research areas to suit the unique characteristics of each context.
2.2. Perceived Value and Tourist Loyalty
Tourist loyalty refers to both the behavioral and attitudinal commitment of a tourist to a specific destination, service, or brand. It is considered one of the key outcomes of perceived value and satisfaction. It is a central factor influencing long-term visitor retention and the economic sustainability of tourism destinations.
The concept of loyalty originated in marketing and consumer behavior literature, where it was initially viewed as a unidimensional construct focused on repeat purchase behavior [52]. With the development of the tourist loyalty study, researchers recognized that loyalty is more complex than just repeat behavior, including both behavioral and attitudinal dimensions. Behavioral loyalty refers to actual behaviors, such as repeat visitation, frequency of visits, and willingness to recommend [53], while attitudinal loyalty reflects psychological commitment, emotional attachment, and preference for a destination [54].
The Value-Satisfaction-Loyalty Chain is a key component of Value-Satisfaction Theory. The chain indicated that a direct link between perceived value and tourist loyalty has been established, where tourists who perceive high value from a destination are more likely to return and recommend it [55]. Yao et al. found the perceived value has positive effects on tourist loyalty in Tongzhou Grand Canal Forest Park [4]. Zhou et al. found that perceived value has significant positive effects on tourist loyalty in Qiandao Lake National Forest Park [22]. Based on the analysis, we infer that:
H1.
Perceived value has a significant positive effect on tourist loyalty.
2.3. Perceived Value, Satisfaction, and Tourist Loyalty
Tourist satisfaction refers to the overall evaluation of a travel experience based on the comparison between expectations and actual experiences. It directly influences destination loyalty, repeat visitation, and positive word-of-mouth.
Based on expectancy-disconfirmation theory, satisfaction can be measured with the gap between expectations and perceived performance [56]. Perceived value influences satisfaction by shaping expectations and perceptions of performance. When perceived value exceeds expectations, satisfaction increases. The value-attitude-behavior model suggests that perceived value influences attitudes (e.g., satisfaction), which in turn affects behavioral intentions [57].
Numerous studies have demonstrated a strong positive relationship between perceived value and tourist satisfaction. Chen & Chen proved that emotional experiences, such as joy and relaxation, significantly enhance tourist satisfaction [58], while Zeithaml found that epistemic value, such as learning and discovery during travel, positively influences satisfaction [45]. Sweeney & Soutar indicated that social value, such as social interactions and shared experiences, contributes to higher satisfaction levels [31], while Petric showed that tourists who perceive high functional value, such as quality accommodations and efficient transportation, are more likely to be satisfied with their travel experiences [59]. Schneider & Wagemann showed that tourists who perceive good value for money (Price/Value for Money) are more likely to report high satisfaction [60]. Based on the expectancy-disconfirmation theory and the value-attitude-behavior model, we infer the hypothesis:
H2.
Perceived value has a significant positive effect on tourist satisfaction.
The Value-Satisfaction-Loyalty Chain illustrates the sequential relationships among perceived value, tourist satisfaction, and tourist loyalty. Typically, satisfaction directly influences loyalty, with satisfied tourists being more likely to engage in repeat visitation, recommend the destination, and develop an emotional attachment.
The Value-Satisfaction-Loyalty Chain also indicated that satisfaction often mediates the relationship between perceived value and loyalty, although perceived value usually influences tourist loyalty directly [54]. The Value-Attitude-Behavior Model proposed that perceived value (e.g., functional, emotional, social) influences tourist attitudes (e.g., satisfaction), which then affect loyalty behaviors. Satisfaction plays a critical role as a mediator in the relationship between perceived value and tourist loyalty. Zhang et al. found that tourist satisfaction has a significant moderating role between tourist perceived value and tourist loyalty in urban forest parks [23], while Yao et al. found the mediating role of tourist satisfaction on the relationship between tourist perceived value and loyalty in Grand Canal Forest Park [4]. It is generally acknowledged that tourist satisfaction is a key antecedent to loyalty [61]. When tourists perceive high value in their experiences (i.e., the benefits outweigh the costs), their satisfaction with the destination increases, leading to a higher probability of their loyalty [37]. Thus, we infer the following hypotheses:
H3.
Tourist satisfaction has a significant positive effect on tourist loyalty.
H4.
Tourist satisfaction has a significant mediation effect on the relationship between tourist satisfaction and tourist loyalty.
Therefore, we present the theoretical model (Figure 1), and it then will be examined in our study.
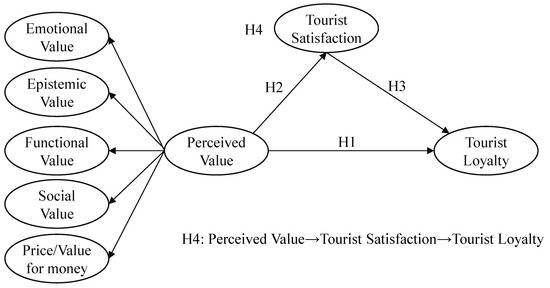
Figure 1.
Theoretical model.
3. Materials and Methods
3.1. Study Site: Yingde National Forest Park
Yingde National Forest Park, situated in Yingde City, northern Guangdong Province, China, is a prime example of a protected natural area that combines ecological conservation with sustainable tourism. Established in 2000, it is one of the earliest and the biggest national forest parks in Guangdong Province. The park, renowned for its rich biodiversity, scenic landscapes, and unique cultural heritage, plays an essential role in both environmental protection and the local economy.
Yingde National Forest Park spans over 50,000 hectares of lush forest, characterized by a variety of plant species and diverse ecosystems. The park is a critical habitat for numerous endemic species, including several that are under threat of extinction. The forest functions as a vital carbon sink, contributing to the region’s efforts in mitigating the impacts of climate change. In addition, the park’s unique geographical features, such as its steep mountains, deep valleys, and crystal-clear streams, contribute to the region’s ecological balance.
In recent years, the tourism industry in Yingde has been promoted as a way to boost local economic development while preserving the region’s natural beauty. The park offers a range of activities designed to provide visitors with a deeper connection to nature, including hiking, wildlife observation, and photography. It also features educational programs aimed at raising awareness about environmental conservation and the importance of protecting natural habitats.
Yingde National Forest Park has become a popular destination for eco-tourism, drawing visitors from the Great Bay Areas. The integration of sustainable tourism practices ensures that tourism activities contribute to the local economy without compromising the park’s ecological integrity.
Despite its success in environmental protection, Yingde National Forest Park faces challenges in competing with other national forest parks and rural tourist spots. Additionally, there is the issue of tourism product renewal, which can lead to the degradation of tourism development over time. One of the primary concerns is how to increase tourist loyalty to ensure higher rates of revisiting and recommendations. This challenge has become a major problem for the park, as sustained visitor engagement is crucial for long-term success. Studying how to improve tourist loyalty is therefore critical for the sustainable tourism development of the park and for contributing to the local economic development.
3.2. Measurement Instrument
The initial phase of the research involved designing a questionnaire, guided by Churchill’s scale development procedures [62]. The questionnaire was structured into two primary sections. The first section focused on collecting demographic data, including age, gender, education level, and economic status. The second section measured key variables, such as tourist perceived value, satisfaction, and loyalty.
Tourists’ perceived value was evaluated using the five-dimension scale developed by Sheth et al. [46] and adapted with the advice of Schneider & Wagemann [60]. The adapted scale encompassed five dimensions, including emotional value (EV), epistemic value (EpV), social value (SV), functional value (FV), and price/value for money (PVM). Tourist satisfaction was assessed through the whole satisfaction between the gap of tourist expectation and perceived performance developed by Oliver [56], comprising four items. Tourist loyalty was measured using the scale developed by Oppermann [53], which included three components: intention to revisit, recommend, and pay more. The scale was shown in Table 1. All rating variables were measured on a 5-point Likert scale, where 1 represented “completely disagree” and 5 indicated “completely agree”.

Table 1.
Summary of items.
3.3. Data Collection
The study utilized convenience sampling to collect data from visitors at Yingde National Forest Park. This approach was chosen due to the lack of a defined tourist population or a comprehensive visitor list for random sampling [63,64]. It also proved friendly for both researchers and participants.
Data were collected through a questionnaire-based survey conducted on weekends and public holidays between 1 May and 31 October 2024. To mitigate potential sample selection bias inherent in convenience sampling, data were collected from 11 distinct tourist clusters within the park. Additionally, different questionnaire distributors were assigned to collect data at various locations during each survey session. With approval from park management, four trained graduate students administered the questionnaires on-site. Visitors were invited to participate in the survey about their park experience, with a small gift offered as an incentive. In alignment with related studies on tourist loyalty, no strict distinction was made between first-time and repeat visitors [28,65,66]. Questionnaires were distributed to consenting participants during their rest or visit periods [63].
Of the 436 questionnaires collected, 32 were excluded due to missing values, resulting in 404 valid responses and a validity rate of 91.07%. The sample comprised 54.20% male and 45.80% female respondents. By age, 26.50% were under 18, 25.20% were 19–35 years old, 25.50% were 36–60, and 22.80% were over 60. Educationally, 62.60% held a university degree. In terms of annual income, 59.30% earned between 60,000 and 200,000 Yuan RMB, while 23.80% earned above 200,000 Yuan RMB. A summary of these items is provided in Table 1.
3.4. Research Methods
Initially, the data was assessed for normality with the descriptive analysis of SPSS (v26.0), and the common method bias was evaluated with the single-factor test analysis of SPSS. The research hypotheses were subsequently tested using a two-stage approach, as recommended by Hair et al. [67]. In the first stage, a measurement model was developed using CB-SEM (Covariance-Based SEM) to evaluate validity and reliability. In the second stage, a structural model was applied to test the research hypotheses. At last, the configuration analysis was conducted using the FsQCA model to identify the potential path to increasing tourist loyalty [68].
4. Results
4.1. Normality and Bias Analysis
The normality of the scale items was assessed using skewness and kurtosis analysis. Statistics of skewness and kurtosis tests were found to fall within −2 to 2 for most items, and six of them exceed 2 slightly, indicating that the data normal distribution is acceptable [12,69]. As a result, traditional covariance-based Structural Equation Modeling (CB-SEM) was considered suitable for this research [70,71].
Furthermore, a single-factor test was conducted to check for bias among the items. Four items had eigenvalues greater than 1, with the first factor explaining 36.13% of the total variance, which is below the critical value of 40%. This suggests that common method bias did not significantly affect the data analysis [72].
4.2. Reliability and Validity of the Measures
Reliability was assessed using Cronbach’s alpha (α) and composite reliability (CR). A Cronbach’s alpha value (α) exceeding the critical threshold of 0.7 indicates that the construct demonstrates good reliability [70]. Similarly, a construct is considered to have good reliability if the Composite Reliability (CR) value surpasses the critical threshold of 0.7 [73]. In this study, the α values ranged from 0.784 to 0.972, exceeding the 0.7 threshold, while the CR values ranged from 0.784 to 0.972, also surpassing the 0.7 criterion (Table 2). These results collectively indicate robust reliability of the measurement scale.
Table 2.
Results of measurement model analysis.
Convergent validity was evaluated through item factor loadings and the average variance extracted (AVE). A construct is considered to demonstrate satisfactory convergent validity if the factor loadings exceed the critical threshold of 0.7. Furthermore, a construct is regarded as having adequate convergent validity if the Average Variance Extracted (AVE) exceeds 0.50 [74]. In this study, the critical ratios (t-statistics) for factor loadings ranged from 7.513 to 47.792, with all p-values below 0.001, confirming statistical significance. The factor loadings ranged from 0.725 to 0.960, all surpassing the 0.70 threshold, thereby supporting acceptable convergent validity. Additionally, the AVE values ranged from 0.530 to 0.923, all exceeding the 0.50 threshold [74], further substantiating the scale’s convergent validity (Table 2).
Discriminant validity was assessed through the covariance between constructs. The covariance was standardized and expressed as correlations to determine whether the constructs were distinct and separate from one another. According to Hair et al., correlations were considered to indicate distinct constructs if their values were lower than 0.9 [75]. Additionally, discriminant validity was further tested by examining the relationships between the average variance extracted (AVE) and the correlations or shared variance (SV) of the variables (AVE-SV). Discriminant validity is supported when the square root of the AVE is greater than the correlations between a latent variable and others [76]. The HTMT (Heterotrait-Monotrait Ratio) analysis was employed to test the discriminant validity too. The HTMT ratio less than 0.85 is generally considered to be discriminant validity of the two constructs [77]. In this study, the results revealed that the highest correlation coefficient was 0.842, lower than the threshold of 0.9 (Table 3). Moreover, the square root of the AVE of a latent variable is greater than the correlations between the latent variable and other latent variables, showing discriminant validity (Table 3). The HTMT values range from 0.020 to 0.840, indicating that the constructs are distinct (Table 3). Therefore, based on the correlation analysis, the AVE-SV approach, and the HTMT analysis, the latent variables of the scale were found to be significantly distinct. In comparison to reliability and validity analyses conducted in similar forest park studies [4,22,51,63], the lowest CR and Cronbach’s alpha values in our study were 0.74 and 0.76, respectively, while the factor loading and AVE were 0.70 and 0.43, respectively. The corresponding coefficients in our study exceed the minimum thresholds reported in prior research, demonstrating that the constructs exhibit robust reliability and validity.
Table 3.
Discriminant validity analysis.
4.3. Hypotheses Test
4.3.1. Goodness-of-Fit
A structural model was utilized to test the hypotheses, employing a bootstrapping procedure with 5000 subsamples following the assessment of reliability and validity. The overall fit of the model was evaluated using the chi-square test and several goodness-of-fit indices. A model is considered acceptable if the ratio of the χ2 statistic to the degrees of freedom is 3 or lower [78]. For the goodness-of-fit indices, values of the Comparative Fit Index (CFI), Non-Normed Fit Index (NNFI), and Incremental Fit Index (IFI) exceeding 0.90 were used as thresholds for an acceptable model fit [79]. Additionally, the Root Mean Square Error of Approximation (RMSEA) values of 0.08 or below were considered indicative of a good fit. The results showed that χ2/df = 2.97, which was lower than the threshold of 3, indicating moderate fit. The CFI was 0.902, and the NNFI was 0.90, indicating a good fit between the proposed model and the data. The IFI was 0.901, suggesting a good fit between the proposed model and the data. Additionally, the RMSEA was 0.079, suggesting a good fit of the model to the data.
4.3.2. Hypothesis Test
The research hypotheses were tested and analyzed based on the path coefficients and significance (Table 4 and Figure 2).
Table 4.
Hypotheses test.
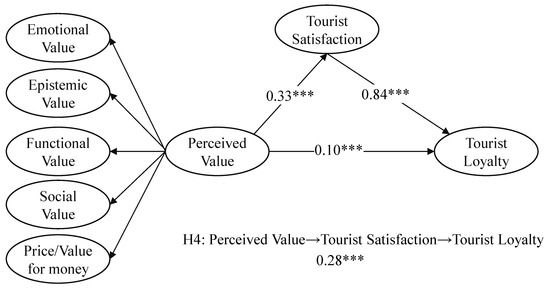
Figure 2.
Hypothesis test results. Note: *** p < 0.001.
The perceived value (β = 0.10, p < 0.01) exerts a significant positive effect on tourist loyalty, indicating that higher perceived value leads to increased loyalty. Thus, hypothesis H1 is supported by the structural model results.
Similarly, perceived value (β = 0.33, p < 0.001) has a positive influence on tourist satisfaction, confirming that an improved perceived value leads to greater satisfaction. Therefore, hypothesis H2 is also supported.
Furthermore, satisfaction significantly and positively affects tourist loyalty (β = 0.84, p < 0.001), supporting hypothesis H3. The findings suggest that enhanced satisfaction leads to higher levels of tourist loyalty.
4.3.3. Mediating Effect Test
Zhao et al., suggested that indirect effects can be assessed using the bootstrapping method [80]. Following this approach, the indirect effects were evaluated using AMOS 28.0. The 95% confidence intervals were derived from 5000 bootstrapping resamples (Table 5). The findings reveal that tourist satisfaction significantly mediates the relationship between perceived value and loyalty (β = 0.28, p < 0.001), thus confirming hypothesis H4. Furthermore, the total effect of perceived value on tourist loyalty was evaluated by examining both the direct and indirect effects. The direct effect (β = 0.10) accounts for 26.51% of the total effect, while the indirect effect (β = 0.28) accounts for 73.49% of the total effect (Table 5).
Table 5.
Results of the indirect effects.
4.4. Conditional Analysis of Higher Tourist Loyalty
Fuzzy-set Qualitative Comparative Analysis (FsQCA) is a valuable method for identifying potential solutions that explain the outcome of interest or test variable relationships grounded in theoretical frameworks. Given the significant positive effects of perceived value on both tourist loyalty and satisfaction in forest parks, FsQCA (v3.0) will be employed to analyze the possible solutions for improving tourist loyalty associated with specific perceptions of value.
4.4.1. Data Calibration
The first step in the analysis is to compute the values of latent variables, which will serve as inputs for the FsQCA analysis when the latent variables are measured with multiple items. Several methods are available for calculating the values of latent variables, including item means, standardized item sums, weighted sum scores, regression scores, and Bartlett scores [81]. The weighted sum score, which is calculated by multiplying the standardized factor loadings of each item by its corresponding scaled score, is commonly used. This method is particularly advantageous as it applies different weights (i.e., factor loadings) to each item, ensuring that items with the highest loadings have the greatest impact on the factor score [81]. The factor loadings for the items were computed using confirmatory factor analysis (CFA) in AMOS (v28.0) (Table 2).
In FsQCA, calibration of variables is required to construct fuzzy sets, where the values range from 0 to 1 [68]. A fuzzy set can be conceptualized as a group, and the values within this range define the degree of membership of a case in the group, with 0 indicating no membership and 1 indicating full membership. A membership score of 0.5 represents the midpoint, indicating that a case is equally a member and a non-member of the fuzzy set. Such a case is considered to belong to the intermediate set.
Data calibration can be conducted using either direct or indirect methods, with the direct method being more commonly applied and recommended. In this approach, the researcher assigns three values based on substantive knowledge and theoretical understanding, corresponding to full-set membership, full-set non-membership, and the intermediate set [82]. Typically, the 95%, 50%, and 5% percentiles of the latent variables were calculated to define the thresholds for converting the data into fuzzy sets [44,68]. When the value corresponds exactly to the 50% percentile, it is difficult to determine whether the case belongs to full-set membership or full-set non-membership. To address this ambiguity, a small constant (0.001) is added or subtracted when determining the crossover points [44]. In this study, we added a constant of 0.001 to the 50% percentile value for each latent variable. After completing the data calibration, the five explanatory latent variables—Emotional Value, Epistemic Value, Functional Value, Social Value, and Price/Value for Money—along with the mediating latent variable, satisfaction, and the outcome latent variable, tourist loyalty, were entered into FsQCA for necessity analysis and true table analysis.
4.4.2. Necessity Analysis
Before conducting the truth table analysis, a necessity analysis is performed to assess whether there are necessary explanatory conditions for the outcomes. A consistency level greater than 0.9 for an explanatory variable indicates that it is a necessary condition for the outcome variables [60].
In this study, perceived value has a significant positive effect on tourist loyalty, with satisfaction mediating the relationship. Thus, tourist loyalty and satisfaction are treated as outcome variables, while the five dimensions of perceived value are set as explanatory variables. The necessity analysis results reveal that the highest consistency for the five explanatory variables was 0.80 for tourist loyalty and 0.79 for satisfaction as outcome variables (Table 6 and Table 7), both of which are below the 0.90 threshold. This indicates that no single dimension of perceived value is a decisive factor in tourist loyalty and satisfaction. Consequently, it is important to explore the combinations of explanatory variables that influence tourist loyalty and satisfaction.
Table 6.
Results of necessity analysis for tourist loyalty.
Table 7.
Results of necessity analysis for tourist satisfaction.
4.4.3. True Table Analysis and Solutions
Truth table analysis identifies all potential configurations of explanatory variables that may result in the outcomes, along with their associated frequency, consistency, and Proportional Reduction in Inconsistency (PRI) consistency [83].
Frequency indicates the number of cases in the sample explained by a particular configuration, and a frequency threshold must be established to ensure that each configuration is represented by a sufficient number of cases. For samples larger than 150 cases, a threshold of 3 or higher is typically set, while for smaller samples, a threshold of 2 may be applied [44,68]. The consistency threshold reflects the likelihood that a given combination of explanatory variables leads to the outcome variable. Higher consistency scores suggest a stronger probability that the explanatory combination causes the observed outcome. The minimum recommended consistency threshold is 0.75 [82]. The Proportional Reduction in Inconsistency (PRI) consistency reflects whether the corresponding row in the truth table belongs to a subset of result Y rather than its negation (~Y). A higher PRI value indicates a lower likelihood of simultaneous subsets, suggesting greater precision in the results [43,84]. Generally, a PRI score greater than or equal to 0.75 is considered indicative of reliable and accurate conclusions.
In our study, the frequency threshold is set at 3, given that our sample size is 404, and all configurations with a frequency below this threshold are excluded. The consistency threshold is set at 0.80, which exceeds the recommended minimum value of 0.75, while the PRI consistency is set at 0.75.
After setting the parameters, FsQCA generates a complex solution, a parsimonious solution, and an intermediate solution. The complex solution includes all potential condition combinations, while the parsimonious solution simplifies this by highlighting essential conditions. The intermediate solution, derived from counterfactual analysis, incorporates only plausible alternatives. The final result combines the parsimonious and intermediate solutions. Variables appearing in both are core drivers of outcomes, while those appearing only in the intermediate solution are auxiliary.
After conducting the truth table analysis, five distinct configurations of explanatory variables were identified for positive tourist loyalty (Table 8). The results show that the subset consistency for each solution is above the threshold value of 0.8, with the overall consistency across all combinations being 0.91. This indicates that these five configurations represent sufficient conditions for explaining positive tourist loyalty. Furthermore, solution coverage represents the explanatory power of the configurations, representing the proportion of cases that can be explained by all configurations [82]. Case coverage reflects the empirical relevance or importance of the configurations, similar to R2 in regression analysis [44]. In our study, the five configurations collectively explain 73% of the cases.
Table 8.
Configuration analysis for Tourist loyalty.
Based on the configuration analysis of tourist loyalty as an outcome through FsQCA, the pathways to enhancing tourist loyalty can be categorized into three distinct modes: the cost value-driven model, the dual-core model driven by functional and epistemic value, and the emotional and social value-driven model. The cost value-driven model treats the cost incurred by tourists in the forest park as an auxiliary variable, and it explains more than 30% of the cases with tourist loyalty, demonstrating a strongly reliable predictor of tourist loyalty to the park (consistency = 0.90). The dual-core model, driven by functional and epistemic values, identifies these two variables as the primary drivers, with emotional value serving as an auxiliary factor. This pathway explains over 30% of the cases with tourist loyalty and shows a higher likelihood of boosting loyalty (consistency = 0.95). The emotional and social value-driven model consists of three pathways, where emotional and social values serve as core drivers, while functional value is an auxiliary variable in the first path, both functional and epistemic values serve as auxiliaries in the second, and cost value is auxiliary in the third. The first two paths explain more than 30% of the cases with loyalty, while the third path accounts for 16% of the cases with loyalty, with all three paths exhibiting a strong likelihood of increasing tourist loyalty to the forest park (consistency > 0.90).
Additionally, four distinct configurations of explanatory variables were identified for positive tourist satisfaction (Table 9). The results indicate that the subset consistency for each solution exceeds the threshold value of 0.8, with the overall consistency for all combinations being 0.81. This suggests that these four configurations represent sufficient conditions for explaining positive tourist satisfaction. Moreover, these configurations collectively account for 83% of the cases, demonstrating strong explanatory power.
Table 9.
Configuration analysis for satisfaction.
According to the configuration analysis of tourist satisfaction as an outcome using FsQCA, two primary pathways to improve tourist satisfaction were identified: the economic value-driven model and the functional value plus driven model. In the economic value-driven model, the cost incurred by tourists in the forest park is treated as an auxiliary variable, explaining more than 38% of the cases and showing a high probability of increasing tourist satisfaction with the park (consistency = 0.88). The functional value plus-driven model consists of three distinct paths, with functional value as the core driving variable. In the first path, emotional value and epistemic value serve as auxiliary drivers; in the second, emotional value and social value are auxiliary drivers; and in the third, emotional value, epistemic value, and social value act as auxiliary drivers. Each of these three paths accounts for over 30% of the cases with tourist satisfaction, with all paths demonstrating a high likelihood of enhancing satisfaction with the forest park (consistency > 0.86).
4.4.4. Robust Test
To ensure the reliability of the results, a robustness test is an essential step in QCA research. We conducted a data robustness test by adjusting the crossover point (with increases and decreases of 0.05), raising the consistency threshold from 0.80 to 0.85, and lowering the frequency threshold to 2 [44,85,86]. The configurations of the outcomes remained consistent with the original analysis, with only slight changes in overall consistency and coverage. These results suggest that the configurations are robust and reliable.
5. Conclusions and Discussion
5.1. Research Conclusions
The covariance-based SEM and fsQCA methods were employed to reveal that perceived emotional value, epistemic value, functional value, social value, and price/value for money jointly influence tourist satisfaction and loyalty in forest parks. The following conclusions are drawn.
First, tourist perceived value in forest parks can be represented with emotional value, epistemic value, functional value, social value, and price/value for money significantly. The coefficients of emotional value, functional value, and social value are higher than that of epistemic value and price/value for money, indicating emotional value, functional value, and social value have greater importance in measuring tourist perceived value in forest parks.
Second, tourist perceived value has a significant positive effect on tourist loyalty and tourist satisfaction. Tourist satisfaction plays a significant positive mediating role between perceived value and tourist loyalty in forest parks. The indirect effect of tourist perceived value on tourist loyalty mediated by tourist satisfaction is higher than the direct effect. Tourist satisfaction is an important mediating variable for improving tourist loyalty in forest parks. Studies have shown that perceived value has a significant impact on tourist loyalty across various tourism sectors, including eco-tourism, forest parks, and rural tourism destinations [4,37,61]. Our study aligns with these findings, confirming that perceived value plays a crucial role in shaping tourist loyalty, with satisfaction acting as a mediator in this relationship. Previous research consistently demonstrates that enhancing perceived value can lead to increased tourist satisfaction, which, in turn, fosters greater loyalty through revisit intentions and recommendations. For destination managers, this underscores the importance of improving perceived value as a key strategy to boost tourist loyalty, ensuring higher rates of repeat visitation and positive word-of-mouth.
Third, five pathways to enhancing tourist loyalty are identified with FsQCA analysis, and the five pathways can be categorized into three distinct modes: the economic value-driven model, the dual-core model driven by functional and epistemic value, and the emotional and social value-driven model. The economic value-driven model treats the cost incurred as an auxiliary variable, and the dual-core model, driven by functional and epistemic values, identifies these two variables as the core drivers, while the emotional and social value-driven model consists of three pathways, where emotional and social values serve as core drivers. The pathways indicate that the dimensions of perceived value play different roles across various pathways, with no single dimension consistently playing the most important role in enhancing tourist loyalty across all pathways.
Fourth, four primary pathways to improve tourist satisfaction were identified, and they can be categorized into two modes: the economic value-driven model and the functional value plus driven model. In the economic value-driven model, the cost is treated as an auxiliary variable, while the functional value plus driven model consists of three distinct paths, with functional value as the core driving variable. Different dimensions of perceived value play distinct roles in various pathways for improving tourist satisfaction.
5.2. Theoretical and Managerial Contribution
Firstly, we combine the five dimensions of tourist perceived value to identify pathways for improving tourist satisfaction and loyalty in forest parks, offering an innovative perspective on tourist loyalty research. Previous studies have shown that perceived value significantly affects tourist loyalty [41,64,87]. However, much of the existing research has focused on the impact of a single dimension [4] or a joint dimension [88] of perceived value on tourist loyalty or has primarily examined the measurement of perceived value dimensions [55], often overlooking the influence of the multi-dimensional interplay on tourist loyalty. To fill this gap, we employed fsQCA to explore the effect mechanism of emotional value, epistemic value, functional value, social value, and price/value for money on tourist loyalty. Through this analysis, we identified key factors and pathways that contribute to higher satisfaction and increased loyalty. The results provide valuable theoretical insights for the diversified management of forest parks and contribute to advancing the research on tourist loyalty by incorporating a multi-dimensional approach.
Secondly, our study demonstrates that price/value for money plays an important role in shaping higher tourist satisfaction and increasing loyalty, thereby enriching the research on perceived value. While previous research on perceived value measurement has highlighted the importance of price in tourism, our study offers new insights into this relationship. Recent studies have used structural equation modeling to confirm that price/value for money is a key factor in measuring perceived value and influencing tourist loyalty [60]. Our findings support this by showing that price, as the only indispensable factor in the pathways, leads to higher satisfaction and increased tourist loyalty. Moreover, we identify the interaction effects of functional and epistemic value as well as emotional and social value on tourist loyalty. The combinations of functional and epistemic value and emotional and social value are key to enhancing tourist loyalty. As core factors, the combinations of emotional and social value can be further extended to three paths for improving tourist loyalty, advancing the field of configuration research on tourist loyalty.
Third, economic value (price/value for money) is an essential factor influencing both tourist satisfaction and loyalty [60]. Therefore, forest park managers should prioritize pricing strategies that enhance economic value for tourists, such as offering family packages, parent-child tickets, group discounts, and promotional offers. These initiatives not only improve the perceived economic value but also contribute to higher tourist satisfaction and loyalty.
Fourth, the combinations of emotional and social value can be extended into three distinct pathways for enhancing tourist loyalty. It is crucial for park managers to strengthen emotional connections between tourists and the forest park, which can significantly improve loyalty. For instance, organizing high-quality, interactive activities that foster emotional engagement among visitors can stimulate emotional resonance and attachment. Additionally, enhancing the construction and quality of basic service facilities, such as hiking trails, digital infrastructure (e.g., free Wi-Fi, navigation maps), and leisure amenities within the forest park, will elevate the perceived functional value. These improvements can further boost tourist loyalty by creating a more convenient and enjoyable experience.
Fifth, both over-visitation and under-visitation contribute to the unsustainable development of national forest parks. Over-visitation leads to environmental degradation, while under-visitation results in economic challenges that undermine the parks’ sustainability. To address these issues, it is crucial to strengthen policies related to forest park management, ensuring they integrate environmental, economic, and social goals. Collaboration among relevant government agencies (e.g., forestry, tourism, and environmental departments) should be promoted to develop integrated strategies that balance park development, conservation, and sustainable tourism. Furthermore, clear metrics should be established to assess the effectiveness of forest park management and evaluate the impact of tourism. Regular policy assessments, informed by data-driven insights, are essential for making necessary adjustments and ensuring long-term sustainability.
5.3. Limitations
Our study has made a little breakthrough in perceived value and tourist loyalty in forest parks, but there are still limitations that need to be improved. First, the perceived value-satisfaction-loyalty chain model was employed to study how tourist perceived value influences loyalty and identify the pathways to improve tourist loyalty based on the combination of five dimensions of perceived value. However, this study may not identify all factors that clarify the action mechanism on higher tourist loyalty. Therefore, to extract all factors that influence tourist loyalty, identify key factors, and find combinations of key factors to improve tourist loyalty is one of the research points in the future. It is important to find the key factors of items and combinations of items to improve tourist loyalty. Second, we took Yingde National Forest Park tourists as the research sample; there are still differences about tourist spots, recreation items, and even service quality in forest parks and regions. Therefore, heterogeneity analysis of factors and pathways remains to be further explored next. Third, it is clear that the tourism experiences of different visitor groups (e.g., first-time vs. repeat visitors, weekday vs. weekend visitors, and family vs. individual visitors) vary significantly. Therefore, future research should focus on comparing the differences among these distinct visitor groups.
Author Contributions
Conceptualization, H.Z. and Q.Y.; methodology, Q.Y. and R.Y.; software, R.Y., L.G. and Q.Y.; validation, H.Z. and Q.Y.; formal analysis, H.Z.; data curation, L.G., Q.Y. and R.Y.; writing—original draft preparation, H.Z.; writing—review and editing, H.Z., L.G. and Q.Y.; funding acquisition, H.Z. All authors have read and agreed to the published version of the manuscript.
Funding
This research was funded by the Characteristic Innovation Project of Guangdong Universities, grant number 2019WTSCX064 and the China National Natural Sciences Foundation, grant number 41501152.
Data Availability Statement
The data presented in this study are available on request from the corresponding author.
Conflicts of Interest
The authors declare no conflicts of interest.
References
- Watson, J.E.M.; Dudley, N.; Segan, D.B.; Hockings, M. The performance and potential of protected areas. Nature 2014, 515, 67–73. [Google Scholar] [CrossRef] [PubMed]
- Allendorf, T.D. A Global Summary of Local Residents’ Attitudes toward Protected Areas. Hum. Ecol. 2020, 48, 111–118. [Google Scholar] [CrossRef]
- Dewar, K. Tourism in national parks and protected areas: Planning and management. Tour. Manag. 2004, 25, 288–289. [Google Scholar] [CrossRef]
- Yao, X.; Sun, Y.; Sun, B.; Huang, Y. The Impact of the Urban Forest Park Recreation Environment and Perceived Satisfaction on Post-Tour Behavioral Intention-Using Tongzhou Grand Canal Forest Park as an Example. Forests 2024, 15, 330. [Google Scholar] [CrossRef]
- Ma, Z.; Chen, Y.; Melville, D.S.; Fan, J.; Liu, J.; Dong, J.; Tan, K.; Cheng, X.; Fuller, R.A.; Xiao, X. Changes in area and number of nature reserves in China. Conserv. Biol. 2019, 33, 1066–1075. [Google Scholar] [CrossRef] [PubMed]
- Wolch, J.R.; Byrne, J.; Newell, J.P. Urban green space, public health, and environmental justice: The challenge of making cities ‘just green enough’. Landsc. Urban Plan. 2014, 125, 234–244. [Google Scholar] [CrossRef]
- Li, Y.F.; Song, M. The Influence of Tourist-Environment Fit on Environmental Responsibility Behavior: A Moderated Mediation Model. Forests 2024, 15, 1726. [Google Scholar] [CrossRef]
- Zhou, B.; Wang, L.T.; Huang, S.S.; Xiong, Q.H. Impact of perceived environmental restorativeness on tourists’ pro-environmental behavior: Examining the mediation of place attachment and the moderation of ecocentrism. J. Hosp. Tour. Manag. 2023, 56, 398–409. [Google Scholar] [CrossRef]
- Majewski, L. Economic impact analysis of nature tourism in protected areas: Towards an adaptation to international standards in German protected areas. J. Outdoor. Recreat. Tour. 2024, 45, 100742. [Google Scholar] [CrossRef]
- Dodge, R.; Daly, A.P.; Huyton, J.; Sanders, L. The challenges of defining wellbeing. Int. J. Wellbeing 2012, 2, 222–235. [Google Scholar] [CrossRef]
- Zhao, J.L.; Weng, L.S. The Impact of Tourists’ Perceived Value on Environmentally Responsible Behavior in an Urban Forest Park: The Mediating Effects of Satisfaction and Subjective Well-Being. Forests 2024, 15, 1730. [Google Scholar] [CrossRef]
- George, D.; Mallery, P. IBM SPSS Statistics 26 Step by Step: A Simple Guide and Reference; Routledge: London, UK, 2019. [Google Scholar]
- Donici, D.S.; Dumitras, D.E. Nature-Based Tourism in National and Natural Parks in Europe: A Systematic Review. Forests 2024, 15, 588. [Google Scholar] [CrossRef]
- Zhang, H.M.; Zhang, X.; Yang, Y.J.; Ma, J.Y. From nature experience to visitors’ pro-environmental behavior: The role of perceived restorativeness and well-being. J. Sustain. Tour. 2024, 32, 861–882. [Google Scholar] [CrossRef]
- Akyol, A. Contributions of Local Guidance Practices to The Natural Environment, Protected Areas and Local People. Appl. Ecol. Environ. Res. 2017, 15, 1079–1096. [Google Scholar] [CrossRef]
- Tian, Z.; Zhang, Q.; Kim, K. Experiential value and environmentally responsible behavioral intention in rock-climbing tourism: The role of place attachment and biospheric value. J. Outdoor. Recreat. Tour. 2024, 48, 100829. [Google Scholar] [CrossRef]
- Xiao, X. Study on Tourism Resources Evaluation and Development of Hengtou Mountain National Forest Park. Master’s Thesis, Northeast Forestry University, Harbin, China, 2010. [Google Scholar]
- Sadikin, P.N.; Mulatsih, S.; Pramudya, B.; Arifin, H.S. Dynamic model of ecotourism management in Mount Rinjani National Park. IOP Conf. Ser. Earth Environ. Sci. 2019, 399, 012041. [Google Scholar] [CrossRef]
- Faiz, S.A.; Komalasari, R.I. The assessment of tourism carrying capacity in Lombok Island. In Proceedings of the 5th Planocosmo International Conference Infrastructure For All: Smart, Innovative, and Inclusive, Bandung, Indonesia, 20–21 October 2020. [Google Scholar]
- Dudek, T. Recreational potential as an indicator of accessibility control in protected mountain forest areas. J. Mt. Sci. 2017, 14, 1419–1427. [Google Scholar] [CrossRef]
- Liu, J.; Wu, Y.; Jiang, X.; Jin, D. Tourists’ Preferences and Willingness to Pay for Biodiversity, Concession Activity and Recreational Management in Wuyishan National Park in China: A Choice Experiment Method. Forests 2024, 15, 629. [Google Scholar] [CrossRef]
- Zhou, B.; Wang, Y.; Huang, S.; Qiao, G. Perceived benefits and tourist willingness to pay more in national forest parks: The moderating roles of ecocentrism, collectivism, and power distance. J. Vacat. Mark. 2025. online first. [Google Scholar] [CrossRef]
- Zhang, L.; Wu, C.; Hao, Y. Effect of The Development Level of Facilities for Forest Tourism on Tourists’ Willingness to Visit Urban Forest Parks. Forests 2022, 13, 1005. [Google Scholar] [CrossRef]
- Alkan, H.; Korkmaz, M.; Tolunay, A. Assessment of Primary Factors Causing Positive or Negative Local Perceptions on Protected Areas. J. Environ. Eng. Landsc. Manag. 2009, 17, 20–27. [Google Scholar] [CrossRef]
- Rodríguez-Rodríguez, D.; López, I. Socioeconomic effects of protected areas in Spain across spatial scales and protection levels. Ambio 2020, 49, 258–270. [Google Scholar] [CrossRef] [PubMed]
- Pérez-Calderón, E.; Miguel-Barrado, V.; Prieto-Ballester, J.M. Tourism in Protected Areas in Spain: Perception of Sustainable Development in Protected Areas with Different Levels of Protection. Geoheritage 2024, 16, 17. [Google Scholar] [CrossRef]
- Zhang, Z.; Gao, Y.; Zhou, S.; Zhang, T.; Zhang, W.; Meng, H. Psychological Cognitive Factors Affecting Visual Behavior and Satisfaction Preference for Forest Recreation Space. Forests 2022, 13, 136. [Google Scholar] [CrossRef]
- Sahabuddin, M.; Alam, M.S.; Nekmahmud, M. How do perceived and environmental values influence tourist satisfaction, loyalty, and environmental awareness? Environ. Dev. Sustain. 2024. [Google Scholar] [CrossRef]
- Li, M.-H.; Lai, I.K.W. Exploring the formation of destination loyalty from destination personality and self-congruity: A mediating role of destination relationship quality. Int. J. Tour. Res. 2024, 26, e2675. [Google Scholar] [CrossRef]
- Qiu, N.; Li, H.; Pan, C.; Wu, J.; Guo, J. The study on the relationship between perceived value, satisfaction, and tourist loyalty at industrial heritage sites. Heliyon 2024, 10, e37184. [Google Scholar] [CrossRef]
- Soutar, S.G.N. Consumer perceived value: The development of a multiple item scale. J. Retail. 2001, 77, 203–220. [Google Scholar]
- Kaswanto; Rahmafitria, F.; Mosyaftiani, A.; Wiyoga, H. The Effect of Environmental Knowledge and Perceived Value on Visitor Experience in Forest Recreation. Medkon 2024, 29, 419–424. [Google Scholar]
- Wang, P. A cognitive model of document use during a research project. Study I. Document selection. J. Assoc. Inf. Sci. Technol. 2010, 49, 115–133. [Google Scholar] [CrossRef]
- Chae, M.J.; Kim, Y.; Roh, T. Consumers’ attention, experience, and action to organic consumption: The moderating role of anticipated pride and moral obligation. J. Retail. Consum. Serv. 2024, 79, 103824. [Google Scholar] [CrossRef]
- Furukawa, H.; Matsumura, K.; Harada, S. Effect of Consumption Values on Consumer Satisfaction and Brand Commitment: Investigating Functional, Emotional, Social, and Epistemic Values in the Running Shoes Market. Int. Rev. Manag. Mark. 2019, 9, 158–168. [Google Scholar] [CrossRef]
- Zhu, Y.; Zhu, L.; Weng, L. How Do Tourists’ Value Perceptions of Food Experiences Influence Their Perceived Destination Image and Revisit Intention? A Moderated Mediation Model. Foods 2024, 13, 412. [Google Scholar] [CrossRef]
- Chen, C.; Tsai, D. How destination image and evaluative factors affect behavioral intentions? Tour. Manag. 2007, 28, 1115–1122. [Google Scholar] [CrossRef]
- Gallarza, M.G.; Ruiz-Molina, M.E. Stretching the value-satisfaction-loyalty chain by adding value dimensions and cognitive and affective satisfactions A causal model for retailing. Manag. Decis. 2016, 54, 981–1003. [Google Scholar] [CrossRef]
- Joung, M.Y.; Yang, H.S. Effect of Customer Value on Customer Loyalty in Primary Care: Focusing on the Mediating Role of Customer Satisfaction. J. Korea Content. Assoc. 2008, 8, 225–234. [Google Scholar] [CrossRef]
- Devi, A.A.D.T.; Yasa, N. role of customer satisfaction in mediating the influence of service quality and perceived value on brand loyalty. Int. Res. J. Manag. IT Soc. Sci. 2021, 8, 315–328. [Google Scholar] [CrossRef]
- Shukri, S.; Yajid, M.S.A.; Khatibi, A. Mediating Role of Customer Satisfaction on the Relationship of Perceived Values and Services Quality with Customer Loyalty in the Telecommunication Service Providers in Malaysia. Syst. Rev. Pharm. 2020, 11, 1021–1032. [Google Scholar]
- Qian, J.; Li, X. Perceived Value, Place Identity, and Behavioral Intention: An Investigation on the Influence Mechanism of Sustainable Development in Rural Tourism. Sustainability 2024, 16, 1583. [Google Scholar] [CrossRef]
- Jiang, G.X.; Li, Y.Q.; Zhang, S.N.; Ruan, W.Q. How to impress guests: Key factors and strategy configurations for the accommodation memories of homestay guests. J. Hosp. Tour. Manag. 2022, 50, 267–276. [Google Scholar] [CrossRef]
- Fiss, P.C. Building better causal theories: A fuzzy set approach to typologies in organization research. Acad. Manag. J. 2011, 54, 393–420. [Google Scholar] [CrossRef]
- Zeithaml, V.A. Consumer perceptions of price, quality, and value: A means-end model and synthesis of evidence. J. Mark. 1988, 52, 2–22. [Google Scholar] [CrossRef]
- Sheth, J.N.; Newman, B.I.; Gross, B.L. Why we buy what we buy: A theory of consumption values. J. Bus. Res. 1991, 22, 159–170. [Google Scholar] [CrossRef]
- Holbrook, M.B. Consumer Value: A Framework for Analysis and Research; Routledge: London, UK, 1999. [Google Scholar]
- Parasuraman, A.; Grewal, D. The impact of technology on the quality-value-loyalty chain: A research agenda. J. Acad. Mark. Sci. 2000, 28, 168–174. [Google Scholar] [CrossRef]
- Lin, P.-C.; Huang, Y.-H. The influence factors on choice behavior regarding green products based on the theory of consumption values. J. Clean. Prod. 2012, 22, 11–18. [Google Scholar] [CrossRef]
- Vandamme, R.; Leunis, J. Development of a Multiple-item Scale for Measuring Hospital Service Quality. Int. J. Serv. Ind. 1993, 4, 30–49. [Google Scholar] [CrossRef]
- Lu, L.; Jiao, M.; Weng, L.S. Influence of First-Time Visitors’ Perceptions of Destination Image on Perceived Value and Destination Loyalty: A Case Study of Grand Canal Forest Park, Beijing. Forests 2023, 14, 504. [Google Scholar] [CrossRef]
- Jacoby, J. Brand Loyalty: Measurement and Management; John Willey and Sons: New York, NY, USA, 1978. [Google Scholar]
- Oppermann, M. Tourism destination loyalty. J. Travel. Res. 2000, 39, 78–84. [Google Scholar] [CrossRef]
- Yoon, Y.; Uysal, M. An examination of the effects of motivation and satisfaction on destination loyalty: A structural model. Tour. Manag. 2005, 26, 45–56. [Google Scholar] [CrossRef]
- Carvache-Franco, M.; Alvarez-Risco, A.; Carvache-Franco, O.; Carvache-Franco, W.; Estrada-Merino, A.; Villalobos-Alvarez, D. Perceived value and its influence on satisfaction and loyalty in a coastal city: A study from Lima, Peru. J. Policy Res. Tour. Leis. Events 2022, 14, 115–130. [Google Scholar] [CrossRef]
- Oliver, R.L. A cognitive model of the antecedents and consequences of satisfaction decisions. J. Mark. Res. 1980, 17, 460–469. [Google Scholar] [CrossRef]
- Homer, P.M.; Kahle, L.R. A structural equation test of the value-attitude-behavior hierarchy. J. Pers. Soc. Psychol. 1988, 54, 638–646. [Google Scholar] [CrossRef]
- Chen, C.-F.; Chen, F.-S. Experience quality, perceived value, satisfaction and behavioral intentions for heritage tourists. Tour. Manag. 2010, 31, 29–35. [Google Scholar] [CrossRef]
- Petrick, J.F. Development of a multi-dimensional scale for measuring the perceived value of a service. J. Leis. Res. 2002, 34, 119–134. [Google Scholar] [CrossRef]
- Schneider, C.Q.; Wagemann, C. Set-Theoretic Methods for the Social Sciences: A Guide to Qualitative Comparative Analysis; Cambridge University Press: Cambridge, UK, 2012. [Google Scholar]
- Baker, D.A.; Crompton, J.L. Quality, satisfaction and behavioral intentions. Ann. Tour. Res. 2000, 27, 785–804. [Google Scholar] [CrossRef]
- Churchill, G.A., Jr. A paradigm for developing better measures of marketing constructs. J. Mark. Res. 1979, 16, 64–73. [Google Scholar] [CrossRef]
- Liu, J.; Su, Y.; Ren, L.; Nijkamp, P. The influence of individual authenticity experience on tourists’ behavioral intentions: The chain mediating role of place dependence and place identity. Asia Pac. J. Tour. Res. 2023, 28, 1279–1294. [Google Scholar] [CrossRef]
- Lai, P.; Ou, D.; Zheng, H. Exploring Acoustic-Visual perception and satisfaction in urban Parks: Based on behavioral analysis. Ecol. Indic. 2024, 162, 112022. [Google Scholar] [CrossRef]
- Huang, S. The impact of ski servicescape on tourist loyalty: Evidence from Chinese market. Curr. Issues Tour. 2024, 28, 220–239. [Google Scholar] [CrossRef]
- Deng, Y.; Wang, X.; Ma, C. The Impact of Sports Tourism Motivation on Tourist Loyalty: The Chain Mediation Effect of Experience Quality and Tourist Satisfaction. Int. J. Tour. Res. 2024, 26, e2769. [Google Scholar] [CrossRef]
- Hair, J.; Sarstedt, M.; Hopkins, L.; Kuppelwieser, V. Partial least squares structural equation modeling (PLS-SEM): An emerging tool in business research. Eur. Bus. Rev. 2014, 26, 106–121. [Google Scholar] [CrossRef]
- Ragin, C. Redesigning Social Inquiry: Fuzzy Sets and Beyond; Bibliovault OAI Repository, The University of Chicago Press: Chicago, IL, USA, 2008. [Google Scholar]
- Sürücü, L.; Şeşen, H.; Maslakçı, A. Regression, Mediation/Moderation, and Structural Equation Modeling with SPSS, AMOS, and PROCESS Macro; Livre de Lyon: Lyon, France, 2023. [Google Scholar]
- Hair, J.F.; Ringle, C.M.; Sarstedt, M. PLS-SEM: Indeed a Silver Bullet. J. Market. Theory Pract. 2011, 19, 139–152. [Google Scholar] [CrossRef]
- Ory, D.T.; Mokhtarian, P.L. The impact of non-normality, sample size and estimation technique on goodness-of-fit measures in structural equation modeling: Evidence from ten empirical models of travel behavior. Qual. Quant. 2010, 44, 427–445. [Google Scholar] [CrossRef]
- Podsakoff, P.M.; MacKenzie, S.B.; Lee, J.Y.; Podsakoff, N.P. Common method biases in behavioral research: A critical review of the literature and recommended remedies. J. Appl. Psychol. 2003, 88, 879–903. [Google Scholar] [CrossRef]
- Bagozzi, R.P.; Yi, Y. On the evaluation of structural equation models. J. Acad. Mark. Sci. 1988, 16, 74–94. [Google Scholar] [CrossRef]
- Fornell, C.; Larcker, D.F. Evaluating Structural Equation Models with Unobservable Variables and Measurement Error. J. Mark. Res. 1981, 24, 337–346. [Google Scholar] [CrossRef]
- Hair, J.F.; Black, W.C.; Babin, B.J.; Anderson, R.E. Multivariate Data Analysis, 6th ed.; Pearson Prentice Hall: Upper Saddle River, NJ, USA, 2006. [Google Scholar]
- Hair, J.F.; Ringle, C.M.; Sarstedt, M. Partial Least Squares Structural Equation Modeling: Rigorous Applications, Better Results and Higher Acceptance. Long Range Plann. 2013, 46, 1–12. [Google Scholar] [CrossRef]
- Henseler, J.R.; Ringle, C.M.; Sarstedt, M. A new criterion for assessing discriminant validity in variance-based structural equation modeling. J. Acad. Mark. Sci. 2015, 43, 115–135. [Google Scholar] [CrossRef]
- Hoe, S.L. Issues and Procedures in Adopting Structural Equation Modeling Technique. J. Appl. Quant. Methods. 2008, 3, 76–83. [Google Scholar]
- Hu, L.t.; Bentler, P.M. Cutoff criteria for fit indexes in covariance structure analysis: Conventional criteria versus new alternatives. Struct. Equ. Modeling 1999, 6, 1–55. [Google Scholar] [CrossRef]
- Zhao, X.S.; Lynch, J.G.; Chen, Q.M. Reconsidering Baron and Kenny: Myths and Truths about Mediation Analysis. J. Consum. Res. 2010, 37, 197–206. [Google Scholar] [CrossRef]
- Distefano, C.; Zhu, M.; Mindrila, D. Understanding and Using Factor Scores: Considerations for the Applied Researcher. Pract. Assess. Res. Eval. 2008, 14, 1–11. [Google Scholar]
- Rihoux, B.; Ragin, C. Configurational Comparative Methods: Qualitative Comparative Analysis (QCA) and Related Techniques; Sage Publications: Thousand Oaks, CA, USA, 2009. [Google Scholar] [CrossRef]
- Pappas, I.O.; Woodside, A.G. Fuzzy-set Qualitative Comparative Analysis (fsQCA): Guidelines for research practice in Information Systems and marketing. Int. J. Inf. Manag. 2021, 58, 102310. [Google Scholar] [CrossRef]
- Greckhamer, T. CEO compensation in relation to worker compensation across countries: The configurational impact of country-level institutions. Strateg. Manag. J. 2016, 37, 793–815. [Google Scholar] [CrossRef]
- Du, Y.; Kim, P.H. One size does not fit all: Strategy configurations, complex environments, and new venture performance in emerging economies. J. Bus. Res. 2021, 124, 272–285. [Google Scholar] [CrossRef]
- Misangyi, V.F.; Greckhamer, T.; Furnari, S.; Fiss, P.C.; Crilly, D.; Aguilera, R. Embracing Causal Complexity: The Emergence of a Neo-Configurational Perspective. J. Manag. 2017, 43, 255–282. [Google Scholar] [CrossRef]
- Jiang, J.D. The role of natural soundscape in nature-based tourism experience: An extension of the stimulus-organism-response model. Curr. Issues Tour. 2022, 25, 707–726. [Google Scholar] [CrossRef]
- Rosa, C.D.; Collado, S. Experiences in Nature and Environmental Attitudes and Behaviors: Setting the Ground for Future Research. Front. Psychol. 2019, 10, 763. [Google Scholar] [CrossRef]


Disclaimer/Publisher’s Note: The statements, opinions and data contained in all publications are solely those of the individual author(s) and contributor(s) and not of MDPI and/or the editor(s). MDPI and/or the editor(s) disclaim responsibility for any injury to people or property resulting from any ideas, methods, instructions or products referred to in the content. |
© 2025 by the authors. Licensee MDPI, Basel, Switzerland. This article is an open access article distributed under the terms and conditions of the Creative Commons Attribution (CC BY) license (https://creativecommons.org/licenses/by/4.0/).