Article

Impacts of Plant Configuration on the Outdoor Wind Comfort of Subtropical Coastal Campuses: Evidence from a Study of Quanzhou

1
School of Geographical Sciences, Fujian Normal University, Fuzhou 350007, China
2
School of Resources and Environmental Sciences, Quanzhou Normal University, Quanzhou 362000, China
3
School of Architecture, Tianjin University, Tianjin 300072, China
*
Authors to whom correspondence should be addressed.
Forests 2025, 16(3), 461; https://doi.org/10.3390/f16030461
Submission received: 23 December 2024 / Revised: 28 February 2025 / Accepted: 3 March 2025 / Published: 5 March 2025

Abstract

:
Even though the interaction between plants and the outdoor wind environment has been a focus of interest for scholars from various disciplines in recent years, the relationship between campus outdoor wind comfort and plant configuration in subtropical coastal areas remains poorly understood. Using the outdoor space of a typical subtropical coastal campus (the Donghai Campus of Quanzhou Normal University) as a case study, we explore the connection between plant configuration and outdoor wind comfort. The campus outdoor area is segmented into roads, squares, and courtyards to investigate this relationship. To achieve this goal, a 9-h fixed-point measurement method and the PHOENICS software (2016) were utilized. The following are the findings of the research: (1) Within the realm of trees, the banyan, Bischofia javanica, and kapok species exhibit a notable impact on wind speed reduction, with respective wind reduction ratios of 1.22, 1.31, and 1.29. Notably, among shrubs, waringin stands out with a wind reduction ratio of 1.83. (2) The tree + shrub + grass combination is the most effective method for reducing wind among the three plant facade configurations. Specifically, the combination of Bischofia javanica, waringin, and carpet grass has the best wind reduction effect, with a wind reduction ratio of 2.55. (3) Adding Bischofia javanica, waringin, and grass plants in areas with high wind speeds can effectively improve wind comfort. This provides directions for creating a comfortable wind environment on university campuses situated in subtropical coastal areas.

1. Introduction

The campus outdoor space, being the largest public area within the school, plays a pivotal role in hosting educational activities, as well as serving as a hub for the students’ daily outdoor pursuits and interpersonal engagements. When evaluating the quality of the campus outdoor environment, the wind environment is a key factor to consider [1], as it often interferes with the safety and comfort of outdoor activities for teachers and students. The adverse wind environment directly affects the utilization rate of campus outdoor space activities. In subtropical coastal areas, such as Quanzhou in the summer and winter, this problem is particularly prominent.
At present, research on the campus wind environment in Chinese universities mostly focuses on cold regions, in North China, and humid and hot regions in South China. The research mainly involves three aspects: campus architectural form and layout, landscape planning, optimization strategies, and suggestions. In terms of architectural form and layout, the study by Xiaoyu Ying et al. revealed that the comfort of the outdoor wind environment on campus is associated with specific building characteristics, such as the transparency of the windward side, the size of the ventilation gap, the presence of a ventilation corridor, and the positioning of the vertical connection volume [2]. Through the design of external clusters, Shuo Chen et al. optimized the configuration of campus clusters, resulting in an increase in the proportion of spatial wind shadow areas from 20% to 53% [3]. Cheng Sun et al. discovered that achieving a D/H ratio of 2.50 enhances the outdoor thermal comfort and spatial experience of the teaching building cluster. The study suggests that L-shaped and three-sided enclosures are the optimal grouping forms, striking a balance between outdoor thermal comfort, energy efficiency, and spatial needs [4]. Regarding landscape planning, Binyi Liu et al. investigated how landscape layout influences the near-ground wind conditions in residential settings [5]. Qiang Zeng et al. investigated the influence of landscape planning and design on environmental ventilation conditions and examined the underlying causes of unfavorable working conditions [6]. Jia Guo et al. maintained the overall concepts of land use indicators and early campus planning and design unchanged. Under this premise, they proposed optimization strategies from the perspectives of campus clusters and individual buildings [7]. With regard to optimization strategies and recommendations, Mingya Liu et al. suggested optimization approaches to enhance the campus wind environment, encompassing architectural layout and green configuration [8]. Neng Zhang et al. discovered that enhancing campus greenery and establishing pocket parks can enhance ventilation efficiency in regions where wind conditions fall below prescribed standards [9]. Wang et al. discovered that the average wind speed on the floor plan at 6 m and 10 m above the roof was generally above 3 m/s, making it a favorable condition for harnessing wind energy [10]. The research conducted thus far has highlighted a lack of studies focusing on campus wind conditions in areas with hot summers and mild winters. Thus, additional research is imperative.
Despite the lack of research on the effects of vegetation greening on the wind environment, Yuehua Han et al. discovered that, during the summer season, implementing a double-row planting arrangement with a tree crown spacing of 2 m effectively enhances wind speed on the windward side of the gymnasium. Additionally, in the winter, the optimal planting configuration involves a double-row setup with a spacing of 2 m [11]. Ruijie Liu et al. discovered that the combination of small trees and large shrubs, as well as medium trees along with small trees and large shrubs, exhibits optimal wind speed reduction efficiency for pedestrian comfort in urban green spaces [12]. The findings of Zhang Li et al. suggest that the influence of vegetation on thermal conditions and airflow is contingent upon factors such as tree distribution, leaf area index (LAI), crown width, and tree height [13]. Ahmad Hami et al. found that the cooling efficiency of plants depends on factors such as plant species, tree and shrub arrangement, the distribution and connectivity of green patches in the landscape, and orientation of the planting rows [14]. The research findings of Murtaza Mohammadi et al. show that, although hedges and trees can impede airflow, trees have a greater capacity to generate cooling effects [15]. Liyan Rui et al. discovered that when grass and shrub coverage decreases under equivalent green space coverage, trees take their place. This substitution, while having a minor effect on thermal comfort, wind speed, and air pollution, enhances the recreational areas available to residents [16]. The study by Hao Li et al. revealed a 43% reduction in the wind speed amplification factor when protective forests were present, resulting in a notable decrease in amplification factors for the key hazardous wind directions [17]. Woei-Leong Chan et al. used porous tetrahedral elements to model tree canopies and calculate aerodynamic wind forces on trees, with the goal of reducing the risk of tree failure [18]. There is still a need for more research on how plant configuration affects the wind environment on university campuses located in hot summer and warm winter areas.
In summary, this study utilizes both CFD simulation and on-site measurement methods, focusing on a study of the impact of different plant configurations on the wind environment of the campus outdoor spaces in subtropical coastal universities (specifically the Donghai Campus of Quanzhou Normal University). It was discovered through initial experiments that the comfort of outdoor spaces on campus plays a significant role in student outdoor activities. Therefore, by combining CFD simulation and on-site measurements in both the summer and winter, this study explores the impact of plant configuration on the wind environment in order to provide a reference for creating a comfortable wind environment for outdoor campus spaces in subtropical coastal areas.

2. Research Object and Methods

2.1. Research Object: Quanzhou Normal University Donghai Campus

2.1.1. Spatial Overview of Quanzhou Normal University, Quanzhou City, Fujian Province

Located on the southeast coast of China, Quanzhou City ranges from 117°25′ to 119°04′ east longitude and from 24°30′ to 25°56′ north latitude. It is classified as a Cfa type according to the Köppen–Geiger climate classification system. The city is recognized by the United Nations as the beginning of the Maritime Silk Road, and it is also acknowledged as a World Heritage city. It belongs to a subtropical marine monsoon climate (Figure 1a) and is deeply affected by sea winds, especially the East China Sea campus of Quanzhou Normal University, which is more affected by strong wind erosion (Figure 1b,c). The Donghai Campus of Quanzhou Normal University, located just 1 km from the coast, is prone to frequent summer typhoons and winter gales. The average annual temperature is approximately 19.8 °C, with an average annual precipitation of around 1030 mm.

2.1.2. Outdoor Space Types of Donghai Campus of Quanzhou Normal University

Through an analysis of the current overall plan of the Donghai Campus of Quanzhou Normal University (Figure 2a), it is found that the outdoor space can be divided into three categories based on the different plant enclosure methods used: square space, road space, and courtyard space. The square space is an open outdoor area mainly surrounded by plants, such as the main entrance square in Zone A and the sports square in Zone B. The road space is a linear outdoor area mainly enclosed by plants on both sides, such as the east–west roads in Zone C and the north–south roads in Zone D. The courtyard space is an enclosed outdoor area surrounded by buildings and plants, such as individual buildings in Zone E and group buildings in Zone F (Figure 2b). These categories will be used as measurement points to compare and analyze the wind environment of different types of outdoor spaces on campus.

2.2. Contrastive Research Method

This study focuses on three types of enclosed planting spaces (square, road, and courtyard) in the Donghai Campus of Quanzhou Normal University. By conducting on-site measurements, the wind environment comfort in these spaces can be assessed to identify both their advantages and disadvantages. Based on this, the impact of plants on the spatial wind comfort is explored, as well as whether plant configuration can improve the wind environment comfort in uncomfortable spaces.
To evaluate how different plant configurations affect the wind environment, the flat configurations were modeled using SketchUp v.2021 software (solitary planting, opposite planting, and row planting) and vertical configurations (tree + shrub + grass, tree + grass, and shrub + grass). The plants were simplified into rectangular forms, with a focus on the relationship between different plant configurations and summer and winter monsoon comfort. Afterwards, the 3D models were brought into PHOENICS software to carry out CFD simulation calculations.

2.3. Research Framework

This study analyzed the simulation results of three spatial models and two plant configuration models for the Donghai Campus of Quanzhou Normal University using a combination of mathematical analysis, on-site measurements, and simulations, as well as comparative research methods. The CFD simulation results demonstrated the instantaneous wind speed on site, and a comparison was conducted to validate the reliability of the simulation by comparing the measured and simulated wind speed values. Then, combined with practical cases, it is demonstrated that the plant configuration can improve the universality of the wind environment comfort. Figure 3 illustrates the research framework of this study.

2.4. Evaluation Methods and CFD Simulation

2.4.1. Wind Environment Evaluation Methods in the Summer and Winter

This study primarily examines how various plant configurations affect the outdoor wind comfort of subtropical coastal campuses. Based on the Chinese green building evaluation system and existing research standards, a standard for assessing the summer and winter wind environment was developed. In accordance with the “Green Building Evaluation Standards” (GB/T 50378-2019), it is recommended that, during typical summer wind conditions, the human activity area of a site should be free from vortices or windless areas. Similarly, during standard winter wind conditions, the wind speed should not exceed 5 m/s at a height of 1.5 m above ground level [19]. Studies by Tan and Liu have suggested that low wind speeds, termed quiet wind zones (below 1 m/s), can result in poor air circulation, prolonged accumulation of pollutants, and adverse effects on human comfort and health [20,21]. According to Soligo et al., wind speeds of 1.6 m/s to 3.4 m/s are ideal for prolonged standing or sitting, while speeds between 3.4 m/s and 5.4 m/s are suitable for shorter periods [22]. Consequently, the criteria for evaluating the summer and winter monsoon environments are proposed as follows: wind speeds exceeding 1 m/s in the summer and between 1 m/s and 5 m/s in the winter. Specifically, wind speeds of 1.6 m/s to 3.4 m/s are deemed suitable for extended periods of standing or sitting, whereas speeds of 3.4 m/s to 5.0 m/s are suitable for shorter durations. Furthermore, in alignment with the “Green Building Evaluation Standards” (GB/T 50378-2019) and established research practices, the standard for evaluating the wind environment is the wind speed data collected at a height of 1.5 m above ground level.

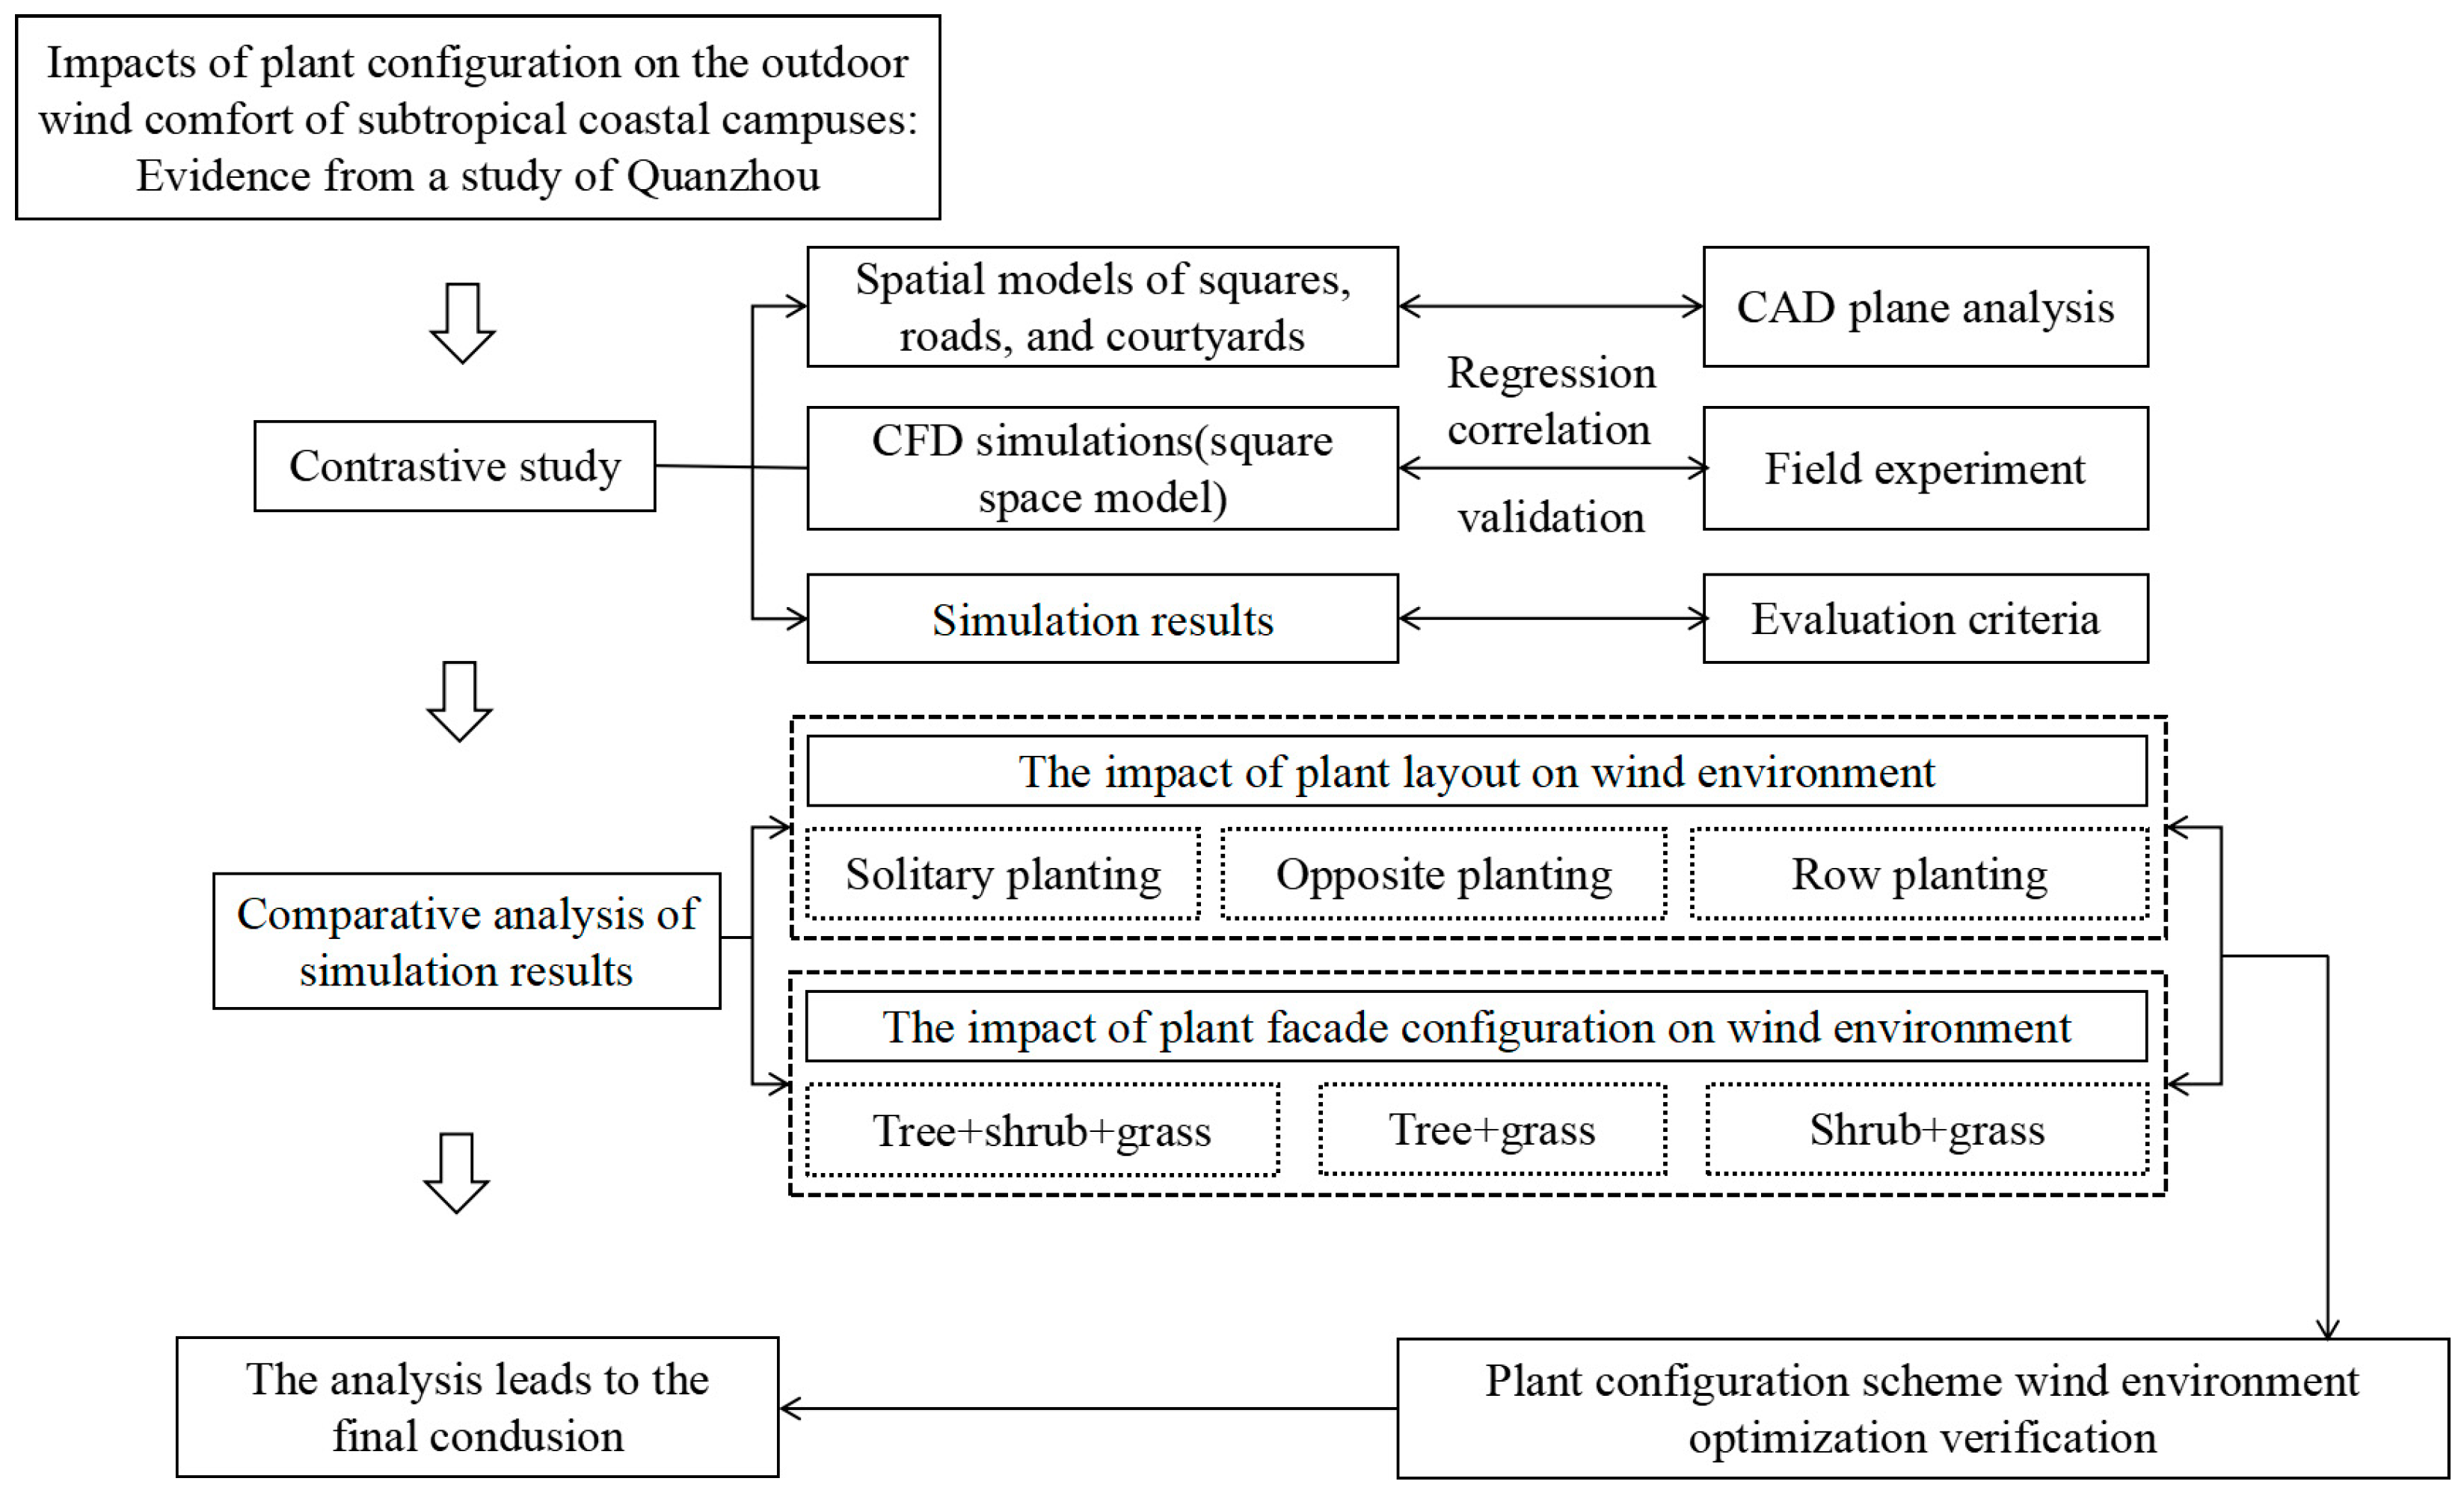
2.4.2. Details of Wind Environment Experiment and Simulations

(1)
Measured Points Selection
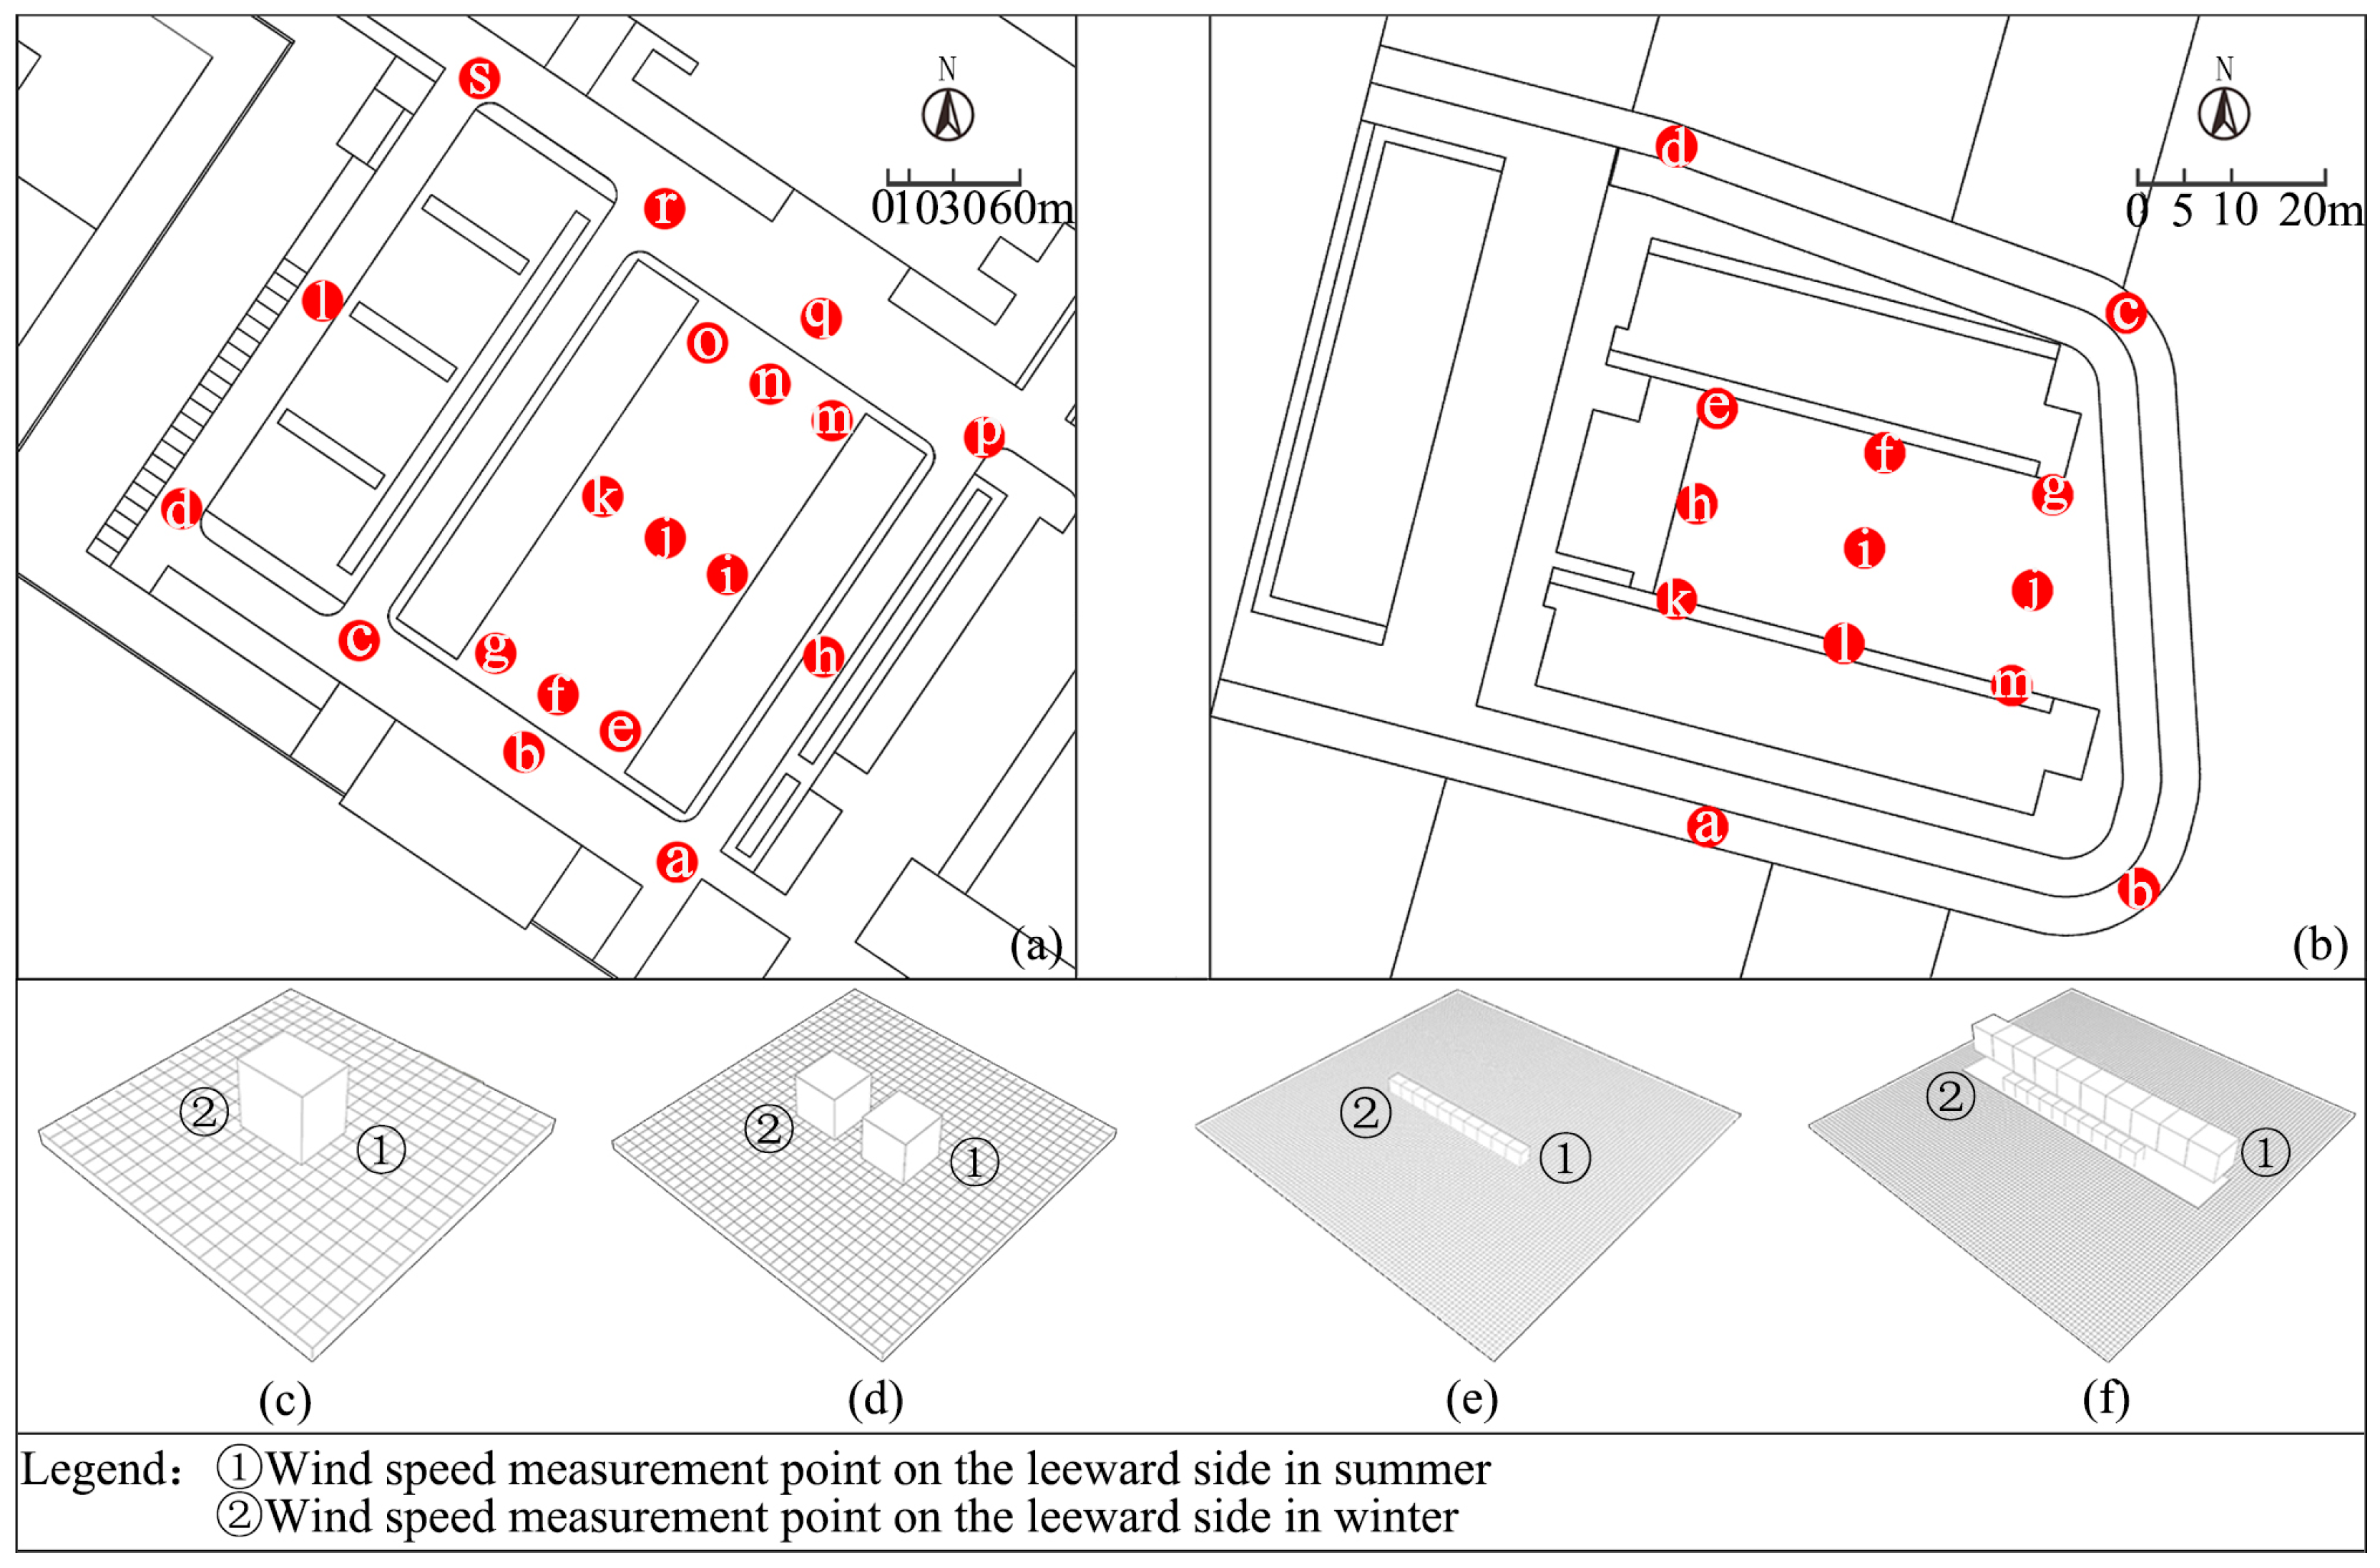
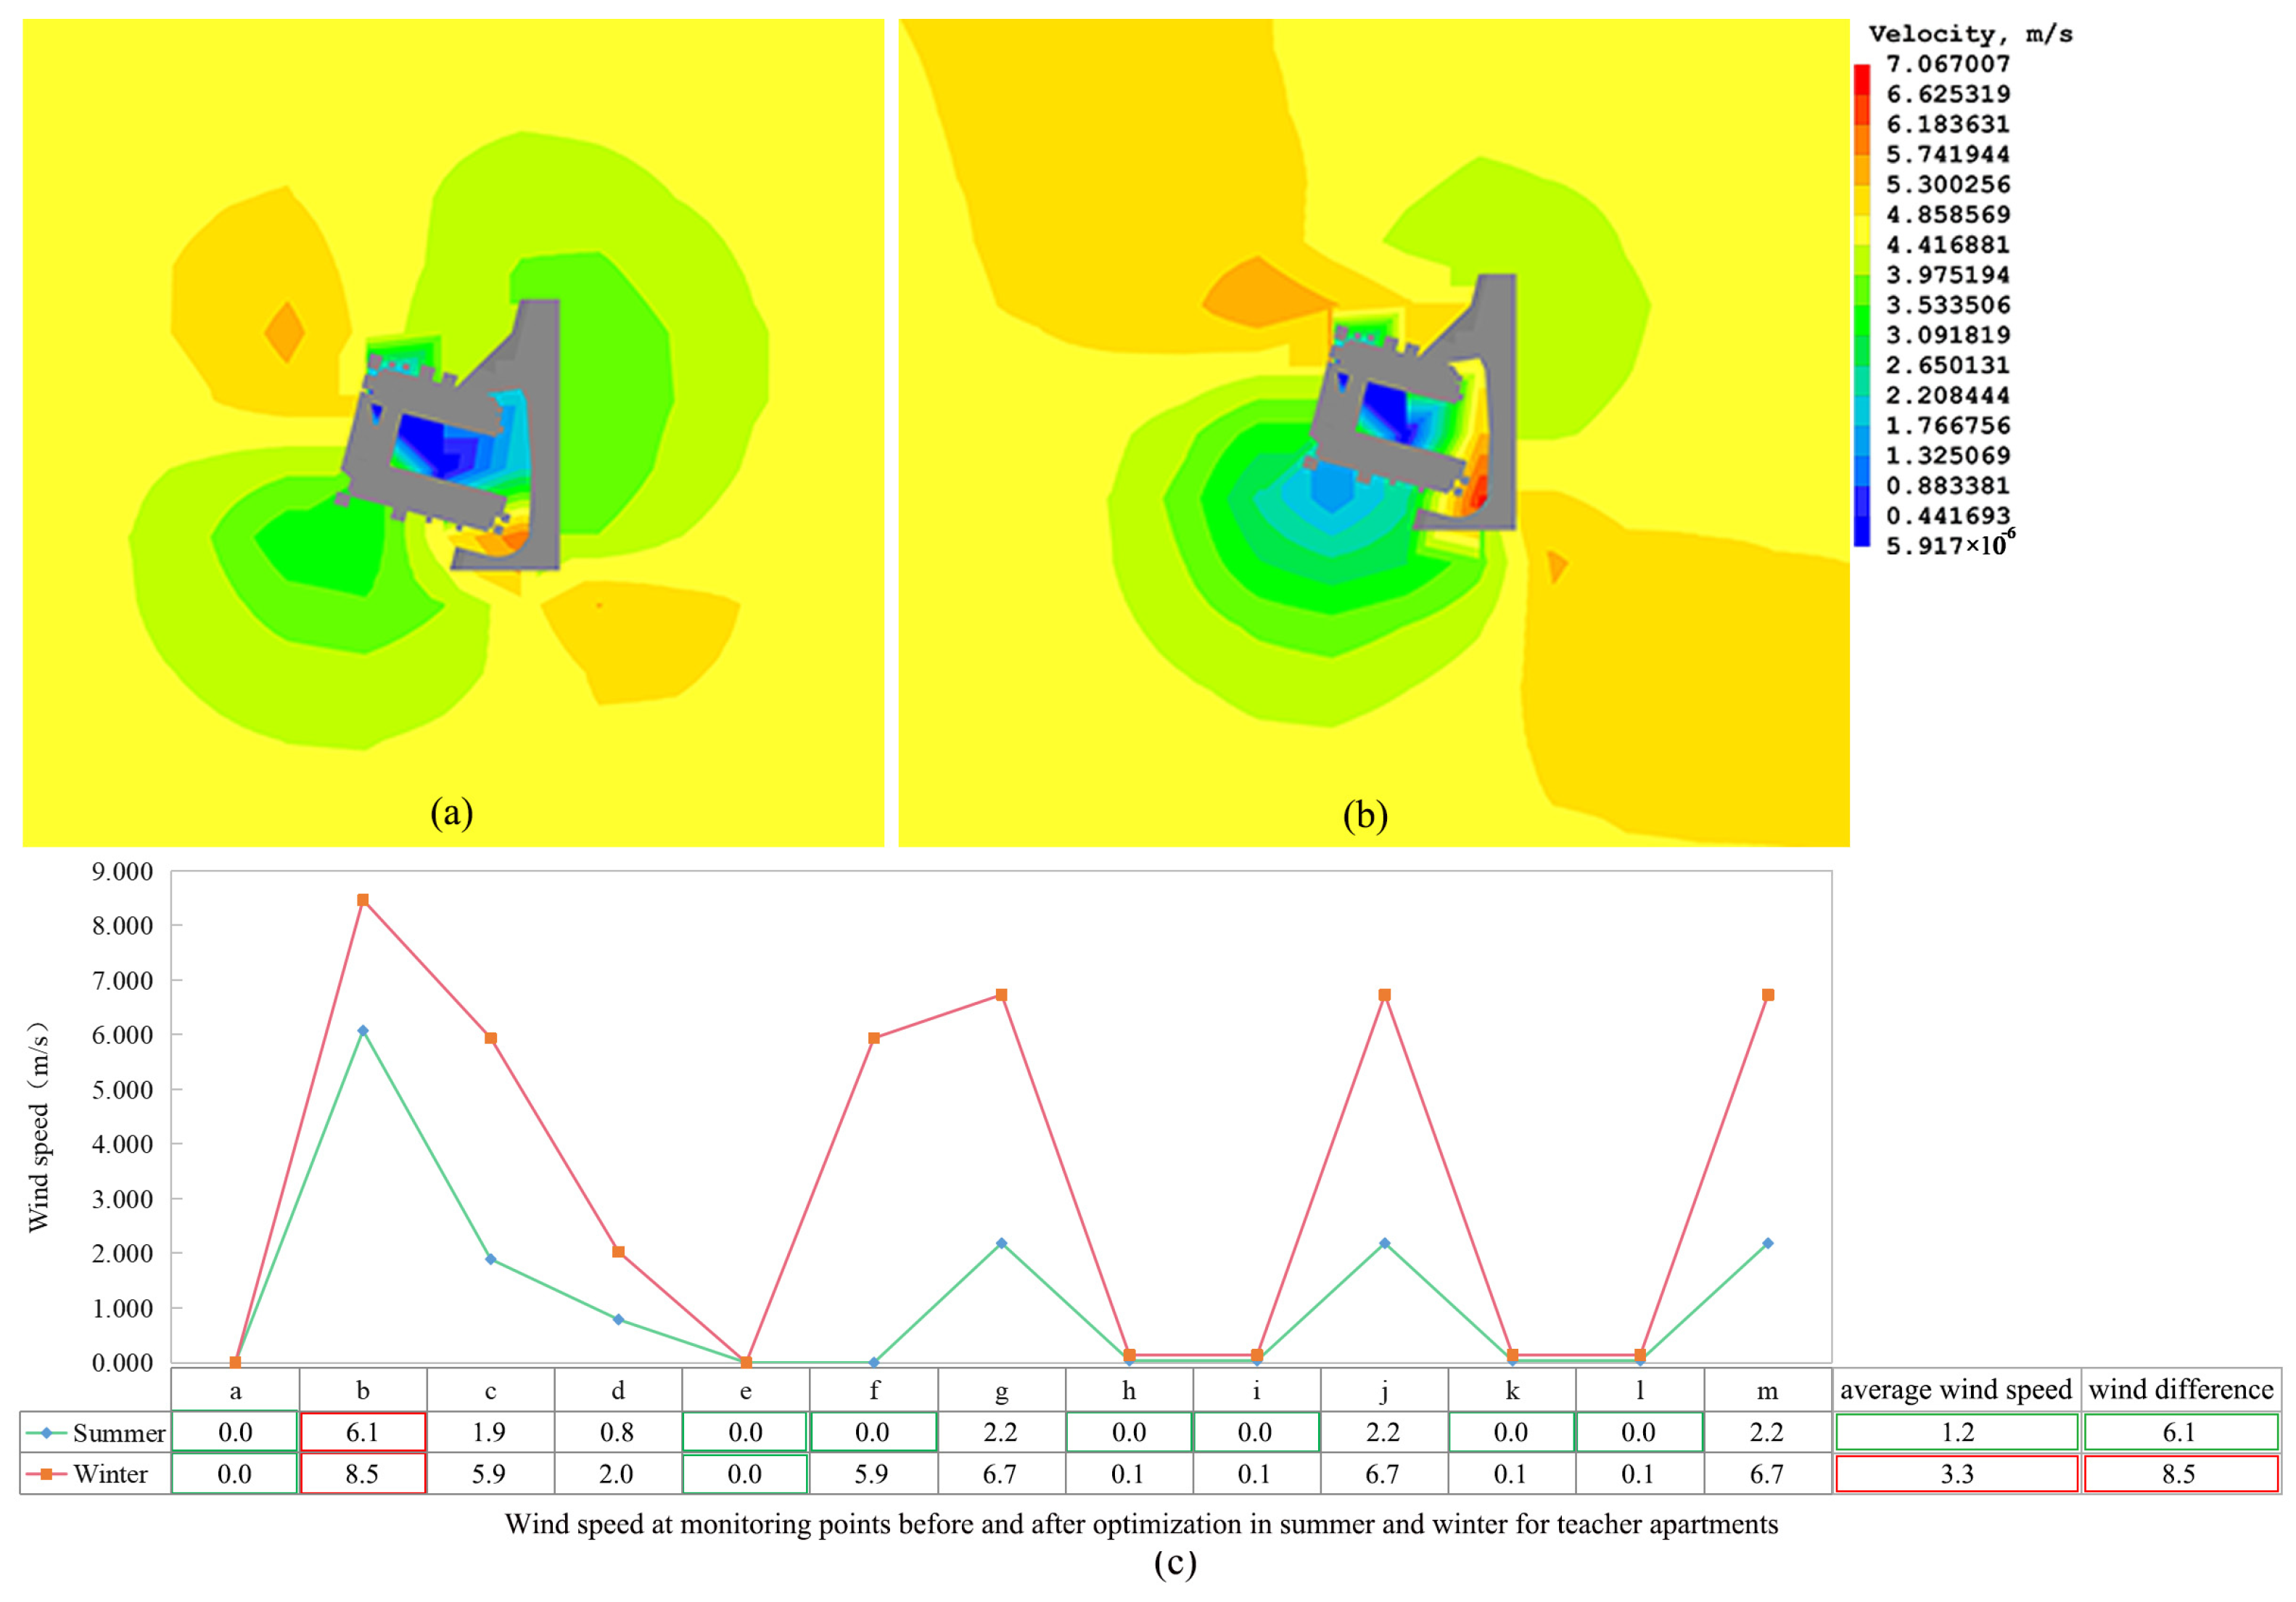
CFD was used to simulate the wind environment at the main gate square of the Donghai Campus of Quanzhou Normal University in order to clarify the horizontal flow field division in the outdoor area and determine the measurement points for the summer and winter wind conditions. Representative wind speed detection points were chosen according to the distinct flow patterns generated by natural winds during the summer and winter as they interact with the primary entrance square, individual building courtyards, and varied plant configurations: ① In terms of outdoor space, the main entrance square space in Zone A and the courtyard space of individual buildings in Zone E were selected, and 19 points most commonly involved in crowd activities in the square space (
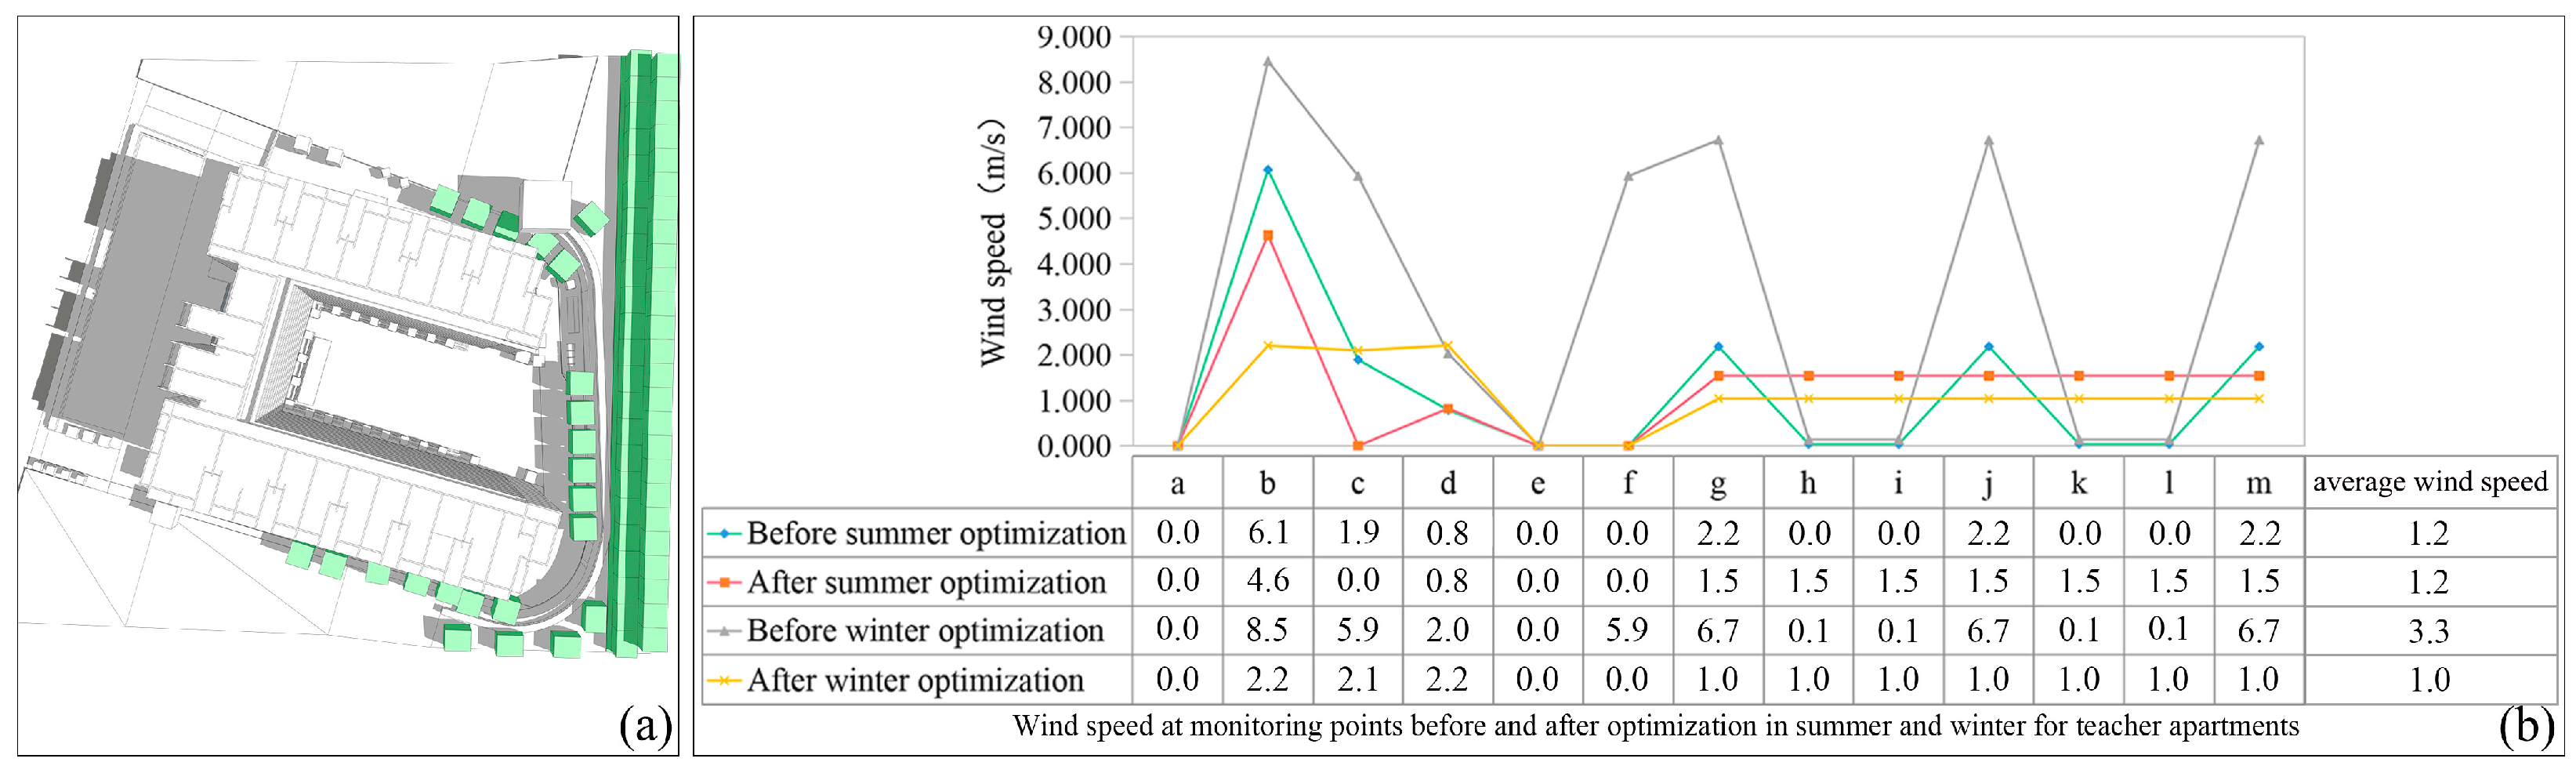
Figure 4a) and 13 points most commonly involved in crowd activities in the courtyard space (
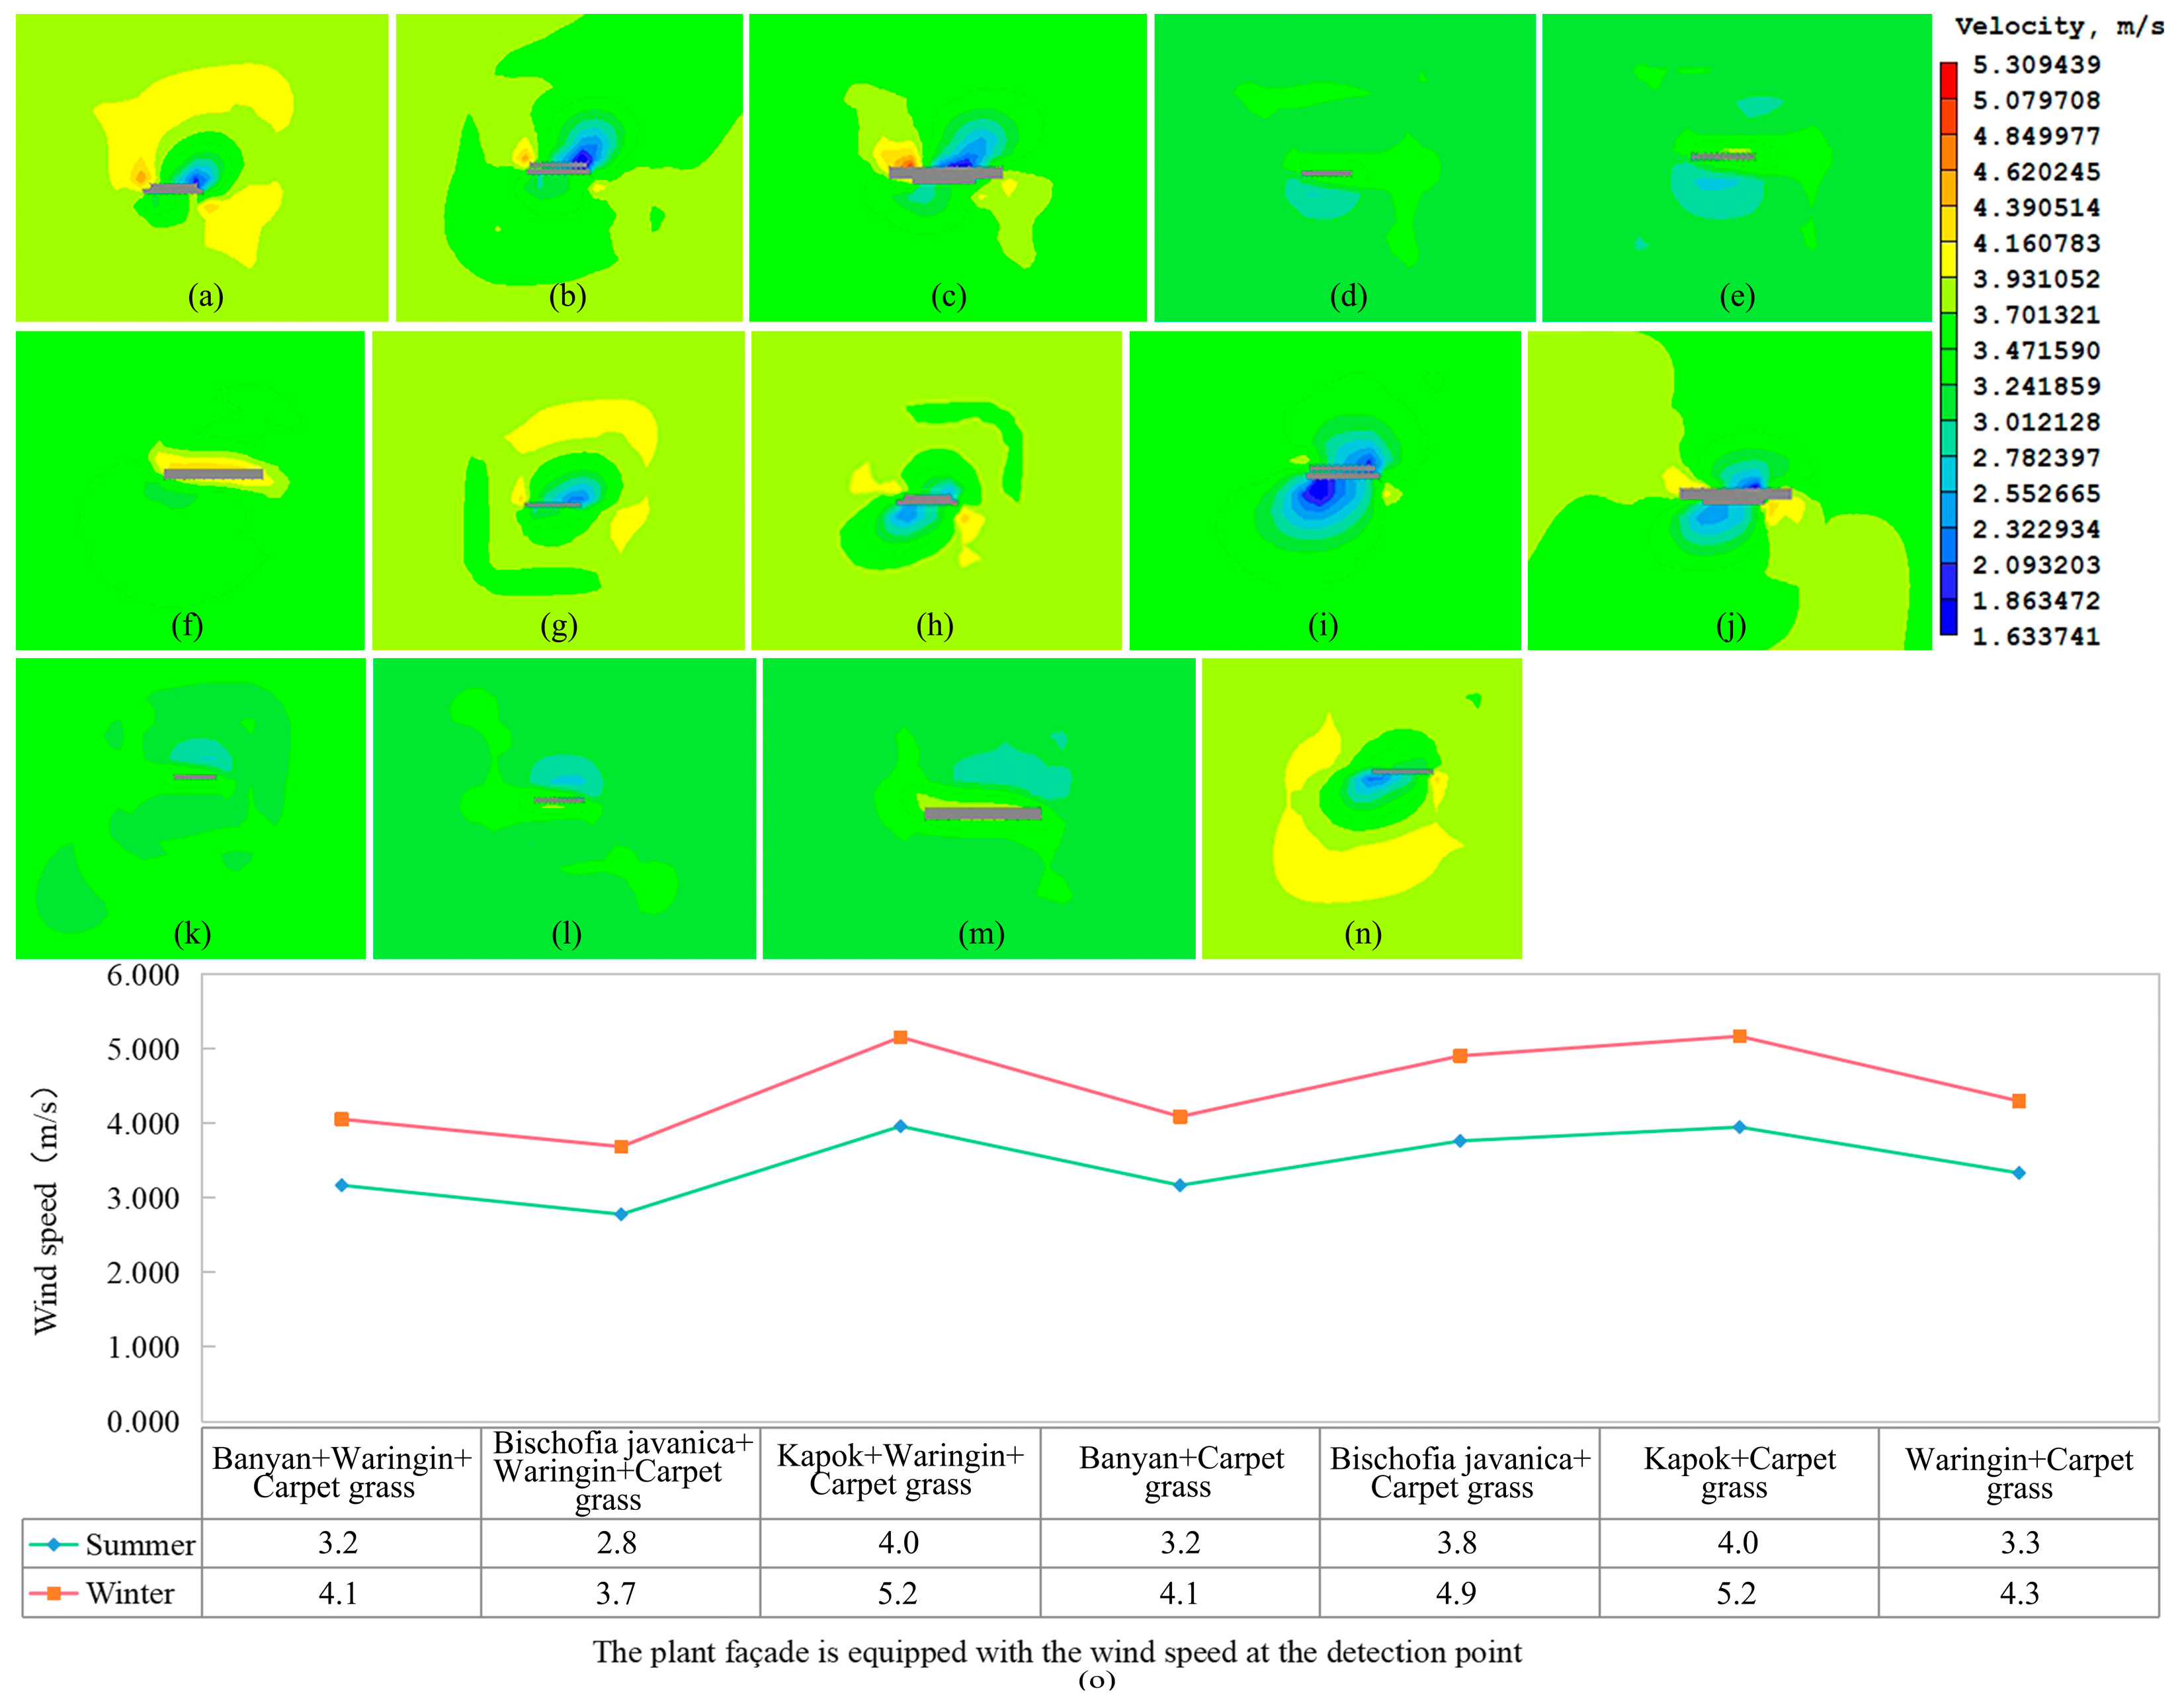
Figure 4b) were chosen; ② In terms of plant configuration, wind speed detection points were selected as the wind shadow area of plant configuration according to seasonal changes (Figure 4c–f) to explore the wind reduction efficiency of plants.
(2)
Onsite Experiment Method
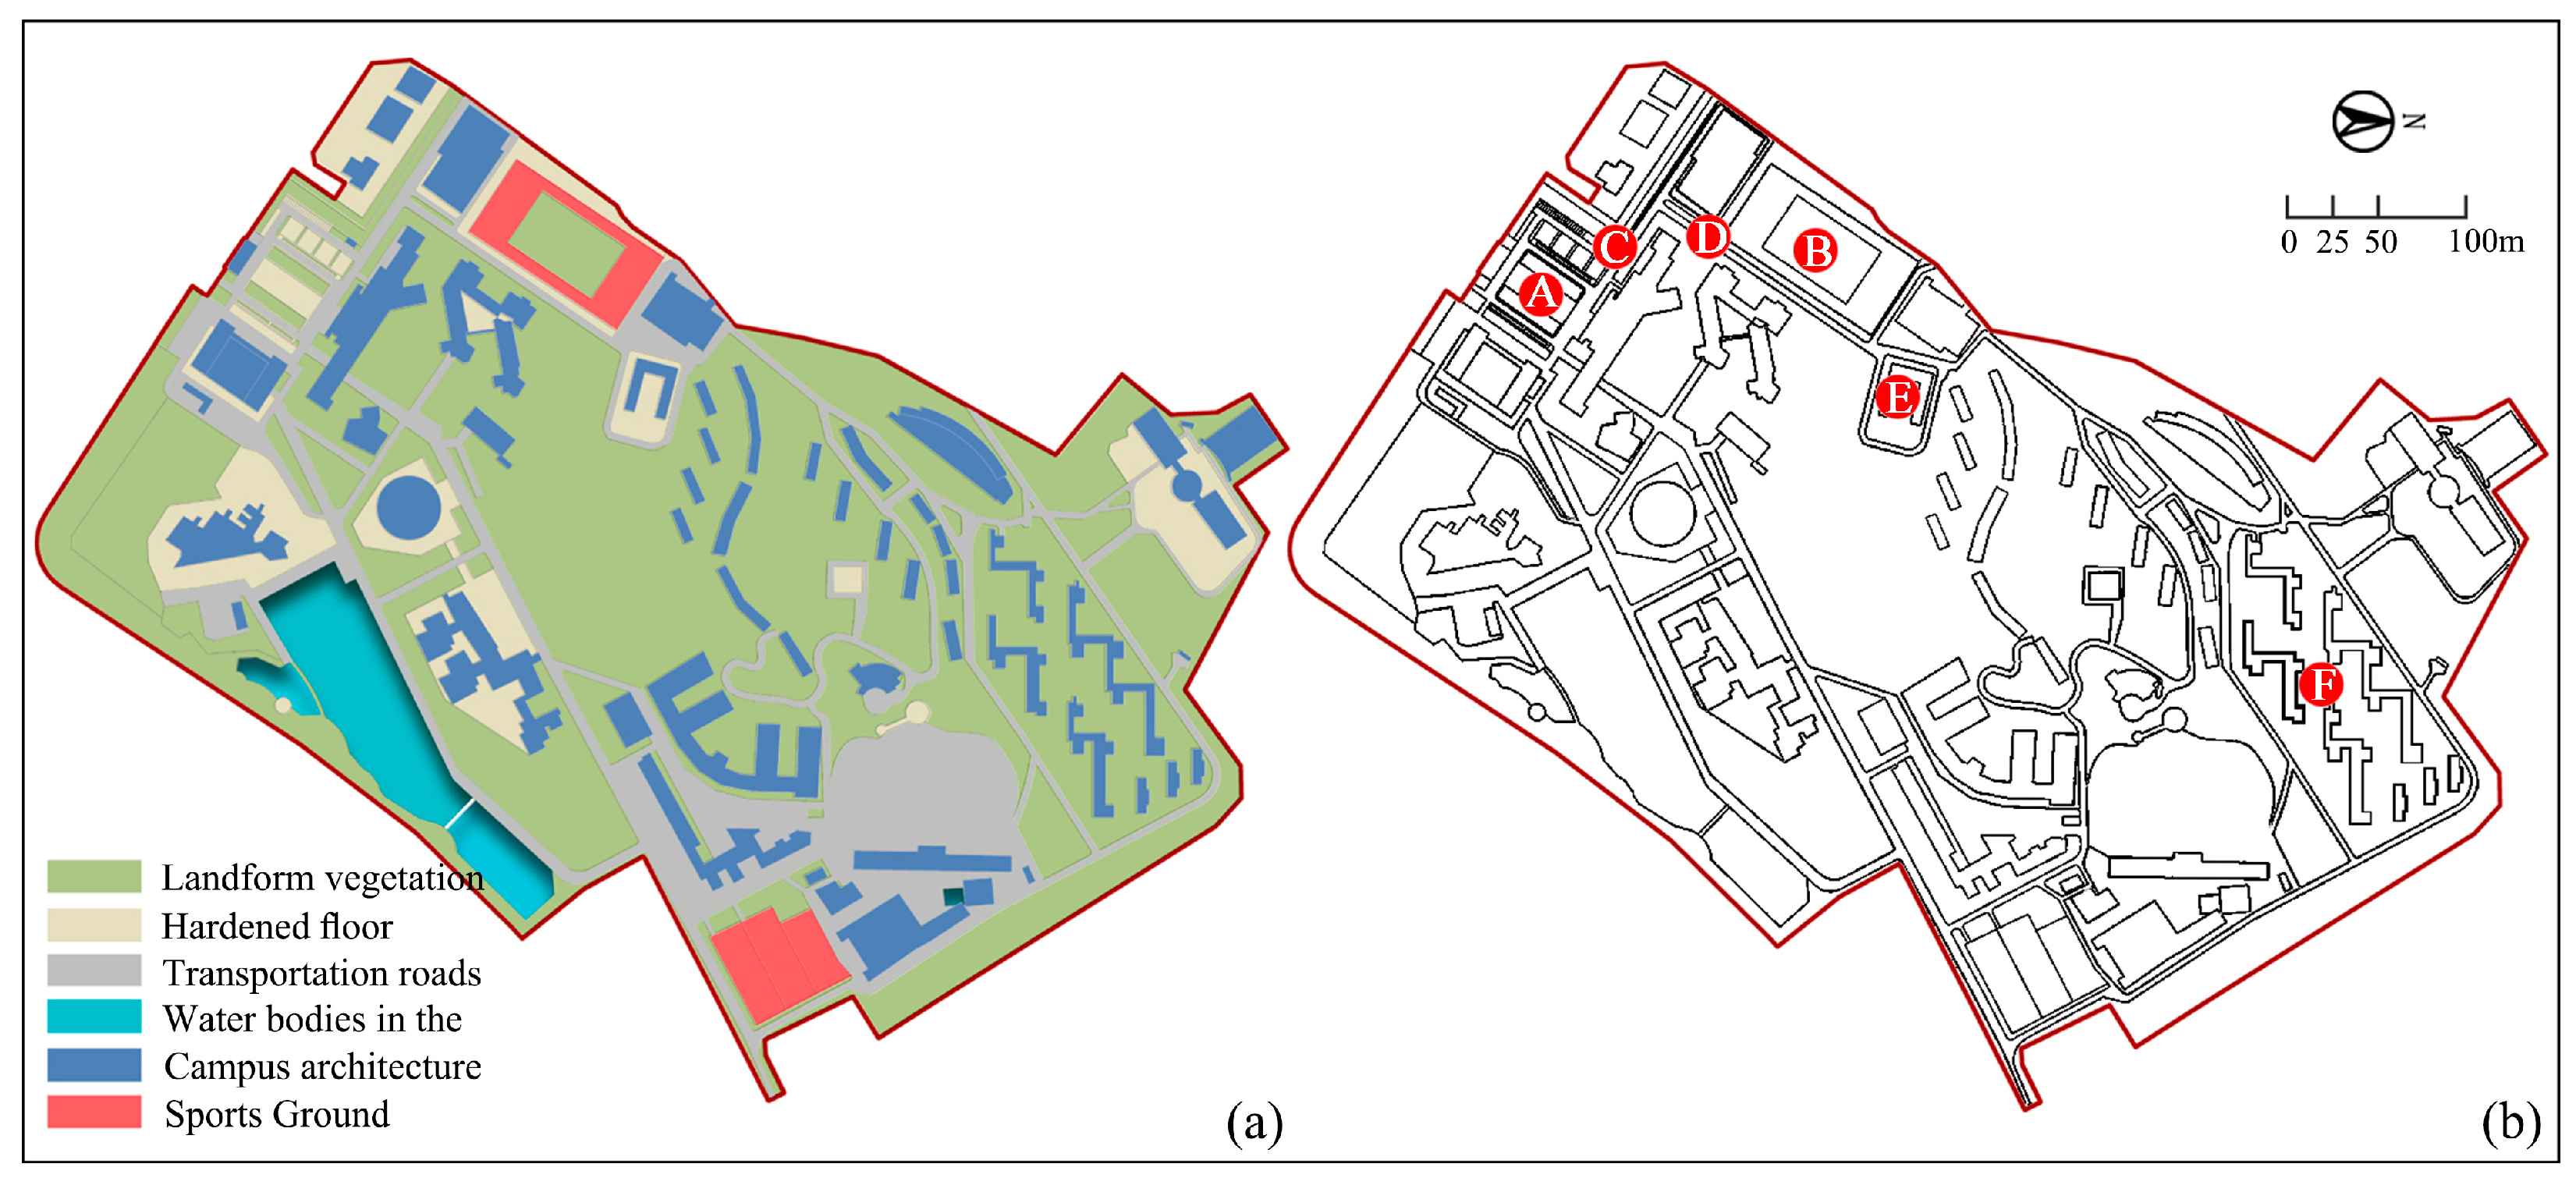
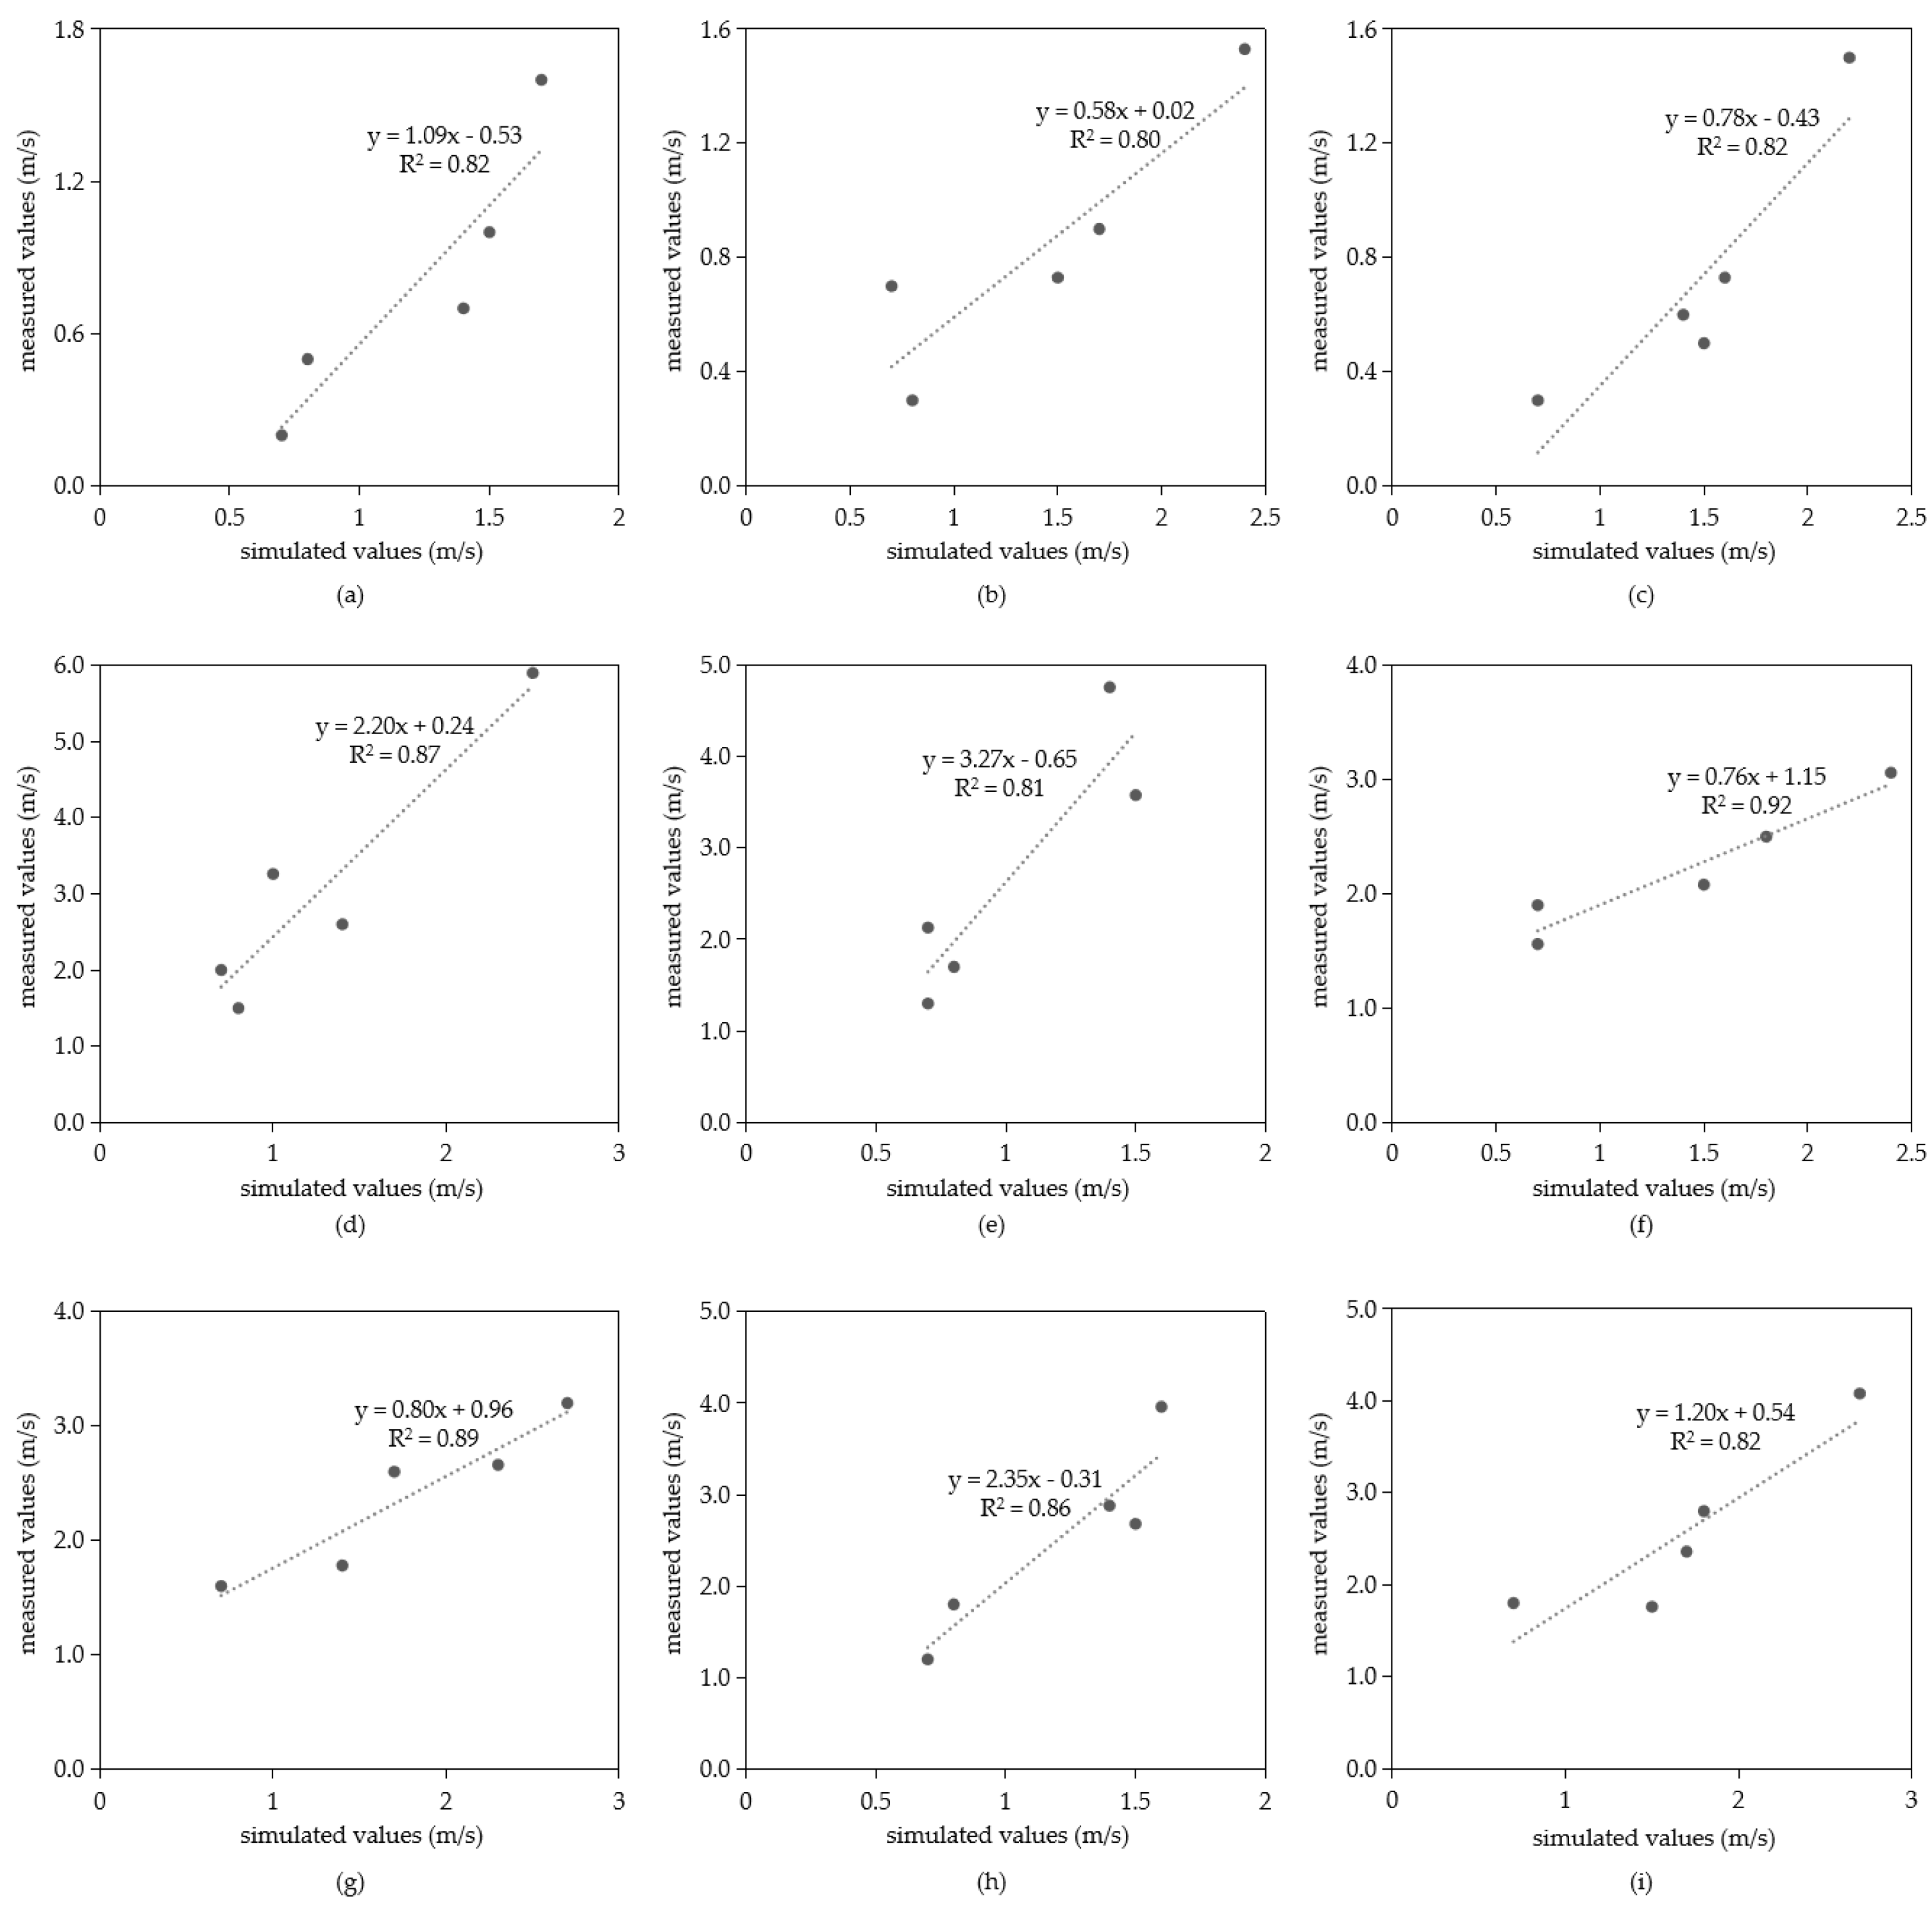
To validate the correlation between observed and modeled wind speeds, we conducted measurements of the outdoor wind conditions at the Donghai Campus of Quanzhou Normal University during sunny and partly cloudy summer days. From 9:00 a.m. to 5:00 p.m. on 30 September 2022, the NK 5500 LINK wind speed meteorological instrument was used, and multiple people were simultaneously positioned and observed to conduct fixed-point measurements in six measurement areas, identified as A, B, C, D, E, and F, on the campus. Firstly, a tripod-fixed anemometer was used for testing in each of the six measurement areas, positioning the inlet of the anemometer at a height of 1.5 m above the ground. Secondly, data was collected hourly, and the average wind speed within a one-minute timeframe of each measurement point was recorded for every data point (wind speed values were measured at minimum, average, and maximum levels every 10 s over the course of 1 min). During the hours of 9:00 a.m. to 5:00 p.m., 6 groups and 54 valid wind speed data points were obtained. Then, an evaluation was performed to compare and analyze the authentic wind conditions in different outdoor locations on campus, utilizing the measured data. The NK500LNK anemometer has a wind speed measurement standard range from 0.6 m/s to 40.0 m/s, featuring a resolution of 0.1 and an accuracy of ±3%.
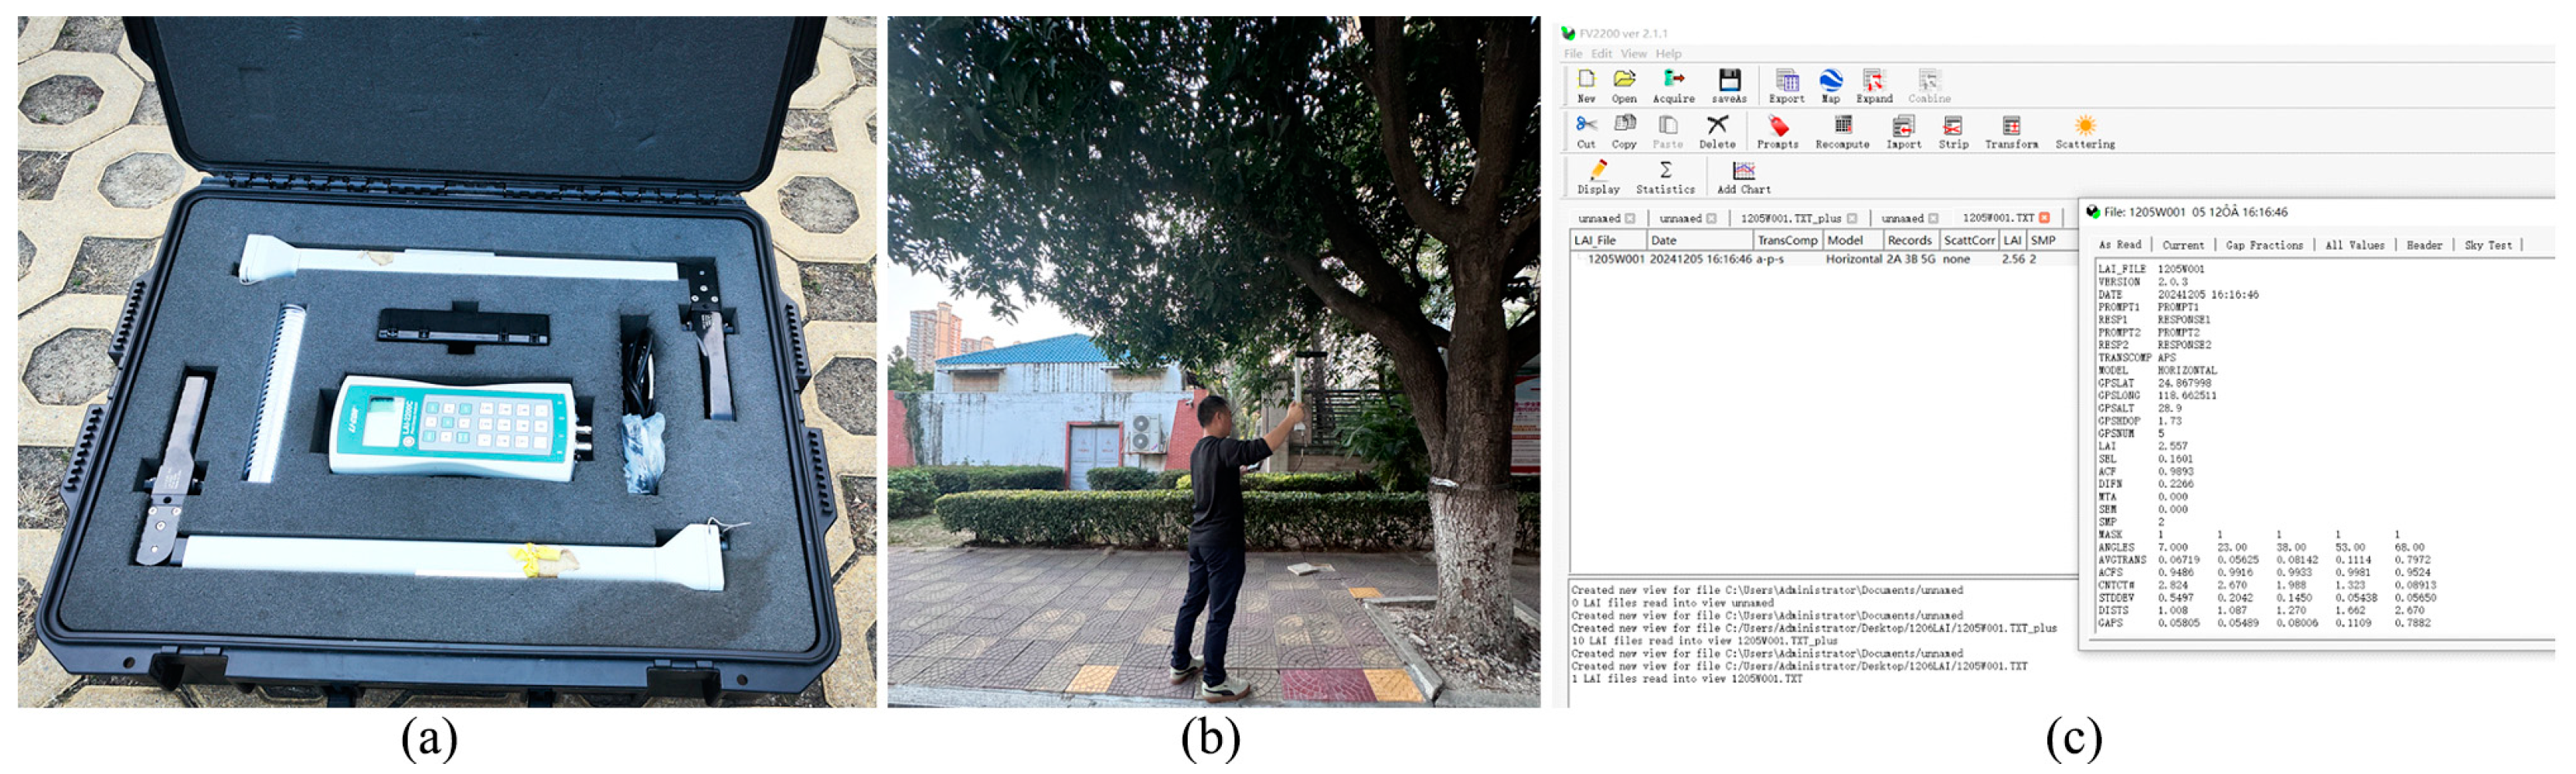
On 6 December 2024, leaf area index (LAI) measurements were conducted on typical plants in the main entrance square of the campus (Figure 5) using the LAI-2200C Plant Canopy Analyzer (LI-COR Biosciences, Lincoln, Nebraska, USA). Measurements were taken in four directions beneath the canopy of each plant to determine the corresponding leaf area index. Subsequently, the measured data from the analyzer was transferred to a computer for analysis using the FV2200 V 2.1.1 software to derive the LAI values for each plant.
(3)
3D Model Construction
Establishment of Plant Configuration Model: Through on-site investigation of the plants in the main entrance square, it was found that the plants are mainly divided into three categories: herbs, shrubs, and trees. Among them, the herbs include carpet grass, the shrubs include waringin and Aglaia odorata lour, and the trees include Erythrina indica, banyan, Bischofia javanica, mango trees, Chorisia speciosa, and kapok. Aerial surveys were conducted on the canopy height, width, and trunk height of various plants, and the leaf area index of different plants was measured using the LAI-2200C Plant Canopy Analyzer (Table 1). The research by Li et al. indicates that the rectangular model has advantages such as simple modeling, fast calculation, and good convergence [
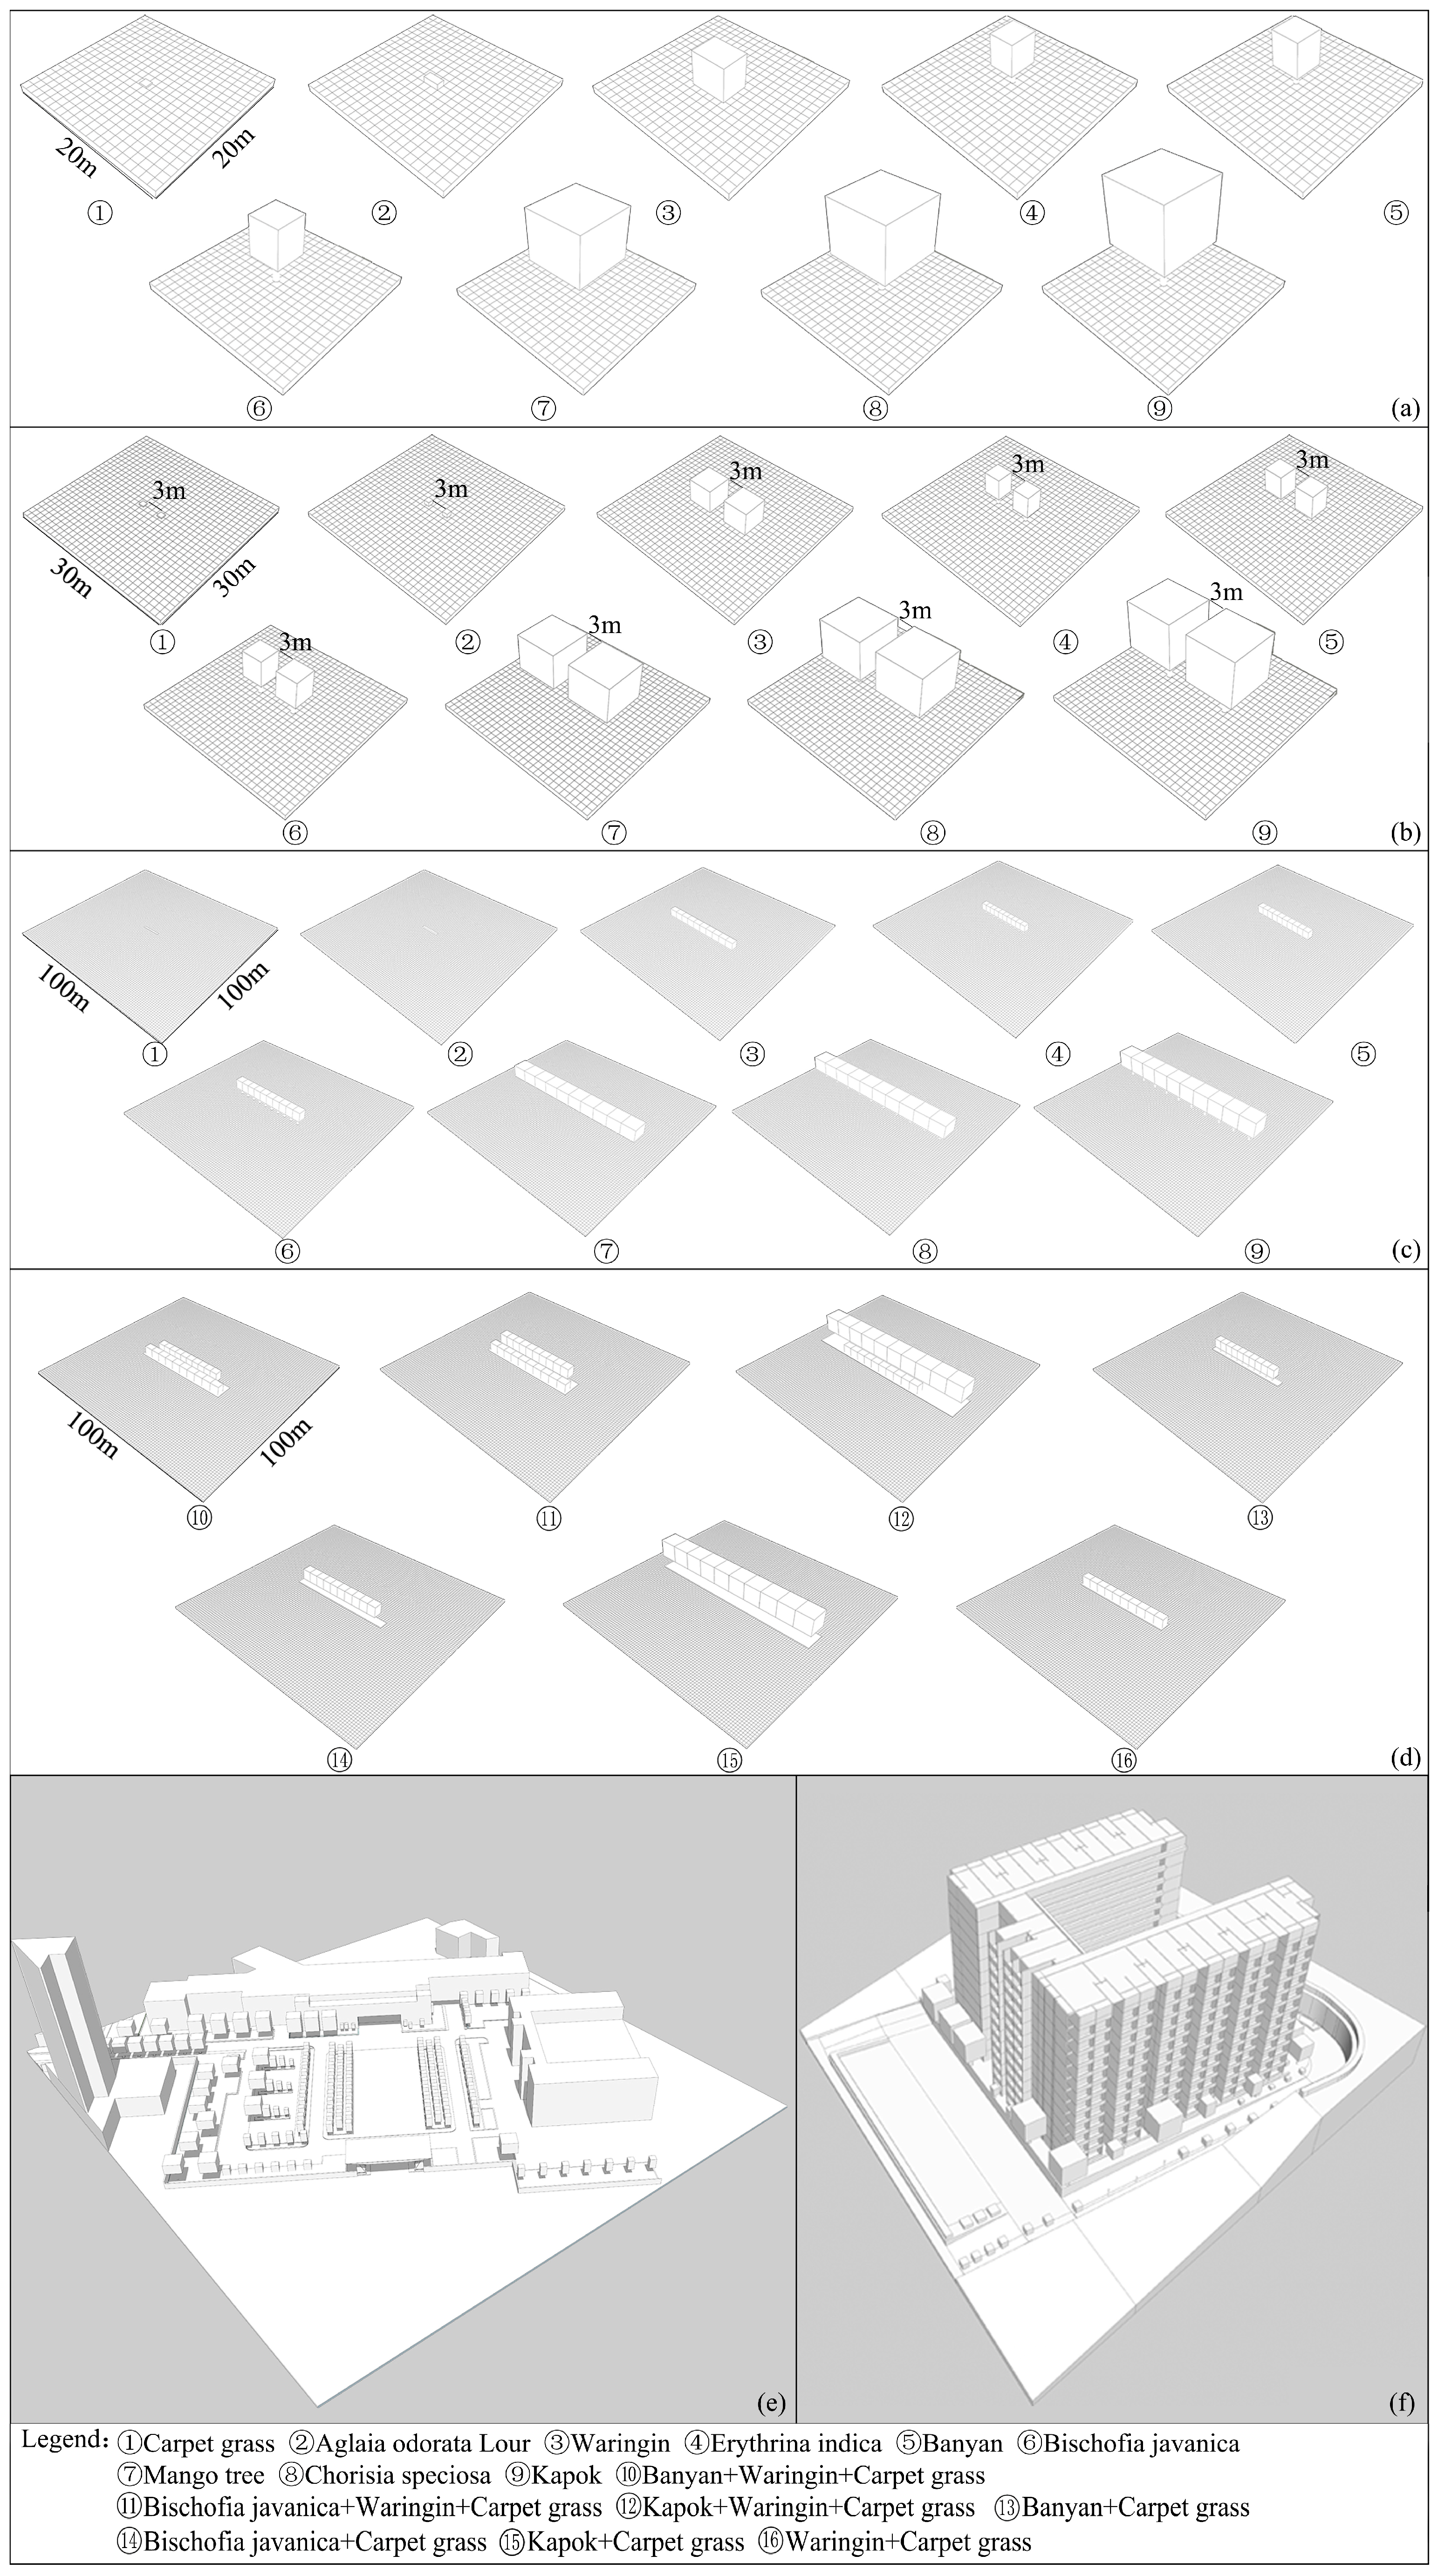
23]. Therefore, the simulation employed the technique of simplifying the rectangular model and utilized SketchUp v.2021 software to create a three-dimensional model for calculating the outdoor wind field for 34 plant configurations, categorized into planar and vertical configurations (refer to Table 2 and 
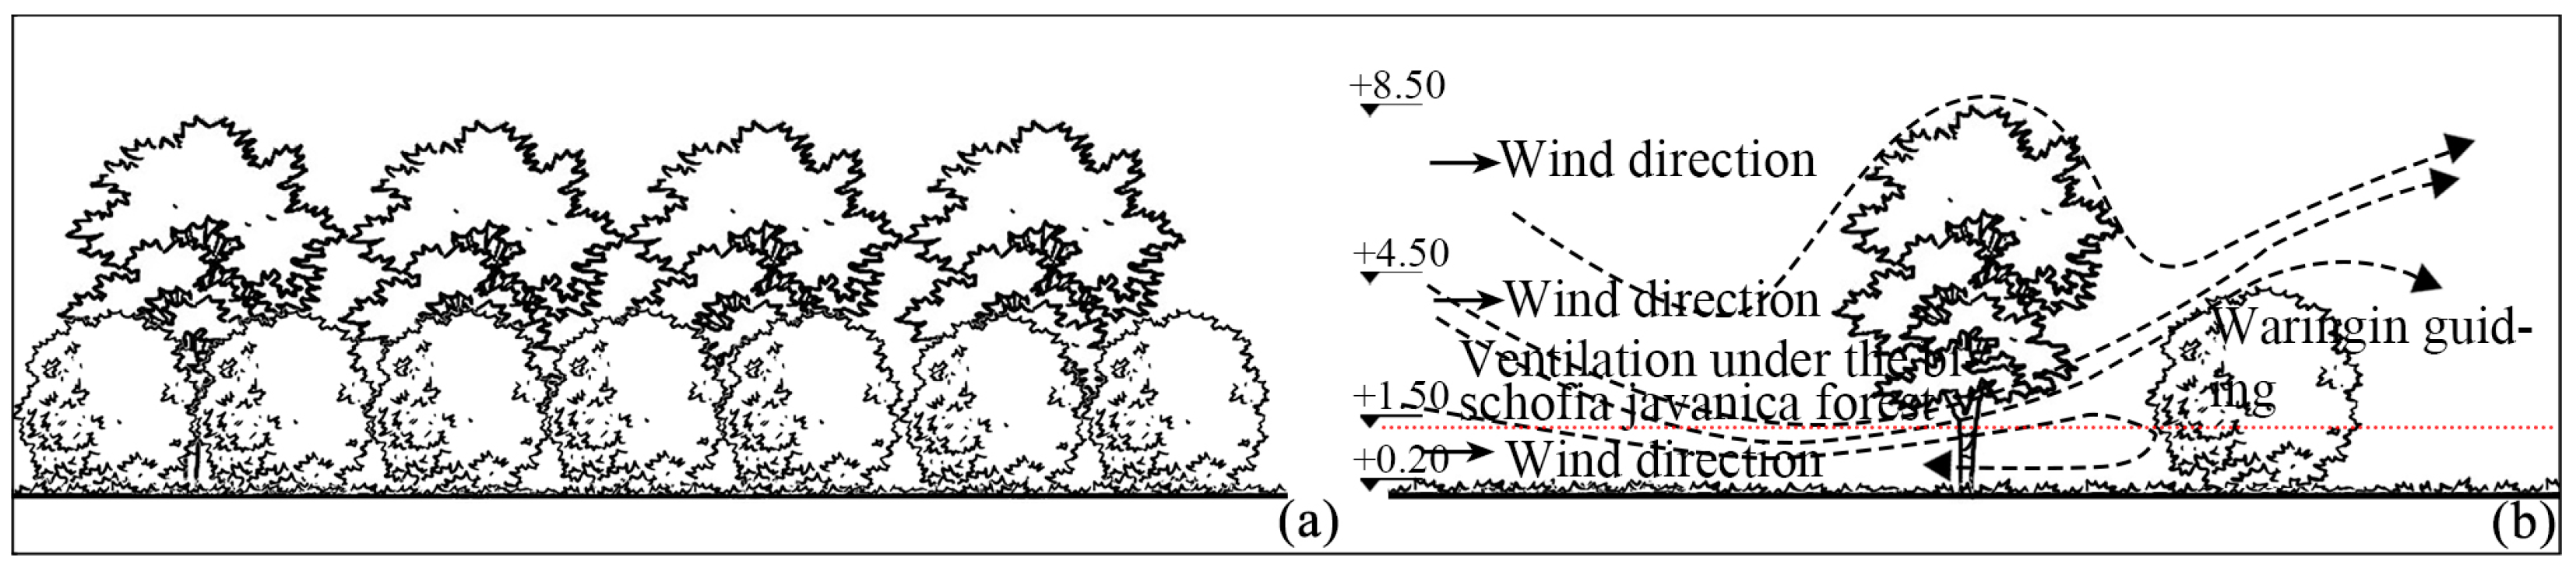
Figure 6a–d). In terms of the planar configuration, under opposite planting conditions, the crown spacing between two plants is 3 m. Under the row planting condition, it is set to single-row dense planting, with a crown spacing of 0 m, for a total of 10 trees. In terms of the facade configuration, select plants with better wind regulation efficiency when planting alone to further explore the facade configuration scheme of plants with better wind reduction efficiency. Through solitary planting experiments, it was found that the wind regulation efficiency of banyan, Bischofia javanica, and kapok was relatively good, while that of waringin in shrubs was relatively good. Therefore, the facade configuration scheme of trees + shrubs + grass includes three types: banyan + waringin + carpet grass, Bischofia javanica + waringin + carpet grass, and kapok + waringin + carpet grass. The facade configuration scheme of trees + grass includes three types: banyan + carpet grass, Bischofia javanica + carpet grass, and kapok + carpet grass. The facade configuration scheme of shrubs + grass only includes one type: waringin + carpet grass.
Establishment of an outdoor space model: Using the measured CAD v.2021 topographic map of the campus, create a three-dimensional model with SketchUp v.2021 software to simulate outdoor wind flow in the main square and courtyard spaces of a single building. Make necessary simplifications and rounding of the model details without impacting the calculation results (Table 2, Figure 6e,f).
Change the outdoor space and plant configuration models to STL format, and then import them into PHOENICS software for simulating the wind environment. Retrieve the simulation results for the wind environment at a pedestrian height of 1.5 m (Z = 1.5 m) above ground level.
(4)
CFD Simulation Settings
There are several software choices for carrying out CFD simulations, such as PHOENICS v.2016, ANSYS FLUENT v.2019, ENVI-met v.2021, Airpak v.2016, and Butterfly v.2018. PHOENICS, considered the original commercial software for fluid and heat transfer calculations, is increasingly favored by researchers for simulating wind conditions in different settings like residential areas, school campuses, and landscape gardens. Through the use of PHOENICS for CFD simulation, researchers have discovered that different height distribution patterns can influence alterations in both wind speed and pressure [24]. Making changes to the architectural layout can be a useful strategy for decreasing community energy consumption and carbon emissions [25]. The arrangement of courtyard plants has a significant effect on the outdoor microclimate, residential wind, and thermal comfort [26]. Changes in the arrangement and proportion of architectural spaces can create efficient ecological buffer zones [27]. ENVI-Met is primarily used for thermal comfort and has extensive experience and data backing in simulating urban microclimates. It offers precise simulation results for specific urban environments and climate conditions [28]. PHOENICS software, in contrast to ENVI-met software 4.0, is capable of modeling intricate three-dimensional fluid dynamics, encompassing turbulence and eddies, essential for the precise evaluation of wind conditions. By employing meticulous grid segmentation and sophisticated numerical techniques, PHOENICS can deliver detailed wind parameters, such as speed and direction, thus augmenting the assessment of wind comfort. Hence, the PHOENICS software is ideal for modeling wind conditions within the square area under investigation. The setup of the CFD simulation and the creation of the model will be outlined in the following section.
Model selection: In PHOENICS, the RNG k-ε turbulence model is employed, utilizing Equations (1) and (2) alongside the PRESTO discrete equation and the integrated PARSOL function settings for simulating velocity–pressure coupling. Implement small-scale network configurations in the core area to enhance calculation accuracy. The automatic convergence detection feature in PHOENICS ensures that simulation results converge reasonably with an accuracy level of 10−5 [29].
( ρ k ) t + ( ρ k u i ) x i = x j α k η e f f k x j + G k + ρ ε
( ρ ε ) t + ( ρ ε v i ) x i = x j α ε η f ε x j + C 1 s * ε k G k C 2 s ρ ε 2 k
The equations utilize the symbols k for turbulent kinetic energy and ε for turbulent dissipation rate, and are solved using the software PHOENICS v.2016.
Grid setting: The length and width of the calculation domain are five times larger than those of the corresponding scene model, and the height is three times greater than the model’s height (Figure 7) [30]. The calculation domain measures 5 W × 5 L × 3 H (Table 3 shows a comparative analysis of simulation data using various computational domain heights, indicating that the height of the computational domain has no impact on simulation outcomes). The computational domain grid is divided into two regions: the center and the edge, with specific grid densities assigned to each. The grid densities are as follows: coarse meshes, Xmin = Ymin = Zmin = 0.27 H; fine meshes, Xmin = Ymin = Zmin = 0.13 H; and finest meshes, Xmin = Ymin = Zmin = 0.06 H (Table 4 presents a comparative analysis of simulated data using various computational domain grid densities, showing that higher grid resolutions result in improved accuracy at the cost of longer simulation durations) [31]. Simulation accuracy is enhanced and the number of grid segments is decreased by the grid setting, which improves time efficiency. Using a fixed pressure and zero gradients, an outlet boundary condition was defined. The ground roughness parameter α, was set to 0.2.
The inflow profile at the top boundary had a constant horizontal velocity and turbulent kinetic energy, while the left and right symmetric boundaries were considered slip walls without gradients.
By utilizing Equation (3), it is possible to calculate the gradient of the oncoming wind at the inlet:
u ( z ) = u 0 ( z / z 0 ) α
where u(z) is the horizontal velocity at height z, and u0 is the horizontal velocity at height z0. In this model, u0 = 3.4/3.5 m/s (summer/winter), z0 = 108.4 m, and α = 0.25 [32].
The turbulent kinetic energy, k (m2/s2), and its dissipation rate, ε (m2/s3), are set as follows:
k = u 2 C μ 1 z δ
ε = u 3 k z 1 z δ
where u* is the friction velocity, δ is the depth of the boundary layer, and K is the von Karman’s constant. In this model, u* = 2.7/2.9 m/s (summer/winter), K = 0.4, and Cµ = 0.09 [30].
Trees in the model were parameterized as a one-dimensional column, where the normalized LAI was scaled to tree height [33]. Observing the non-uniform vertical distribution of LAI allows for easy identification of different types of vegetation, as LAI changes depending on height, influenced by crown shape, height, and canopy edges [34]. When it comes to turbulence models, tree crowns are seen as porous media, with individual tree branches being compared to the crown [35]. The tree canopy causes a reduction in the kinematic energy of airflow due to drag and pressure, leading to utilization of resistance in the momentum equation to model the impact of vegetation on turbulent flow patterns. The momentum equation includes a sink term to factor in turbulence resistance caused by the canopy layer as follows:
S d , i = C d × L A D × U × U i
where Cd is the drag coefficient, U is the vector speed on foliage surface (m/s), and U i is the Cartesian velocity in i direction (m/s).
Additional source terms in the momentum equation can demonstrate the correlation between airflow and tree canopy turbulence as follows:
S k = C d × L A D × β P U 3 β d U k
S k = C d × L A D × C 4 ε β P U 3 ε k C 5 ε β d U ε
In this investigation, βp, βd, C4ε, and C5ε are empirical constants with values of 1.0, 3.0, 1.5, and 1.5, respectively. βp denotes the average fluid kinetic energy of the wake flow, k, produced by the drag force of the canopy; whereas βd indicates the kinetic energy, k, dissipated by the short circuits of Kolmogorov energy gradients [36,37,38,39].
Wind conditions setting: As per the “Design Code for Heating, Ventilation and Air Conditioning of Civil Buildings” (GB507360-2012, China), “China Weather Network”, “China Meteorological Network”, and “China Meteorological Data Network”, Quanzhou experiences an average wind speed of 4.7 m/s and an average air temperature of 27.8 °C during the summer, with a relative humidity of 85% and a mean radiant temperature of 31 °C. The prevailing wind direction is southwest. In the winter, the average wind speed increases to 6.13 m/s, while the average air temperature drops to 14.6 °C. The average relative humidity is 75% and the mean radiant temperature is 17.8 °C, with the prevailing wind direction shifting to the northeast. The seasonal dominant wind direction refers to the range of wind direction angles with the highest wind frequency within a specific season. The dominant wind direction in Quanzhou is southwest in the summer and northeast in the winter. These values are used as inflow boundary conditions for 2000 iterations.

3. Results and Discussion

3.1. Comparative Analysis of Measured and Simulated Values

On 30 September 2022, between 9:00 a.m. and 5:00 p.m., we employed an anemometer to conduct on-site measurements of the main square at the Donghai Campus of Quanzhou Normal University, followed by numerical simulations using CFD. In the CFD simulation procedure, the inflow velocity was determined by the average wind speeds per hour (0.9 m/s, 1.0 m/s, 0.8 m/s, 3.2 m/s, 2.9 m/s, 2.4 m/s, 2.6 m/s, 2.7 m/s, and 2.7 m/s) observed from 9:00 am to 5:00 pm. After completing nine simulation experiments, detection points (b, e, h, m, p) were positioned at the main entrance square of the wind farm to gauge the average wind speed at each designated point. Comparing the simulated wind field data of each detection point at the main entrance plaza for nine time periods with the corresponding measurement data, Figure 8 displays high R2 values for each time period, all surpassing 0.80. This suggests that more than 80% of the observed wind speed changes can be elucidated by the simulated wind speed. The linear regression equations derived are as follows: y = 1.09x − 0.53, y = 0.58x + 0.02, y = 0.78x − 0.43, y = 2.20x + 0.24, y = 3.27x − 0.65, y = 0.76x + 1.15, y = 0.80x + 0.96, y = 2.35x − 0.31, and y = 1.20x + 0.54. The analysis in Table 5 reveals that all p-values for each time period were below 0.05, indicating significant linear regression features. The score deviation range is [−0.9, 0.7] and the mean square error ranges from 0.61 to 0.31, suggesting a small deviation between simulated and observed values. The prediction error of CFD simulation values is relatively low, signifying the suitability of PHOENICS software for simulating outdoor wind environments. Furthermore, this aids in validating the effectiveness of CFD simulation data in assessing outdoor campus areas.

3.2. The Simulation Results of Whether There Are Plants in the Main Entrance Square and the Wind Environment Simulation Results of the Young Teacher’s Apartment

Import the models of the main entrance square, whether with or without trees, and the individual building (such as the Youth Teacher Apartment) into the PHOENICS software to conduct wind environment simulations. Acquire data on wind speeds during the summer and winter for each model at a height of 1.5 m (Z = 1.5 m) above the ground for pedestrians (Figure 9 and Figure 10). Through data analysis, the following results have been obtained.
In Figure 9, the wind speeds in the main square during the summer without trees range from 2.9 m/s to 4.6 m/s. The average wind speed is 4.4 m/s, with a difference of 1.7 m/s. With trees present, the wind speeds in the summer range from 2.7 m/s to 3.4 m/s. The average wind speed is 2.9 m/s, showing a difference of 0.7 m/s. In the winter, the wind speeds without trees range from 3.8 m/s to 5.8 m/s. The average wind speed is 5.6 m/s, with a difference of 2.0 m/s. With trees in the winter, the wind speeds range from 2.9 m/s to 3.5 m/s. The average wind speed is 3.0 m/s, with a difference of 0.6 m/s. The presence of trees in the main square leads to better wind comfort in both the summer and winter, as opposed to when there are no trees. This suggests that vegetation has the ability to block strong winds, lower wind speeds, and enhance wind speeds in localized areas.
Based on Figure 10, at the Youth Teacher Apartment, the wind speeds vary between 0–6.1 m/s in the summer and 0–8.5 m/s in the winter. The average wind speed in the summer is 1.2 m/s, and in the winter is 3.3 m/s, showing a difference of 6.1 m/s in the summer and 8.5 m/s in the winter. In the summer, there are 8 instances of uncomfortable wind speeds, compared to 12 in the winter. Consequently, it can be concluded that the winter wind speed performance at the Youth Teacher Apartment is the most unfavorable. With minimal large tree coverage, the Youth Teacher Apartment’s outdoor space is characterized by consistently high wind speeds in the summer and winter, interspersed with some tranquil spots. As a result, the area is only conducive to brief periods of use or simple exercises.

3.3. The Influence of Plant Configuration on the Wind Environment

The impact of different plant configurations on the wind environment in the square was investigated using PHOENICS software for CFD simulations on flat configurations (solitary planting, opposite planting, row planting) and facade configurations (tree + shrub + grass, tree + grass, shrub + grass), and to obtain wind speed data at a height of 1.5 m (Z = 1.5 m) above the ground for each pedestrian model. Through data analysis, the following results have been obtained.

3.3.1. The Influence of Plant Plane Configuration on Wind Environment

(1)
Solitary Planting
As depicted in Figure 11, with regards to wind speed, among tree species, and under the same conditions where only the height of the trunk remains the same, the overall wind speed in the summer is around 4.0 m/s, and in the winter wind speeds range from 5.1 m/s to 5.2 m/s. Compared to Erythrina indica, the banyan performs better. Under the same conditions, where only the height and width of the trunk change, the overall wind speeds with Bischofia javanica and mango trees in the summer range from 3.7 m/s to 4.5 m/s, and in the winter wind speeds range from 4.8 m/s to 4.9 m/s. Bischofia javanica performs better. Under the same conditions and maintaining a consistent tree trunk width, the overall wind speed in the summer is around 4.6 m/s, and in the winter it is around 5.0 m/s. Compared with kapok, Chorisia speciosa performs better. Among shrubs, the overall wind speeds in the summer range from 3.8 m/s to 4.0 m/s, and in the winter wind speeds range from 5.0 m/s to 5.2 m/s. The impact of solitary Aglaia odorata lour and waringin on wind speeds is not significantly different. The wind speed with carpet grass is 3.8 m/s in the summer and 4.9 m/s in the winter. Overall, the wind speed of Bischofia javanica is the best, followed by carpet grass, and the performance of Erythrina indica is the worst. Considering the reality of strong winds in Quanzhou, when the trees are too high, there may be a phenomenon of lodging or drying due to being heavy on the head and light on the feet. Therefore, it is more appropriate to limit the height of the trees. Among them, trees with a height of 6.5–8.5 m are more suitable, and Bischofia javanica is the most suitable.
When it comes to wind regulation amplitude, Table 6 displays the wind regulation amplitudes of various plant varieties under specific conditions. In the summer, the wind regulation amplitudes for plant species such as Erythrina indica, banyan, Bischofia javanica, mango trees, Chorisia speciosa, kapok, Aglaia odorata lour, waringin, and carpet grass are 14.89%, 14.89%, 21.28%, 4.26%, 2.13%, 2.13%, 19.15%, 14.89%, and 19.15%, respectively. With a wind regulation amplitude 1.43 times higher than that of Erythrina indica, Bischofia javanica demonstrates the greatest ability to withstand wind, while Chorisia speciosa and kapok shows the lowest (0.14 times that of Erythrina indica). In the winter, the wind regulation amplitudes for the same plant varieties are 15.17%, 16.80%, 21.70%, 20.07%, 18.43%, 18.43%, 18.43%, 15.17%, and 20.07%, respectively. Bischofia javanica demonstrates the highest wind regulation amplitude (1.43 times that of Erythrina indica), while Erythrina indica and waringin has the lowest wind regulation amplitude (1.0 times).
(2)
Opposite Planting
As depicted in Figure 12, when it comes to wind speed, under the same conditions, with only the same height of the trunk, the overall wind speeds in the summer are between 3.8 m/s and 3.9 m/s, and in the winter wind speeds are between 4.9 m/s and 5.0 m/s. The wind speeds with Erythrina indica and banyan are similar, with no significant changes. Under the same conditions, where only the height and width of the trunk change, the overall wind speeds in the summer range from 3.9 m/s to 4.2 m/s, and in the winter, wind speeds vary between 4.5 m/s and 5.0 m/s. The performance of Bischofia javanica and mango trees is similar. Under the same conditions, with only the same trunk width, the overall wind speeds in the summer range from 4.1 m/s to 4.2 m/s, and in the winter wind speeds range from 5.4 m/s to 5.5 m/s. Compared to the kapok, the Chorisia speciosa performs better. Among shrubs, the overall wind speeds in the summer range from 2.7 m/s to 3.8 m/s, and in the winter wind speeds range from 3.4 m/s to 5.0 m/s. Compared to Aglaia odorata lour, waringin performs better. Among herbs, the wind speed of carpet grass in the summer is 3.8 m/s, while in the winter it is 4.9 m/s. Overall, the wind speed performance of the waringin is the best, followed by Bischofia javanica, and the kapok performs the worst.
When it comes to wind regulation amplitude, according to Table 7, when considering only changes in plant varieties under consistent conditions, the wind regulation amplitudes in the summer are as follows: Erythrina indica (19.15%), banyan (17.02%), Bischofia javanica (17.02%), mango trees (10.64%), Chorisia speciosa (12.77%), kapok (10.64%), Aglaia odorata lour (19.15%), waringin (42.55%), and carpet grass (19.15%). Among these, waringin exhibits the highest wind regulation amplitude (2.22 times that of Erythrina indica), while mango trees and kapok show the lowest (0.56 times that of Erythrina indica). In the winter, the wind regulation amplitudes for the same plant varieties are 20.07%, 18.43%, 26.59%, 18.43%, 11.91%, 10.28%, 18.43%, 44.54%, and 20.07%, respectively. Waringin demonstrates the highest wind regulation amplitude (2.22 times that of Erythrina indica), while kapok has the lowest wind regulation amplitude (0.51 times that of Erythrina indica).
(3)
Row Planting
As depicted in Figure 13, in relation to wind speeds, under the same conditions, with only the same height of the tree trunk, the overall wind speeds in the summer range from 3.2 m/s to 3.5 m/s, while in the winter wind speeds range from 4.1 m/s to 4.5 m/s. Compared to Erythrina indica, the banyan performs better. Under the same conditions, where only the height and width of the trunk change, the overall wind speeds in the summer range from 3.8 m/s to 4.0 m/s, while in the winter wind speeds vary from 4.9 m/s to 5.2 m/s. Compared to the mango trees, Bischofia javanica performs better. Under the same conditions, with only the same trunk width, the overall wind speeds in the summer range from 3.9 m/s to 4.1 m/s, and in the winter wind speeds range from 5.2 m/s to 5.4 m/s. Compared to Chorisia speciosa, kapok performs better. Among shrubs, the overall wind speeds in the summer range from 3.3 m/s to 3.9 m/s, and in the winter wind speeds range from 4.3 m/s to 5.1 m/s. Compared to Aglaia odorata lour, waringin performs better. While the overall wind speed with carpet grass is 3.8 m/s in the summer, wind speed increases to 4.9 m/s in the winter. Overall, the banyan performs the best in terms of wind speeds, followed by waringin, and Chorisia speciosa performs the worst.
When it comes to wind regulation amplitude, Table 8 displays the wind regulation amplitudes of various plant varieties under specified conditions, focusing solely on changes. In the summer, plant varieties such as Erythrina indica, banyan, Bischofia javanica, mango trees, Chorisia speciosa, kapok, Aglaia odorata lour, waringin, and carpet grass exhibit amplitudes of 25.53%, 31.91%, 19.15%, 14.89%, 12.77%, 17.02%, 17.02%, 29.79%, and 19.15%, respectively. Banyan demonstrates the highest wind regulation amplitude (1.25 times that of Erythrina indica), while Chorisia speciosa shows the lowest (0.50 times the amplitude of Erythrina indica). In the winter, the wind regulation amplitudes for the same plant varieties are 26.59%, 33.12%, 20.07%, 15.17%, 11.19%, 15.17%, 16.80%, 29.85%, and 20.07%, respectively. Banyan maintains the highest wind regulation amplitude (1.25 times that of Erythrina indica), whereas Chorisia speciosa exhibits the lowest (0.45 times the amplitude of Erythrina indica).
In both the summer and winter seasons, under the same conditions and having the same trunk height, banyan performs better in regulating wind speeds. When both height and width change, compared to mango trees, Bischofia javanica has a better wind regulating effect. Under the same conditions and having the same width, it can be seen that kapok has a better wind regulating effect compared to Chorisia speciosa. Among the two shrubs, Aglaia odorata lour and waringin have a higher range of wind regulation compared to waringin. Among herbs, carpet grass has a relatively stable range of wind regulation.

3.3.2. The Impact of Plant Facade Configuration on Wind Environment

The plant facade configuration includes three types: tree + shrub + grass, tree + grass, and shrub + grass. As can be seen from the previous text, the banyan, Bischofia javanica, and kapok, in the tree category, and waringin, in the shrub category, are the species with better wind speed reduction effects, while the herb species is carpet grass. This is combined into seven plant facade configuration model groups (Figure 6d), namely tree + shrub + grass: banyan + waringin + grass, Bischofia javanica + waringin + grass, kapok + waringin + grass; tree + grass: banyan + grass, Bischofia javanica + grass, kapok + grass; shrub + grass: waringin + grass. Then, they are imported separately into PHOENICS software for wind environment simulation, the models are analyzed separately to obtain wind speed data for each pedestrian at a height of 1.5 m (Z = 1.5 m) above the ground, illustrated in Figure 14.
(1)
Tree + Shrub + Grass
The simulation results depicted in Figure 13 indicate that the combined wind speeds for tree + shrub + grass during the summer vary between 2.8 m/s and 4.0 m/s, while in the winter, wind speeds range from 3.7 m/s to 5.2 m/s. The combination of kapok, waringin, and grass performs poorly in the winter, with wind speeds exceeding 5 m/s, which is considered an unsuitable wind speed. The configuration of banyan + waringin + grass and Bischofia javanica + waringin + grass has wind speeds not exceeding 5 m/s in both the summer and winter seasons, and there are no strong wind situations. Among them, the combination of Bischofia javanica, waringin, and grass performs the best. During the summer, a wind speed of 2.8 m/s allows individuals to comfortably remain outdoors for extended durations; whereas, in the winter, a wind speed of 3.7 m/s permits only brief outdoor standing or sitting sessions. This indicates that the vertical configuration of tree + shrub + grass can all play a role in reducing wind speeds. Regardless of summer or winter, the configuration mode of Bischofia javanica + waringin + carpet grass has the best effect on reducing wind speeds, significantly better than banyan + waringin + carpet grass and kapok + waringin + carpet grass. Therefore, the plant configuration of Bischofia javanica, waringin, and carpet grass is adopted in the tree + shrub + grass mode.
(2)
Tree + Grass
The simulation results depicted in Figure 14 illustrate that the tree + grass configuration effectively reduces wind speeds. During the summer, the wind speeds vary from 3.2 m/s to 4.0 m/s, while in the winter, wind speeds range from 4.1 m/s to 5.2 m/s. Notably, the kapok and grass combination exhibits poor performance in the winter, with wind speeds exceeding 5 m/s, Which is considered unsuitable. Conversely, the banyan and grass combination performs optimally. A wind speed of 3.2 m/s in the summer is conducive to prolonged outdoor activities, whereas 4.1 m/s in the winter is suitable for brief outdoor exposure. Based on this, it can be seen that the tree + grass configuration mode has a higher or lower wind reduction effect compared to the same variety of the tree + shrub + grass plants. When comparing banyan and carpet grass, the wind reduction effect of banyan and waringin and carpet grass is similar. However, the wind reduction effect of Bischofia javanica + carpet grass is significantly lower than that of Bischofia javanica + waringin + carpet grass. Additionally, the wind reduction effect of kapok + carpet grass is slightly higher than that of kapok + waringin + carpet grass. Among the three configuration modes of tree + grass, banyan and carpet grass have the best wind reduction effect.
(3)
Shrub + Grass
The simulation results depicted in Figure 14 indicate that the combination of shrub + grass has the potential to mitigate wind speeds. By adopting a configuration consisting of waringin and carpet grass, wind speeds during the summer and winter remain below 5 m/s, eliminating instances of strong winds. Specifically, the average wind speed in the summer measures 3.3 m/s, providing a conducive environment for prolonged outdoor activities. During the winter season, the average wind speed is 4.3 m/s, which is ideal for short periods of time outdoors. Therefore, it indicates that, compared to the same tree + shrub + grass configuration mode, the shrub + grass configuration mode is even better than some tree + shrub + grass configuration modes. For example, the wind reduction effect of waringin + carpet grass is higher than that of kapok + waringin + carpet grass, slightly lower than that of banyan + waringin + carpet grass, and significantly lower than that of Bischofia javanica + waringin + carpet grass.
(4)
Wind Regulation Amplitude
When it comes to wind regulation amplitude, Table 9 illustrates the impact of different facade configurations on wind regulation amplitudes of various plant varieties during the summer and winter. In the summer, the wind regulation amplitudes for plant combinations, such as banyan + waringin + grass, Bischofia javanica + waringin + grass, kapok + waringin + grass, banyan + grass, Bischofia javanica + grass, kapok + grass, and waringin + grass are 31.91%, 40.43%, 14.89%, 31.91%, 19.15%, 14.89%, and 29.79%, respectively. It is worth noting that the wind regulation amplitude is highest in the combination of Bischofia javanica + waringin + grass, at 1.27 times that of the plant combination banyan + waringin + grass, while kapok + waringin + grass and Bischofia javanica + grass show the lowest performance (0.47 times that of the plant combination banyan + waringin + grass). During the winter, the wind regulation amplitudes for the same plant combinations are 33.12%, 39.64%, 15.17%, 33.12%, 20.07%, 15.17%, and 29.85%, respectively. Among these, Bischofia javanica + waringin + grass shows the highest wind regulation amplitude, which is 1.20 times that of the plant combination banyan + waringin + grass, while kapok + waringin + grass and Bischofia javanica + grass perform the poorest (0.46 times that of the plant combination banyan + waringin + grass).
In summary, the configuration mode of tree + shrub + grass performs the best at a Z = 1.5 m wind speed, while the plant variety combination of Bischofia javanica + waringin + carpet grass performs the best and has the most effective wind regulation. This is due to the ventilation provided by the Bischofia javanica forest, and the waringin plays a significant role in guiding the wind and preventing direct exposure to it for people (Figure 15).

3.4. Plant Configuration Scheme Wind Environment Optimization Verification

It is evident from Figure 10 that the current single-building courtyard space (Youth Teacher Apartment) experiences wind speeds exceeding 5 m/s in both the summer and winter. During the summer, winds are situated in the southeast region (point b), while in the winter, winds extend from the southeast to northeast regions (points b and c), as well as encompassing the southeast to northeast corner of the courtyard (points f, g, j, and m). A targeted plant configuration optimization plan (Figure 16a) is proposed to address the current wind environment issues in the courtyard space of a single building (Youth Teacher Apartment): Bischofia javanica, waringin, and grass plants will be added to two areas where wind speeds exceed 5 m/s during both the summer and winter seasons. Then, the plant configuration optimization plan model was inputted into PHOENICS software to simulate the wind environment. Subsequently, the simulation values at Z = 1.5 m following optimization were contrasted with the initial simulation values (Figure 16b).
Upon optimizing the plant configuration scheme, improvements in wind speed are evident in the courtyard space of the single building (Youth Teacher Apartment) during both the summer and winter, with no detection points recording wind speeds exceeding 5 m/s, and the average wind speed has significantly decreased, as depicted in Figure 16b. Therefore, increasing the plant configuration of Bischofia javanica, waringin, and grass plants in areas with high wind speeds can effectively reduce their wind speed and improve wind comfort. This indicates that the plant configuration can not only beautify the campus environment, but it can be a cost-effective way to improve the wind comfort for outdoor campus spaces.

4. Conclusions

This study delves into the outdoor environment of the Donghai Campus of Quanzhou Normal University, specifically examining spatial models for roads, squares, and courtyards, along with two types of plant configurations. The primary objective is to analyze how different plant arrangements affect the campus’s outdoor wind conditions. A model incorporating both flat and vertical plant configurations is established for this purpose, and CFD simulations are conducted using PHOENICS software to quantify wind speeds. The research yields the following conclusions:
(1)
Among trees, under the same conditions and with a consistent trunk height, the wind speeds with banyan are more suitable than that of Erythrina indica. When both the height and width change, Bischofia javanica has a better wind speed compared to the mango tree. Under the same conditions and with a consistent width, the wind speeds with kapok are more suitable compared to that of the Chorisia speciosa. Among shrubs, waringin has a more comfortable wind speed compared to Aglaia odorata lour.
(2)
Among the three configuration modes of tree + shrub + grass, Bischofia javanica + waringin + carpet grass has the best wind reduction effect. Among the three configuration modes of tree + grass, the wind reduction effect of banyan + carpet grass is significant. When using three types of plants—Bischofia javanica, waringin, and carpet grass—for the configuration of tree + shrub + grass, tree + grass, and shrub + grass, the wind reduction effect of tree + shrub + grass is the best.
(3)
In specific plant variety combinations, adding Bischofia javanica, waringin, and grass plant configurations in areas with high wind speeds can effectively reduce wind speeds and improve the comfort of the wind environment.
The above conclusion indicates that the selection of different plant varieties and their configuration modes can achieve different wind regulation effects. In this study, we only analyzed the impact of different plant species and configuration modes on the comfort of the outdoor wind environment in campus spaces. In the future, we will compare the effects of other factors, such as plant layout, plant orientation, among other factors, on the internal wind comfort. This study’s limitation lies in the investigation of pedestrians’ perception of outdoor space comfort. Subsequently, a comprehensive analysis from both natural and cultural viewpoints will be conducted on this matter. The above results have verified the advantages of plant configuration in optimizing the wind comfort of outdoor spaces on campus and offer insights for designing outdoor environments in subtropical coastal regions.

Author Contributions

Conceptualization, J.C., T.H. and Z.W.; methodology, J.Z., Y.W. and T.H.; software, T.H. and J.C.; validation, H.Y., Z.W., J.Z. and T.H.; formal analysis, X.Y., J.C., T.H. and Y.W.; investigation, Z.W., H.Y. and Y.W.; resources, Z.W.; data curation, J.C., X.Y., Z.W. and T.H.; writing—original draft preparation, H.Y., Z.W. and J.Z.; writing—review and editing, Z.W., J.Z. and J.C.; visualization, T.H.; supervision, X.Y., T.H. and J.C.; project administration, Z.W.; funding acquisition, Z.W. All authors have read and agreed to the published version of the manuscript.

Funding

This study received funding from the Ministry of Education through the Humanities and Social Science Research Youth Fund projects [20YJCZH009], the National Natural Science Foundation of China Youth Science Fund Project [42401236], and the General Project for Fujian Province Natural Science Foundation in China [2023J01894].

Data Availability Statement

Data is contained within the article.

Conflicts of Interest

No conflicts of interest have been declared by the authors.

References

  1. Liu, X.; Bao, Y. Research on the overall design practice of green university campuses in humid and hot regions: A case study of China Capital Market Institute and The Chinese University of Hong Kong (Shenzhen). South Archit. 2019, 5, 60–67, 125. [Google Scholar]
  2. Ying, X.; Shen, L.; Han, X.; Gao, J.; Qin, X.; Chen, J.; Huangpu, F.; Wang, H. Comparative analysis and strategic research on high-density primary school campus layout in humid and hot southern regions from the perspective of wind environment. Huazhong Archit. 2023, 41, 51–57. [Google Scholar]
  3. Chen, S.; Mei, H. Research on the Design of Campus Cluster Form in Cold Regions Universities Based on Microclimate Environment Optimization. Contemp. Archit. 2020, 7, 19–23. [Google Scholar]
  4. Sun, C.; Zhi, D.; Han, Y. Design Strategy for Teaching Group Form in Cold Regions Based on Outdoor Thermal Comfort. South Archit. 2020, 4, 80–85. [Google Scholar]
  5. Liu, B.; Si, R. Adaptive Strategies for Wind Environment Landscape in Residential Areas Based on Data Measurement and CFD Simulation: A Case Study of Zhangwu Road Dormitory Area at Tongji University. China Landsc. Archit. 2018, 34, 24–28. [Google Scholar]
  6. Zeng, Q.; Xu, J.; Li, C.; Chen, J. The impact of campus landscape design on spatial ventilation environment in humid and hot regions of South China. Hubei Agric. Sci. 2021, 60 (Suppl. S1), 270–274. [Google Scholar]
  7. Guo, J.; Li, X. CFD based simulation analysis and design optimization of outdoor wind environment in university campuses in hot summer and warm winter areas: Taking the planning and design scheme of Shantou University East Campus Project (Phase III) as an example. Archit. Technol. 2021, 27, 115–117. [Google Scholar]
  8. Liu, M.; Cui, L. Analysis of Factors Influencing Campus Landscape Space Wind Environment and Improvement Strategies. Value Eng. 2023, 42, 128–130. [Google Scholar]
  9. Zhang, N.; Wang, H.; Yu, R. Research on Campus Wind Environment Renovation and Optimization Based on CFD Numerical Simulation: A Case Study of China University of Petroleum. Urban Archit. 2021, 18, 126–129. [Google Scholar]
  10. Wang, B.; Sun, S.; Li, Y.; Xie, Y.N.; Hou, Y.X.; Jin, Q.T.; Ren, Y.Y. Campus wind environment evaluation in north China—A case study of NCUT. Energy Rep. 2020, 6 (Suppl. S1), 787–793. [Google Scholar] [CrossRef]
  11. Han, Y.; Chen, Z.; Zhang, G. The impact of plant planting patterns on the outdoor wind environment of university sports halls. Mod. Hortic. 2024, 47, 49–51. [Google Scholar]
  12. Liu, R.; Yan, X.; Wang, X. Study on the Impact of Urban Greening on Wind Environment Based on CFD Simulation Technology. J. Shijiazhuang Railw. Univ. Soc. Sci. Ed. 2022, 16, 104–108. [Google Scholar]
  13. Zhang, L.; Zhan, Q.; Lan, Y. Effects of the tree distribution and species on outdoor environment conditions in a hot summer and cold winter zone: A case study in Wuhan residential quarters. Build. Environ. 2018, 130, 27–39. [Google Scholar] [CrossRef]
  14. Hami, A.; Abdi, B.; Zarehaghi, D.; Bin Maulan, S. Assessing the thermal comfort effects of green spaces: A systematic review of methods, parameters, and plants’ attributes. Sustain. Cities Soc. 2019, 49, 10163. [Google Scholar] [CrossRef]
  15. Murtaza, M.; Wenbin, P.T.; Kaiser, J.C. Numerical evaluation of the use of vegetation as a shelterbelt for enhancing the wind and thermal comfort in peripheral and lateral-type skygardens in highrise buildings. Build. Simul. 2022, 16, 11–19. [Google Scholar]
  16. Rui, L.; Buccolieri, R.; Gao, Z.; Ding, W.; Shen, J. The Impact of Green Space Layouts on Microclimate and Air Quality in Residential Districts of Nanjing, China. Forests 2018, 9, 224. [Google Scholar] [CrossRef]
  17. Li, H.; Yan, Z.; Zhang, Z.; Lang, J.; Wang, X. A Numerical Study of the Effect of Vegetative Windbreak on Wind Erosion Over Complex Terrain. Forests 2022, 13, 1072. [Google Scholar] [CrossRef]
  18. Chan, W.L.; Eng, Y.; Ge, Z.; Lim, C.W.C.; Gobeawan, L.; Poh, H.J.; Wise, D.J.; Burcham, D.C.; Lee, D.; Cui, Y.; et al. Wind Loading on Scaled Down Fractal Tree Models of Major Urban Tree Species in Singapore. Forests 2020, 11, 803. [Google Scholar] [CrossRef]
  19. GB/T 50378-2019; Green Building Evaluation Standard. China Construction Industry Press: Beijing, China, 2019; pp. 126–127.
  20. Tan, L. Simulation Study on Outdoor Wind Environment in Residential Areas Based on Reasonable Static Wind Rate Determination. Master’s Thesis, Chongqing University, Chongqing, China, 2017. [Google Scholar]
  21. Liu, B. Study on Outdoor Wind Environment in Winter in CBD of Cold Regions—Taking Xi’an High Tech Software Park CBD as an Example. Master’s Thesis, Chongqing University, Chongqing, China, 2017. [Google Scholar]
  22. Soligo, M.J.; Irwin, P.A.; Williams, C.J.; Schuyler, G.D. A comprehensive assessment of pedestrian comfort including thermal effects. J. Wind Eng. Ind. Aerodyn. 1998, 77, 753–766. [Google Scholar] [CrossRef]
  23. Li, L.; Li, X.; Lin, B. Simulation of canopy flow using a two equation turbulence model with source term k-ε. J. Tsinghua Univ. Nat. Sci. Ed. 2006, 46, 753–756. [Google Scholar]
  24. Lu, M.; Song, D.; Shi, J. Effect of high-rise residential building layout on the spatial vertical wind environment in Harbin, China. Buildings 2022, 12, 705. [Google Scholar] [CrossRef]
  25. Wei, X. Research on reducing carbon consumption in residential community spaces as influenced by microclimate environments. J. Urban Plan. Dev. 2021, 147, 147. [Google Scholar] [CrossRef]
  26. Li, J.; Liu, J.; Srebric, J.; Hu, Y.; Liu, M.; Su, L.; Wang, S. The effect of tree-planting patterns on the microclimate within a courtyard. Sustainability 2019, 11, 1665. [Google Scholar] [CrossRef]
  27. Xu, X.; Luo, F.; Wang, W.; Hong, T.; Fu, X. Performance-based evaluation of courtyard design in China’s cold-winter hot-summer climate regions. Sustainability 2018, 10, 3950. [Google Scholar] [CrossRef]
  28. Norouziasas, A.; Ha, P.P.; Ahmadi, M.; Rijal, H.B. Evaluation of urban form influence on pedestrians’ wind comfort. Build. Environ. 2022, 224, 109522. [Google Scholar] [CrossRef]
  29. Chu, C.; Su, Z. Natural ventilation design for underground parking garages. Build. Environ. 2023, 227 Pt 1, 109784. [Google Scholar] [CrossRef]
  30. Franke, J.; Hellsten, A.; Schlunzen, K.H.; Carissimo, B. The COST 732 Best Practice Guideline for CFD simulation of flows in the urban environment: A summary. Int. J. Environ. Pollut. 2011, 44, 419–427. [Google Scholar] [CrossRef]
  31. Qin, H.; Hong, B.; Jiang, R.; Yan, S.; Zhou, Y. The Effect of Vegetation Enhancement on Particulate Pollution Reduction: CFD Simulations in an Urban Park. Forests 2019, 10, 373. [Google Scholar] [CrossRef]
  32. Xue, F.; Li, X. The impact of roadside trees on traffic released PM10 in urban street canyon: Aerodynamic and deposition effects. Sustain. Cities Soc. 2017, 30, 195–204. [Google Scholar] [CrossRef]
  33. Bruse, M.; Fleer, H. Simulating surface–plant–air interactions inside urban environments with a three dimensional numerical model. Environ. Model. Softw. 1998, 13, 373–384. [Google Scholar] [CrossRef]
  34. Srivanit, M.; Hokao, K. Evaluating the cooling effects of greening for improving the outdoor thermal environment at an institutional campus in the summer. Build. Environ. 2013, 66, 158–172. [Google Scholar] [CrossRef]
  35. Lin, B.; Li, X.; Zhu, Y.; Qin, Y. Numerical simulation studies of the different vegetation patterns’ effect on outdoor pedestrian thermal comfort. J. Wind Eng. Ind. Aerod. 2008, 96, 1707–1718. [Google Scholar] [CrossRef]
  36. Sanz, C. A note on k-ε modelling of vegetation canopy air-flows. Bound. Layer Meteorol. 2003, 108, 191–197. [Google Scholar] [CrossRef]
  37. Katul, G.G.; Mahrt, L.; Poggi, D.; Sanz, C. One- and two-equation models for canopy turbulence. Bound. Layer Meteorol. 2004, 113, 81–109. [Google Scholar] [CrossRef]
  38. Endalew, A.M.; Hertog, M.; Delele, M.; Baetens, K.; Persoons, T.; Baelmans, M.; Ramon, H.; Nicolaï, B.; Verboven, P. CFD modelling and wind tunnel validation of airflow through plant canopies using 3D canopy architecture. Int. J. Heat Fluid Flow 2009, 30, 356–368. [Google Scholar] [CrossRef]
  39. Jin, W.; Zhou, C. Impact of administrative level and land marketization level on urban construction land utilization benefits. Geogr. Sci. 2023, 43, 2080–2090. [Google Scholar]
Figure 1. (a) Map of China. (b) Map of Fujian Province. (c) Map showing the location of Donghai Campus of Quanzhou Normal University.
Forests 16 00461 g001
Figure 2. (a) Overall plan of Donghai Campus of Quanzhou Normal University. (b) Map showing measurement points for the wind environment in campus outdoor spaces (A–F are wind environment detection points).
Forests 16 00461 g002
Figure 3. Research framework.
Forests 16 00461 g003
Figure 4. Wind environment measurement points: (a) main entrance square space (a–s are wind environment detection points); (b) courtyard space of an individual building (a–m are wind environment detection points); (c) solitary planting; (d) opposite planting; (e) row planting; (f) combination of trees, shrubs, and grasses.
Forests 16 00461 g004
Figure 5. (a) LAI-2200C Plant Canopy Analyzer. (b) On-site measurement. (c) FV2200 V 2.1.1 software data analysis.
Forests 16 00461 g005
Figure 6. Simplified 3D model: (a) A main entrance square space; (b) E single building courtyard space; (c) solitary plant; (d) opposite plant; (e) row plant; (f) tree + shrub + grass, tree + grass, and shrub + grass.
Forests 16 00461 g006
Figure 7. (a) Original coordinate (a–s are wind environment detection points). (b) Computational domain.
Forests 16 00461 g007
Figure 8. Linear regression plot of measured and CFD-simulated values ((ai) correspond to the time periods of 9:00 a.m. and 5:00 p.m., respectively).
Forests 16 00461 g008
Figure 9. (a) Map showing summer wind speeds without plants. (b) Map showing summer wind speeds with plants. (c) Map showing winter wind speeds without plants. (d) Map showing winter wind speeds with plants. (e) Simulation results of having or not having a plant in the wind environment during the summer and winter at the main gate square (red represents the highest wind difference and average wind speed, while green represents the lowest wind difference and average wind speed).
Forests 16 00461 g009
Figure 10. (a) Map showing summer wind speeds. (b) Map showing winter wind speeds. (c) Simulation results of having or not having a plant in the wind environment during the summer and winter at the Youth Teacher Apartment (red represents the highest wind difference and average wind speed, while green represents the lowest wind difference and average wind speed).
Forests 16 00461 g010
Figure 11. (ai) Maps showing summer wind speeds. (jr) Maps showing winter wind speeds. (s) Simulated data graph of the wind reduction for individual trees and shrubs (wind speeds at a line of sight height of 1.5 m for each tree and shrub).
Forests 16 00461 g011
Figure 12. (ai) Maps showing summer wind speeds. (jr) Maps showing winter wind speeds. (s) Simulated data graph of wind reduction for opposite planting of trees and shrubs (wind speeds at a line of sight height of 1.5 m for opposite planting of trees and shrubs).
Forests 16 00461 g012
Figure 13. (ai) Maps showing summer wind speeds. (jr) Maps showing winter wind speeds. (s) Simulated data graph of wind reduction for row planting of trees and shrubs (wind speed at a line of sight height of 1.5 m for row planting of trees and shrubs).
Forests 16 00461 g013
Figure 14. (ag) Maps showing summer wind speeds. (hn) Maps showing winter wind speeds. (o) Simulated data graph of wind reduction for seven plant facade configuration models (wind speed at a line of sight height of 1.5 m).
Forests 16 00461 g014
Figure 15. Vertical and side schematic diagrams of ventilation, wind blocking, and wind guidance for Bischofia javanica + waringin + grass plant configuration: (a) front elevation view; (b) side elevation view.
Forests 16 00461 g015
Figure 16. (a) Optimization plan for the plant configuration for the Youth Teacher Apartment. (b) Comparison of wind speed at measurement points before and after optimization in the summer and winter for the Youth Teacher Apartment.
Forests 16 00461 g016
Table 1. Typical plant parameters.
Typical PlantsCrown Height (m)Crown Diameter (m)Tree Trunk Height (m)LAI (Summer)LAI (Winter)
Carpet grass0.21.00--
Aglaia odorata lour0.81.004.254.85
Waringin4.54.505.983.35
Erythrina indica4.03.02.54.101.45
Banyan4.53.52.55.602.56
Bischofia javanica5.04.03.51.223.14
Mango trees6.57.54.04.104.50
Chorisia speciosa7.08.05.02.221.28
Kapok8.08.06.00.701.56
Table 2. Simplified integer value table for two outdoor space and plant scene models on campus.
Project NameDimension (m)Project NameDimension (m)Project NameDimension (m)
A main entrance square space410 × 460 × 108Aglaia odorata lour (opposite planting)30 × 30 × 1.8Banyan (row planting)100 × 100 × 8.0
E single building courtyard space120 × 104 × 48Waringin (opposite planting)30 × 30 × 5.5Bischofia javanica (row planting)100 × 100 × 9.5
Carpet grass (solitary planting)20 × 20 × 1.2Erythrina indica (opposite planting)30 × 30 × 7.5Mango trees (row planting)100 × 100 × 11.5
Aglaia odorata lour (solitary planting)20 × 20 × 1.8Banyan (opposite planting)30 × 30 × 8.0Chorisia speciosa (row planting)100 × 100 × 13.0
Waringin (solitary planting)20 × 20 × 5.5Bischofia javanica (opposite planting)30 × 30 × 9.5Kapok (row planting)100 × 100 × 15.0
Erythrina indica (solitary planting)20 × 20 × 7.5Mango trees (opposite planting)30 × 30 × 11.5Banyan + Waringin + Carpet grass100 × 100 × 8.0
Banyan (solitary planting)20 × 20 × 8.0Chorisia speciosa (opposite planting)30 × 30 × 13.0Bischofia javanica + Waringin + Carpet grass100 × 100 × 9.5
Bischofia javanica (solitary planting)20 × 20 × 9.5Kapok (opposite planting)30 × 30 × 15.0Kapok + Waringin + Carpet grass100 × 100 × 15.0
Mango trees (solitary planting)20 × 20 × 11.5Carpet grass (row planting)100 × 100 × 1.2Banyan + Carpet grass100 × 100 × 8.0
Chorisia speciosa (solitary planting)20 × 20 × 13.0Aglaia odorata lour (row planting)100 × 100 × 1.8Bischofia javanica + Carpet grass100 × 100 × 9.5
Kapok (solitary planting)20 × 20 × 15.0Waringin (row planting)100 × 100 × 5.5Kapok + Carpet grass100 × 100 × 15.0
Carpet grass (opposite planting)30 × 30 × 1.2Erythrina indica (row planting)100 × 100 × 7.5Waringin + Carpet grass100 × 100 × 5.5
Table 3. Comparison of simulation results for different calculation domain heights.
Detection PointsThe Calculation Domain Measures 5 W × 5 L × 3 H (Simulation Results m/s)The Calculation Domain Measures 5 W × 5 L × 5 H (Simulation Results m/s)
b3.3/3.53.3/3.5
e3.7/4.43.7/4.5
h1.6/1.21.8/1.2
m2.4/1.72.4/1.7
p3.0/2.03.0/2.2
Table 4. Comparison of simulation results for different grids.
Detection PointsCoarse Meshes (Simulation Results m/s)Fine Meshes (Simulation Results m/s)Finest Meshes (Simulation Results m/s)
b4.3/4.62.4/1.81.9/1.6
e4.0/3.91.8/0.81.7/0.6
h4.2/3.61.5/0.91.5/0.9
m5.0/4.30.8/1.70.8/1.7
p4.3/4.50.8/1.70.8/1.7
Table 5. Statistical analysis of winter measured and simulated average wind speed in the main entrance square space a.
ModelSum of SquaresdfMean Squared ErrorFractional BiasFSig.
09:00Regression0.9410.940.42 13.98 0.03 b
10:000.6110.610.52 11.37 0.04 b
11:000.6910.690.68 13.42 0.04 b
12:0010.31110.31−0.82 19.56 0.02 b
13:006.9616.96−0.90 13.17 0.04 b
14:001.2511.25−0.44 35.28 0.01 b
15:001.5911.59−0.30 26.68 0.01 b
16:003.9813.98−0.70 18.56 0.02 b
17:003.0013.00−0.42 14.75 0.03 b
a Dependent Variable: Measured wind speed; b Predictors. (Constant), Simulated wind speed.
Table 6. Statistical table for the summer/winter wind regulation amplitude of solitary plant species configurations.
Figure No.Plant Varieties Summer/Winter Input Wind SpeedsSummer/Winter Average Wind SpeedsSummer/Winter Wind Regulation AmplitudeSummer/Winter Wind Regulation Rate
1Erythrina indica4.70/6.134.0/5.214.89%/15.17%1.00/1.00
2Banyan4.70/6.134.0/5.114.89%/16.80%1.00/1.11
3Bischofia javanica4.70/6.133.7/4.821.28%/21.70%1.43/1.43
4Mango trees4.70/6.134.5/4.94.26%/20.07%0.29/1.32
5Chorisia speciosa4.70/6.134.6/5.02.13%/18.43%0.14/1.22
6Kapok4.70/6.134.6/5.02.13%/18.43%0.14/1.22
7Aglaia odorata lour4.70/6.133.8/5.019.15%/18.43%1.29/1.22
8Waringin4.70/6.134.0/5.214.89%/15.17%1.00/1.00
9Carpet grass4.70/6.133.8/4.919.15%/20.07%1.29/1.32
Note: The red color signifies the highest wind regulation rate, while the green color signifies the lowest wind regulation rate among the nine plant varieties in the isolated plant configuration (the wind regulation amplitude equals 1 minus the average wind speed compared to the input wind speed. Positive numbers indicate a downwind amplitude, while negative numbers indicate a lift amplitude opposite to the downwind amplitude. The wind regulation rate is the wind regulation amplitude n divided by the wind regulation amplitude 1. Afterwards, data were obtained using the above method).
Table 7. Statistical table for the summer/winter wind regulation amplitude of opposite plant species configurations.
Figure No.Plant Varieties Summer/Winter Input Wind SpeedsSummer/Winter Average Wind SpeedsSummer/Winter Wind Regulation AmplitudeSummer/Winter Wind Regulation Rate
1Erythrina indica4.70/6.133.8/4.919.15%/20.07%1.00/1.00
2Banyan4.70/6.133.9/5.017.02%/18.43%0.89/0.92
3Bischofia javanica4.70/6.133.9/4.517.02%/26.59%0.89/1.33
4Mango trees4.70/6.134.2/5.010.64%/18.43%0.56/0.92
5Chorisia speciosa4.70/6.134.1/5.412.77%/11.91%0.67/0.59
6Kapok4.70/6.134.2/5.510.64%/10.28%0.56/0.51
7Aglaia odorata lour4.70/6.133.8/5.019.15%/18.43%1.00/0.92
8Waringin4.70/6.132.7/3.442.55%/44.54%2.22/2.22
9Carpet grass4.70/6.133.8/4.919.15%/20.07%1.00/1.00
Note: The red color signifies the highest wind regulation rate among the nine plant varieties in the plant configuration, whereas the green color signifies the lowest wind regulation rate among the nine plant varieties in the plant configuration.
Table 8. Statistical table for the summer/winter wind regulation amplitude of row plant species configurations.
Figure No.Plant Varieties Summer/Winter Input Wind SpeedsSummer/Winter Average Wind SpeedsSummer/Winter Wind Regulation AmplitudeSummer/Winter Wind Regulation Rate
1Erythrina indica4.70/6.133.5/4.525.53%/26.59%1.00/1.00
2Banyan4.70/6.133.2/4.131.91%/33.12%1.25/1.25
3Bischofia javanica4.70/6.133.8/4.919.15%/20.07%0.75/0.75
4Mango tree4.70/6.134.0/5.214.89%/15.17%0.58/0.57
5Chorisia speciosa4.70/6.134.1/5.412.77%/11.19%0.50/0.45
6Kapok4.70/6.133.9/5.217.02%/15.17%0.67/0.57
7Aglaia odorata lour4.70/6.133.9/5.117.02%/16.80%0.67/0.63
8Waringin4.70/6.133.3/4.329.79%/29.85%1.17/1.12
9Carpet grass4.70/6.133.8/4.919.15%/20.07%0.75/0.75
Note: The red color signifies the highest wind regulation rate among the nine plant varieties in the column planting configuration, whereas the green color signifies the lowest wind regulation rate among the nine plant varieties in the column planting configuration.
Table 9. Statistical table for summer/winter wind regulation amplitude of plant facade configurations.
Figure No.Plant Varieties Summer/Winter Input Wind SpeedsSummer/Winter Average Wind SpeedsSummer/Winter Wind Regulation AmplitudeSummer/Winter Wind Regulation Rate
1Banyan + waringin + grass4.70/6.133.2/4.131.91%/33.12%1.00/1.00
2Bischofia javanica + waringin + grass4.70/6.132.8/3.740.43%/39.64%1.27/1.20
3Kapok + waringin + grass4.70/6.134.0/5.214.89%/15.17%0.47/0.46
4Banyan + grass4.70/6.133.2/4.131.91%/33.12%1.00/1.00
5Bischofia javanica + grass4.70/6.133.8/4.919.15%/20.07%0.60/0.61
6Kapok + grass4.70/6.134.0/5.214.89%/15.17%0.47/0.46
7Waringin + grass4.70/6.133.3/4.329.79%/29.85%0.93/0.90
Note: The red color shows the highest wind regulation rate among the seven plant varieties in the facade configuration, whereas the green color represents the lowest wind regulation rate of the seven plant varieties in the facade configuration.
Disclaimer/Publisher’s Note: The statements, opinions and data contained in all publications are solely those of the individual author(s) and contributor(s) and not of MDPI and/or the editor(s). MDPI and/or the editor(s) disclaim responsibility for any injury to people or property resulting from any ideas, methods, instructions or products referred to in the content.

