Article

Nitrogen Enrichment Alters Plant Root, Soil Microbial Structure, Diversity, and Function in Mountain Forests of North China

1
College of Forestry, Shanxi Agricultural University, Jinzhong 030801, China
2
The UWA Institute of Agriculture, and School of Agriculture and Environment, The University of Western Australia, Perth, WA 6009, Australia
*
Author to whom correspondence should be addressed.
Forests 2025, 16(3), 459; https://doi.org/10.3390/f16030459
Submission received: 30 January 2025 / Revised: 19 February 2025 / Accepted: 1 March 2025 / Published: 5 March 2025
(This article belongs to the Section Forest Soil)

Abstract

:
Nitrogen (N) enrichment significantly impacts temperate forest ecosystems, but we lack a comprehensive understanding of the responses of root morphological characteristics, soil microbial communities, and soil multifunctionality concurrently to varying degrees of N enrichment, particularly when exceeding a threefold localized N input in temperate forests. Therefore, we selected four forest communities in China’s temperate forests and experimented with localized N addition to the dominant tree species in each forest community through the root bag method (three N addition treatments were set up: N1, fourfold soil total N; N2, sixfold soil total N; and CK, control). The results showed that (1) N enrichment treatments significantly improved soil multifunctionality and modified root morphological characteristics, leading to increases in RD (root diameter) and RTD (root tissue density) but decreases in SRL (specific root length) and SRA (specific root area). (2) N enrichment treatments also substantially changed microbial community composition and functional taxa. The relative abundance of eutrophic bacteria increased, while that of oligotrophic bacteria and saprotrophic fungi decreased. (3) The microbial α-diversity index decreased, and the microbial co-occurrence networks became less complex and more vulnerable under N enrichment treatments. (4) Soil multifunctionality and the microbial alpha diversity index had a substantial negative correlation. (5) NH4+-N and NO3-N contents were the key factors affecting microbial dominance phyla, as well as the bacterial Shannon index and the fungal Chao1 index. (6) In addition, soil properties (except NH4+-N and NO3-N), soil enzyme activities, root morphological characteristics, and the microbial Chao1 index were significantly different among tree species. In summary, N enrichment significantly alters root morphological characteristics and improves soil multifunctionality. Concurrently, it reduced microbial α-diversity, increased the abundance of eutrophic bacteria, and decreased saprophytic fungi, leading to a less complex and more vulnerable microbial community. This study provided important data and insights for a comprehensive study of the repertoire of responses to nitrogen enrichment in temperate forest ecosystems.

1. Introduction

Nitrogen (N) enrichment in terrestrial ecosystems has significantly grown as a result of human activities, such as fertilizer usage and the combustion of fossil fuels [1,2,3]. Forests are important components of terrestrial ecosystems, and nitrogen enrichment may lead to soil acidification [4], the loss of biodiversity [5], and forest degradation [1,6,7]. By controlling the cycle of soil nutrients [5], altering microbial populations [8,9], and influencing plant root properties [10,11], N enrichment not only modifies aboveground plant communities but also significantly affects belowground ecosystems. Bacteria and fungi predominate among soil microorganisms, which are important regulators of root development and soil nutrient cycling [12,13]. Adams et al. [14] revealed that, in temperate tree species, root length can be significantly increased by localized N fertilization, with the effects observed when the rate exceeds a threefold increase. Despite extensive research on the response of soil microbial communities to N fertilization, the concurrent responses of plant root characteristics, soil microbial communities, and soil property indicators to varying degrees of (N) enrichment, particularly when exceeding a threefold localized N input remain unclear.
In forest ecosystems, plant roots are crucial organs for nutrient acquisition and environmentally delicate parts of below-ground processes; variations in their properties correspond to the trees’ nutrient acquisition capacities [15,16,17]. The effects of enrichment N on root morphology, however, have shown conflicting results. There were studies that showed that nitrogen addition altered root morphology characteristics [18,19,20,21], while others showed that root morphology characteristics were hardly altered [10,22]. Ostonen et al. [18] found that RTD (root tissue density) in Norway spruce decreased with increasing soil N effectiveness, while others reported no significant change [10,22]. There were three types of changes in RD (root diameter) and SRL (specific root length) as nitrogen effectiveness increased: an increase in RD and a decrease in SRL [19,21]; a decrease in RD and an increase in SRL [20]; and no significant changes in RD and SRL [10,22].
The effects of adding nitrogen on soil microbial populations have been extensively studied. These investigations have shown that by altering the amounts of soil nutrients, N enrichment may have an impact on the structure, function, and diversity of soil microbiota [8,23,24,25]. Some studies addressed the changes in bacteria communities with N enrichment; the relative abundance of Proteobacteria, Bacteroidota, and Firmicutes increased, while that of Acidobacteriota and Verrucomicrobiota decreased [26,27]. These changes were accompanied by changes in a number of functions involved in the carbon (C) and N cycles [8]. N enrichment also altered the fungi structure, with a significant increase in the relative abundance of the Ascomycota and a significant decrease in the Basidiomycota [28], which may affect soil function [29]. Besides, the potential functional taxa varied with N enrichment, the relative abundance of mycorrhizal fungi decreased, and saprophytic fungi increased [28]. Furthermore, both bacterial Shannon and Chao1 index showed a decreasing trend with increasing N addition; whereas, fungal Shannon index increased at higher nitrogen addition treatments [30]. Wang et al. [31] conducted a meta-analysis using high-throughput amplicon sequencing data from field experiments with N fertilizers and showed that N enrichment significantly altered the community structure of soil bacteria and fungi and reduced soil bacterial diversity but had non-significant effects on soil fungal α-diversity and microbial β-diversity. In addition, Yang et al. [27] found a decrease in the complexity and stability of fungal networks, and Wang et al. [32] observed that the addition of N to microbial co-occurrence networks enhanced the complexity of bacterial co-occurrence networks.
The ability of soil ecosystems to support and sustain several biological activities at once is known as soil multifunctionality (SM). The integrity of soil multifunctionality is fundamental to realizing ecosystem functions [33]. Indicators, such as soil available nutrients and soil enzyme activities, can be chosen to represent soil multifunctionality. These indicators can reflect the current status of soil underground function in a more comprehensive way and provide a comprehensive evaluation of soil multifunctionality [34,35]. The diversity of microorganisms in soil is essential for maintaining soil health and quality, as various microorganisms are involved in the fundamental processes of soil. Therefore, the connection between microbial diversity and soil multifunctionality has been a popular area of study [34,35]. Considerable studies have shown that soil microbial diversity is positively correlated with soil multifunctionality [36,37]. However, Chen et al. [38] showed that soil multifunctionality can significantly increase as soil microbial diversity decreases. This has led to a controversial understanding of the relationship between microbial diversity and soil multifunctionality. Therefore, the relationships among soil multifunctionality and soil microbial community need to be studied in N enrichment environments.
Temperate forests, being nitrogen-limited ecosystems, are considered to have significant potential for enhanced carbon sequestration through nitrogen fertilization [39]. Although a section of researchers used four times the soil N as a criterion for conducting fertilization trials after Adams’s finding on root length response to N enrichment [14,40,41,42]. It is still not clear whether applying at fourfold or higher levels of soil N can be considered appropriate for practice application. Therefore, in this study, fourfold and sixfold the localized soil N were used as the N application to observe the effect of nitrogen addition on root, soil microbial communities, and soil multifunctionality. It will reveal threshold effects of N input, which is crucial for optimizing nitrogen management practices and enhancing carbon sequestration efficiency.
The root bag method is a valuable tool for studying the interactions between plant roots and soil microorganisms. It allows researchers to collect and analyze soil, providing insights into how roots influence soil microbial communities and ecosystem processes [41,42]. In this study, we selected four forest communities from temperate forests in China and conducted localized N addition experiments with dominant tree species (Quercus wutaishansea, Betula platyphylla, Picea meyeri, Larix gmelinii var. principis-rupprechtii) from each forest community using the root zone method. These dominant tree species are the dominant tree species in China’s temperate forests [42]. We set up three N application treatments: fourfold (N concentration of fourfold total soil N, N1), sixfold (N concentration of sixfold total soil N, N2), and control (CK). We analyzed the effects of nitrogen levels on root morphological characteristics, microbial communities, and soil multifunctionality. We hypothesized that (1) N addition altered root morphology characteristics; (2) N addition altered the structure, function, and diversity of microbial communities, with a decrease in the complexity and stability of the microbial co-occurrence network; and (3) N addition increased soil multifunctionality, and there was a negative correlation between soil multifunctionality and microbial diversity.

2. Materials and Methods
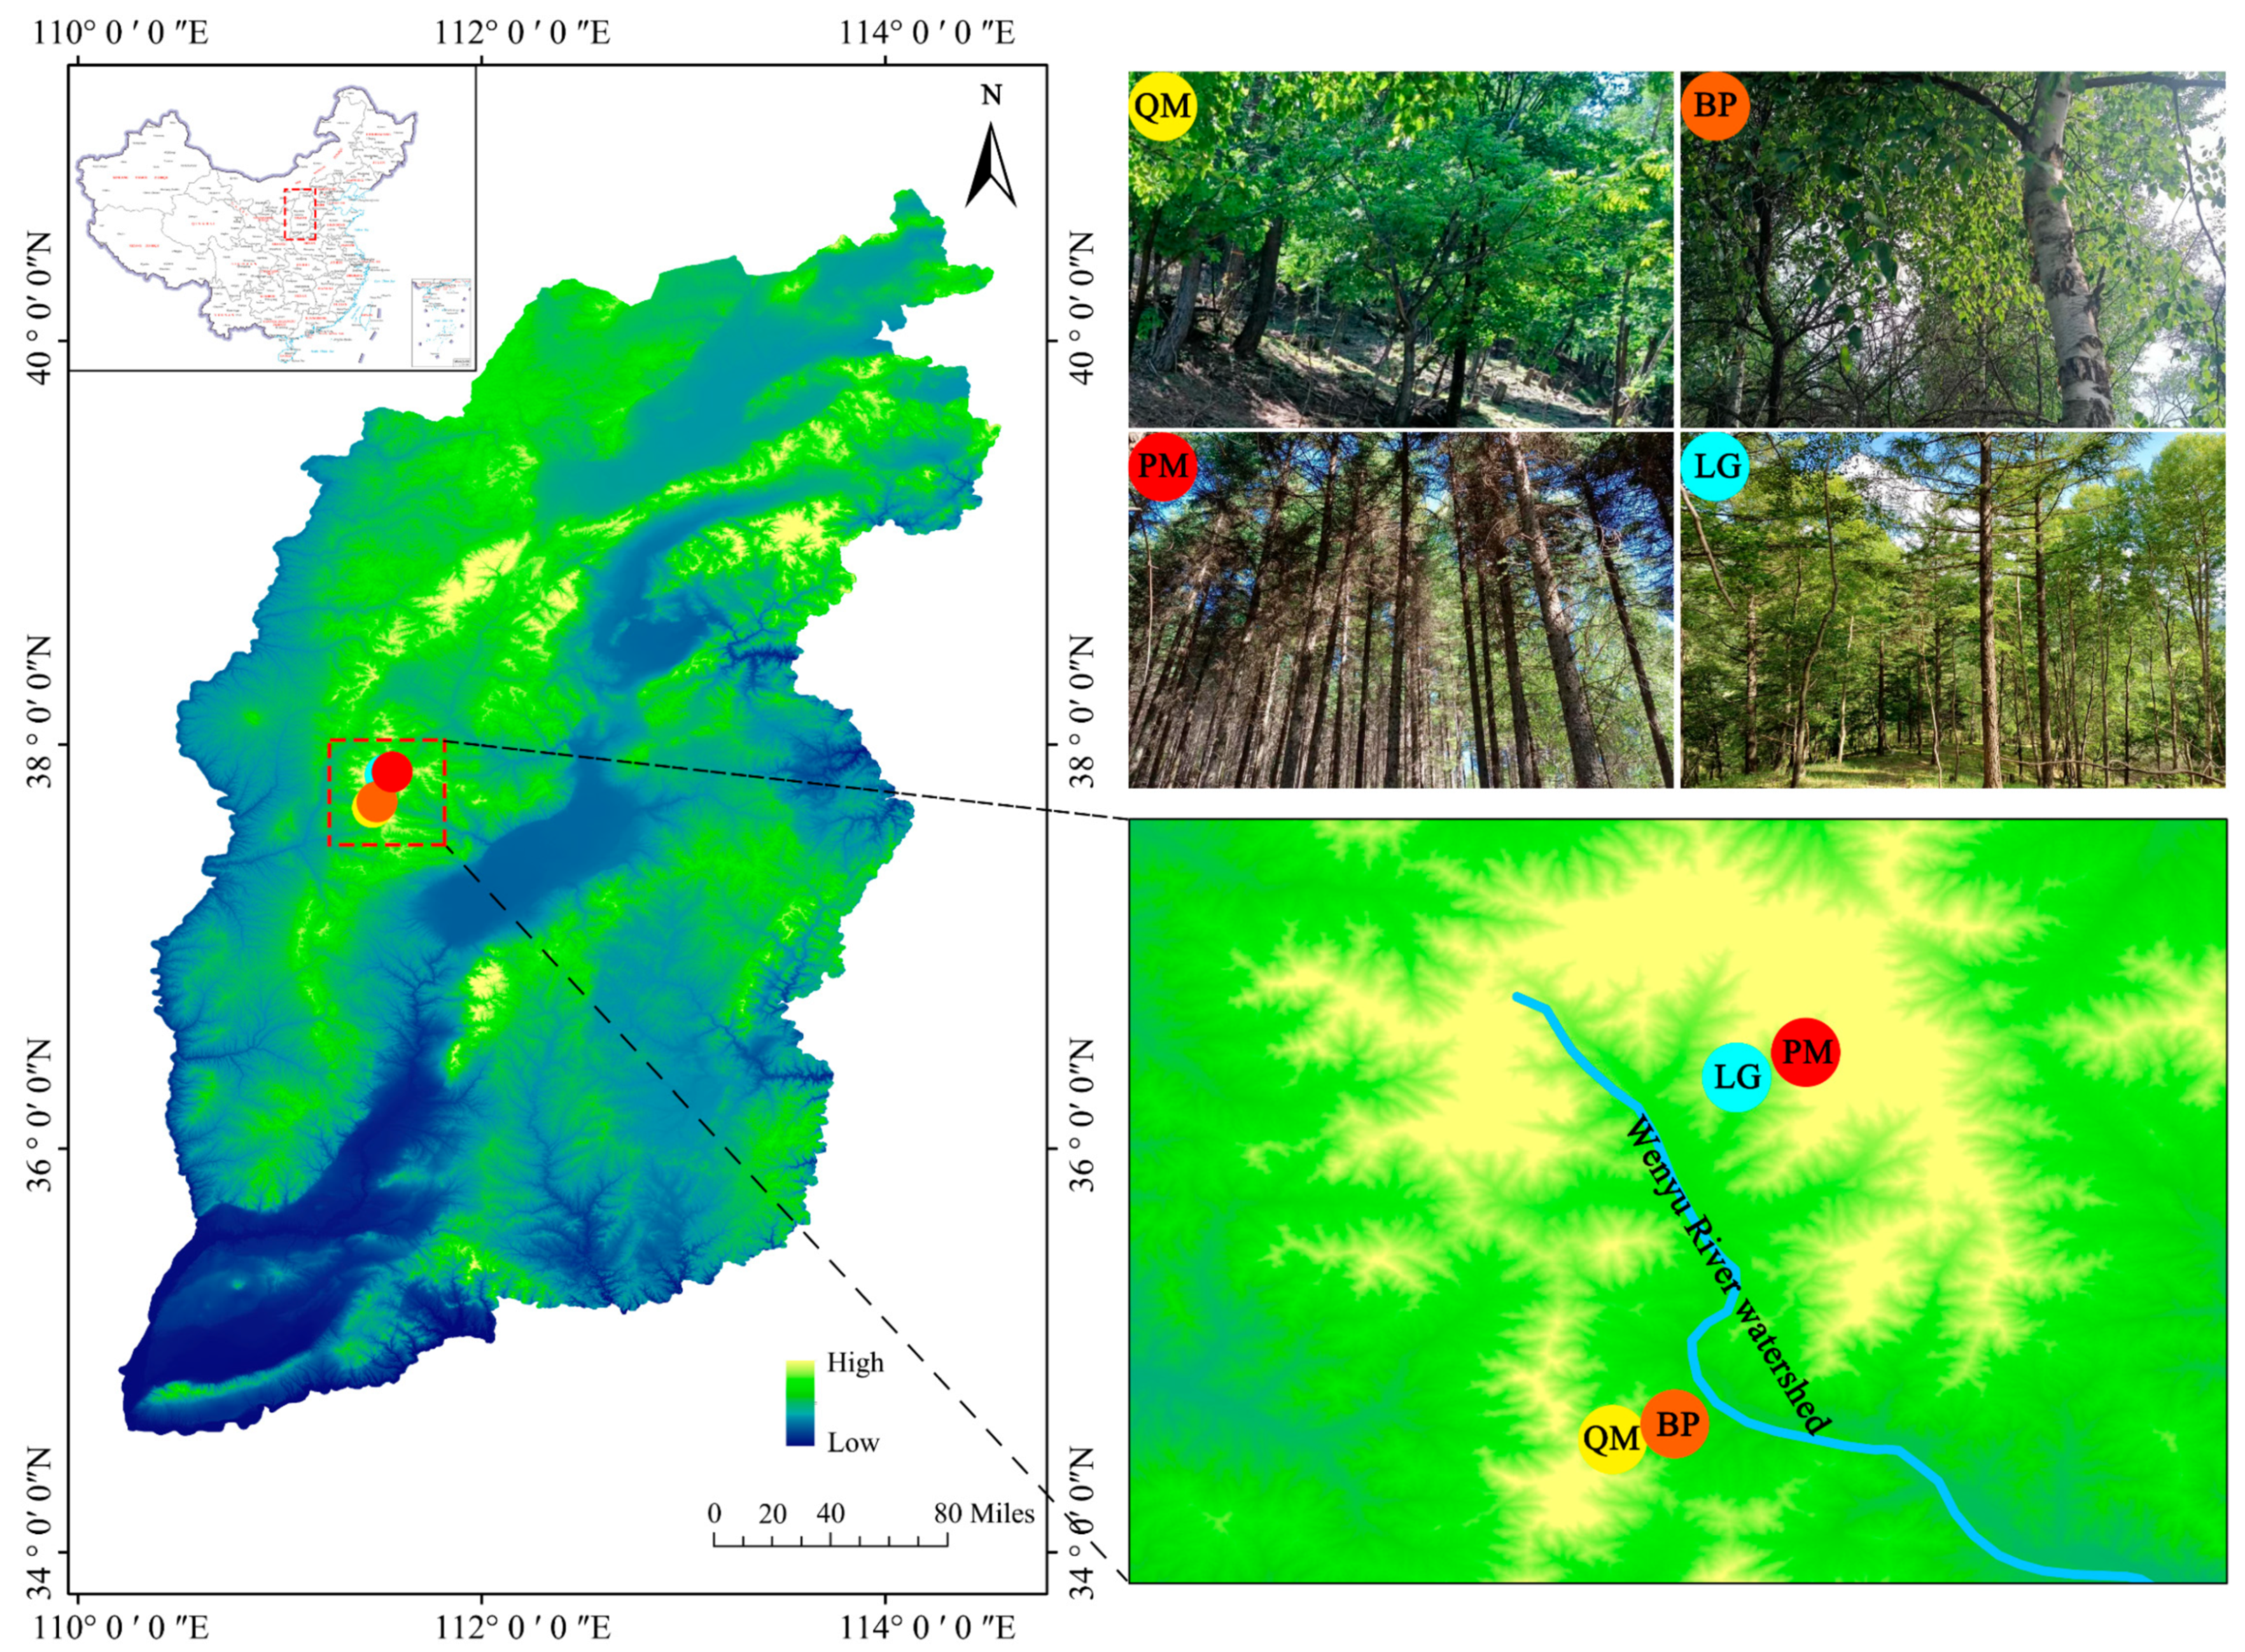
2.1. Study Site

This study was conducted at the Xiaowenshan Forest Farm, located in the Guandishan State Forest Management Bureau, Lvliang City, Shanxi Province, China (111°24′–112°37′ E, 37°41′–37°54′ N). The region has an altitude range of 1345 to 2659 m and is situated in a warm temperate continental monsoon climate zone. It also exhibits higher air humidity, typical of mountain climates, and is characterized by diverse factors, such as altitude, topography, and forest cover [43].

2.2. Experimental Design and Sample Collection

In March 2023, we surveyed the forest communities under the jurisdiction of Xiaowen Mountain Forestry and selected four forest communities as study sites (Figure 1). We used the dominant tree species of each forest community as the study object (QM: Quercus wutaishansea as the dominant species; BP: Betula platyphylla as the dominant species; PM: Picea meyeri as the dominant species; LG: Larix gmelinii var. principis-rupprechtii as the dominant species). The basic information of each study site was recorded, and soil samples were collected using the five-point sampling method to assess the basic properties of the soil. Twelve healthy trees with uniform growth were selected for each study site, which were divided into three treatments: the CK treatment (no N), the N1 treatment (applying N at four times the total N), and the N2 treatment (applying N at six times the total N), with four replicates for each treatment. Trees with different N treatments were spaced more than 5 m apart (Figure S1). Since the total soil N was different in each site, we applied different amounts of N. Details of the basic site information and specific N amounts applied are provided in Table S1.
In June 2023, a localized N addition trial was conducted using the root bag method [44]. We had four study sites with 12 trees per site, totaling 48 target trees. One root bag was buried in each of the four directions of southeast, northwest, and northwest of each target tree, totaling 192 root bags. Each root bag was buried by following the direction of the main root of the target species all the way to find a root system with a diameter of 5 mm and a length of 20 cm. Lateral roots were pruned, and the main roots were placed into nylon root bags with a diameter of 6 cm, a length of 30 cm, and a 2 mm mesh. The root bags for the CK treatment were filled with rootless soil, while those for the N1 and N2 treatments contained a mix of rootless soil and urea. Each root bag is handmade, and there is some variation in size. Basically, it can hold over 480 g of natural soil. The weight of natural soil corresponding to 500 g of air-dried soil was converted according to the soil moisture content of each stand. While digging the root system, the excavated soil was collected in a tray. After removing stones, fallen leaves, and roots from the natural soil, the weight of urea needed per 1 kg of natural soil was calculated based on the nitrogen concentration we set for each nitrogen treatment at each study site. The urea was weighed using a portable electronic scale and then mixed well with the natural soil and packed into root bags. All root bags were operated in this manner for nitrogen addition.
In October 2023, the root bags were collected from the study site. The four root bags from around each tree were combined into a single sample, resulting in 48 samples in total. Roots and soil were separated for each sample. Part of this soil was used for the determination of soil properties and enzyme activities, and the other part was used for microbial DNA extraction.

2.3. Root Analysis

The collected root samples were placed in white trays with deionized water at 1 °C after being gently cleaned with the water. The root grading method was based on the Pregitzer et al. [45] method. We specifically looked at level 1 and level 2 roots, also referred to as absorbing roots [46]. Because this portion of the root is particularly susceptible to variations in the availability of soil resources [19]. After being flattened down in a transparent plastic container with distilled water, the absorbing roots were scanned at 300 dpi using an Epson Perfection V700 Photo scanner (Epson, Nagano, Japan). The root samples were scanned, dried for 48 h at 60 °C in an oven, and then weighed using an electronic balance (accuracy 0.0001 g) to calculate the root mass (RM). Using WinRHIZO (Regent Instruments, Quebec, QC, Canada), the scanned pictures were examined in order to determine the absorbing roots’ mean diameter, total length, total volume, and root surface area. Specific root length (SRL), which is the ratio of root length to root dry weight; specific root area (SRA), which is the ratio of root surface area to root dry weight; and root tissue density (RTD), which is the ratio of root dry weight to root volume, were computed based on these parameters’ values.

2.4. Soil Properties

Total nitrogen, ammonium nitrogen, nitrate nitrogen, pH, soil organic matter, total phosphorus, and bioavailable phosphorus were measured using the techniques outlined in the soil agrochemical analysis [47]. The steps were exactly as follows: To ascertain the soil’s moisture content (water), the drying process was employed. A pH meter was used to measure the pH of the soil at a ratio of 1:2.5 (w/v) to water; the soil organic carbon (SOC) was determined using the external heating method with potassium dichromate in an oil bath; the total nitrogen (TN) was analyzed using the Kjeldahl method; the nitrate nitrogen (NO3-N) was measured using the phenol disulfonic acid colorimetric method; the ammonium nitrogen (NH4+-N) was measured using the 2M KCl leaching indophenol blue colorimetric method; the molybdenum antimony colorimetric method was used to determine the total phosphorus (TP); and the sodium bicarbonate extraction method was used to determine the available phosphorus (AP).
Soil alkaline phosphatase activity was measured using the disodium phenyl phosphate colorimetric method, following the protocol from the Edison Soil Alkaline Phosphatase Kit (Yancheng, China) [48]. Soil urease activity was determined via the sodium phenol-sodium hypochlorite colorimetric method using the Edison Soil Urease Kit (Yancheng, China) [49,50]. Soil β-glucosidase activity was measured using the p-nitrophenol method [51].

2.5. Analysis of Soil Microbial Communities

2.5.1. DNA Extraction, Amplification, and Sequencing DNA

Following the manufacturer’s instructions, DNA was extracted from soil samples using the OMEGA Soil DNA Kit (M5635-02, Omega Bio-Tek, Norcross, GA, USA). Reverse primer 806R (5′-GGACTACHVGGGTWTCTAAT-3′) and forward primer 338F (5′-ACTCCTACGGGAGGCAGCA-3′) were used to amplify the bacterial 16S rRNA gene V3–V4 region by PCR. Fungal DNA amplification was performed using the primers ITS5F (5′-GGAAGTAAAAGTCGTAACAAGG-3′) and ITS1R (5′-GCTGCGTTCTTCATCGATGC-3′). The PCR products were subjected to 2% agarose gel electrophoresis, and the target fragments were extracted and recovered using an Axygen Gel Recovery Kit (Invitrogen, Carlsbad, CA, USA). The measurement was carried out using a microplate reader (BioTek, FLx800, Winooski, VT, USA) and the Quant-iT PicoGreen dsDNA Assay Kit (Invitrogen, Carlsbad, CA, USA). Samples were pooled as needed for sequencing, and paired-end 2 × 250 bp sequencing was carried out on the Illumina NovaSeq platform using NovaSeq 6000 SP kits (500 cycles) at Shanghai Personal Biotech (Shanghai, China).

2.5.2. Bioinformatic Analysis

The demux plugin was used to demultiplex raw sequence data, and cutadapt was used to trim primers [52]. The DADA2 plugin was used to quality-filter, denoise, combine, and eliminate chimeras from the sequences [53]. By eliminating low-abundance sequences, compensating for PCR amplification mistakes, and denoising the amplicon data—which is comparable to 100% similarity clustering—amplicon sequence variants (ASVs) were produced. By comparing the ASVs to reference databases, UNITE (version 8.0) for fungus and SILVA (release 132) for bacteria, taxonomic assignment was carried out. Using QIIME2 software v.2024.10, diversity indices, such as Chao1 and Shannon, were computed. The FUNGuild database for soil fungi and the FAPROTAX database for bacterial taxa were used for functional studies [54,55].

2.6. Statistical Analysis

Data analysis was conducted using R v4.2.3. The effects of N treatments and tree species on dominant phyla, dominant genera, and alpha diversity indices were analyzed using ANOVA and non-parametric tests. For data that conformed to normal distribution, ANOVA was used. After the data were transformed by log10 and sqrt and still did not conform to normal distribution, non-parametric tests were chosen. Non-metric multidimensional scaling (NMDS) analysis and visualizations were performed using the vegan and ggplot2 packages to evaluate sample repeatability and group distances, with multivariate analysis of variance applied for statistical testing. To reduce complexity, ASVs with an average relative abundance of less than 0.01 percent and with an occurrence of more than 20 percent in all samples were filtered out. Pairwise Spearman correlations between ASVs were calculated using corAndPvalue function The pairwise Spearman’s correlations between ASVs were calculated, with a correlation coefficient > |0.6| and a p < 0.01 (Benjamini–Hochberg-adjusted p value) being considered as a valid relationship. The network was visualized with Gephi 0.9.2 software, incorporating metrics such as the number of nodes, connections, network density, and clustering coefficients. Network complexity was assessed using the formula: complexity = (Xraw − Xmin)/(Xmax − Xmin), where Xraw represents the original topological attribute, and Xmin and Xmax represent the minimum and maximum values of a particular topological attribute across all network graphs. Network robustness was evaluated by randomly removing 50% of the class groups based on maximum node vulnerability [56]. We selected seven soil parameters (pH, SOC, TN, NO3-N, NH4+-N, TP, and AP) and three soil enzyme activities (ALP, BG, and UE) to describe soil multifunctionality. To assess the multifunctionality of the soil, we calculated the Z-score for each variable and then used the mean value method to obtain the multifunctionality index [57]. Randomized forests were used to explore soil properties important for soil multifunctionality, soil microbial dominance phylum, and soil α-diversity.

3. Results

3.1. Effects of N Treatments and Tree Species on Soil Properties, Soil Enzyme Activities, and Root Morphology

We found that N treatments had a considerable impact on NO3-Nand NH4+-N. Tree species had a significant effect on water, pH, SOC, TN, TP, and BG. N treatments and tree species had significant effects on UE, ALP, RD, SRL, SRA, and RTD. Tree species and interactions had a significant effect on AP. SM was affected by N treatment, tree species, and interactions (Table 1). NH4+-N, NO3-N, and SM were all highest in the N2 treatment, followed by the N1 treatment, and smallest in the CK treatment. For soil enzyme activities, N addition increased UE and decreased ALP. For absorbing root morphology traits, N addition increased RD and RTD and decreased SRL and SRA. In addition, with the exception of NH4+-N and NO3-N, other soil properties, soil enzyme activities, and absorbing root morphology traits were significantly different among the tree species (Table S2).

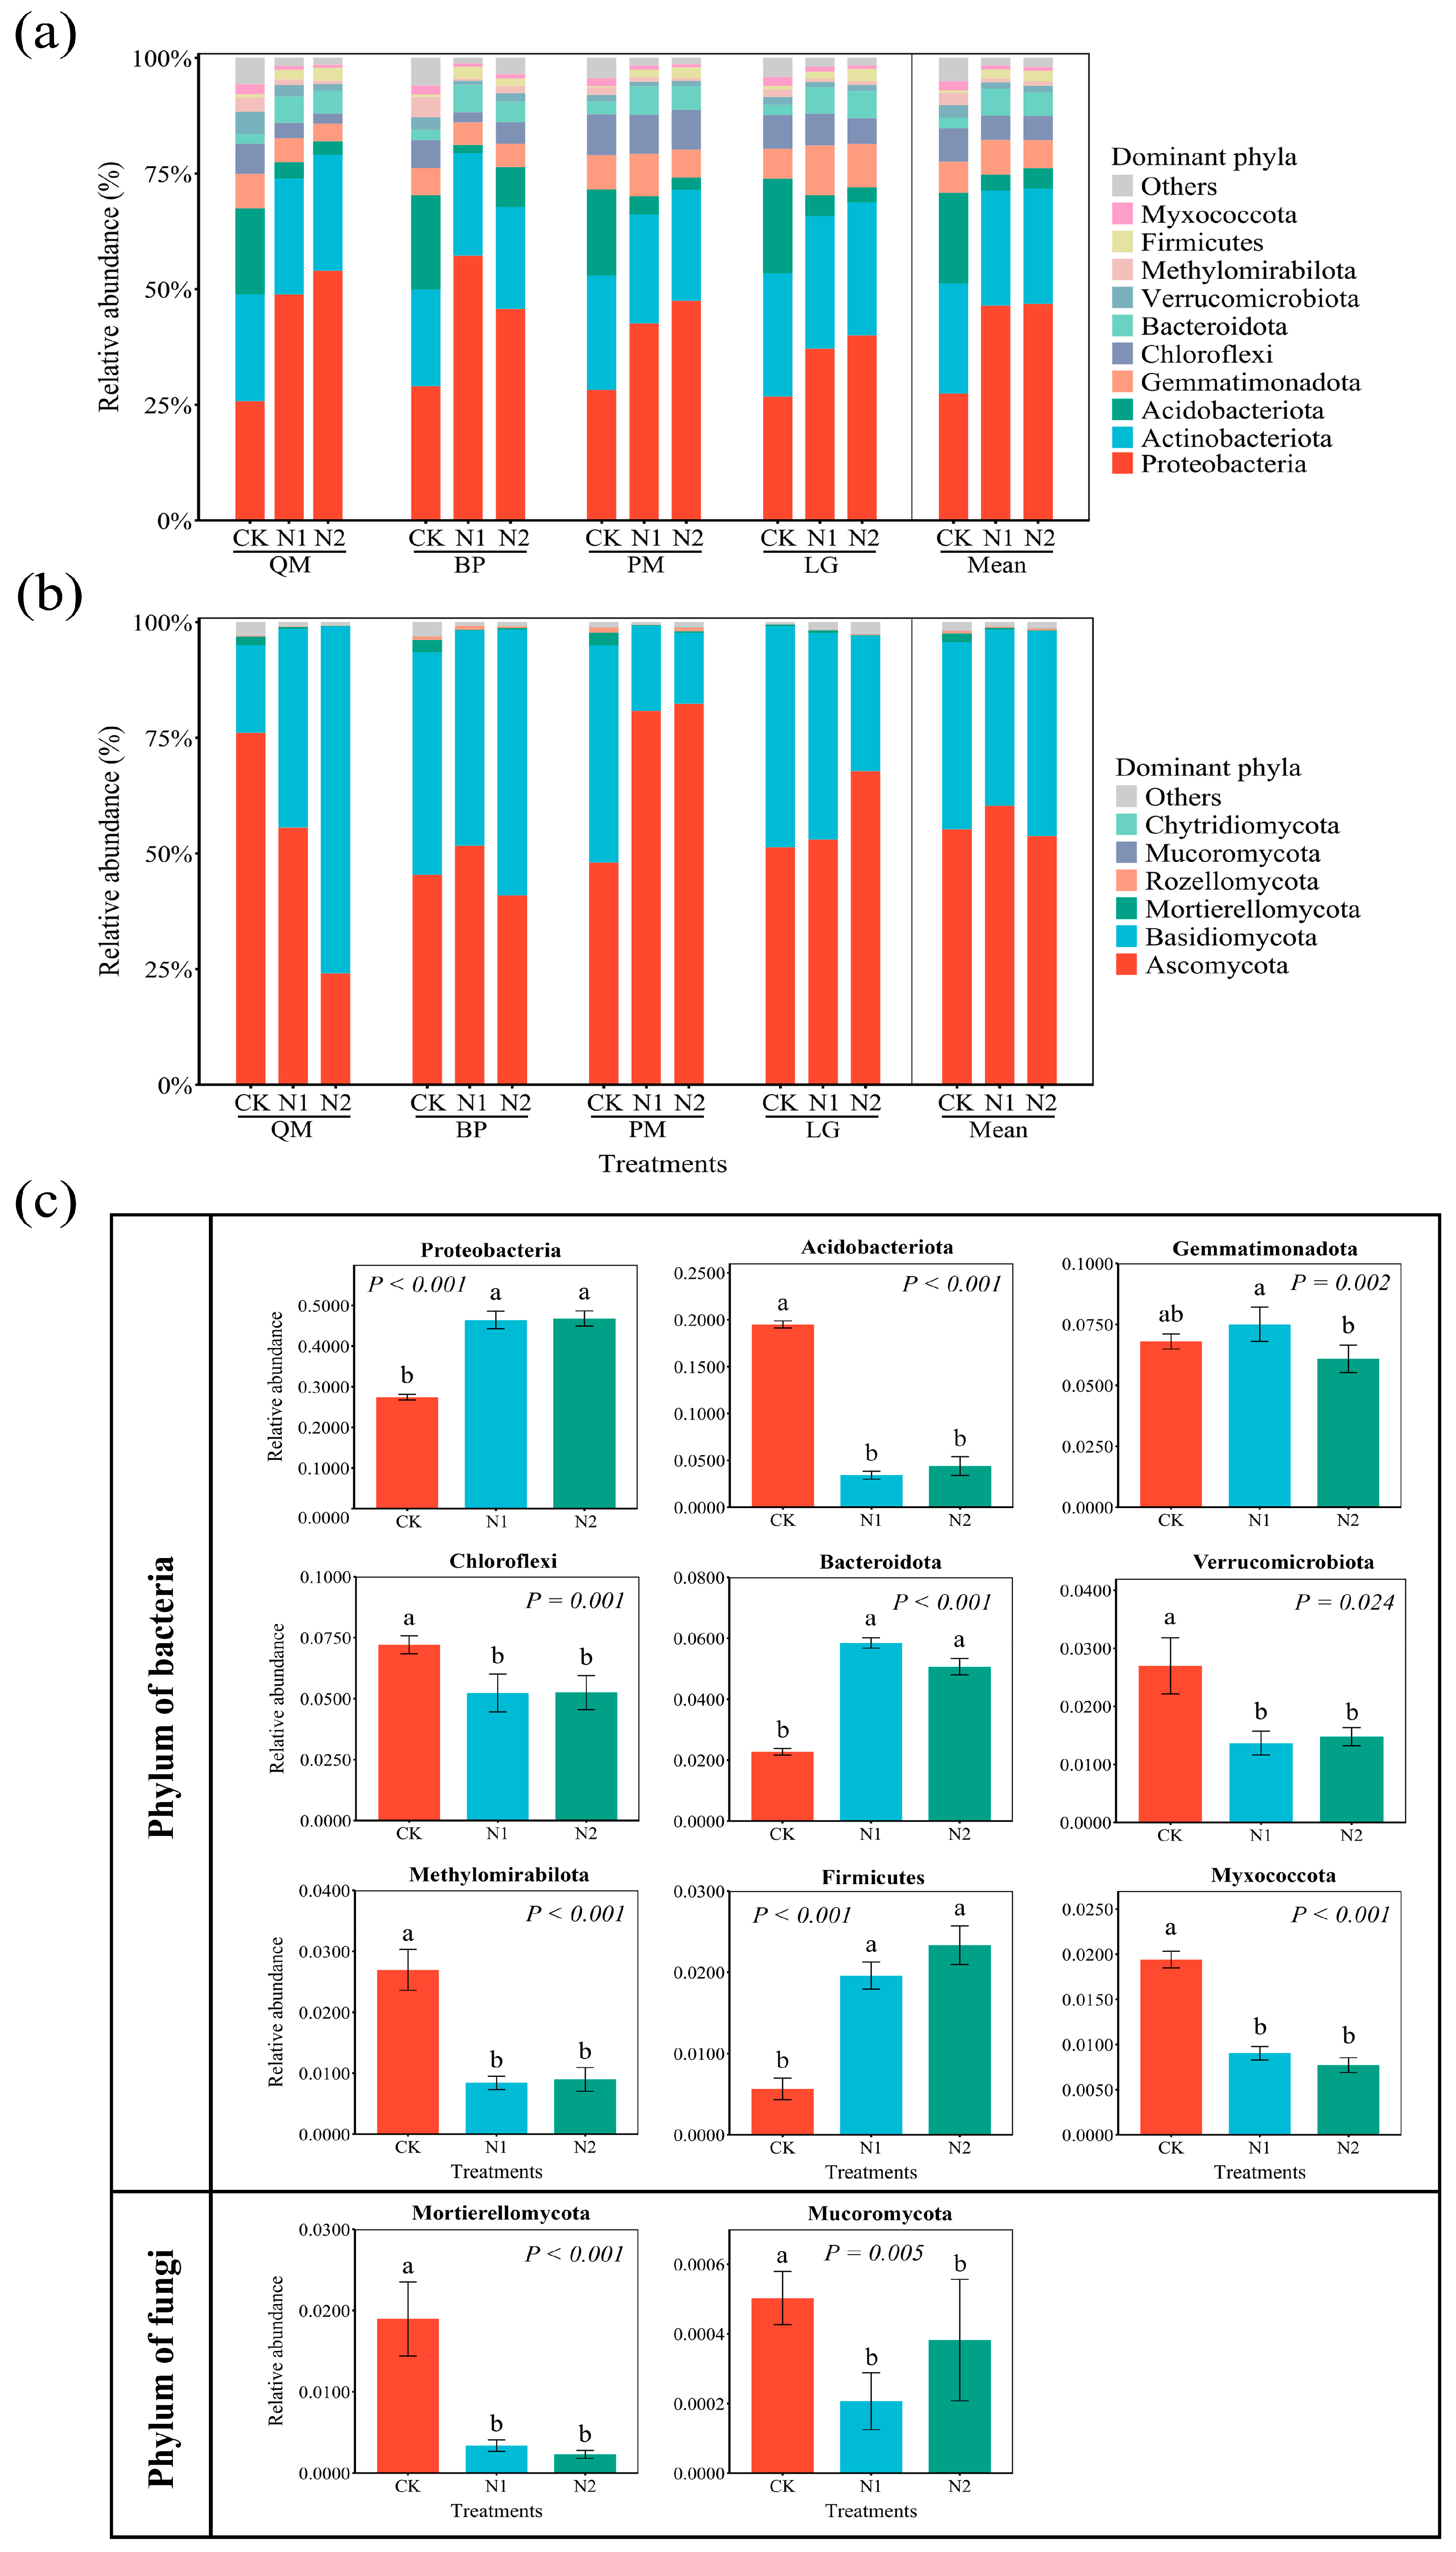
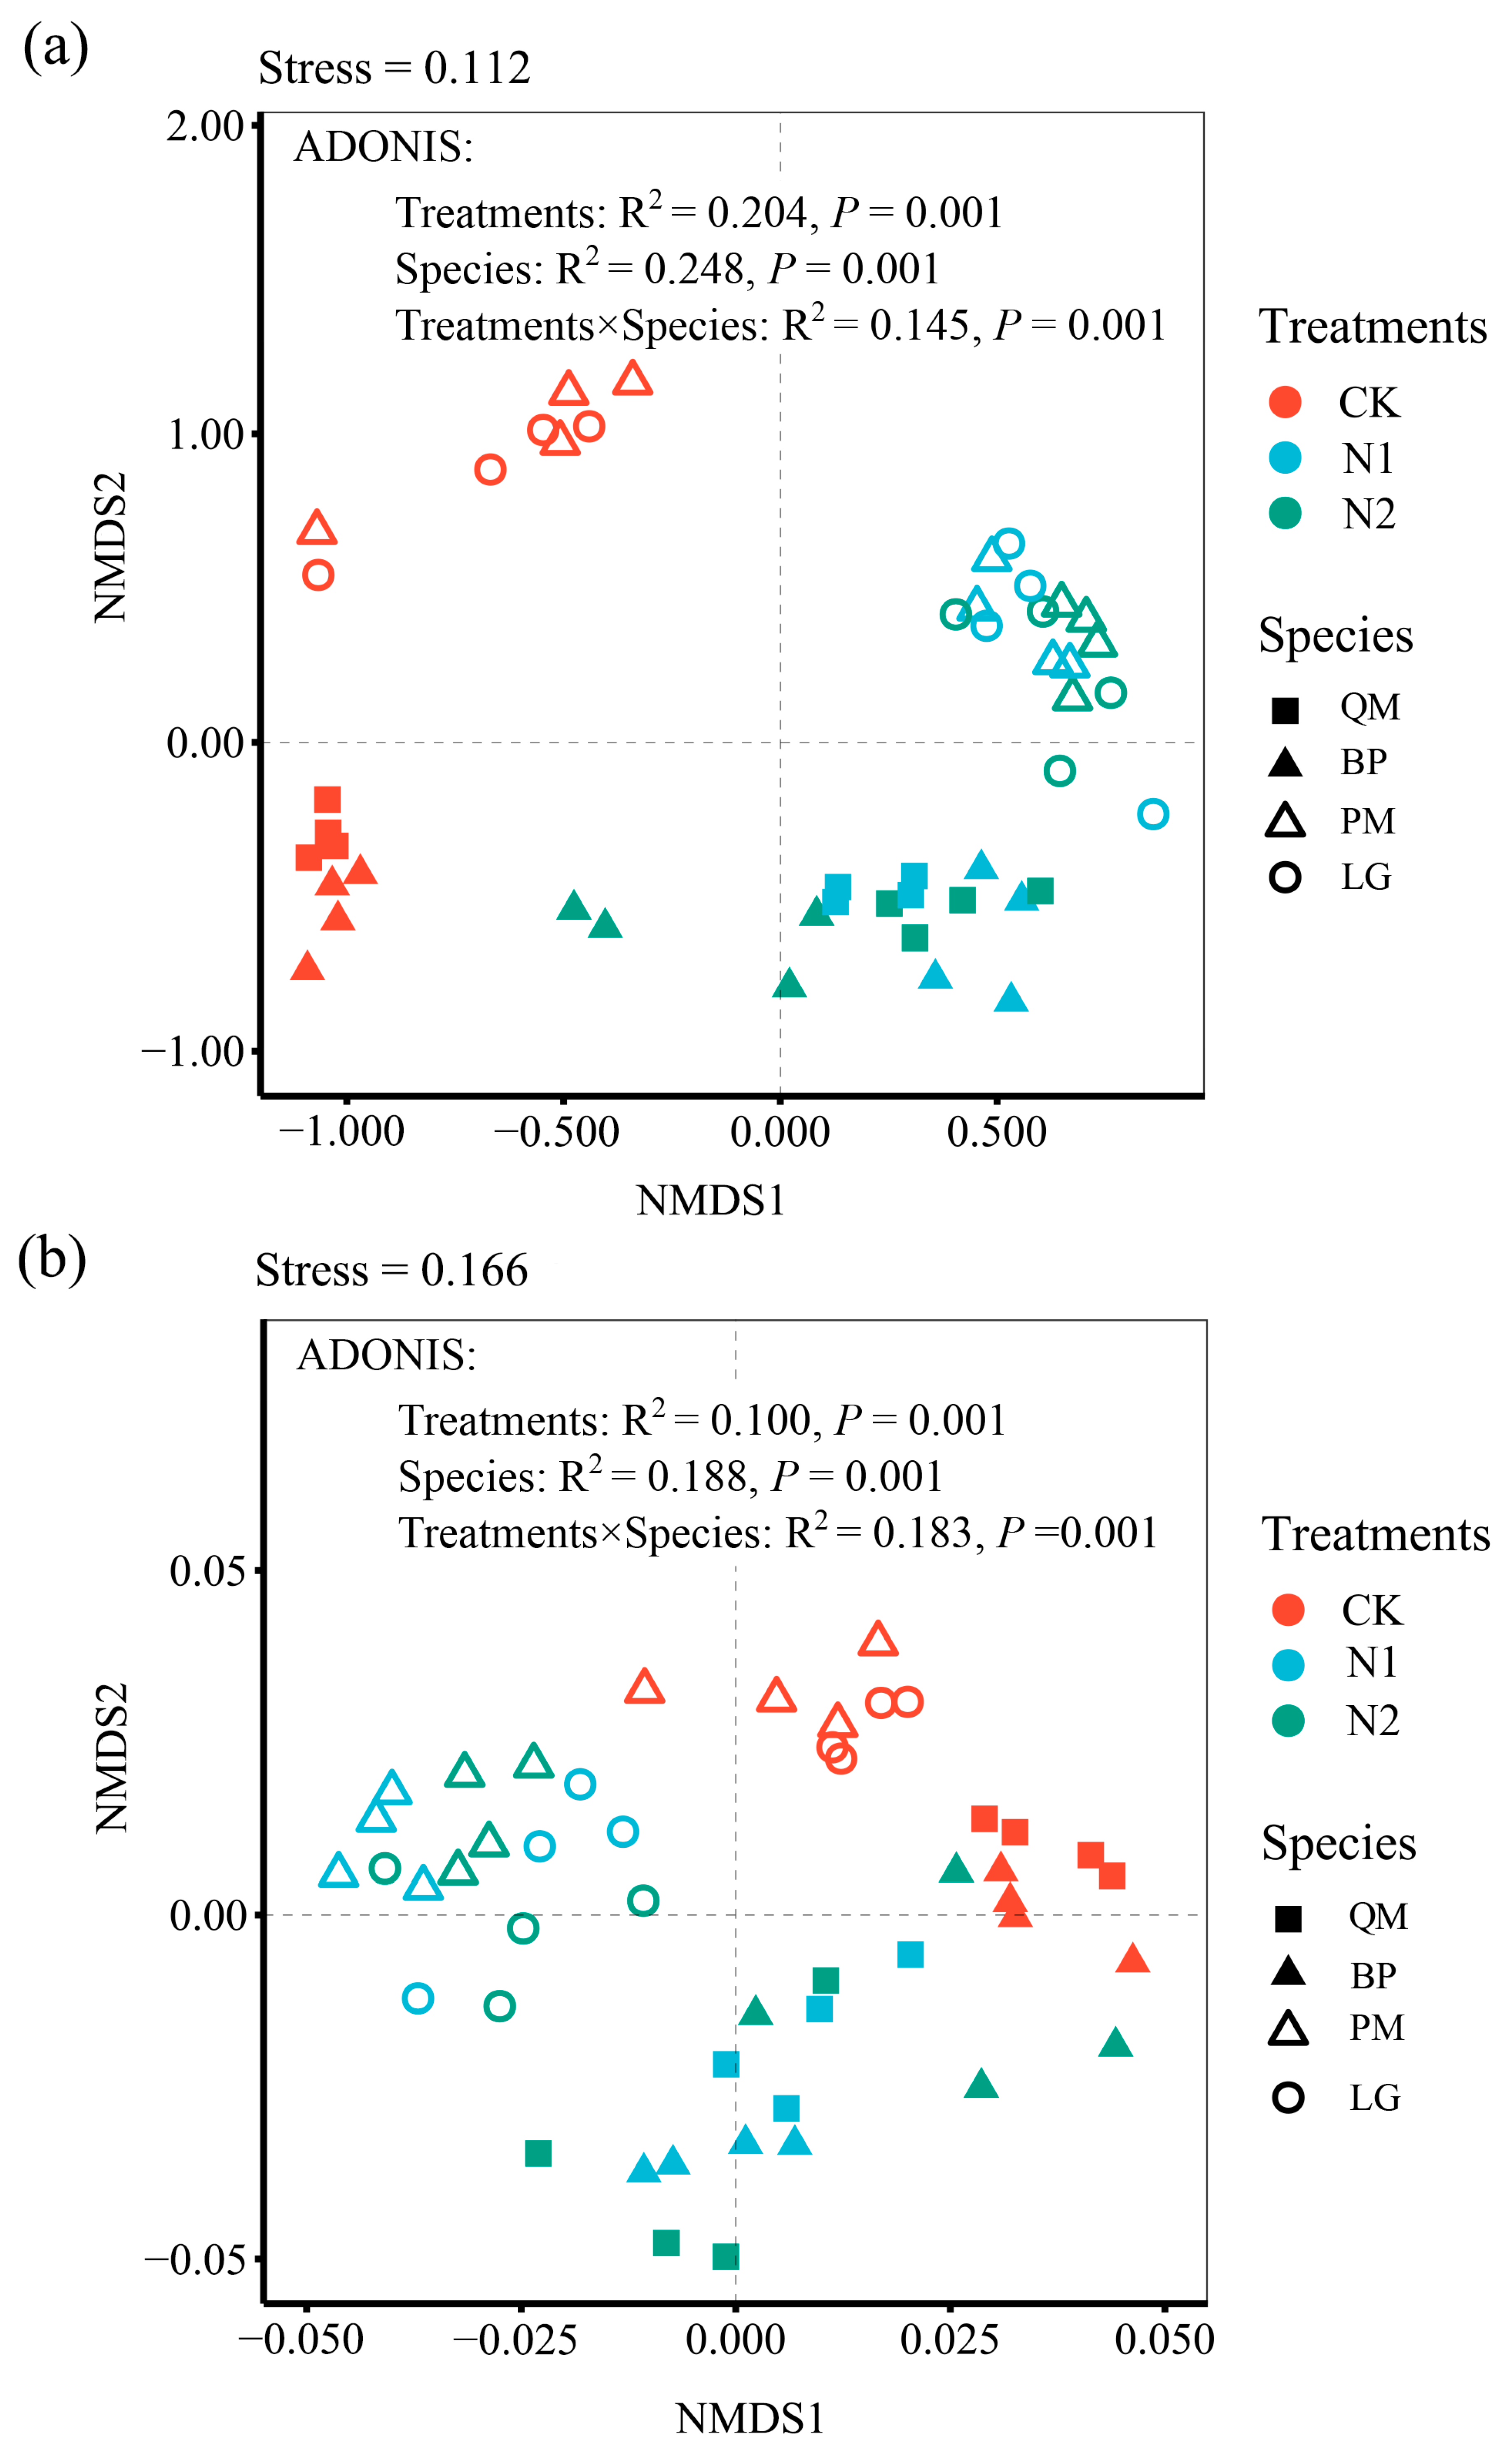
3.2. Impact of N Addition on Microbial Community Structure

The main effects of N treatment and tree species, and their interactions, had significant effects on the relative abundance of dominant bacteria and fungi (Table S3). For bacteria, Proteobacteria, Gemmatimonadota, and Chloroflexi were affected by N treatment, tree species, and interactions. Verrucomicrobiota was affected by N treatment and tree species. Methylomirabilota was affected by N treatment and tree species interactions. Acidobacteriota, Bacteroidota, Firmicutes, and Myxococcota were affected by N treatments. Actinobacteriota was affected by tree species. For fungi, Ascomycota and Basidiomycota were affected by tree species and the interaction of N treatment and tree species. Mortierellomycota was affected by N treatment and the interaction of N treatment and tree species. Mucoromycota was affected by N treatment.
In this study, microbial taxa at the gate level were selected to demonstrate the species composition of different tree species and N addition treatments (Figure 2a,b). For bacteria, changes in the relative abundance of dominant phyla of each tree species were similar under N treatment. The relative abundance of Proteobacteria, Bacteroidota, and Firmicutes for each tree species increased after N treatment, and the relative abundance of Acidobacteriota, Methylomirabilota, Myxococcota, and Verrucomicrobiota decreased. The relative abundance of the fungal dominant phyla was high for Ascomycota and Basidiomycota. The relative abundance of Ascomycota and Basidiomycota for each tree species was less similar under N treatments. The relative abundance of Ascomycota increased after N treatment in PM and LG and decreased after N treatment in Basidiomycota. The relative abundance of Ascomycota decreased after N treatment in QM and increased after N treatment in Basidiomycota. We focused on the dominant phylum that changed significantly under N treatment. Proteobacteria, Bacteroidota, and Firmicutes exhibited increased relative abundance under N1 and N2 treatments compared to the CK, while Acidobacteriota, Chloroflexi, Verrucomicrobiota, Methylomirabilota, and Myxococcota decreased. Gemmatimonadota showed the highest relative abundance in the N1 treatment, intermediate levels in CK, and the lowest in N2 (Figure 2c). For fungi, the relative abundances of Mortierellomycota, and Mucoromycota significantly decreased under N treatments (Figure 2c).
N treatments and tree species and their interaction have an effect on the relative abundance of dominant genera (Table S4). For bacterial dominant genera, Gemmatimonas, Vicinamibacteraceae, IMCC26256, and Gaiella, Candidatus_Udaeobacter were affected by N treatment, tree species, and interactions. Sphingomonas, Mycobacterium, Devosia, Rhodanobacter, MB-A2-108, SC-I-84, and KD4-96 were affected by N treatment and tree species. Devosia, Rhodanobacter, MB-A2-108, SC-I-84, and KD4-96 were affected by N treatment and tree species. Brevundimonas, Galbitalea, Nitrosospira, Pedobacter, and RB41 were affected by N treatment. JG30-KF-CM45 were affected by tree species. For the fungal dominant genera, Pseudogymnoascus was affected by N treatment, species, and interactions. Mycochlamys was affected by N treatment and species. Oidiodendron, Sebacina, and Peziza were affected by species and interactions. Leptodontidium, Acaulium, and Inocybe were affected by N treatment. Hebeloma and Suillus were affected by tree species.

3.3. Effects of N Treatments and Tree Species on Microbial Diversity

The Shannon index of bacteria and fungi is affected by N treatments and interactions (Figure 3a). The Chao1 indices of bacteria and fungi is affected by N treatments, tree species, and interactions (Figure 3b). Overall, the diversity indices of all tree species tended to decrease after N treatment compared to CK treatment. We focused on the differences in these two indices between N treatments. The Shannon and Chao1 indices of bacteria and fungi were significantly lower in N1 and N2 treatments compared to CK treatment, while there was no significant difference between N1 and N2 treatments. Petal plots showed reduced unique ASVs in N1 and N2 treatments compared to CK (bacteria: 49.9% lower in N1 and 45.9% lower in N2; fungi: 54.9% lower in N1 and 52.7% lower in N2), indicating a shift in microbial community composition due to N addition (Figure S2).
An NMDS analysis of Bray-Curtis distances demonstrated the significant separation of bacterial and fungal communities between N treatments and CK, with no significant difference between N1 and N2 treatments (Figure 4). ADONIS results supported these findings, indicating significant differences between CK and both N1 and N2 treatments (p < 0.01), but no significant difference between N1 and N2 (bacteria: p = 0.457; fungi: p = 0.786) (Table S5). In addition, tree species and the interaction between tree species and N treatments had an effect on the microbial community.

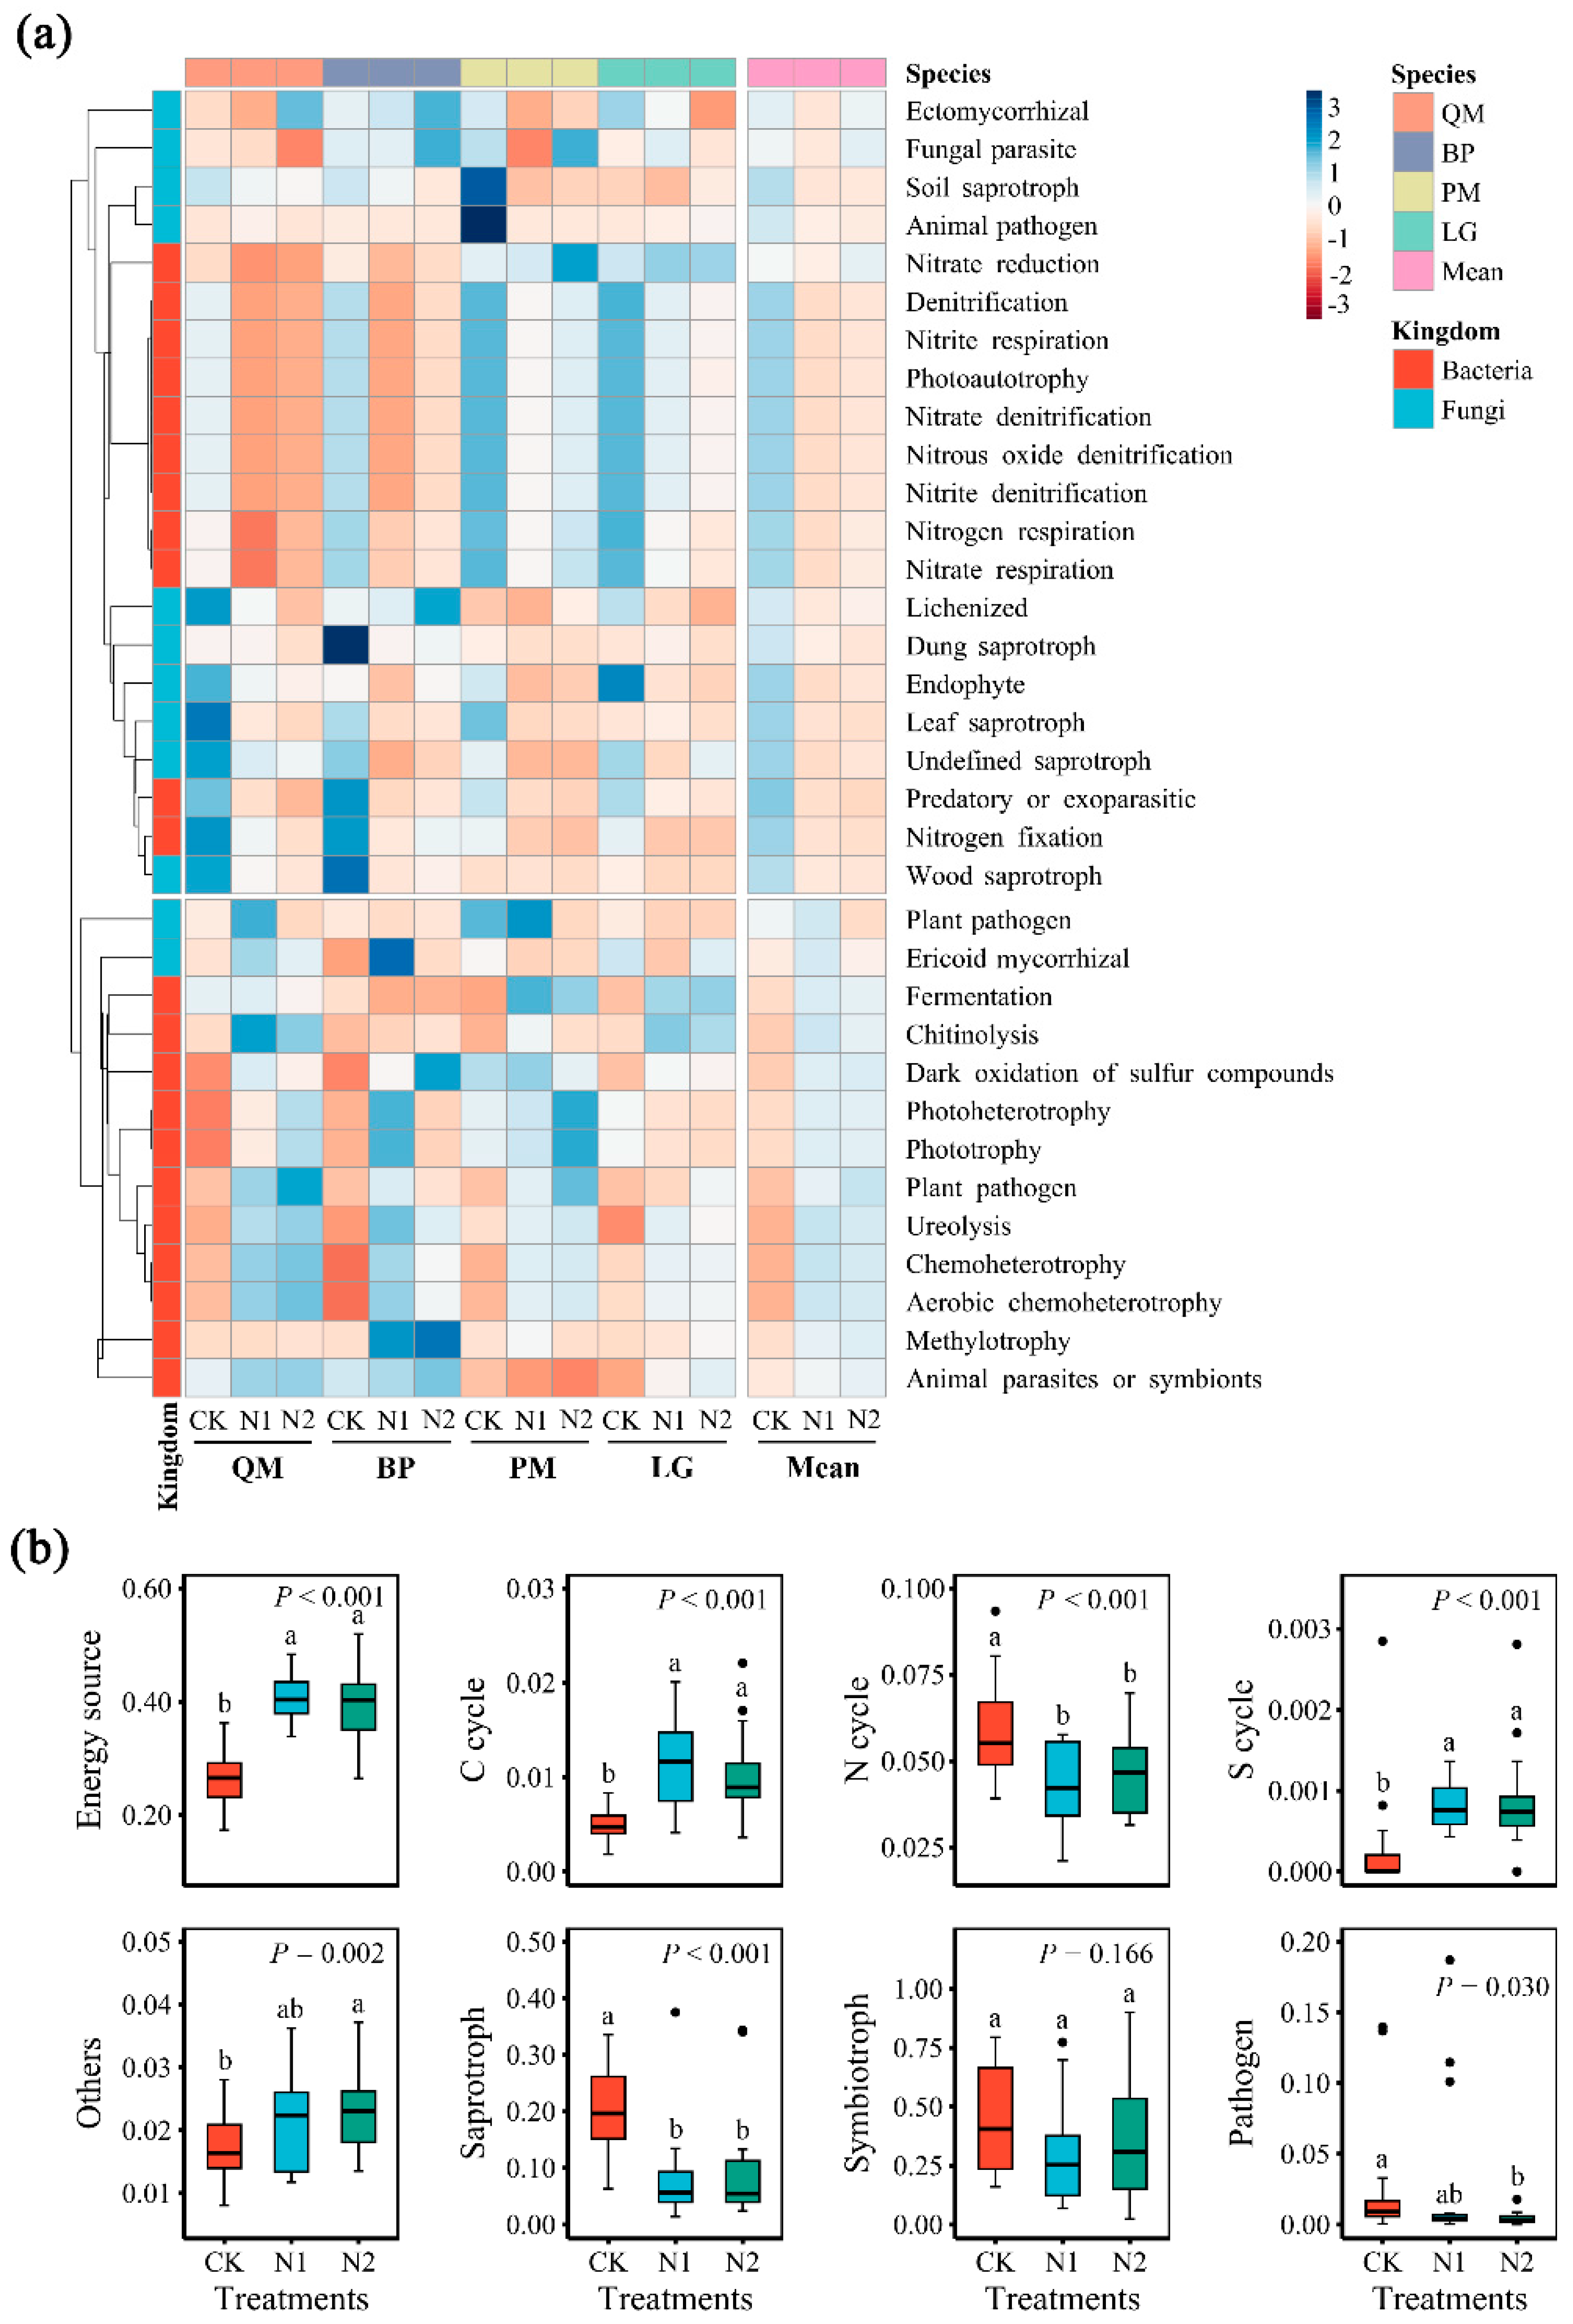
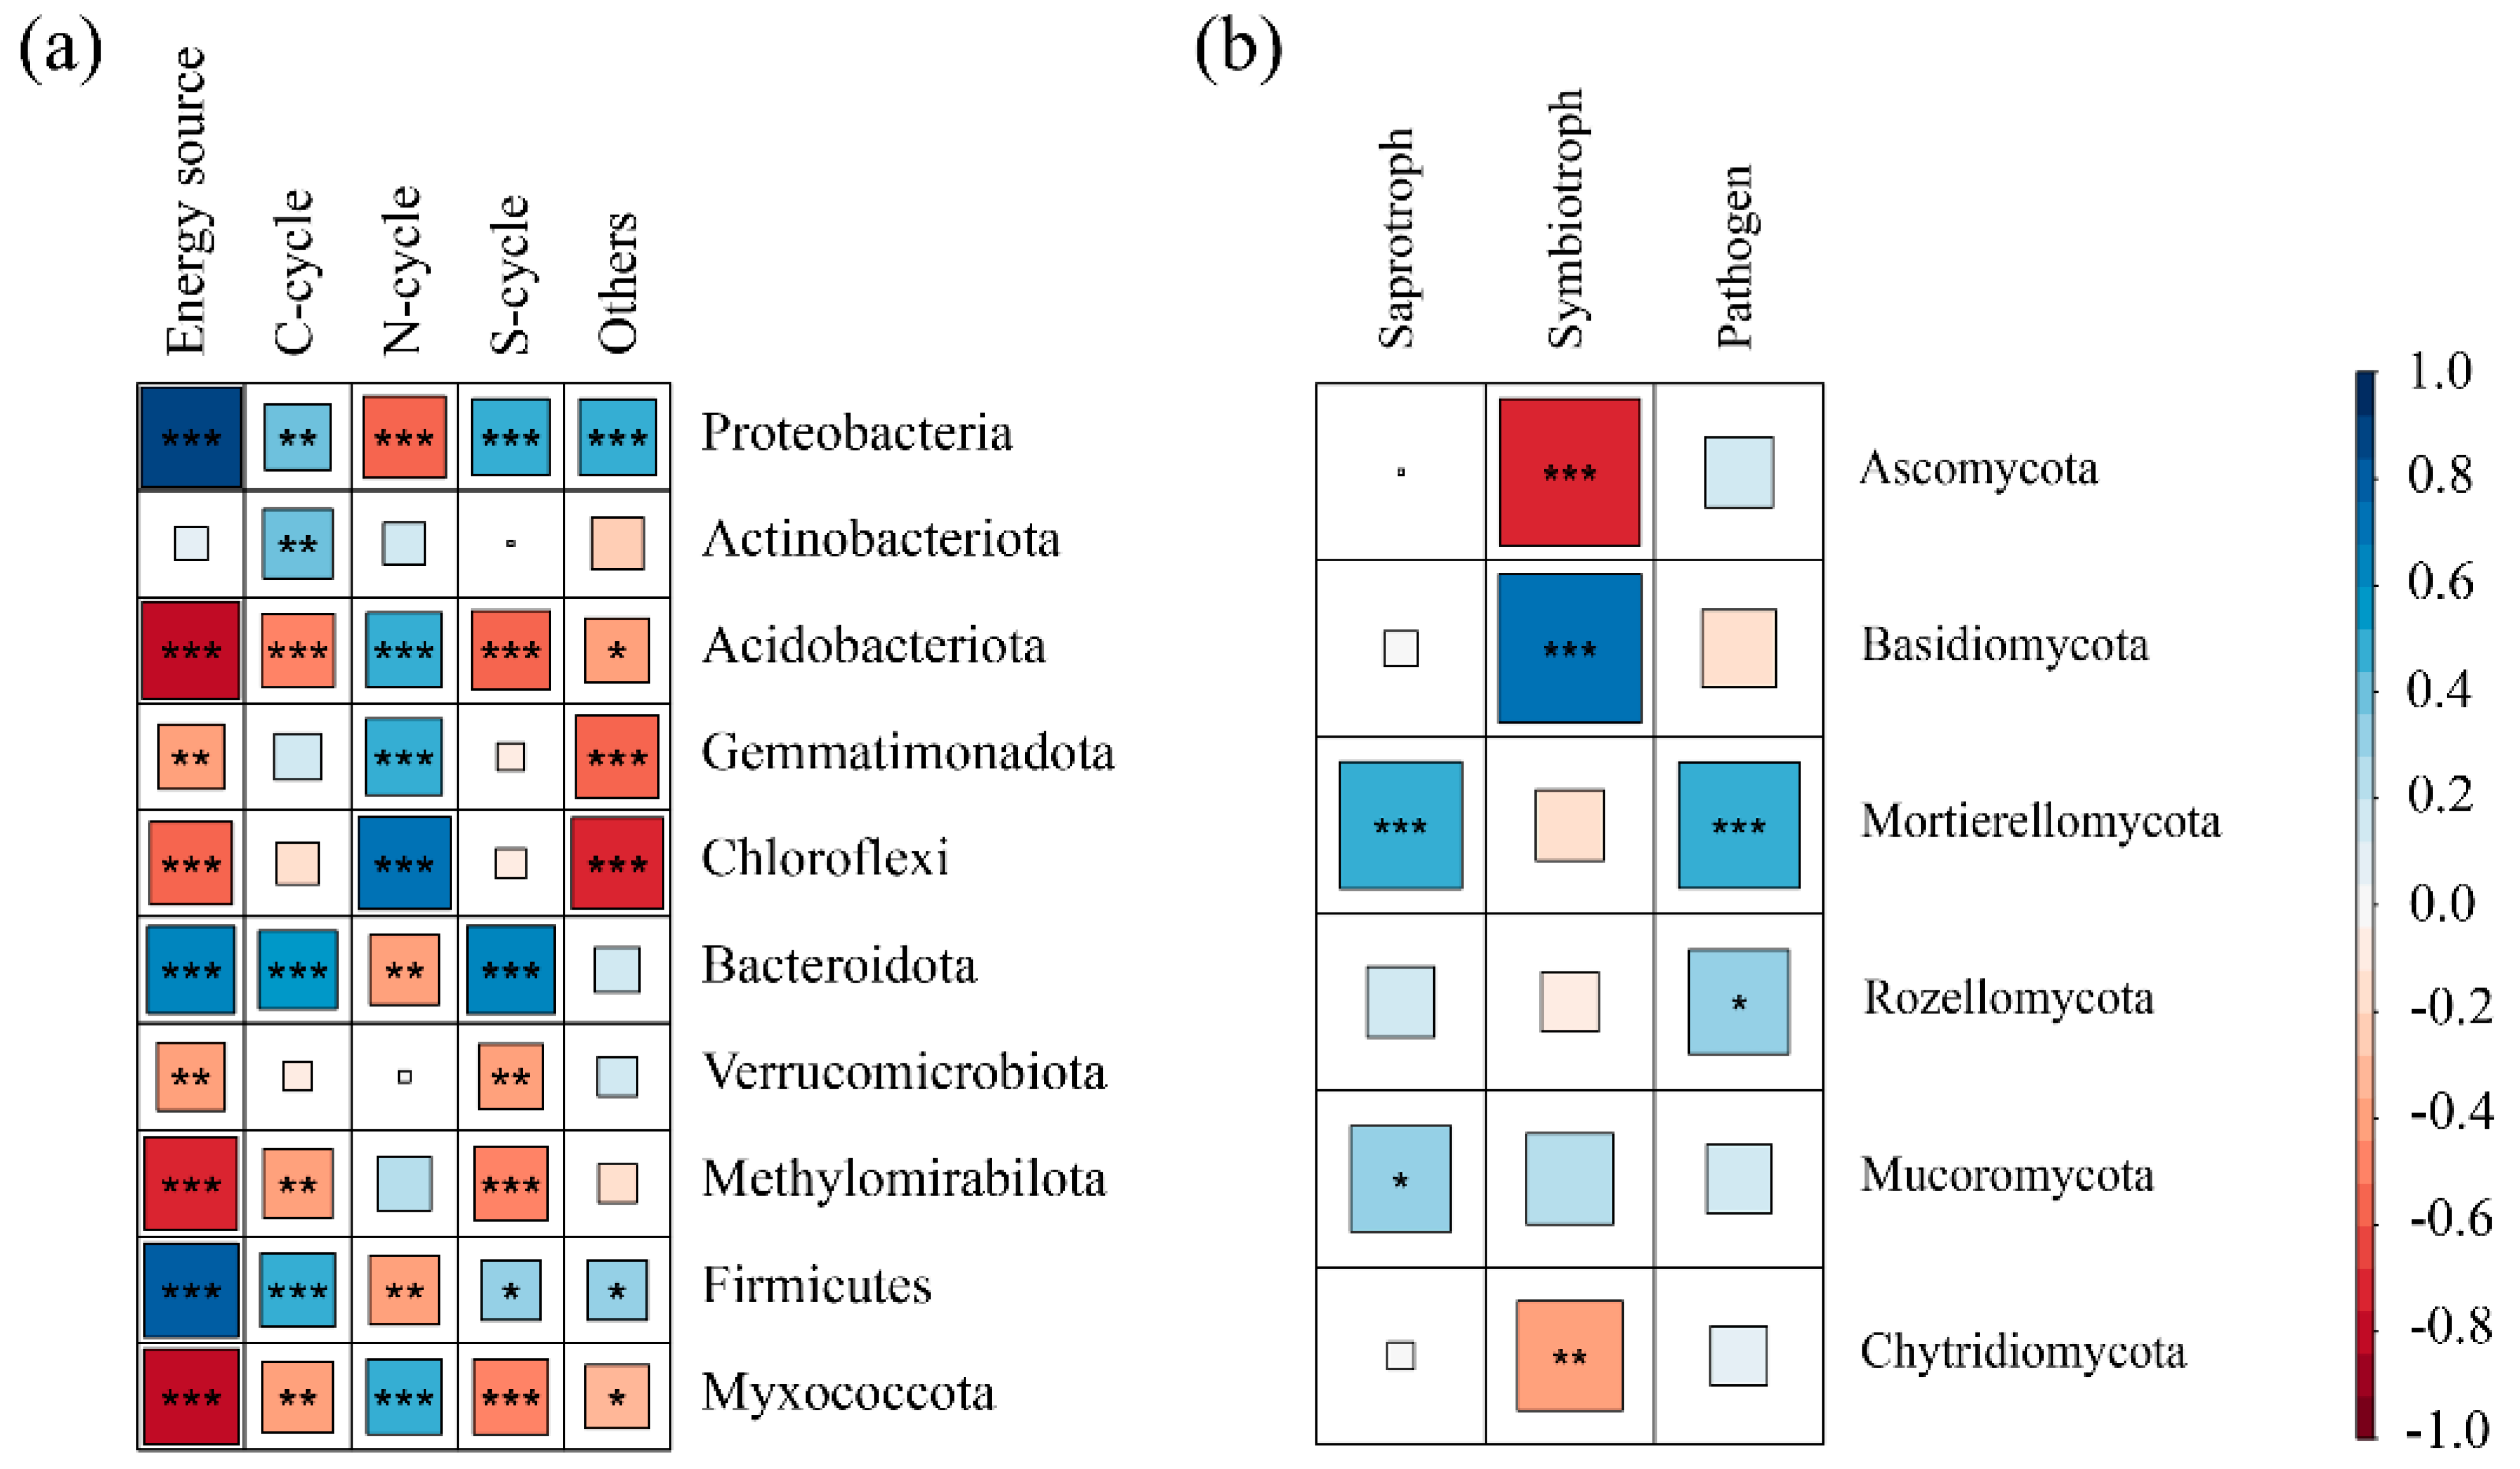
3.4. Changes in the Relative Abundance of Microbial Community Functions and the Relationship Between Function and Dominant Phyla

Functional analysis using the FAPROTAX database for bacteria and the FUNGuild database for fungi revealed changes in functional abundance due to N addition. Functions were clustered (Figure 5a), and we found that the relative abundance content of soil microbial functions of each tree species varied among the N treatments; however, the relative abundance of most soil microbial functions of each tree species had similar trends among the N treatments. Changes in the relative abundance of most functions in response to N treatment can be categorized into two types of trends: those in which the relative abundance of a function decreases after N treatment and those in which the relative abundance of a function increases after N treatment.
All functions of bacteria are classified into five categories: energy sources, C cycle, N cycle, S cycle, and others. All functions of fungi are classified into three categories: saprotroph, symbiotroph, and pathogen. Energy sources was affected by N treatment, tree species, and interactions. C cycle, N cycle, and others were affected by N treatments and tree species. S cycle, pathogen, and saprotroph were affected by N treatments. Symbiotroph was affected by the interaction (Table S6). Focusing on the changes in these functional categories after N treatment, the relative abundance of the energy sources, C cycle, and S cycle increased significantly after N treatment, while the relative abundance of the N cycle and saprotrophs decreased significantly after N treatment. These functions were not significantly different between the N1 and N2 treatments. The relative abundance of pathogens was lowest in the N2 treatment and was not significantly different between the CK and N1 treatments (Figure 5b).
Spearman’s test revealed significant correlations between microbial functions and microbial dominance phyla. For bacteria (Figure 6a), the energy source was significantly positively correlated with Proteobacteria, Bacteroidota, and Firmicutes (p < 0.01) and significantly negatively correlated with Acidobacteriota, Gemmatimonadota, Chloroflexi, Verrucomicrobiota, Methylomirabilota, and Myxococcota (p < 0.01). The C cycle was significantly positively correlated with Proteobacteria, Actinobacteriota, Bacteroidota, and Firmicutes (p < 0.01) and significantly negatively correlated with Acidobacteriota, Methylomirabilota, and Myxococcota (p < 0.01). The N cycle was significantly negatively correlated with Proteobacteria, Bacteroidota, and Firmicutes (p < 0.01) and significantly positively correlated with Acidobacteriota, Gemmatimonadota, Chloroflexi, and Myxococcota (p < 0.01). The S cycle was significantly positively correlated with Proteobacteria, Bacteroidota, and Firmicutes (p < 0.01) and significantly negatively correlated with Acidobacteriota, Verrucomicrobiota, Methylomirabilota, and Myxococcota (p < 0.01). For fungi (Figure 6b), saprotrophs showed a significant positive correlation with Mortierellomycota and Mucoromycota (p < 0.05). Symbiotrophs exhibited a significant negative correlation with Ascomycota and Chytridiomycota (p < 0.01), while they showed a significant positive correlation with Basidiomycota (p < 0.01). Pathogens showed a positive correlation with Mortierellomycota and Mucoromycota.

3.5. Microbial Correlation Networks Under Different N Treatments

Co-occurrence networks based on ASV data revealed that both bacterial and fungal networks were predominantly positively correlated. However, the proportion of positive correlations decreased for bacteria and increased for fungi under N treatments (Figure 7a,c). Network robustness significantly decreased in N1 and N2 treatments compared to CK, with no significant difference between N1 and N2 (p < 0.001) (Figure 7b,d). Bacterial networks exhibited reduced nodes, edges, and complexity, while fungal networks showed increased positive correlations and vulnerability under N addition (Table S7).

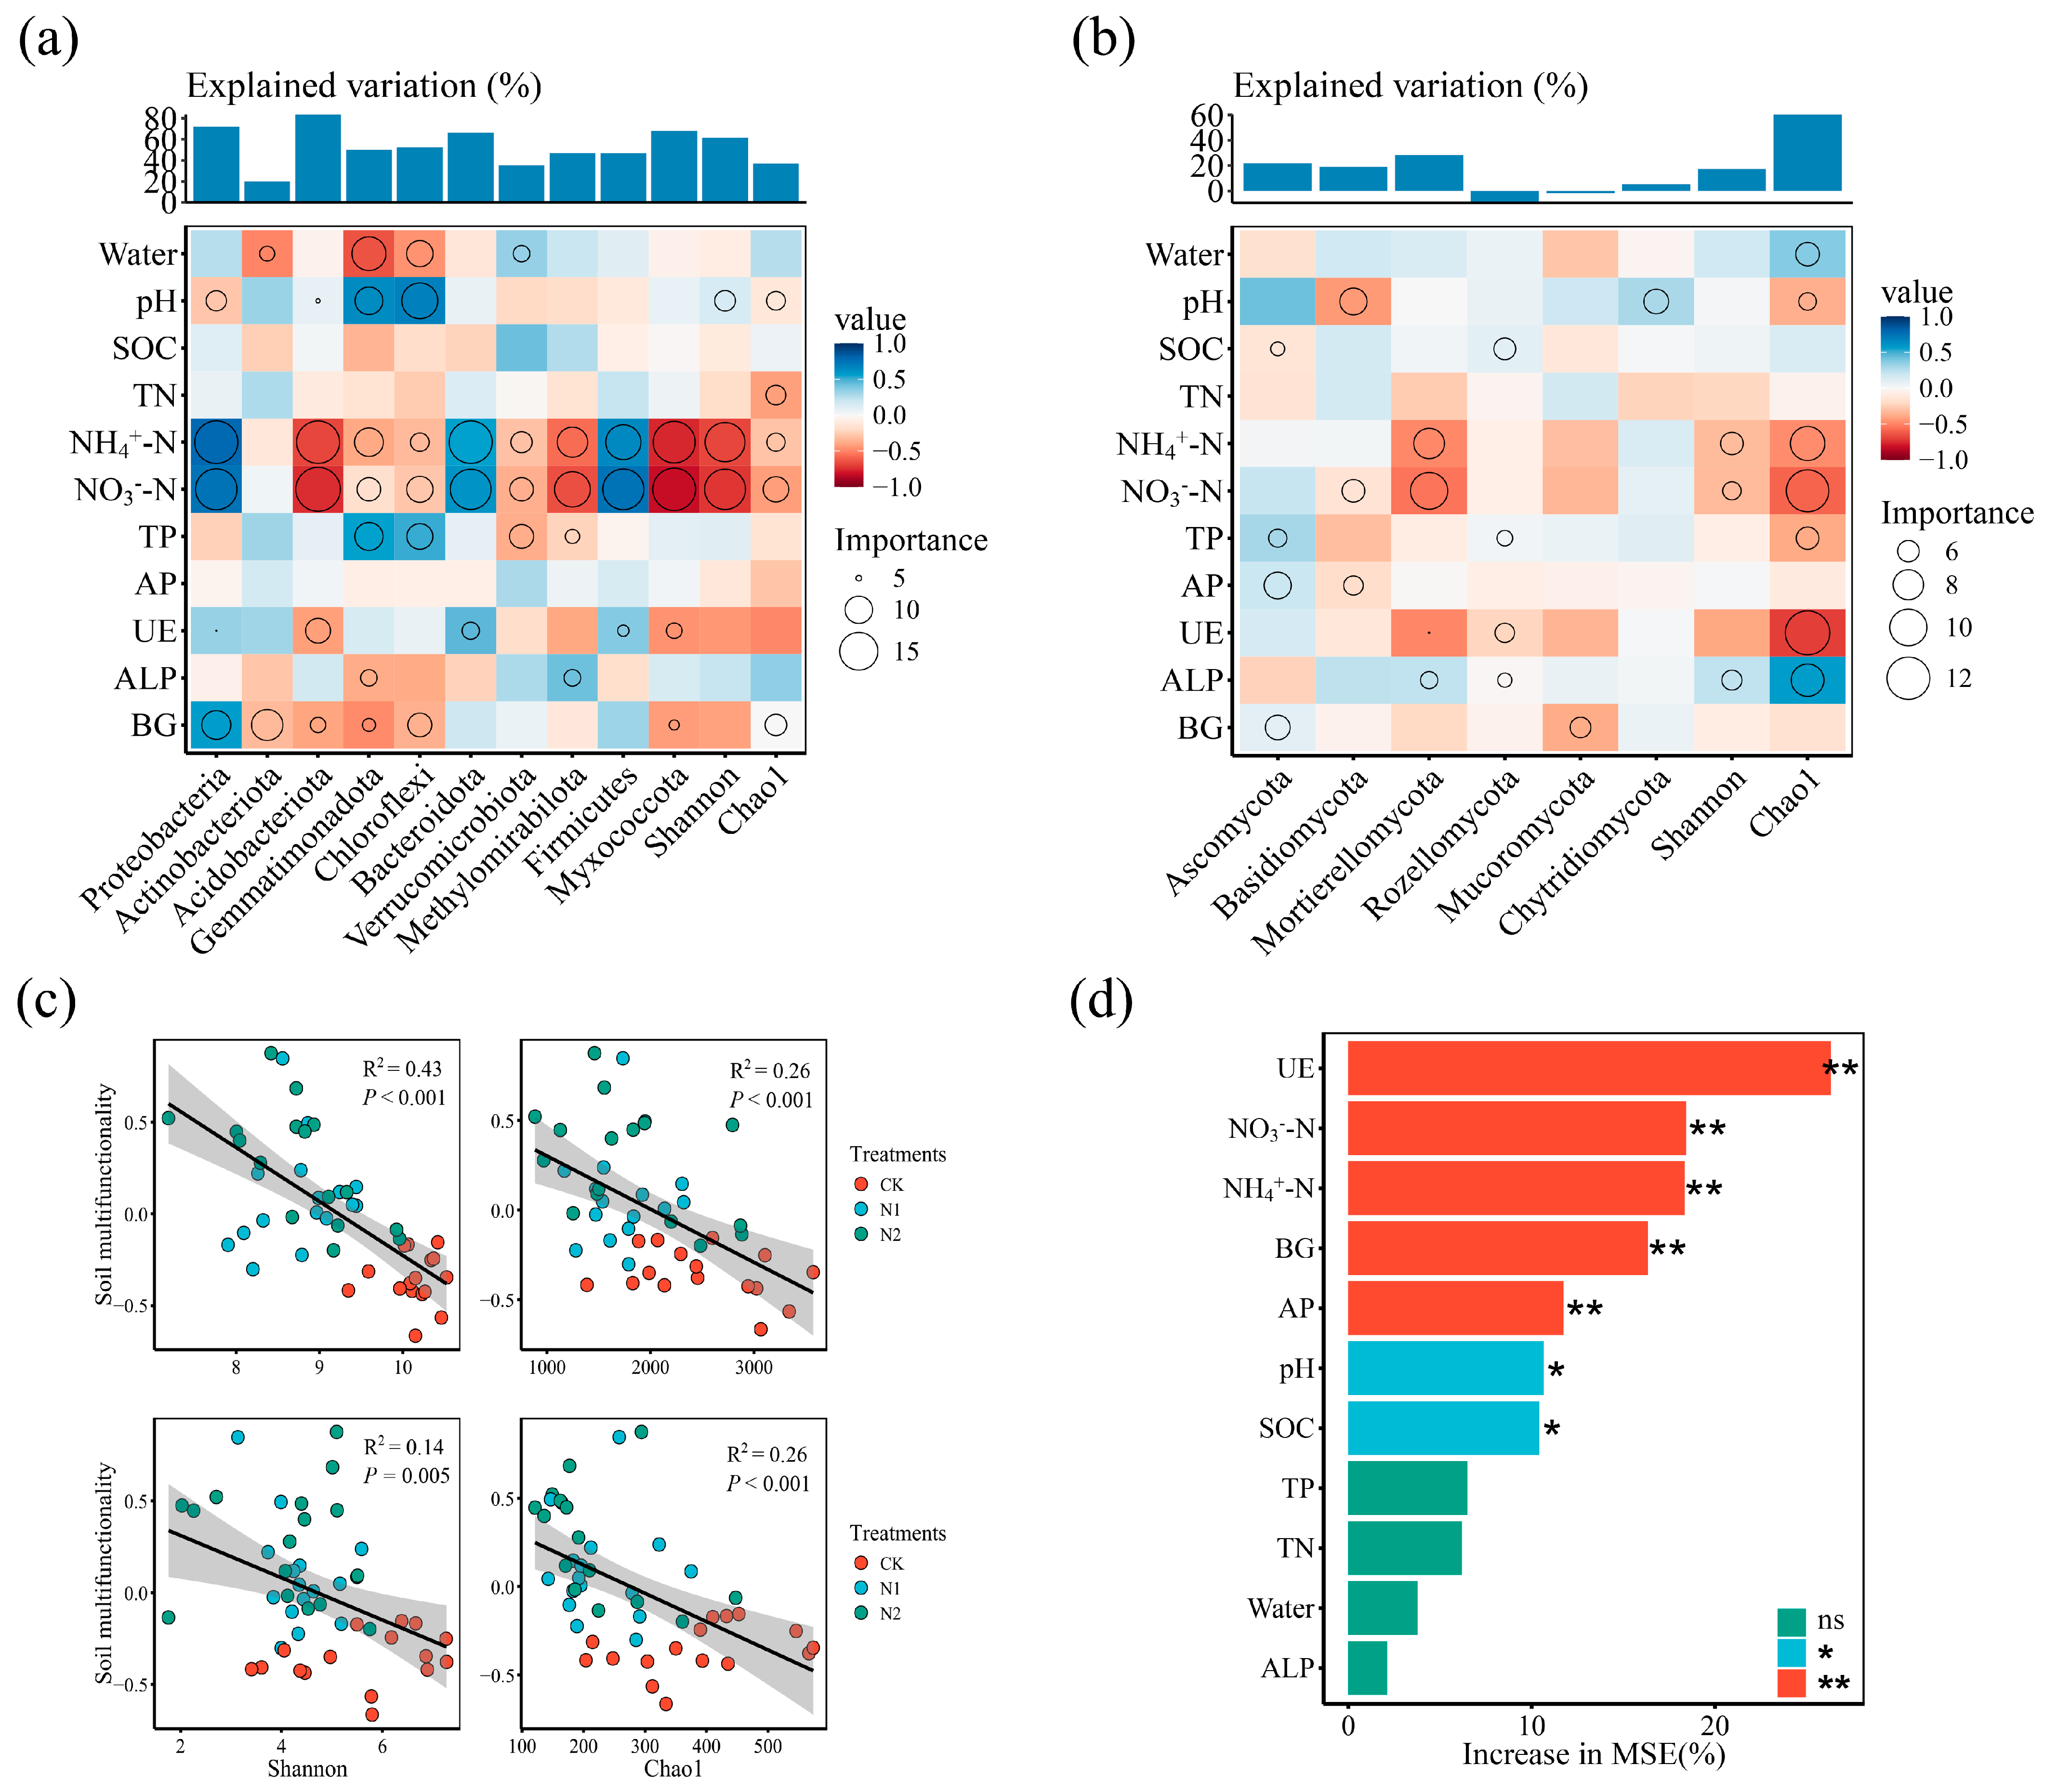
3.6. Soil Factors Affecting Microbial Dominance Phylum, Diversity Indices, and Soil Multifunctionality

The relationship between soil factors and dominance gates and diversity indices, as well as the factors significantly affecting each dominance gate and diversity index, were analyzed using random forest and Spearman’s correlation analysis. The individual dominance gates and diversity indices were affected by different factors. For the bacterial dominance phylum (Figure 8a), except for Actinobacteriota, all other bacterial dominance phyla were affected by NH4+-N and NO3-N. Positive correlations with NH4+-N and NO3-N were observed for Proteobacteria, Bacteroidota, and Firmicutes, and negative correlations were observed for Acidobacteriota, Verrucomicrobiota, and Chloroflexi. For fungi (Figure 8b), Mortierellomycota was significantly negatively correlated with NH4+-N, NO3-N. The α-diversity indices of both bacteria and fungi were negatively correlated with NH4+-N and NO3-N. The bacterial Shannon index was affected by NH4+-N, NO3-N, and pH. The Chao1 index was affected by NH4+-N, NO3-N, pH, TN, and BG (Figure 8a). The fungal Shannon index was affected by NH4+-N, NO3-N, and ALP. The Chao1 index was affected by NH4+-N, NO3-N, pH, water, TP, ALP, and BG (Figure 8b). Regression analyses showed highly significant negative correlations between soil multifunctionality and bacterial Shannon (R2 = 0.42, p < 0.001), bacterial Chao1 (R2 = 0.25, p < 0.001), fungal Shannon (R2 = 0.14, p = 0.005), and fungal Chao1 (R2= 0.25, p < 0.001) (Figure 8c). Soil factors affecting multifunctionality were UE, NH4+-N, NO3-N, BG, AP, pH, and SOC (Figure 8d). Among them, UE was the factor with the highest importance value, followed by NH4+-N and NO3-N.

4. Discussion

4.1. N Addition Significantly Altered the Morphological Traits of Absorbing Roots

The uptake efficiency of the root system is related to its diameter, and the diameter of fine roots is plastic to changes in soil nutrient availability [58]. SRL is the ratio of root length to biomass and is an indicator that can characterize the benefits and costs of rooting [59,60,61]. In general, assuming a constant root tissue density, small-diameter roots have high specific root lengths, and fine roots with high SRL may be more efficient at increasing fine root surface area and accessing soil resources with relatively low biomass investment, while also implying greater plasticity in root growth and water and nutrient uptake capacity, which may result in greater nutrient uptake from the soil [62]. The root economics spectrum (RES) is also thought to represent a trade-off between fine-root access and the preservation of resources. Where roots with a fine diameter, high SRL, high root N content, and short lifespan times were considered to adopt a resource acquisition strategy. Whereas, roots with low SRL and root N content, thick diameter, and long lifespan were considered to adopt a conservative strategy [63,64].
The morphological traits of the four tree species selected for this study differed significantly among the tree species (Table S2). This is because PM and LG belong to coniferous species, while QM and BP belong to broadleaf species. Fine roots of coniferous species have thicker roots and lower SRLs compared to those of broadleaf species [65]. All four tree species exhibited consistent alterations after the N treatment, with RD significantly increasing and SRL significantly decreasing. This is consistent with previous studies [19,66]. To determine whether this study could lead to the conclusion that absorbing roots follow a resource-conserving approach, more research is required. We were unable to make precise inferences based solely on morphological characteristics, because we did not examine the stoichiometry or lifespan of absorbing roots.

4.2. Impact of N Addition on Soil Microbial Composition and Diversity

Consistent with previous studies, the analysis determined that Proteobacteria, Acidobacteri-ota, and Actinobacteriota were the dominating bacterial phyla [26,67,68]. Eutrophic bacteria (e.g., Bac-teroidota, Actinobacteriota, and Proteobacteria) that flourish in rich in nutrients environments are favored by elevated N levels, according to the eutrophic hypothesis [69,70]. N addition raised the relative abundance of Proteobacteria, Bacteroidota, and Firmicutes, while lowering Acido-bacteriota, Verrucomicrobiota, Myxococcota, and other oligotrophic taxa, which is consistent with this study’s findings.
Based on correlation and random forest analyses, NH4+-N and NO3-N were important factors influencing the dominating phylum of bacteria. Additionally, there was a substantial and positive link between soil NH4+-N and NO3-N and eutrophic bacteria (Proteobacteria, Bacteroidota, and Firmicutes). In this study, the changed bacterial community structure was mostly driven by N effectiveness. Nie et al. [26] demonstrated that soil ammonium concentration is a key ecological factor influencing the reproduction and thriving of eutrophic bacteria. The relative abundance of bacterial dominant phyla is also influenced by other factors. pH is an important factor driving changes in microbial [71,72]. Our study showed that pH was significantly negatively correlated with Proteobacteria and positively correlated with Acidobacteriota, Gemmatimonadota, and Chloroflexi. Acidobacteriota is an acid-loving bacterium, whose relative abundance is positively correlated with PH [73]. Although our study showed that nitrogen addition did not significantly alter soil pH, pH was also a factor affecting Acidobacteriota. Gemmatimonadota is widely distributed in various ecosystems, and although its relative abundance is not dominant, it performs key ecological functions. Gemmatimonadota grows in dry soils, and its relative abundance is negatively correlated with soil moisture [74], which is consistent with the results of this study. Contrary to some studies that report increased fungal abundance with N addition [75,76], this study found no significant differences in the abundance of Ascomycota and Basidiomycota (Table S3). These fungi showed a stronger correlation with soil pH and TP than with N levels, indicating that N addition had no discernible effect on their abundance (Figure 5b).
Mixed results were found in terms of microbial diversity. Although some research shows that N has no discernible effect on bacterial diversity [77], other studies show that it has a negative effect [26,78], which is consistent with the results of our investigation. Due to competitive exclusion or the incapacity of sensitive species to adjust to the changed environment, some microbial taxa may have become more dominant and uncommon species may have become less prevalent, which might explain the decline in diversity [79,80]. Random forests showed that ammonium and nitrate nitrogen were the main factors affecting the α-diversity index. The α-diversity index was also affected by other factors. Previous studies reported a significant correlation between soil pH and microbial diversity [81], and our study also showed a significant correlation between microbial α-diversity index and pH.

4.3. Effects on Soil Microbial Functional Groups

Soil microorganisms play essential roles in N cycling, including nitrogen fixation, ammonification, nitrification, and denitrification [82]. This study observed a decrease in N cycle functions following N addition (Figure 4b). Firmicutes, Gemmatimonadetes, Chlamydiae, Chloroflexi, and Nitrospirae were involved in nitrogen fixation and carbon sequestration, while Proteobacteria, Actinobacteria, Bacteroidetes, and Verrucomicrobia are involved in organic matter decomposition [83]. The increase in the abundance of Proteobacteria, Bacteroidetes, and Firmicutes under N addition likely led to enhanced carbon cycling functions. However, the significant reduction in Acidobacteriota and Methylomirabilota, which were known to reduce nitrate, nitrite, and nitrate oxides in N cycling [84], suggests that their competitive disadvantage under high N conditions contributed to the observed decrease in N cycle functions. Additionally, the fungal groups Mortierellomycota and Mucoromycota, which were involved in decomposition [85], were reduced under N addition (Figure 6b). The decline in these fungi might explain the observed decrease in saprotrophic functions. Ectomycorrhizal fungi, primarily Basidiomycota and Ascomycota [86], showed no significant changes, indicating that their roles as symbiotic fungi were not significantly impacted by N addition.

4.4. N Enrichment Reduces the Complexity and Robustness of Microbial Symbiotic Networks

Microbial interactions are crucial for understanding community structure and stability [87]. High nutrient availability can alter these interactions, affecting microbial network stability [88,89]. In this study, N addition led to a decrease in the complexity and stability of microbial co-occurrence networks. Specifically, the complexity and stability of both bacterial and fungal networks declined under N addition (Table S7; Figure 7). Yang, Cheng, Che, Su, and Li [27] showed that N addition disrupted the complexity and stability of the fungal network in a nitrogen and phosphorus addition trial in a semi-arid grassland, which is consistent with the results of this study. The increase in the number of network modules and negatively associated bacterial networks indicates that competition amongst bacterial communities was exacerbated by increased N availability. In contrast, a change toward cooperative connections in response to nutrient enrichment is indicated by the rise in positively correlated fungal networks [28,90]. The decrease in complexity was associated with the dominance of eutrophic bacteria (e.g., Proteobacteria, Bacteroidota) and increased competition among microbial taxa [32]. Although N fertilizer application can, to some extent, promote microbial activity by alleviating N limitation, increased N effectiveness increases the abundance of certain specific microbial communities (e.g., Proteobacteria, Bacteroidota), and some less competitive species are eliminated. [91]. Wang et al. [92] on the effects of reduced nitrogen application on soil bacterial community structure and symbiotic networks illustrated that nitrogen application increased competitive pressure, while reduced nitrogen inputs alleviated competitive pressure and promoted soil ecosystem stability. However, a study of N fertilization of rice in an agricultural field showed that rice soils with high N enrichment (225 kg N ha−1 and 360 kg N ha−1) had more stable microbial networks [93]. This could be due to the fact that, in addition to N fertilizer, other phosphorus fertilizers, potash, and chicken manure were also applied in this study.

4.5. Microbial Diversity and Soil Multifunctionality Are Significantly Negatively Correlated

Soil parameters and soil enzyme activities were selected to calculate soil multifunctionality in this study, representing the soil nutrient profile. N application significantly increased soil multifunctionality (Table S2). Based on random forests, the factors that have a significant effect on soil multifunctionality are UE, NH4+-N, NO3-N, etc. (Figure 8d). The increase in soil multifunctionality was dominated by a significant increase in UE, NH4+-N, and NO3-N. Soil regression analyses showed a significant negative correlation between soil multifunctionality and bacterial and fungal α-diversity indices, which is contrary to many results but the same as Chen et al.’s [38] results.
Based on the above results, it can be shown that the N concentration applied in this study increased soil nutrient versatility in the short term. However, the significance of α-diversity of the microbial community decreased, as did the robustness of the co-occurrence network. We speculate that, if N is applied at this concentration for a long period of time, the microbial community is occupied by eutrophic bacteria for a long period of time, which may lead to the loss of microbial diversity and changes in the process of soil carbon and N cycling.

5. Conclusions

Our hypothesis was supported by the fact that applying N at four- and sixfold localized soil total N enhanced soil N effectiveness and soil multifunctionality and dramatically changed the morphological properties of absorbing roots, resulting in increased RD and RTD and decreased SRL and SRA. N enrichment treatments also substantially changed microbial community composition and functional taxa. The relative abundance of eutrophic bacteria (e.g., Proteobacteria, Bacteroidota, and Firmicutes) increased, while that of oligotrophic bacteria (e.g., Acidobacteriota, Verrucomicrobiota, and Myxococcota) and saprotrophic fungi (e.g., Mortierellomycota and Mucoromycota) decreased. The microbial α-diversity index decreased, and the microbial co-occurrence networks became less complex and more vulnerable under N enrichment treatments. Soil multifunctionality and the microbial alpha diversity index had a substantial negative correlation. NH4+-N and NO3-N were the key factors affecting microbial dominance phyla, as well as the bacterial Shannon index and the fungal Chao1 index. In addition, soil properties (except NH4+;-N and NO3-N), soil enzyme activities, root morphological characteristics, and microbial Chao1 index were significantly different among tree species. This study provided important data and insights for a comprehensive study of the repertoire of responses to nitrogen enrichment in temperate forest ecosystems. However, long-term experiments are needed to observe the broader implications of these findings for soil health.

Supplementary Materials

The following supporting information can be downloaded at: https://www.mdpi.com/article/10.3390/f16030459/s1, Figure S1: A schematic diagram of the experimental design; Figure S2: Petal forms showing the number of ASVs unique to bacteria and fungi as well as the number of shared ASVs under different N treatments; Table S1: Sample site information; Table S2: Response of soil parameters, soil enzyme activities, and morphological traits of absorbing roots to N treatments and tree species; Table S3: Effects of N treatment and tree species on the relative abundance of microbial dominance phyla; Table S4: Effects of nitrogen treatment and tree species on the relative abundance of dominant genera; Table S5: p-values for community differences between N treatments and tree species (ADONIS); Table S6: Effects of N treatment and tree species on the relative abundance of microbial functions; Table S7: Properties of microbial co-occurrence networks under different N treatments.

Author Contributions

All authors have contributed to the research conception and design. Conceptualization, X.H. and J.G.; methodology, X.H. and J.G.; software, X.H. and Q.L.; investigation, Q.L., Y.C. (Yuhan Chen), Y.X., L.W. and W.Q.; data curation, Q.L., Y.C. (Yuhan Chen), Y.X., L.W. and W.Q.; writing—original draft preparation, X.H. and Q.L.; writing—review and editing, X.H., Q.L., Y.C. (Yinglong Chen) and X.W.; supervision, X.H. and J.G.; funding acquisition, X.H. All authors have read and agreed to the published version of the manuscript.

Funding

This research was supported by the free exploration program of basic research by Shanxi Province of China (20210302124620); Research Project Supported by Shanxi Scholarship Council of China (2022-100); Doctoral Research Initiation Project of Shanxi Agricultural University (2021BQ16).

Data Availability Statement

Raw reads were deposited into the NCBI Sequence Read Archive (SRA) database (Login number: PRJNA1150815).

Conflicts of Interest

The authors declare no conflicts of interest.

References

  1. Erisman, J.W.; Galloway, J.N.; Seitzinger, S.; Bleeker, A.; Dise, N.B.; Petrescu, A.M.R.; Leach, A.M.; de Vries, W. Consequences of human modification of the global nitrogen cycle. Philos. Trans. R. Soc. B 2013, 368, 20130116. [Google Scholar] [CrossRef] [PubMed]
  2. Fowler, D.; Steadman, C.E.; Stevenson, D.; Coyle, M.; Rees, R.M.; Skiba, U.M.; Sutton, M.A.; Cape, J.N.; Dore, A.J.; Vieno, M.; et al. Effects of global change during the 21st century on the nitrogen cycle. Atmos. Chem. Phys. 2015, 15, 13849–13893. [Google Scholar] [CrossRef]
  3. Melillo, J.M. Disruption of the global nitrogen cycle: A grand challenge for the twenty-first century. Ambio 2021, 50, 759–763. [Google Scholar] [CrossRef] [PubMed]
  4. Lu, X.K.; Vitousek, P.M.; Mao, Q.G.; Gilliam, F.S.; Luo, Y.Q.; Zhou, G.Y.; Zou, X.M.; Bai, E.; Scanlon, T.M.; Hou, E.Q.; et al. Plant acclimation to long-term high nitrogen deposition in an N-rich tropical forest. Proc. Natl. Acad. Sci. USA 2018, 115, 5187–5192. [Google Scholar] [CrossRef] [PubMed]
  5. Midolo, G.; Alkemade, R.; Schipper, A.M.; Benítez-López, A.; Perring, M.P.; De Vries, W. Impacts of nitrogen addition on plant species richness and abundance: A global meta-analysis. Glob. Ecol. Biogeogr. 2019, 28, 398–413. [Google Scholar] [CrossRef]
  6. Mao, Q.G.; Lu, X.K.; Mo, H.; Gundersen, P.; Mo, J.M. Effects of simulated N deposition on foliar nutrient status, N metabolism and photosynthetic capacity of three dominant understory plant species in a mature tropical forest. Sci. Total Environ. 2018, 610, 555–562. [Google Scholar] [CrossRef]
  7. Payne, R.J.; Dise, N.B.; Field, C.D.; Dore, A.J.; Caporn, S.J.M.; Stevens, C.J. Nitrogen deposition and plant biodiversity: Past, present, and future. Front. Ecol. Environ. 2017, 15, 431–436. [Google Scholar] [CrossRef]
  8. Craig, H.; Antwis, R.E.; Cordero, I.; Ashworth, D.; Robinson, C.H.; Osborne, T.Z.; Bardgett, R.D.; Rowntree, J.K.; Simpson, L.T. Nitrogen addition alters composition, diversity, and functioning of microbial communities in mangrove soils: An incubation experiment. Soil Biol. Biochem. 2021, 153, 108076. [Google Scholar] [CrossRef]
  9. Zhang, T.A.; Chen, H.Y.H.; Ruan, H.H. Global negative effects of nitrogen deposition on soil microbes. ISME J. 2018, 12, 1817–1825. [Google Scholar] [CrossRef]
  10. Kou, L.; Guo, D.L.; Yang, H.; Gao, W.L.; Li, S.G. Growth, morphological traits and mycorrhizal colonization of fine roots respond differently to nitrogen addition in a slash pine plantation in subtropical China. Plant Soil 2015, 391, 207–218. [Google Scholar] [CrossRef]
  11. Zhu, H.; Zhao, J.; Gong, L. The morphological and chemical properties of fine roots respond to nitrogen addition in a temperate Schrenk’s spruce (Picea schrenkiana) forest. Sci. Rep. 2021, 11, 3839. [Google Scholar] [CrossRef]
  12. Chen, Y.; Yin, S.; Shao, Y.; Zhang, K. Soil bacteria are more sensitive than fungi in response to nitrogen and phosphorus enrichment. Front. Microbiol. 2022, 13, 999385. [Google Scholar] [CrossRef] [PubMed]
  13. Philippot, L.; Raaijmakers, J.M.; Lemanceau, P.; van der Putten, W.H. Going back to the roots: The microbial ecology of the rhizosphere. Nat. Rev. Microbiol. 2013, 11, 789–799. [Google Scholar] [CrossRef] [PubMed]
  14. Adams, T.S.; McCormack, M.L.; Eissenstat, D.M. Foraging strategies in trees of different root morphology: The role of root lifespan. Tree Physiol. 2013, 33, 940–948. [Google Scholar] [CrossRef]
  15. Du, X.Z.; Wei, X. Definition of fine roots on the basis of the root anatomy, diameter, and branch orders of one-year old seedlings. J. For. Res. 2018, 29, 1321–1327. [Google Scholar] [CrossRef]
  16. Gu, J.C.; Wei, X.; Wang, J.; Dong, X.Y.; Wang, Z.Q. Marked differences in standing biomass, length density, anatomy and physiological activity between white and brown roots in Rupr. plantation. Plant Soil 2015, 392, 267–277. [Google Scholar] [CrossRef]
  17. Da, R.; Fan, C.; Zhang, C.; Zhao, X.; von Gadow, K. Are absorptive root traits good predictors of ecosystem functioning? A test in a natural temperate forest. New Phytol. 2023, 239, 75–86. [Google Scholar] [CrossRef]
  18. Ostonen, I.; Helmisaari, H.S.; Borken, W.; Tedersoo, L.; Kukumägi, M.; Bahram, M.; Lindroos, A.J.; Nöjd, P.; Uri, V.; Merilä, P.; et al. Fine root foraging strategies in Norway spruce forests across a European climate gradient. Glob. Change Biol. 2011, 17, 3620–3632. [Google Scholar] [CrossRef]
  19. Wang, G.L.; Fahey, T.J.; Xue, S.; Liu, F. Root morphology and architecture respond to N addition in Pinus tabuliformis, west China. Oecologia 2013, 171, 583–590. [Google Scholar] [CrossRef]
  20. Wang, W.J.; Mo, Q.F.; Han, X.G.; Hui, D.F.; Shen, W.J. Fine root dynamics responses to nitrogen addition depend on root order, soil layer, and experimental duration in a subtropical forest. Biol. Fertil. Soils 2019, 55, 723–736. [Google Scholar] [CrossRef]
  21. Wang, W.N.; Wang, Y.; Hoch, G.; Wang, Z.Q.; Gu, J.C. Linkage of root morphology to anatomy with increasing nitrogen availability in six temperate tree species. Plant Soil 2018, 425, 189–200. [Google Scholar] [CrossRef]
  22. Li, W.B.; Jin, C.J.; Guan, D.X.; Wang, Q.K.; Wang, A.Z.; Yuan, F.H.; Wu, J.B. The effects of simulated nitrogen deposition on plant root traits: A meta-analysis. Soil Biol. Biochem. 2015, 82, 112–118. [Google Scholar] [CrossRef]
  23. Moore, J.A.M.; Anthony, M.A.; Pec, G.J.; Trocha, L.K.; Trzebny, A.; Geyer, K.M.; van Diepen, L.T.A.; Frey, S.D. Fungal community structure and function shifts with atmospheric nitrogen deposition. Glob. Change Biol. 2021, 27, 1349–1364. [Google Scholar] [CrossRef]
  24. Wang, J.Q.; Shi, X.Z.; Zheng, C.Y.; Suter, H.; Huang, Z.Q. Different responses of soil bacterial and fungal communities to nitrogen deposition in a subtropical forest. Sci. Total Environ. 2021, 755, 142449. [Google Scholar] [CrossRef]
  25. Yang, Z.; Dai, H.; Huang, Y.; Dong, B.; Fu, S.; Zhang, C.; Li, X.; Tan, Y.; Zhang, X.; Zhang, X. Driving mechanisms of soil bacterial α and β diversity under long-term nitrogen addition: Subtractive heterogenization based on the environment selection. Geoderma 2024, 445, 116886. [Google Scholar] [CrossRef]
  26. Nie, Y.X.; Wang, M.C.; Zhang, W.; Ni, Z.; Hashidoko, Y.; Shen, W.J. Ammonium nitrogen content is a dominant predictor of bacterial community composition in an acidic forest soil with exogenous nitrogen enrichment. Sci. Total Environ. 2018, 624, 407–415. [Google Scholar] [CrossRef]
  27. Yang, H.L.; Cheng, L.; Che, L.M.G.; Su, Y.Z.; Li, Y.L. Nutrients addition decreases soil fungal diversity and alters fungal guilds and co-occurrence networks in a semi-arid grassland in northern China. Sci. Total Environ. 2024, 926, 172100. [Google Scholar] [CrossRef]
  28. He, J.H.; Jiao, S.; Tan, X.P.; Wei, H.; Ma, X.M.; Nie, Y.X.; Liu, J.X.; Lu, X.K.; Mo, J.M.; Shen, W.J. Adaptation of Soil Fungal Community Structure and Assembly to Long-Versus Short-Term Nitrogen Addition in a Tropical Forest. Front. Microbiol. 2021, 12, 689674. [Google Scholar] [CrossRef]
  29. Zhou, Z.H.; Wang, C.K.; Luo, Y.Q. Meta-analysis of the impacts of global change factors on soil microbial diversity and functionality. Nat. Commun. 2020, 11, 3072. [Google Scholar] [CrossRef]
  30. Wang, C.; Liu, D.W.; Bai, E. Decreasing soil microbial diversity is associated with decreasing microbial biomass under nitrogen addition. Soil Biol. Biochem. 2018, 120, 126–133. [Google Scholar] [CrossRef]
  31. Wang, X.; Feng, J.; Ao, G.; Qin, W.; Han, M.; Shen, Y.; Liu, M.; Chen, Y.; Zhu, B. Globally nitrogen addition alters soil microbial community structure, but has minor effects on soil microbial diversity and richness. Soil Biol. Biochem. 2023, 179, 108982. [Google Scholar] [CrossRef]
  32. Wang, C.; Shi, Z.; Li, A.; Geng, T.; Liu, L.; Liu, W. Long-term nitrogen input reduces soil bacterial network complexity by shifts in life history strategy in temperate grassland. iMeta 2024, 3, e194. [Google Scholar] [CrossRef]
  33. Zhang, Q.; Buyantuev, A.; Fang, X.N.; Han, P.; Li, A.; Li, F.Y.; Liang, C.Z.; Liu, Q.F.; Ma, Q.; Niu, J.M.; et al. Ecology and sustainability of the Inner Mongolian Grassland: Looking back and moving forward. Landsc. Ecol. 2020, 35, 2413–2432. [Google Scholar] [CrossRef]
  34. Garland, G.; Banerjee, S.; Edlinger, A.; Oliveira, E.M.; Herzog, C.; Wittwer, R.; Philippot, L.; Maestre, F.T.; van der Heijden, M.G.A. A closer look at the functions behind ecosystem multifunctionality: A review. J. Ecol. 2021, 109, 600–613. [Google Scholar] [CrossRef]
  35. Ma, L.N.; Zhang, C.X.; Xu, X.F.; Wang, C.W.; Liu, G.F.; Liang, C.Z.; Zuo, X.A.; Wang, C.J.; Lv, Y.; Wang, R.Z. Different facets of bacterial and fungal communities drive soil multifunctionality in grasslands spanning a 3500 km transect. Funct. Ecol. 2022, 36, 3120–3133. [Google Scholar] [CrossRef]
  36. Delgado-Baquerizo, M.; Trivedi, P.; Trivedi, C.; Eldridge, D.J.; Reich, P.B.; Jeffries, T.C.; Singh, B.K. Microbial richness and composition independently drive soil multifunctionality. Funct. Ecol. 2017, 31, 2330–2343. [Google Scholar] [CrossRef]
  37. Zhang, M.; Liang, Y.C.; Son, A.; Yu, B.; Zeng, X.B.; Chen, M.S.; Yin, H.Q.; Zhang, X.X.; Sun, B.L.; Fan, F.L. Loss of soil microbial diversity may increase insecticide uptake by crop. Agric. Ecosyst. Environ. 2017, 240, 84–91. [Google Scholar] [CrossRef]
  38. Chen, G.; Wu, C.; Ge, T.; Chen, J.; Deng, Y. Response of Soil Multifunctionality to Reduced Microbial Diversity. Environ. Sci. 2022, 43, 5274–5285. (In Chinese) [Google Scholar]
  39. LeBauer, D.S.; Treseder, K.K. Nitrogen limitation of net primary productivity in terrestrial ecosystems is globally distributed. Ecology 2008, 89, 371–379. [Google Scholar] [CrossRef]
  40. Eissenstat, D.M.; Kucharski, J.M.; Zadworny, M.; Adams, T.S.; Koide, R.T. Linking root traits to nutrient foraging in arbuscular mycorrhizal trees in a temperate forest. New Phytol. 2015, 208, 114–124. [Google Scholar] [CrossRef]
  41. Jia, L.Q.; Chen, G.S.; Zhang, L.H.; Chen, T.T.; Jiang, Q.; Chen, Y.H.; Fan, A.L.; Wang, X. Plastic responses of fine root morphological traits of Castanopsis fabri and Castanopsis carlesii to short-term nitrogen addition. J. Appl. Ecol. 2019, 30, 4003–4011. (In Chinese) [Google Scholar]
  42. Liu, B.T.; Han, F.; Ning, P.; Li, H.B.; Rengel, Z. Root traits and soil nutrient and carbon availability drive soil microbial diversity and composition in a northern temperate forest. Plant Soil 2022, 479, 281–299. [Google Scholar] [CrossRef]
  43. Li, L. Analysis on Litter and Soil Nutrient Content of Larix Principis-rupprechtii plantation in Xiaowenshan Forest Farm. Shanxi For. Sci. Technol. 2023, 52, 11–13. (In Chinese) [Google Scholar]
  44. Comas, L.H.; Eissenstat, D.M. Linking fine root traits to maximum potential growth rate among 11 mature temperate tree species. Funct. Ecol. 2004, 18, 388–397. [Google Scholar] [CrossRef]
  45. Pregitzer, K.S.; DeForest, J.L.; Burton, A.J.; Allen, M.F.; Ruess, R.W.; Hendrick, R.L. Fine root architecture of nine north american trees. Ecol. Monogr. 2002, 72, 293–309. [Google Scholar] [CrossRef]
  46. McCormack, M.L.; Dickie, I.A.; Eissenstat, D.M.; Fahey, T.J.; Fernandez, C.W.; Guo, D.L.; Helmisaari, H.S.; Hobbie, E.A.; Iversen, C.M.; Jackson, R.B.; et al. Redefining fine roots improves understanding of below-ground contributions to terrestrial biosphere processes. New Phytol. 2015, 207, 505–518. [Google Scholar] [CrossRef]
  47. Bao, S.D. Soil and Agricultural Chemistry Analysis, 3rd ed.; China Agricultural Press: Beijing, China, 2000. (In Chinese) [Google Scholar]
  48. Guan, S.Y. Soil Enzymes and Its Methodology; China Agriculture Press: Beijing, China, 1986. (In Chinese) [Google Scholar]
  49. Kandeler, E.; Gerber, H. Short-term assay of soil urease activity using colorimetric determination of ammonium. Biol. Fertil. Soils 1988, 6, 68–72. [Google Scholar] [CrossRef]
  50. Witte, C.-P.; Medina-Escobar, N. In-Gel Detection of Urease with Nitroblue Tetrazolium and Quantification of the Enzyme from Different Crop Plants Using the Indophenol Reaction. Anal. Biochem. 2001, 290, 102–107. [Google Scholar] [CrossRef]
  51. Xiong, J. A Method for the Determination of Soil β-Glucosidase Activity; Panzhihua University: Panzhihua, China, 2022. (In Chinese) [Google Scholar]
  52. Martin, M. Cutadapt removes adapter sequences from high-throughput sequencing reads. EMBnet.J. 2011, 17, 10. [Google Scholar] [CrossRef]
  53. Callahan, B.J.; McMurdie, P.J.; Rosen, M.J.; Han, A.W.; Johnson, A.J.A.; Holmes, S.P. DADA2: High-resolution sample inference from Illumina amplicon data. Nat. Methods 2016, 13, 581–583. [Google Scholar] [CrossRef]
  54. Louca, S.; Parfrey, L.W.; Doebeli, M. Decoupling function and taxonomy in the global ocean microbiome. Science 2016, 353, 1272–1277. [Google Scholar] [CrossRef] [PubMed]
  55. Nguyen, N.H.; Song, Z.W.; Bates, S.T.; Branco, S.; Tedersoo, L.; Menke, J.; Schilling, J.S.; Kennedy, P.G. FUNGuild: An open annotation tool for parsing fungal community datasets by ecological guild. Fungal Ecol. 2016, 20, 241–248. [Google Scholar] [CrossRef]
  56. Zhang, C.; Lei, S.L.; Wu, H.Y.; Liao, L.R.; Wang, X.T.; Zhang, L.; Liu, G.B.; Wang, G.L.; Fang, L.C.; Song, Z.L. Simplified microbial network reduced microbial structure stability and soil functionality in alpine grassland along a natural aridity gradient. Soil Biol. Biochem. 2024, 191, 109366. [Google Scholar] [CrossRef]
  57. Wu, J.; Wu, C.; Zhang, Q.; Zhang, H.; Wang, S.; Wang, F.; Jin, S.; Kuzyakov, Y.; Chen, J.; Ge, T. Microbial diversity loss and wheat genotype-triggered rhizosphere bacterial and protistan diversity constrain soil multifunctionality: Evidence from greenhouse experiment. Plant Soil 2024, 504, 475–491. [Google Scholar] [CrossRef]
  58. Zobel, R.W.; Kinraide, T.B.; Baligar, V.C. Fine root diameters can change in response to changes in nutrient concentrations. Plant Soil 2007, 297, 243–254. [Google Scholar] [CrossRef]
  59. Kramer-Walter, K.R.; Bellingham, P.J.; Millar, T.R.; Smissen, R.D.; Richardson, S.J.; Laughlin, D.C. Root traits are multidimensional: Specific root length is independent from root tissue density and the plant economic spectrum. J. Ecol. 2016, 104, 1299–1310. [Google Scholar] [CrossRef]
  60. Ostonen, I.; Püttsepp, Ü.; Biel, C.; Alberton, O.; Bakker, M.R.; Lõhmus, K.; Majdi, H.; Metcalfe, D.; Olsthoorn, A.F.M.; Pronk, A.; et al. Specific root length as an indicator of environmental change. Plant Biosyst.-Int. J. Deal. All. Asp. Plant Biol. 2007, 141, 426–442. [Google Scholar] [CrossRef]
  61. Poorter, H.; Ryser, P. The limits to leaf and root plasticity: What is so special about specific root length? New Phytol. 2015, 206, 1188–1190. [Google Scholar] [CrossRef]
  62. Robinson, D.; Hodge, A.; Fitter, A. Constraints on the Form and Function of Root Systems. In Root Ecology; de Kroon, H., Visser, E.J.W., Eds.; Springer: Berlin/Heidelberg, Germany, 2003. [Google Scholar]
  63. McCormack, M.L.; Adams, T.S.; Smithwick, E.A.H.; Eissenstat, D.M. Predicting fine root lifespan from plant functional traits in temperate trees. New Phytol. 2012, 195, 823–831. [Google Scholar] [CrossRef]
  64. Reich, P.B. The world-wide ‘fast–slow’ plant economics spectrum: A traits manifesto. J. Ecol. 2014, 102, 275–301. [Google Scholar] [CrossRef]
  65. Wang, G. Belowground Nutrient-Acquisition Strategies of Different Ectomycorrhizal Tree Species in the Mountainous Regions of North China; Shanxi Agricultural University: Jinzhong, China, 2021. [Google Scholar]
  66. Wang, C.G.; Han, S.J.; Zhou, Y.M.; Yan, C.F.; Cheng, X.B.; Zheng, X.B.; Li, M.H. Responses of Fine Roots and Soil N Availability to Short-Term Nitrogen Fertilization in a Broad-Leaved Korean Pine Mixed Forest in Northeastern China. PLoS ONE 2012, 7, e31042. [Google Scholar] [CrossRef] [PubMed]
  67. Ling, N.; Chen, D.M.; Guo, H.; Wei, J.X.; Bai, Y.F.; Shen, Q.R.; Hu, S.J. Differential responses of soil bacterial communities to long-term N and P inputs in a semi-arid steppe. Geoderma 2017, 292, 25–33. [Google Scholar] [CrossRef]
  68. Wang, C.; Zheng, M.M.; Song, W.F.; Wen, S.L.; Wang, B.R.; Zhu, C.Q.; Shen, R.F. Impact of 25 years of inorganic fertilization on diazotrophic abundance and community structure in an acidic soil in southern China. Soil Biol. Biochem. 2017, 113, 240–249. [Google Scholar] [CrossRef]
  69. Eilers, K.G.; Lauber, C.L.; Knight, R.; Fierer, N. Shifts in bacterial community structure associated with inputs of low molecular weight carbon compounds to soil. Soil Biol. Biochem. 2010, 42, 896–903. [Google Scholar] [CrossRef]
  70. Fierer, N.; Bradford, M.A.; Jackson, R.B. Toward an ecological classification of soil bacteria. Ecology 2007, 88, 1354–1364. [Google Scholar] [CrossRef] [PubMed]
  71. Arunrat, N.; Sereenonchai, S.; Sansupa, C.; Kongsurakan, P.; Hatano, R. Effect of Rice Straw and Stubble Burning on Soil Physicochemical Properties and Bacterial Communities in Central Thailand. Biology 2023, 12, 501. [Google Scholar] [CrossRef]
  72. Li, S.; Tang, S.; Ju, X.; Zhu, Z.; Zhang, Y.; Chen, H.; Jin, K. Soil acidification drives the negative effects of nitrogen enrichment on soil microbial biomass at the global scale. Plant Soil 2024, 503, 517–528. [Google Scholar] [CrossRef]
  73. Gonçalves, O.S.; Fernandes, A.S.; Tupy, S.M.; Ferreira, T.G.; Almeida, L.N.; Creevey, C.J.; Santana, M.F. Insights into plant interactions and the biogeochemical role of the globally widespread Acidobacteriota phylum. Soil Biol. Biochem. 2024, 192, 109369. [Google Scholar] [CrossRef]
  74. Hu, Y.; Chen, M.; Yang, Z.; Cong, M.; Zhu, X.; Jia, H. Soil Microbial Community Response to Nitrogen Application on a Swamp Meadow in the Arid Region of Central Asia. Front. Microbiol. 2022, 12, 797306. [Google Scholar] [CrossRef]
  75. Ma, A.Z.; Zhuang, X.L.; Wu, J.M.; Cui, M.M.; Lv, D.; Liu, C.Z.; Zhuang, G.Q. Ascomycota Members Dominate Fungal Communities during Straw Residue Decomposition in Arable Soil. PLoS ONE 2013, 8, e66146. [Google Scholar] [CrossRef]
  76. Paungfoo-Lonhienne, C.; Yeoh, Y.K.; Kasinadhuni, N.R.P.; Lonhienne, T.G.A.; Robinson, N.; Hugenholtz, P.; Ragan, M.A.; Schmidt, S. Nitrogen fertilizer dose alters fungal communities in sugarcane soil and rhizosphere. Sci. Rep. 2015, 5, 8675. [Google Scholar] [CrossRef]
  77. Fierer, N.; Lauber, C.L.; Ramirez, K.S.; Zaneveld, J.; Bradford, M.A.; Knight, R. Comparative metagenomic, phylogenetic and physiological analyses of soil microbial communities across nitrogen gradients. ISME J. 2012, 6, 1007–1017. [Google Scholar] [CrossRef]
  78. Wang, J.; Liao, L.R.; Ye, Z.C.; Liu, H.F.; Zhang, C.; Zhang, L.; Liu, G.B.; Wang, G.L. Different bacterial co-occurrence patterns and community assembly between rhizosphere and bulk soils under N addition in the plant-soil system. Plant Soil 2022, 471, 697–713. [Google Scholar] [CrossRef]
  79. Fu, Y.L. Response of Interroot Microorganisms to Nitrogen Addition in a Northern Forest; Heilongjiang University: Harbin, China, 2021. (In Chinese) [Google Scholar]
  80. Liu, W.B.; Ling, N.; Guo, J.J.; Ruan, Y.; Zhu, C.; Shen, Q.R.; Guo, S.W. Legacy effects of 8-year nitrogen inputs on bacterial assemblage in wheat rhizosphere. Biol. Fertil. Soils 2020, 56, 583–596. [Google Scholar] [CrossRef]
  81. Shi, Y.; Li, Y.; Yang, T.; Chu, H. Threshold effects of soil pH on microbial co-occurrence structure in acidic and alkaline arable lands. Sci. Total Environ. 2021, 800, 149592. [Google Scholar] [CrossRef] [PubMed]
  82. Peng, J.J.; Oladele, O.; Song, X.T.; Ju, X.T.; Jia, Z.J.; Hu, H.W.; Liu, X.J.; Bei, S.K.; Ge, A.H.; Zhang, L.M.; et al. Opportunities and approaches for manipulating soil-plant nicrobiomes for effective crop nitrogen use in agroecosystems. Agric. Sci. Eng. 2022, 9, 333–343. (In Chinese) [Google Scholar]
  83. Ma, Z.Z.; Qiao, S.S.; Cao, M.W.; Zhou, Y.N.; Liu, J.X.; Jia, T.; Li, C.; Chai, B.F. Environmental selection and dispersal limitation drive the assemblage of bacterial community in temperate forest soils. Chin. J. Appl. Ecol. 2018, 29, 1179–1189. (In Chinese) [Google Scholar]
  84. Ward, N.L.; Challacombe, J.F.; Janssen, P.H.; Henrissat, B.; Coutinho, P.M.; Wu, M.; Xie, G.; Haft, D.H.; Sait, M.; Badger, J.; et al. Three Genomes from the Phylum Acidobacteria Provide Insight into the Lifestyles of These Microorganisms in Soils. Appl. Environ. Microbiol. 2009, 75, 2046–2056. [Google Scholar] [CrossRef]
  85. Tedersoo, L.; Sánchez-Ramírez, S.; Koljalg, U.; Bahram, M.; Döring, M.; Schigel, D.; May, T.; Ryberg, M.; Abarenkov, K. High-level classification of the Fungi and a tool for evolutionary ecological analyses. Fungal Divers. 2018, 90, 135–159. [Google Scholar] [CrossRef]
  86. Smith, S.E.; Read, D.J. Mycorrhizal Symbiosis, 3rd ed.; Academic Press: New York, NY, USA, 2008. [Google Scholar]
  87. Li, D.; Ni, H.W.; Jiao, S.; Lu, Y.H.; Zhou, J.Z.; Sun, B.; Liang, Y.T. Coexistence patterns of soil methanogens are closely tied to methane generation and community assembly in rice paddies. Microbiome 2021, 9, 20. [Google Scholar] [CrossRef]
  88. Coyte, K.Z.; Schluter, J.; Foster, K.R. The ecology of the microbiome: Networks, competition, and stability. Science 2015, 350, 663–666. [Google Scholar] [CrossRef] [PubMed]
  89. de Vries, F.T.; Griffiths, R.I.; Bailey, M.; Craig, H.; Girlanda, M.; Gweon, H.S.; Hallin, S.; Kaisermann, A.; Keith, A.M.; Kretzschmar, M.; et al. Soil bacterial networks are less stable under drought than fungal networks. Nat. Commun. 2018, 9, 3033. [Google Scholar] [CrossRef] [PubMed]
  90. Wu, M.H.; Chen, S.Y.; Chen, J.W.; Xue, K.; Chen, S.L.; Wang, X.M.; Chen, T.; Kang, S.C.; Rui, J.P.; Thies, J.E.; et al. Reduced microbial stability in the active layer is associated with carbon loss under alpine permafrost degradation. Proc. Natl. Acad. Sci. USA 2021, 118, e2025321118. [Google Scholar] [CrossRef]
  91. Yang, R.; Yang, Z.; Yang, S.; Chen, L.; Xin, J.; Xu, L.; Zhang, X.; Zhai, B.; Wang, Z.; Zheng, W.; et al. Nitrogen inhibitors improve soil ecosystem multifunctionality by enhancing soil quality and alleviating microbial nitrogen limitation. Sci. Total Environ. 2023, 880, 163238. [Google Scholar] [CrossRef] [PubMed]
  92. Wang, F.; Liu, H.; Yao, H.; Zhang, B.; Li, Y.; Jin, S.; Cao, H. Reducing Application of Nitrogen Fertilizer Increases Soil Bacterial Diversity and Drives Co-Occurrence Networks. Microorganisms 2024, 12, 1434. [Google Scholar] [CrossRef]
  93. Chen, Y.; Li, Y.; Qiu, T.; He, H.; Liu, J.; Duan, C.; Cui, Y.; Huang, M.; Wu, C.; Fang, L. High nitrogen fertilizer input enhanced the microbial network complexity in the paddy soil. Soil Ecol. Lett. 2023, 6, 230205. [Google Scholar] [CrossRef]
Figure 1. Schematic of the distribution of the four sampling sites. QM, Quercus mongolica; BP, Betula platyphylla; PM, Picea meyeri; LG, Larix gmelinii var. principis-rupprechtii.
Forests 16 00459 g001
Figure 2. Effect of N treatment and tree species on the relative abundance of bacterial (a) and fungal (b) dominant phyla. Histogram of relative abundance of dominant phyla significantly different under N treatments (c). Letters on top of the bar graph indicate significant differences (p < 0.05) in the relative abundance of dominant phyla among N treatments.
Forests 16 00459 g002
Figure 3. The results of two-way ANOVA demonstrated the effects of N treatments, tree species, and interactions on bacterial (a) and fungal (b) α diversity indices. Different lowercase letters above the box plots indicate significant (p < 0.05) differences in α diversity indices between N treatments.
Forests 16 00459 g003
Figure 4. Non-metric multidimensional scaling (NMDS) and ADONIS analyses based on the Bray–Curtis distance show differences in bacterial (a) and fungal (b) distributions. R2 indicates the degree of explanation for differences among treatments.
Forests 16 00459 g004
Figure 5. Clustered heatmap showing the change in abundance of bacterial and fungal functions of different tree species under N treatment (a). Differences in relative abundance of functional taxa under N treatment (b). The colors of the heatmap indicate different correlations, with blue indicating a positive correlation and red a negative correlation. Different lowercase letters above the box plots indicate significant (p < 0.05) differences in functional categories between N treatments.
Forests 16 00459 g005
Figure 6. Spearman correlation matrix analysis between soil bacterial dominance phylum (a) and soil fungal dominance phylum (b) and functional taxa. Blue indicates a positive correlation, and red indicates a negative correlation. * indicates p < 0.05, ** indicates p < 0.01, and *** indicates p < 0.001.
Forests 16 00459 g006
Figure 7. Bacterial community symbiotic networks (a) and fungal symbiotic networks (c) under different N treatments. The robustness of the bacterial network was calculated by randomly removing 50% of the taxa from each network (b). The robustness of the fungal network was calculated by randomly removing 50% of the taxa from each network (d). Nodes denote individual amplicon sequence variants (ASV), while edges denote significant correlations between ASV. The size of the nodes in the network graph is proportional to the relative abundance of the ASV, and the width of each edge is proportional to the Spearman correlation coefficient; the colors of the nodes indicate the different network modules; the blue and red edges denote the positive and negative relationships, respectively. Error bars in the histograms indicate the standard deviation of 100 repetitions of the simulation.
Forests 16 00459 g007
Figure 8. Soil factors with significant effects on bacterial (a) and fungal (b) dominance phyla, diversity indices based on Spearman correlation analysis, and random forests. The relationship between the α diversity index and soil multifunctionality was analyzed using regression analysis (c). Random forest analysis was used to analyze the soil factors that are important for soil multifunctionality and the importance values of each factor (d). Circles on the heat map indicate that the factor has a significant effect on the dominance phylum and the diversity index. The size of the circle represents the importance of the variable (a random forest was used to calculate the importance values). The color of the correlation heatmap represents Spearman correlation (blue is a positive correlation, and red is a negative correlation). R2 is the coefficient of determination, which is used in regression analysis to measure the extent to which the independent variable explains the variation in the dependent variable. The ns indicates p > 0.05, * indicates p < 0.05, and ** indicates p < 0.01.
Forests 16 00459 g008
Table 1. The results of two-way ANOVA and nonparametric tests showed the effects of N treatments, tree species, and interactions on soil properties, soil enzyme activities, and root morphological trait characteristics.
ParametersTreatmentsSpeciesTreatments × Species
F/HpF/HpF/Hp
Soil parameters
Water (%)0.4670.79239.300<0.0016.8340.337
pH1.5910.45135.093<0.0013.7260.714
SOC (g·kg−1)0.4650.79326.779<0.0014.8150.568
TN (g·kg−1)2.0020.36717.0300.0017.1980.303
NH4+-N (mg·kg−1)35.635<0.0013.0040.3912.8630.826
NO3-N (mg·kg−1)36.286<0.0011.4010.7052.8750.824
TP (g·kg−1)0.2300.89137.929<0.0014.4220.620
AP (mg·kg−1)0.2750.76158.912<0.0013.8410.005
SM60.304<0.00115.743<0.0014.1940.003
Soil enzyme activities
BG (µg·g−1·h−1)5.8570.05334.908<0.0017.6540.265
UE (U·g−1)17.384<0.00113.4830.0042.0790.912
ALP (U·g−1)7.3230.00218.358<0.0010.6870.661
Root traits
RD (mm)6.7770.03436.887<0.0010.5890.997
SRL (m·g−1)6.7010.03538.600<0.0010.5430.997
SRA (cm2·g−1)6.1430.04636.038<0.0010.7710.994
RTD (g·cm−3)6.2550.04437.096<0.0010.3170.999
Note: Water, soil water content; pH, soil pH; SOC, soil organic carbon content; TN, soil total nitrogen content; TP, soil total phosphorus content; NH4+-N, soil ammonium content; NO3-N, soil nitrate content; AP, soil available phosphorus content; SM, soil multifunctionality; BG, soil β-glucosidase enzyme activities; UE, soil urease enzyme activities; ALP, soil alkaline phosphatase enzyme activities; RD, absorbing root diameter; SRL, absorbing root specific root length; SRA, absorbing root specific root area; RTD, absorbing root tissue density; F, the F-value for ANOVA; H, the H-value for non-parametric tests. Bolded text indicates p < 0.05.
Disclaimer/Publisher’s Note: The statements, opinions and data contained in all publications are solely those of the individual author(s) and contributor(s) and not of MDPI and/or the editor(s). MDPI and/or the editor(s) disclaim responsibility for any injury to people or property resulting from any ideas, methods, instructions or products referred to in the content.

