Article

Improving Total Carbon Storage Estimation Using Multi-Source Remote Sensing

1
School of Ecology and Environment Science, Yunnan University, Kunming 650500, China
2
Plants and Ecosystems (PLECO), Department of Biology, University of Antwerp, 2610 Wilrijk, Belgium
3
Ministry of Education Key Laboratory for Transboundary Ecosecurity of Southwest China, Kunming 650500, China
*
Author to whom correspondence should be addressed.
Forests 2025, 16(3), 453; https://doi.org/10.3390/f16030453
Submission received: 19 February 2025 / Accepted: 25 February 2025 / Published: 3 March 2025
(This article belongs to the Section Forest Inventory, Modeling and Remote Sensing)

Abstract

:
Accurate estimations of forest total carbon storage are essential for understanding ecosystem functioning and improving forest management. This study investigates how multi-source remote sensing data can be used to provide accurate estimations of diameter at breast height (DBH) at the plot level, enhancing biomass estimations across 39.41 × 10⁴ km2. The study is focused on Yunnan Province, China, which is characterized by complex terrain and diverse vegetation. Using ground-based survey data from hundreds of plots for model calibration and validation, the methodology combines multi-source remote sensing data, machine learning algorithms, and statistical analysis to develop models for estimating DBH distribution at regional scales. Decision tree showed the best overall performance. The model effectiveness improved when stratified by climatic zones, highlighting the importance of environmental context. Traditional methods based on the kNDVI index had a mean squared error (MSE) of 2575 t/ha and an R2 value of 0.69. In contrast, combining model-estimated DBH values with remote sensing data resulted in a substantially lower MSE of 212 t/ha and a significantly improved R2 value of 0.97. The results demonstrate that incorporating DBH not only reduced prediction errors but also improved the model’s ability to explain biomass variability. In addition, climatic region classification further increased model accuracy, suggesting that future efforts should consider environmental zoning. Our analyses indicate that water availability during cool and dry periods in this monsoon-influenced region was especially critical in influencing DBH across different subtropical zones. In summary, the study integrates DBH and high-resolution remote sensing data with advanced algorithms for accurate biomass estimation. The findings suggest that this approach can support regional forest management and contribute to research on carbon balance and ecosystem assessment.

1. Introduction

Forests play a crucial role in the global carbon cycle, climate regulation, and biodiversity conservation, making the accurate estimation of forest biomass and total carbon storage essential for a better understanding of their ecological functions and carbon storage potential [1,2]. DBH, defined as the diameter of a tree’s stem 1.3 m above ground level [3], is a key parameter widely used to assess tree growth, forest structure, and biomass [4,5]. As a primary metric in forest inventories, DBH provides a reliable basis for estimating stand volume and predicting forest growth. Research, furthermore, indicates that carbon storage correlates strongly with structural diversity parameters, including tree height and DBH, underscoring the value of DBH in carbon assessments and ecosystem function analyses [6].
Traditional measurements of DBH are typically manual, making them time-consuming, costly, and inefficient for large-scale forestry surveys [7]. Modeling the relationship between tree height and DBH through allometric growth equations has shown that power-law equations provide the best fit [8,9]. However, using tree height as the only variable generally leads to lower accuracy in predicting the biomass of older trees, because vertical tree growth slows down with time, while DBH generally does not [10]. To address these challenges, various remote sensing techniques for estimating DBH have been explored. For example, aerial imagery captured by unmanned aerial vehicles (UAVs) has been used to estimate tree canopy area, which can then be employed in regression models to indirectly estimate DBH [11]. Many studies have leveraged various types of LiDAR data for forest measurements [12], applying methods such as multiple linear regression [13], support vector machines (SVM) [14], filtering combined with random forest algorithms [15], k-nearest neighbors [16], and mean square average canopy height [17]. For detailed canopy structure analysis, Weibull parameters can also be obtained by fitting a Weibull density function to the canopy profiles [18]. Some studies highlight that using canopy features extracted from LiDAR data can significantly improve DBH estimation accuracy [19], especially compared to traditional area-based methods [9].
While traditional ground-based methods provide high accuracy on a local scale, they are limited in spatial coverage due to time, labor, and cost constraints, making them unsuitable for large-scale monitoring [20]. Remote sensing technologies for DBH estimation offer new opportunities for large-scale forest monitoring, largely overcoming the limitations associated with ground-based approaches [21]. Recent advances in remote sensing have provided various data sources and methodologies for estimating forest parameters, achieving significant progress in areas such as canopy density [22], tree height [23], and forest type classification [24]. Multi-source remote sensing data, such as those from Sentinel-1 and Sentinel-2, have gained popularity due to their high spectral resolution, broad spatial coverage, and easy accessibility [25,26]. For example, Sentinel-2 multispectral imagery has been successfully used to identify tree species and estimate parameters like leaf area index (LAI), demonstrating its potential in forest monitoring [25].
Using remote sensing to estimate DBH offers several distinct advantages. Firstly, it enables the continuous estimation of DBH distribution across large areas, significantly reducing the time and financial costs associated with traditional ground surveys [27]. Secondly, combining multiple data sources, such as radar and optical remote sensing, captures multi-dimensional information about forest structure, thereby improving the precision of DBH estimation [28,29]. For example, Sentinel-1 radar data, with their all-weather, day-and-night observation capabilities, can penetrate cloud cover and vegetation, which is particularly valuable in tropical and subtropical regions with high cloud cover [30]. Meanwhile, Sentinel-2’s multispectral data, with their high spectral resolution in visible and near-infrared bands, helps differentiate vegetation types and extract structural characteristics [25]. It not only helps differentiate vegetation types but also provides detailed information about the spatial distribution and structural characteristics of trees, which is essential for forest management and conservation efforts [31].
Despite these advancements, there remains a lack of studies specifically focused on DBH estimation using remote sensing, which limits the application of remote sensing data in comprehensive forest structure and ecosystem function assessments [32,33]. To fill this gap, our study uses multi-source remote sensing data (including Sentinel-1 and Sentinel-2), topographic data, and climate variables, coupled with five machine learning methods [34], to estimate the DBH distribution across Yunnan Province, China. Yunnan, located in China’s southwest, features varied topography and is a transition zone between tropical and subtropical climates, resulting in diverse vegetation types [35]. Thus, studying DBH distribution in this area does not only advance our understanding of forest structure, but also provides valuable insights for other regions with varied and diverse ecosystems.
We aim to accurately estimate the DBH distribution across Yunnan Province, providing a basis for biomass and ecosystem functioning assessments. The primary objectives of this study are to (1) develop an accurate estimation of DBH distribution in Yunnan Province using integrated remote sensing data and machine learning approaches, addressing the current gap in large-scale DBH estimation, also analyzing the main driving factors to provide a more solid scientific basis for forest management; (2) utilize these DBH distribution data to estimate biomass allocation and total carbon storage across the province; and (3) explore the potential applications of DBH data in ecosystem functioning assessment, providing scientific support for sustainable forest management and global carbon balance research.

2. Materials and Methods
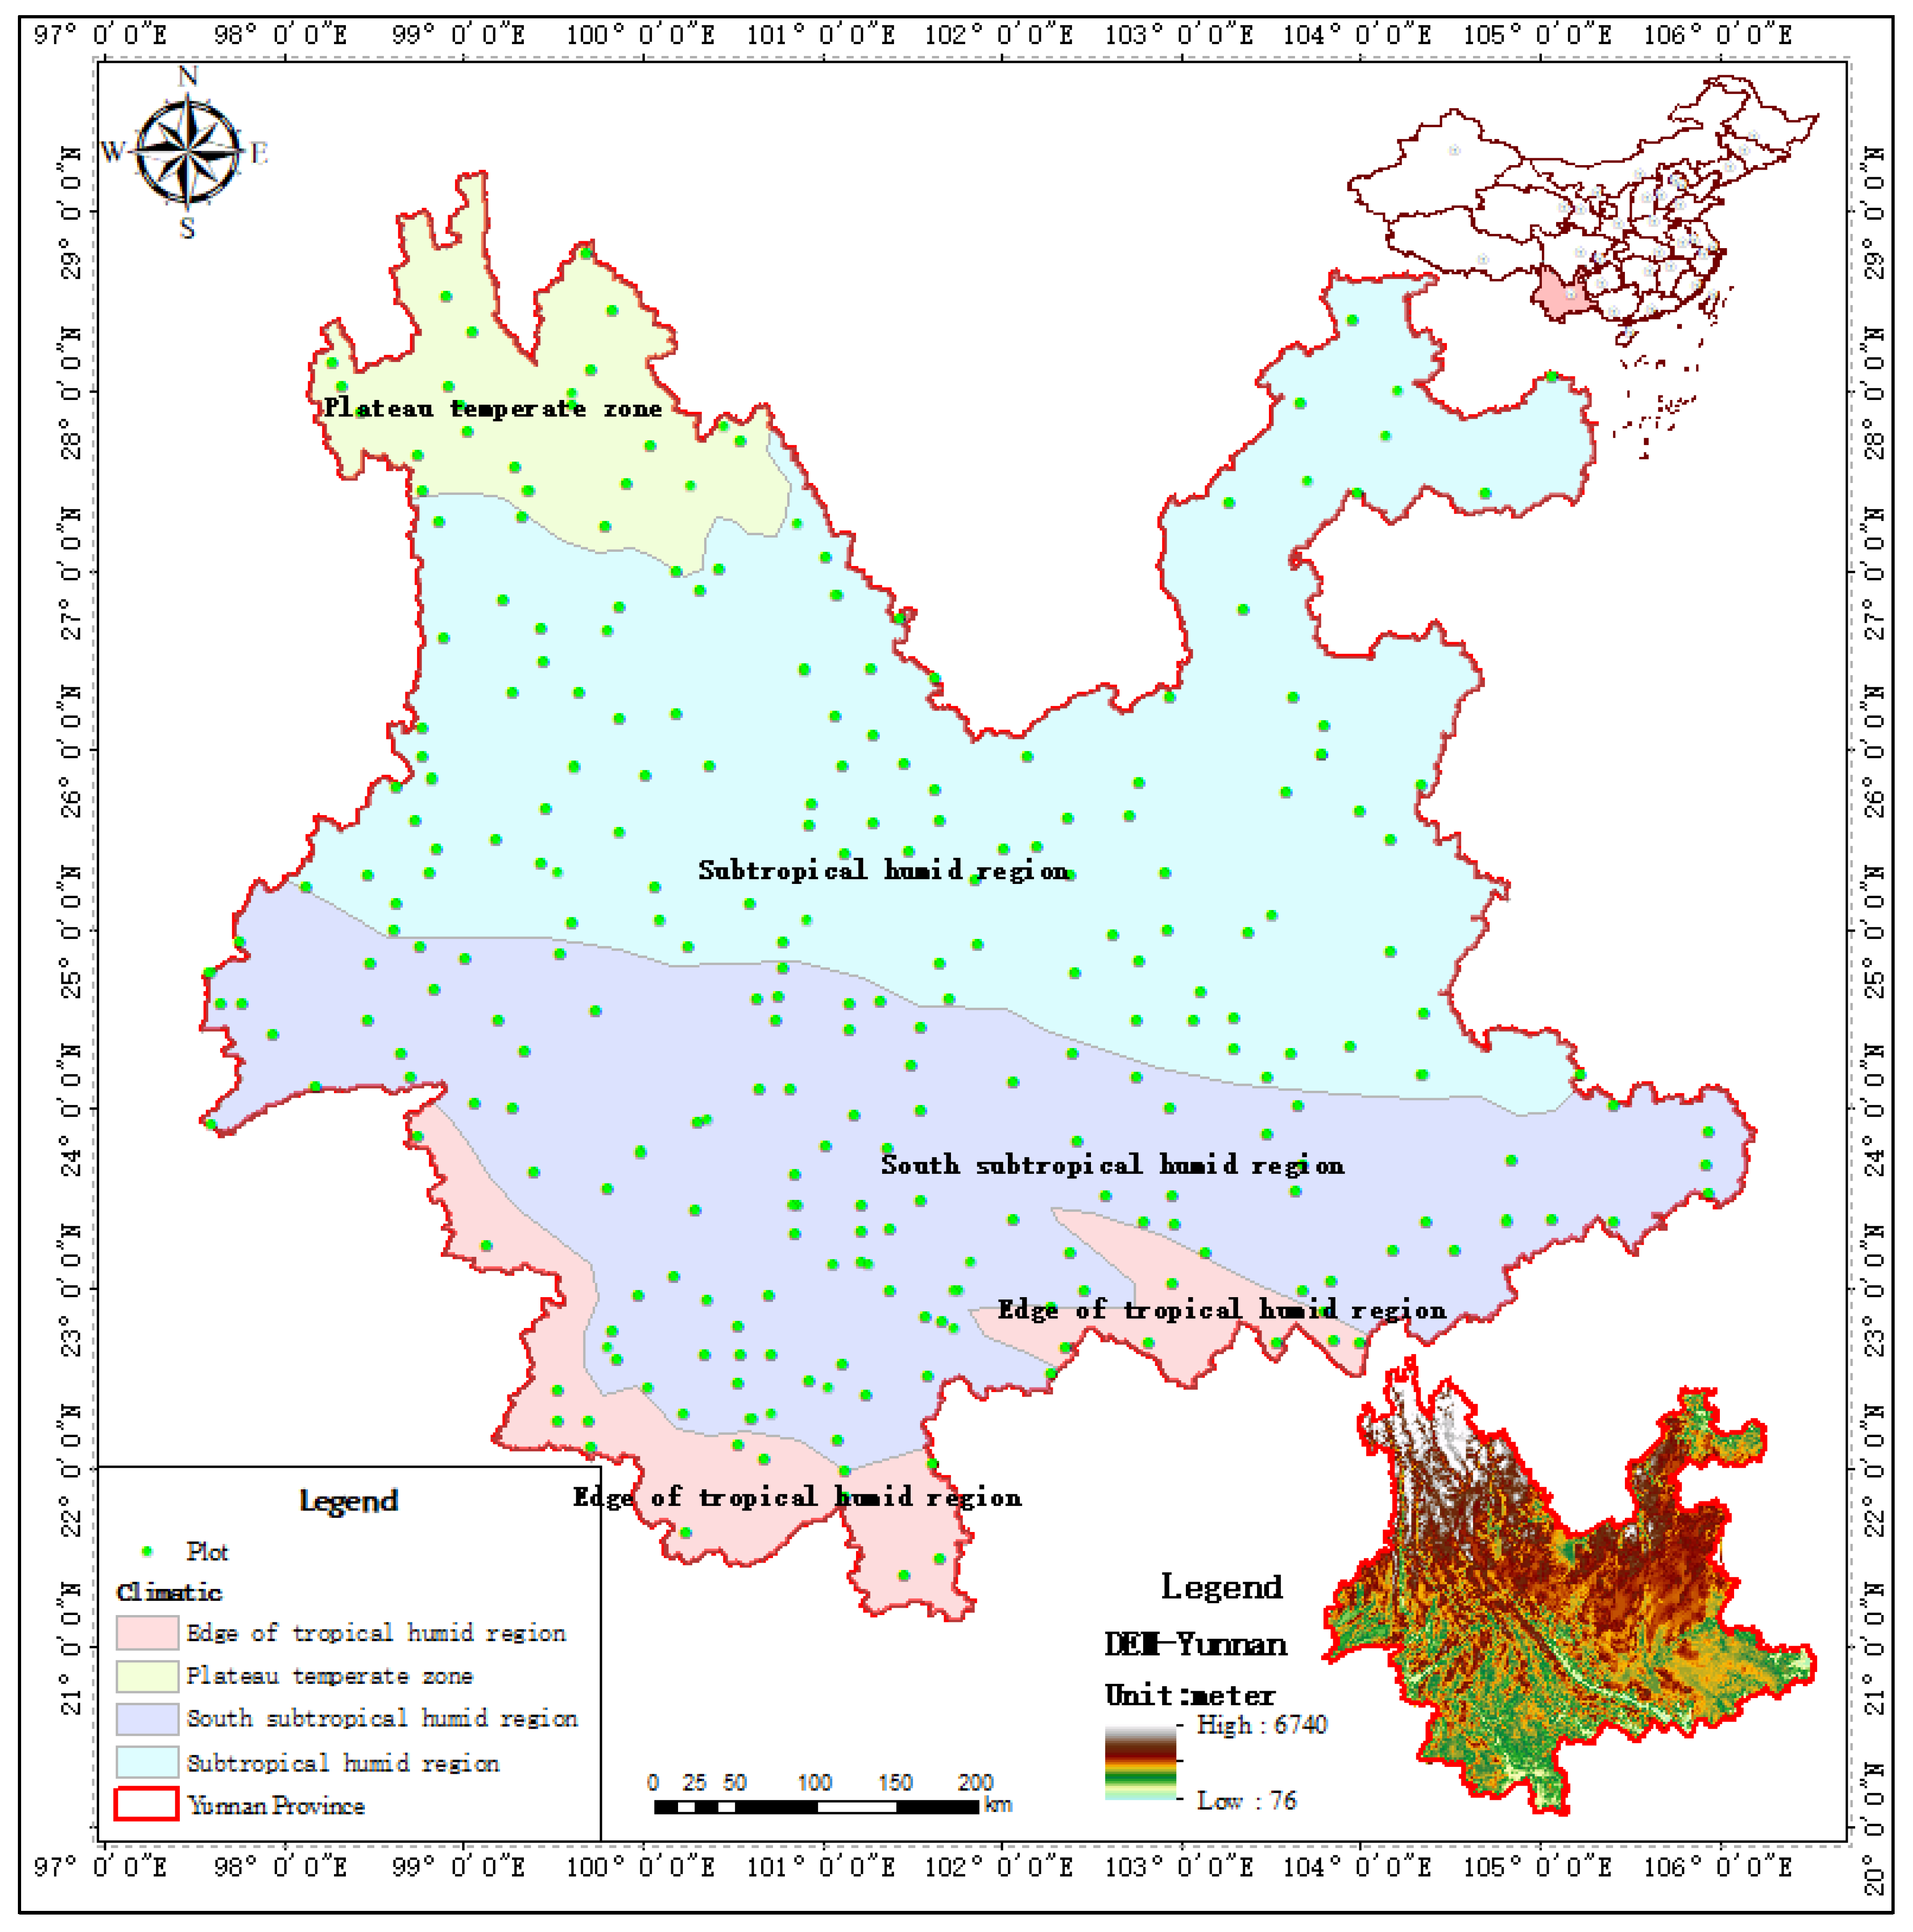
2.1. Study Area

Yunnan Province, in southwestern China (Figure 1), is located between 21° N and 29° N, and between 98° E and 106° E, with a total land area of 382,644 km2. It has an average elevation of about 2000 m above sea level, ranging from 76 m to 6740 m. Yunnan has a monsoon-influenced climate, with dry winters and humid summers. The annual precipitation is 1100 mm on average across the province, ranging from 837 to 1178 mm across the province, with the precipitation from June to August accounting for about 60% of full year totals. The mean annual temperature varies significantly because of the varied topography, but annual temperature differences are limited given the latitude (generally 10–15 °C). Light is fairly abundant, with 1800–2700 sunshine hours in most areas of the province.
Yunnan Province is a forest-rich region, with 212,000 km2 of forests (i.e., a cover rate of 65%) and an estimated forest stock volume of 2.07 billion m3 [36]. Because of the diverse topography and climate, Yunnan features a wide variety of forest types, including tropical, subtropical, and temperate forests [37]. In this study, we used data from 726 surveyed sites across the province serve as representative samples of specific forest structures and local environmental conditions. These sites effectively capture most of the ecological, topographic, and climatic variation across the region, making them suitable for analyzing broader environmental trends and forest dynamics at multiple scales (Figure 1).
Yunnan Province lies on the southwest border of China. The 726 plots are 30 m by 30 m in size and are evenly distributed throughout Yunnan Province; they are divided based on different climatic characteristics and geographical location. The climatic zone of Yunnan Province includes a tropical rain forest climate zone, which is mainly distributed in Xishuangbanna and other places, with moderate temperature, heavy moisture, and abundant precipitation throughout the year. The subtropical humid climate zone is mainly distributed in Kunming, Qujing and other places, with four distinct seasons, abundant rainfall, and winter being warmer. The temperate humid climate zone is mainly distributed in Dali, Lijiang and other places, with a warm and rainy spring, hot and rainy summer, cool and dry autumn, and cold winter with little rain. The alpine climate area is mainly distributed in Shangri-La and other places; winter is cold, summer is short and cool, and there is less precipitation.

2.2. Methodology

The methodology of this study involves the following steps (Figure 2):
There were 39 independent variables including climate factor, topographic factor, vegetation index, forest structure factor, spectral index, and so on. The R2 coefficient of determination, indicating the model’s ability to explain data variation, ranged from 0 to 1, with higher values being better. The RMSE root mean square error indicates the model’s average prediction deviation; lower values are better. ROC means rate of change.

2.2.1. Data Collection and Preprocessing

Based on land use data from the Resource and Environmental Science Data platform (www.resdc.cn/data.aspx) accessed on 13 July 2020 with the resolution 1 × 1 km, the forest distribution range of Yunnan Province was extracted. A total of 36 potentially driving variables were collected, including topographic factors (e.g., slope, elevation, aspect) and climatic factors (e.g., precipitation, temperature, humidity). The dependent variable was the DBH.

2.2.2. Ground-Based Measurements

Field survey data: Detailed field surveys were conducted in 726 sites across Yunnan Province by members of the Yunnan Vegetation Research group in 2022–2024 (Figure 1), collecting DBH, AGB (aboveground biomass), BGB (belowground biomass), and species identity. Other data were sourced from multi-spectral remote sensing satellites (Sentinel-1 and Sentinel-2), meteorological datasets, and digital elevation models. Sentinel-1 data were used to capture vertical forest structure and tree height. During preprocessing, all variables were standardized so that they had the same resolution, and outliers were removed with missing data. The climatological data were primarily obtained from the World Climate Database website. The topographic data originated from the 30 m resolution STRM dataset provided by the United States Geological Survey (USGS).
Multisource image data: High-resolution satellite images from Landsat 8 and Sentinel-2 provided spectral data for vegetation analysis, with kNDVI (Kernel Normalized Difference Vegetation Index) calculated in the Google Earth engine (GEE) [38]. Forest age was derived from Cheng Kai et al. [39]. The spatial distribution data of soil texture in China was compiled using the soil-type map and soil-profile data from the Second National Soil Survey. Soil texture was categorized based on the relative content of sand, silt, and clay. Data are available on the Resources and Environment Science Data Platform (https://www.resdc.cn/Default.aspx) accessed on June 2020. Additionally, data on deep soil organic carbon content were sourced from SoilGrids at a 250 m resolution, ensuring scientific rigor and consistency across datasets [40]. Subsequently, the spatial resolution of these data was resampled to one kilometer and projected onto the WGS-84 coordinate system using ArcGIS. The variables in all models are summarized in Table 1.

2.2.3. Model Development and Training

Five machine learning algorithms (including random forest [41], support vector machine [42], gradient boosting tree [43], neural network [44], decision tree [45]) were applied to model DBH estimation. The dataset was split into training (20%) and testing (80%) sets randomly, and cross-validation was used to train and optimize each model.
Random Forest (RF): RF is an ensemble learning method that constructs multiple decision trees using bootstrap sampling and random feature selection to improve predictive accuracy and robustness. It is widely used for both classification and regression tasks due to its ability to handle high-dimensional data, reduce overfitting, and effectively manage missing values [34].
Support Vector Machine (SVM): SVM is a supervised learning algorithm that aims to find an optimal hyperplane to maximize the margin between classes in high-dimensional space. It is well-suited for small datasets, handles both linear and non-linear problems, and performs effectively in ecological data classification and regression tasks [42].
Gradient Boosting Tree (GBT): GBT is an iterative ensemble method that builds a sequence of decision trees, where each tree corrects the errors of the previous one by minimizing the residual loss. This method excels at capturing non-linear relationships and is less sensitive to outliers [42].
Neural Network (NN): NNs are computational models inspired by the structure of biological neural systems, consisting of interconnected layers of neurons that learn complex, non-linear patterns through weight adjustments and activation functions. They are particularly effective in remote sensing image classification and ecological variable prediction [46]. A class in scikit-learn was used to implement a multi-layer perceptron (MLP) for the regressor; the parameter with random_state = 42, with max_iter = 1000.
Decision Tree (DT): DT is a tree-structured model that splits data based on specific feature conditions, forming an interpretable set of rules for classification and regression tasks. It is favored for its simplicity, interpretability, and versatility in ecological modeling [45].

2.2.4. Analysis and Cross-Validation

The results were analyzed by comparing the model errors with and without the DBH variable, to assess the role of DBH in improving biomass estimation accuracy. Model performance was evaluated by using the coefficient of determination (R2), root mean square error (RMSE), and mean squared error (MSE) [47,48]. The model with the best performance (high R2 and lowest RMSE and MSE) was selected for biomass estimation across the study area.
R 2 = 1 i = 1 N ( y i y i ^ ) 2 i = 1 N ( y i y i ¯ ) 2
where y i is the actual value, y i ^ is the predicted value, y i ¯ is the mean of the actual values, and N is the number of observations.
R M S E = 1 N i = 1 N ( y i y i ^ ) 2
where y i is the actual value, y i ^ is the predicted value, and N is the number of observations.
M S E = 1 N i = 1 N ( y i y i ^ ) 2
where y i is the actual value, y i ^ is the predicted value, and N is the number of observations.
The rate of change (ROC) is calculated as follows:
ROC = ( T C S f u t u r e T C S c u r r e n t ) / T C S c u r r e n t
T C S f u t u r e is the total carbon storage of future; in the study, two shared socioeconomic pathways (SSPs) (SSP126 and SSP245) were used (https://www.worldclim.org/data/cmip6/cmip6climate.html) SSP126 accessed the monthly values were averages over 20 year periods 2021–2040, and SSP245 accessed the monthly values were averages from 2041–2060. SSP126 represents a future climate scenario with stringent greenhouse gas emission controls. In this scenario, it is assumed that the global community will be able to take effective measures over the next few decades to significantly reduce greenhouse gas emissions, thereby slowing the pace of global warming. In contrast, SSP245 depicts a scenario with weaker greenhouse gas emission controls, where the trend of global warming is relatively more pronounced. Due to the less stringent emission controls in the SSP245 scenario compared to SSP126, it is expected that the impacts of climate change will be more significant.

2.2.5. Estimation of Aboveground Biomass and the Total Carbon Storage

The random forest algorithm was used to estimate aboveground biomass and the total carbon storage across the study area. First, the optimal model using model-estimated DBH values was applied to predict biomass for each pixel; furthermore, in order to estimate the DBH accurately, the driving factors of DBH in different climate zones were further studied. Then, we ran a separate model excluding the DBH variable to estimate biomass, then calculate carbon storage by multiplying the biomass by a carbon conversion factor. The carbon conversion factor is usually 0.45–0.5, which means that the carbon content in biomass accounts for 45%–50% of the total biomass weight. In the study, the conversion factor is 0.45 [49], allowing for a comparison of model accuracy with and without DBH. Finally, the carbon storage estimation was compared with the traditional method based on the vegetation index [50].

3. Results

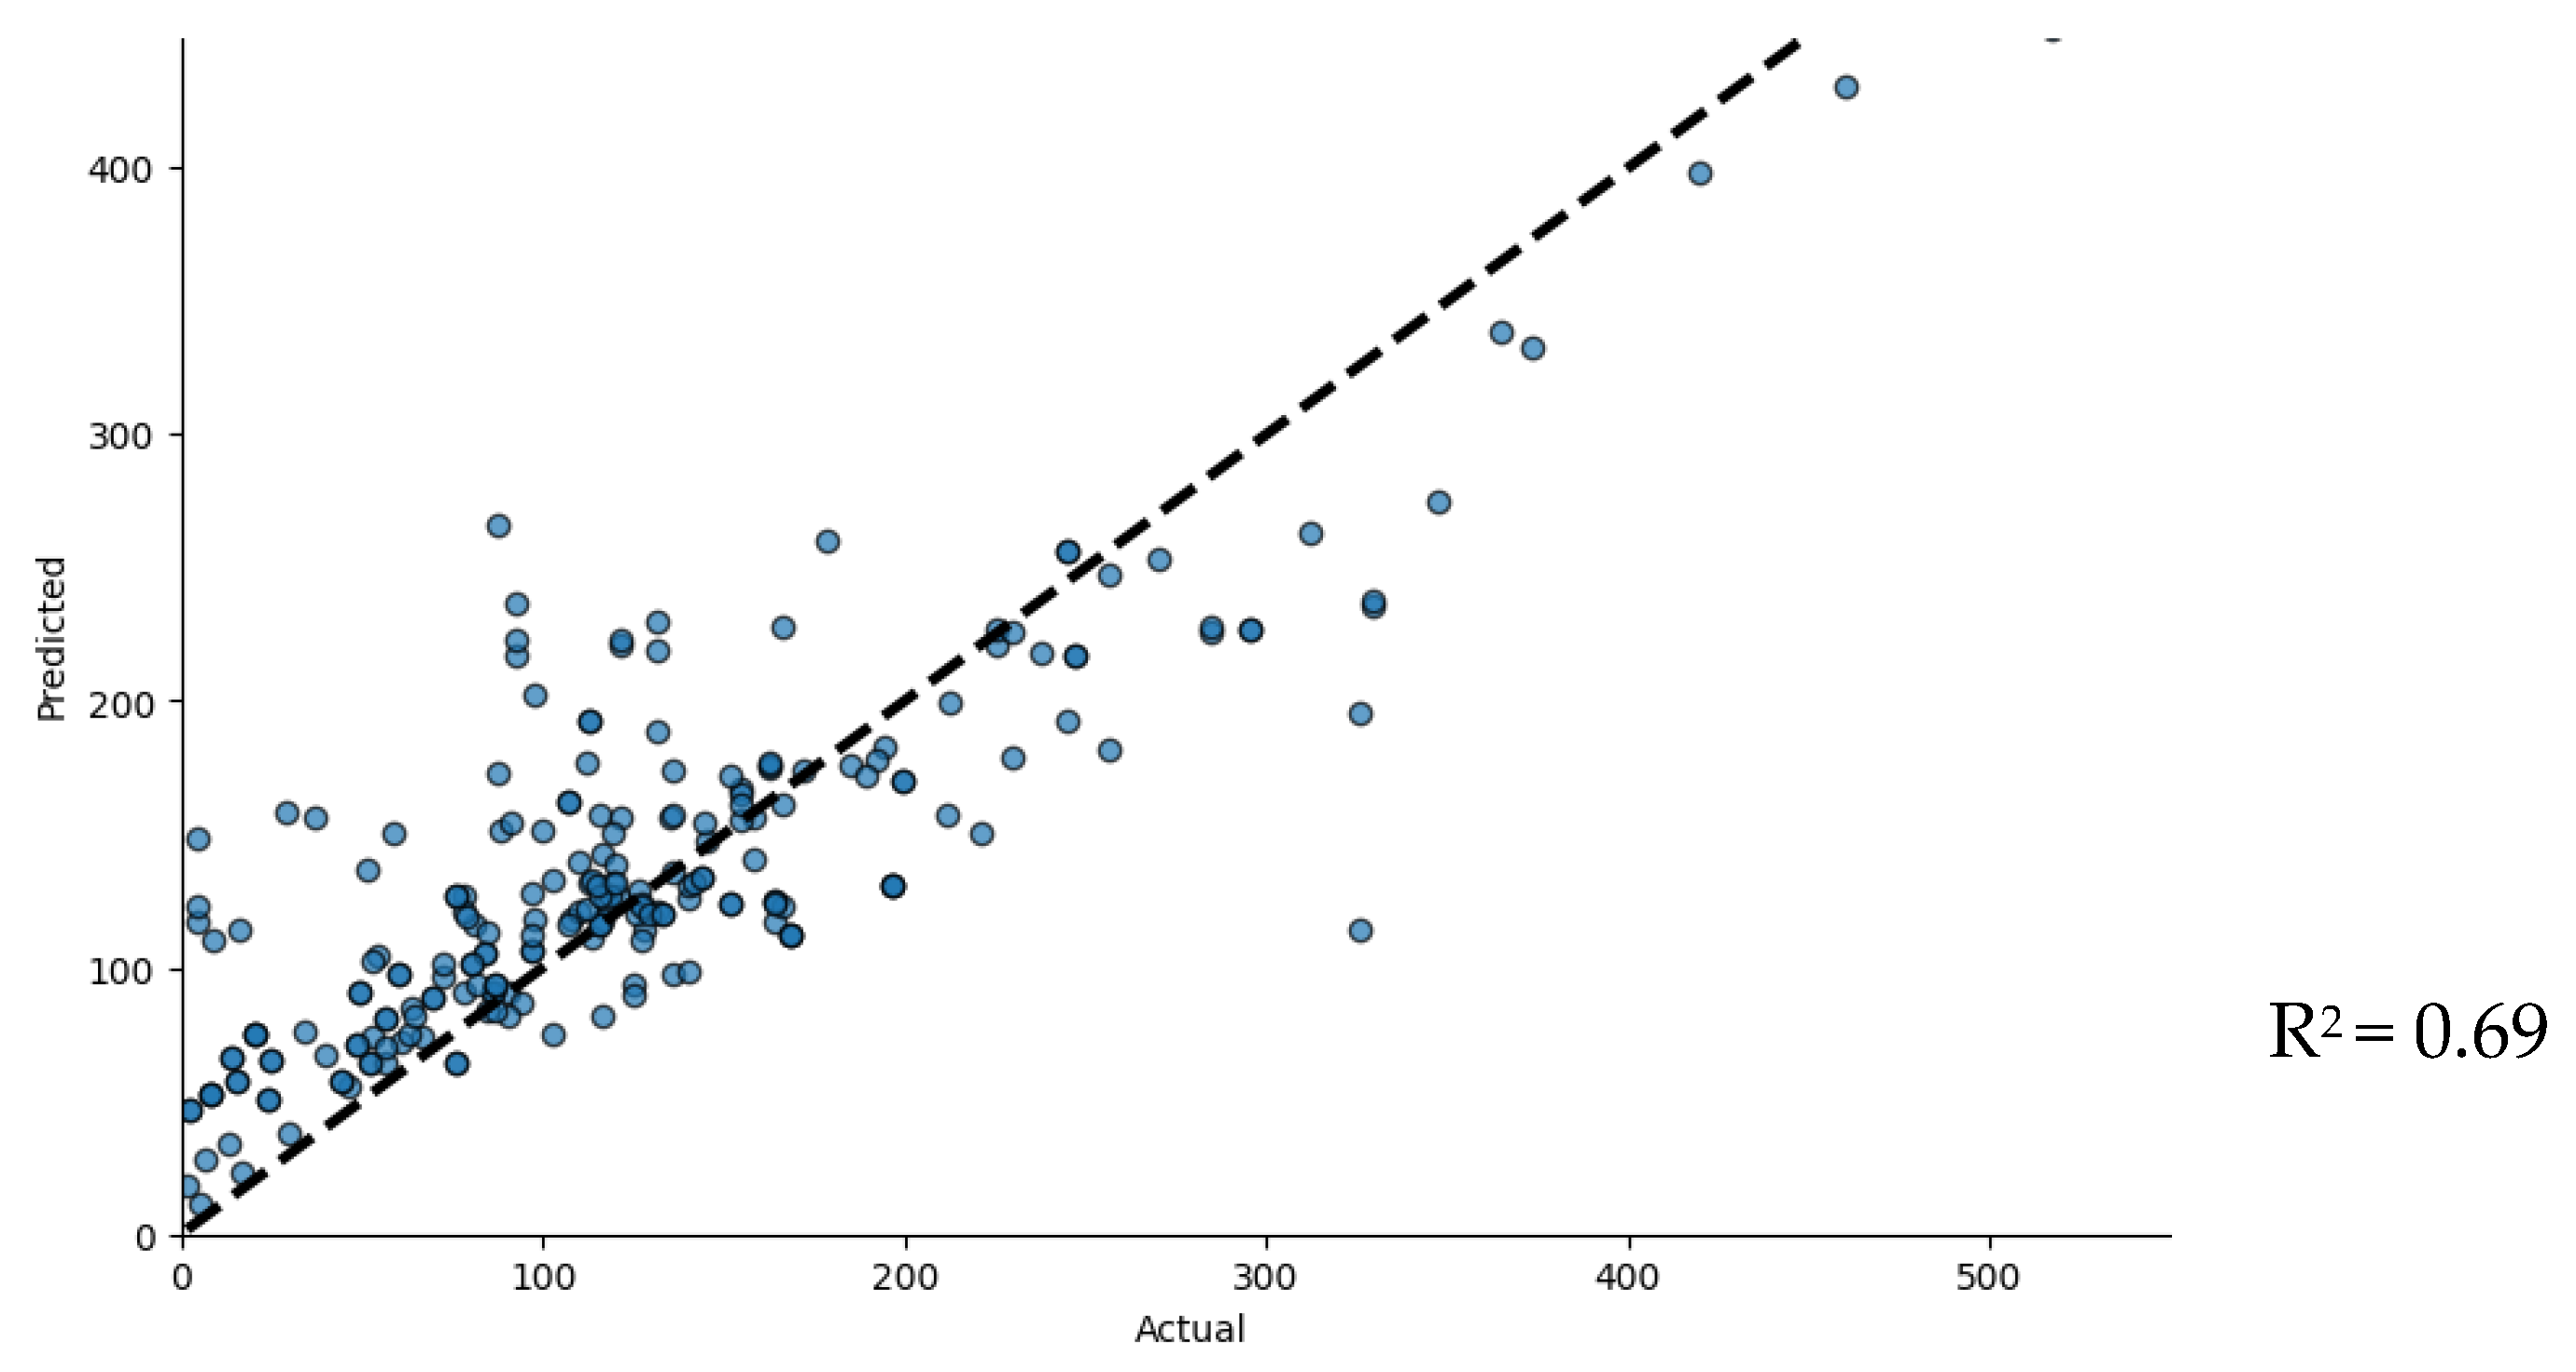
3.1. Comparison of Different Models to Estimate DBH

The evaluation results for five machine learning algorithms used in biomass estimation indicate varying levels of effectiveness. The random forest model achieved a rootmean squared error (RMSE) of 437.187 with an R2 value of 0.895, suggesting moderate predictive accuracy. Gradient boosting has a higher RMSE of 31.1 and a lower R2 of 0.769, indicating limited explanatory power. The neural network exhibits poor performance with a high RMSE of 48.382 and a negative R2 value of 0.440, suggesting it fails to capture the variability in the data. The decision tree model showed an RMSE of 6.824 and an R2 of 0.989, indicating a moderate fit. Finally, the support vector machine had the highest RMSE, approximately 61.825, and a near-zero R2 value of 0.086, indicating poor performance. Overall, these results suggest that none of the models performed particularly well, with random forest being the most effective among them (Table 2).
We also grouped the quadrate points according to their climatic zone (Figure 3) before calculating the DBH, i.e., into plateau climate, south subtropical humid region, and edge of tropical humid region groups. These regions capture the most ecologically and economically important forest types in Yunnan (temperate coniferous forests, subtropical evergreen forests, and tropical rainforests), ensuring that the study covers the province’s most significant forest ecosystems. The overall accuracy of the model was subsequently improved to some extent, as shown in Table 3.
In the plateau temperature zone, random forest showed the best performance, with gradient boosting close behind. In the south subtropical humid region, gradient boosting performed best, followed by random forest. Finally, in the edge of tropical humid region, gradient boosting again led, with decision tree and random forest also performing well. Neural network and SVM models consistently underperformed across all regions, with negative R2 values indicating low predictive accuracy. Overall, our model comparison highlights that random forest, gradient boosting, and decision tree models generally performed well, but their effectiveness varied based on the specific dataset or environmental context. In the first set (edge of tropical humid region), these models performed better, particularly in the edge of tropical humid region, compared to their overall performance in the second set (south subtropical humid region). Neural network and support vector machines consistently underperformed in both scenarios, suggesting that these methods seem unsuitable for biomass prediction in this context.

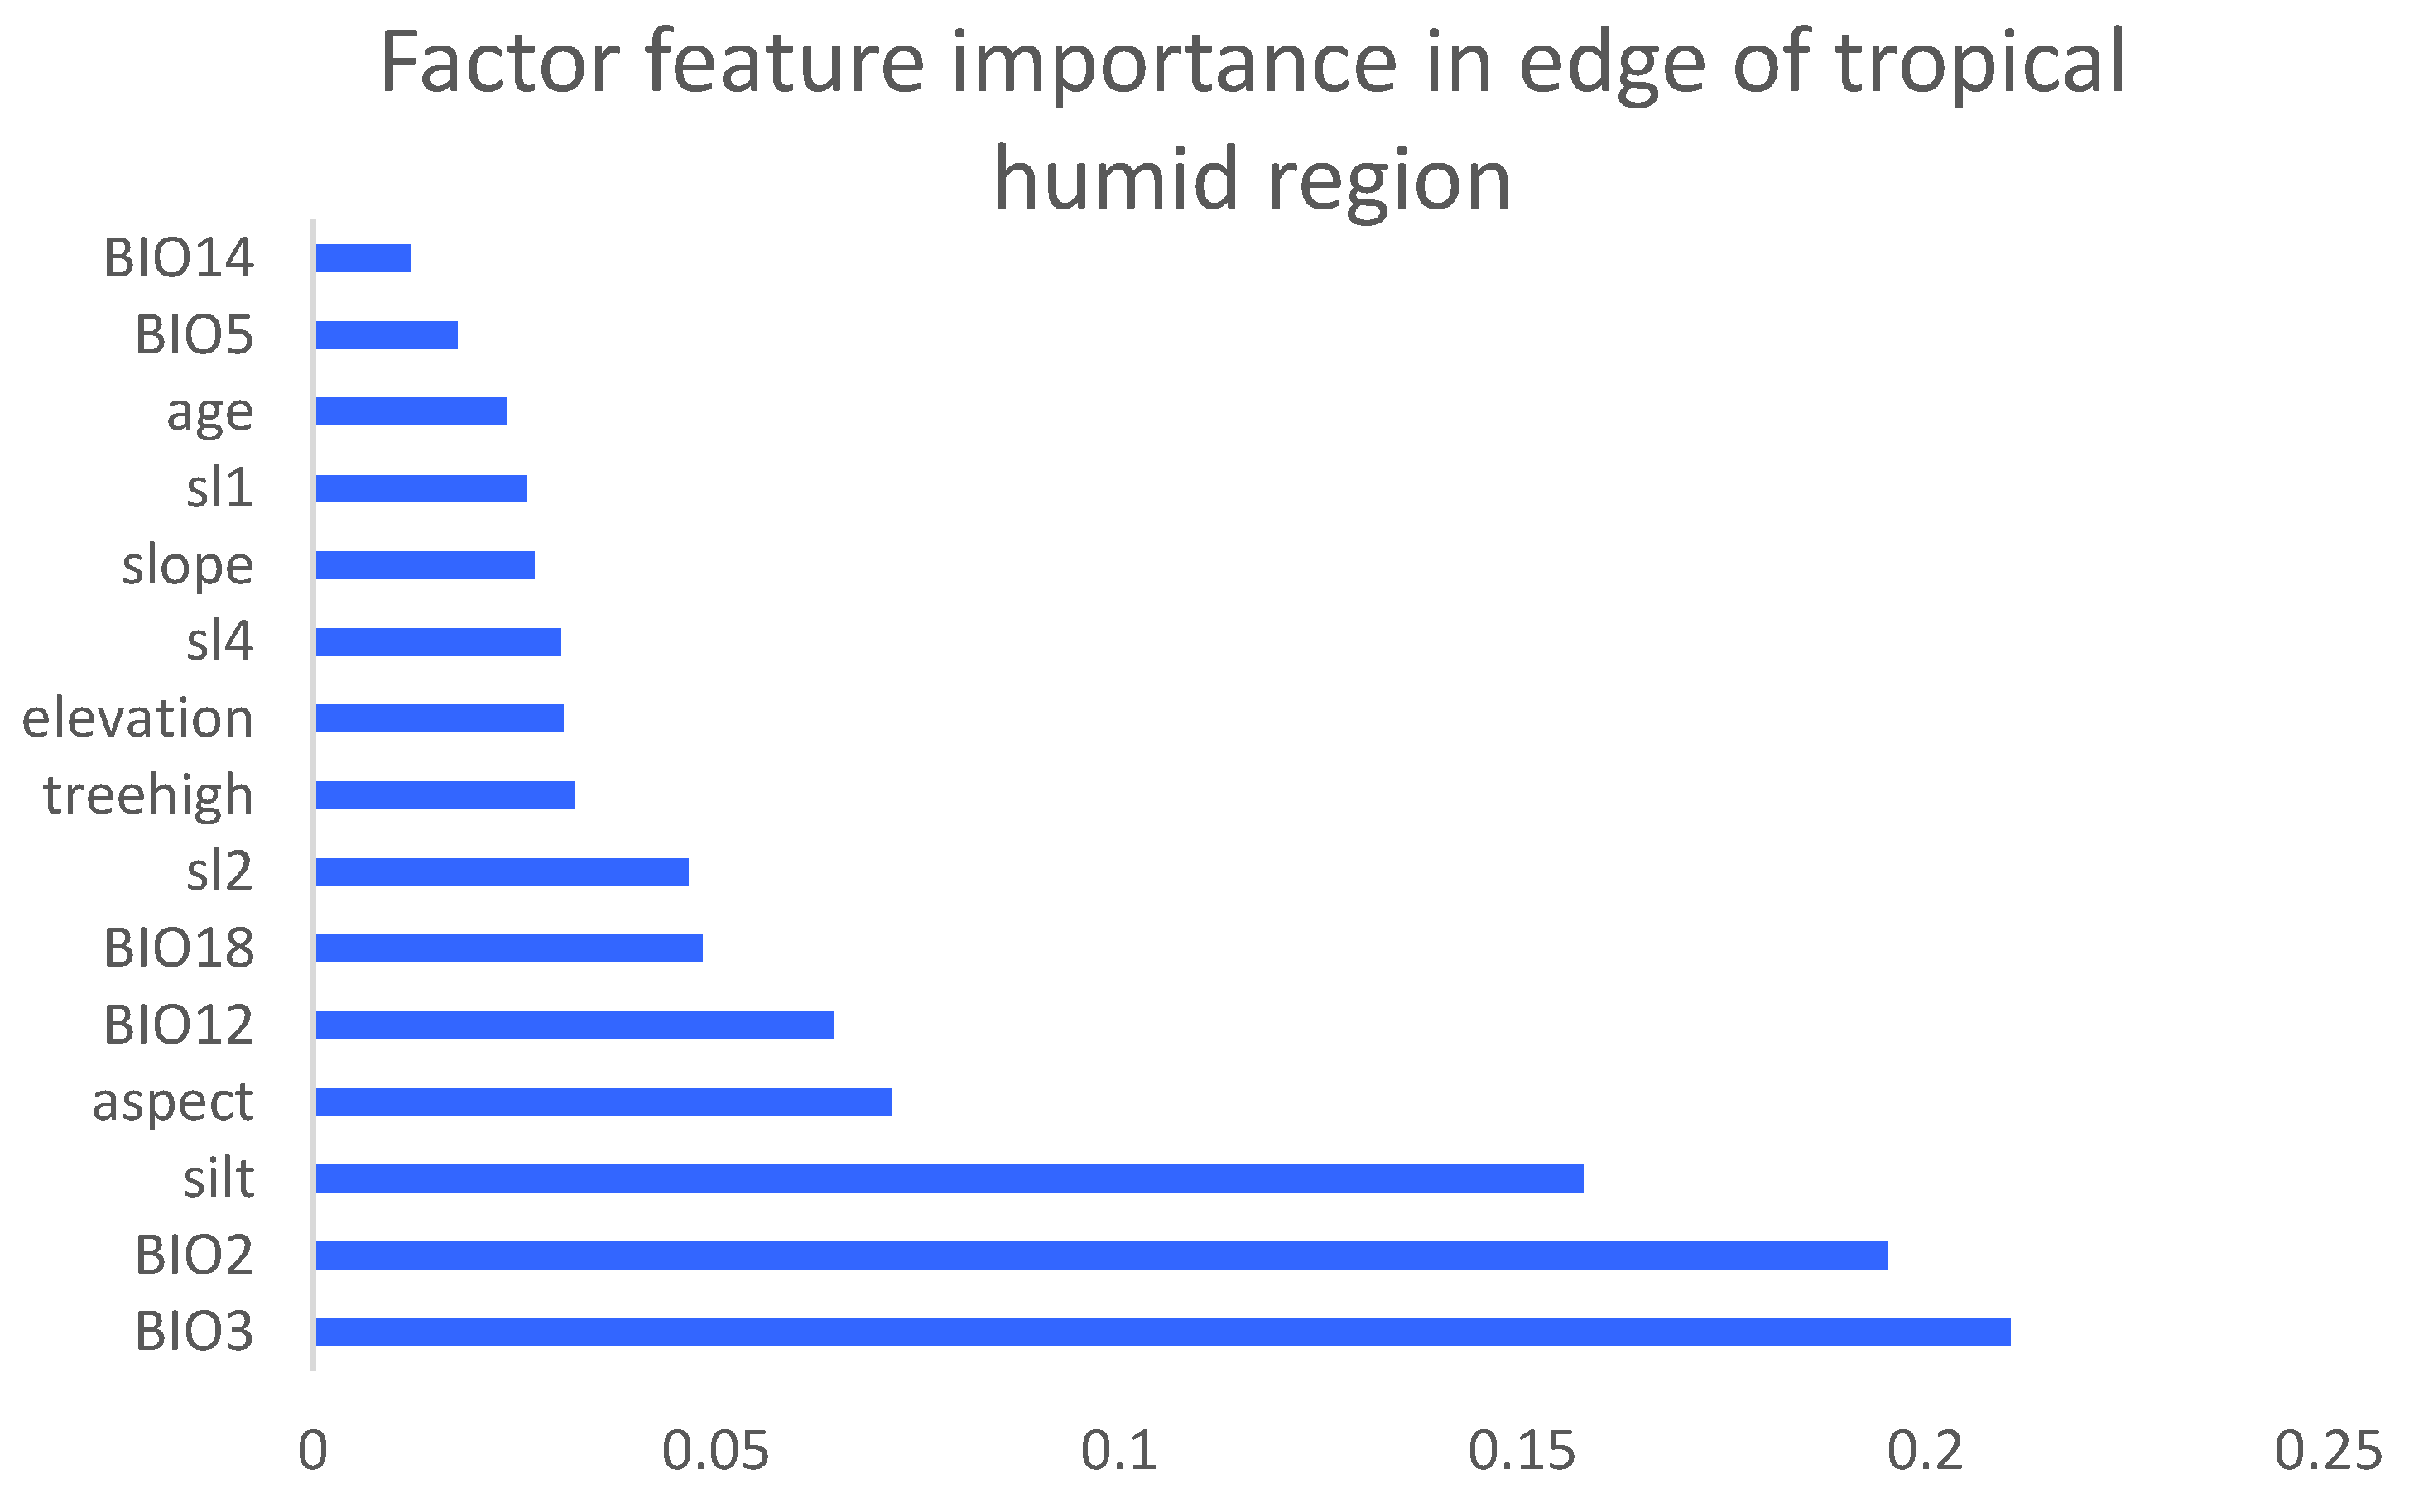
3.2. The Driving Factors of DBH in Different Climate Zones

To elucidate the driving factors of DBH, we subsequently address the three most important driving factors per climate zones in more detail (Figure 3). The importance ranking of factors in the plateau temperature region highlights the dominant role of precipitation, topography, and temperature variability in shaping forest ecosystems. The top three factors—BIO19 (precipitation of coldest quarter, 0.173868), elevation (0.152228), and BIO15 (precipitation seasonality, 0.13927)—indicate that cold-season precipitation and its seasonal variability are primary determinants of ecosystem dynamics (Figure 3).
In south subtropical humid region, the analysis indicates that soil properties, particularly the first soil layer (sl1), play a significant role in influencing tree DBH, accounting for 16.31% of the variation. Elevation and precipitation seasonality (BIO15) also have substantial impacts, with contributions of 15.65% and 10.52%, respectively. Other factors such as slope, temperature annual range (BIO7), tree age, and sand content further influence DBH, though to a lesser extent (Figure 4).
In the edge of tropical humid region, the result shows that environmental factors such as isothermality (BIO3) and mean diurnal range (BIO2) are the most influential in driving tree DBH in the edge of the tropical humid region. These factors explain over 40% of the variation in DBH. Silt content and aspect are also significant, contributing to the overall environmental complexity of the region. Climate-related variables like annual precipitation (BIO12) and rainfall in the wettest quarter (BIO18) further influence DBH, albeit to a lesser degree. The tree height and elevation also play a role, with soil factors such as sl2 and sl4 impacting tree growth at the edges of tropical humid regions. Other factors like age and the BIO5 (maximum temperature of the warmest month) have a lower importance in determining DBH (Figure 5).

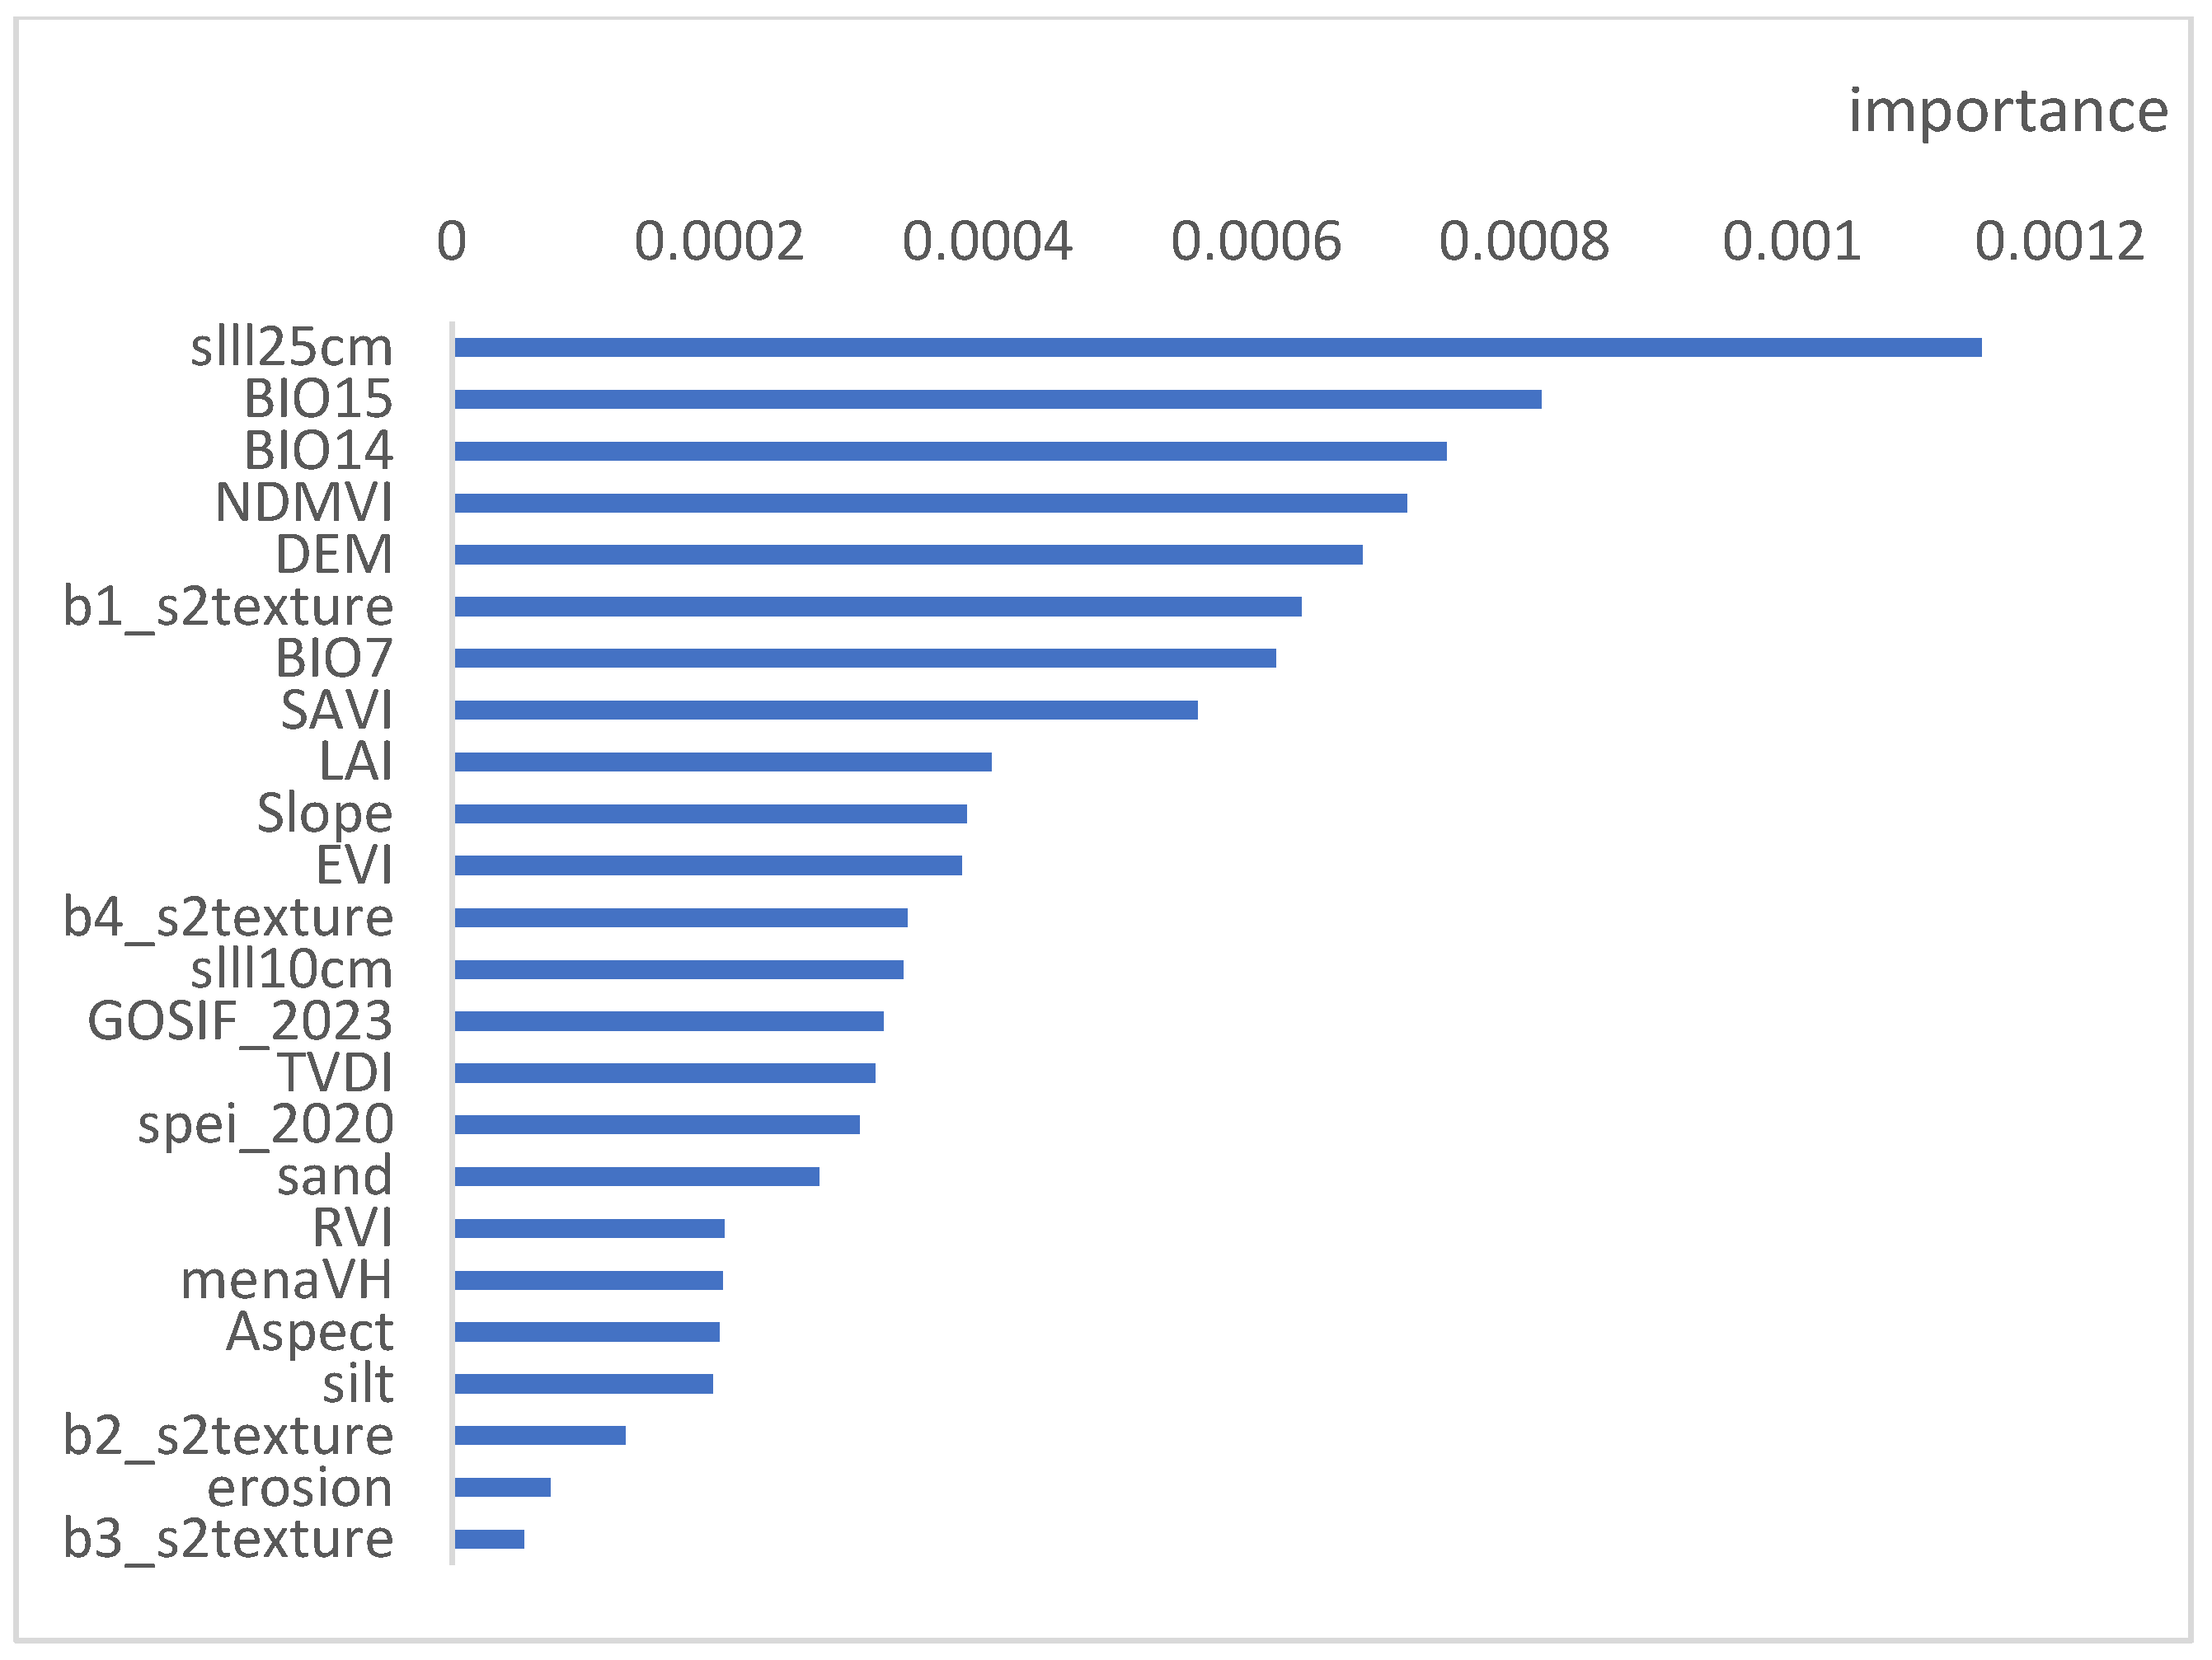
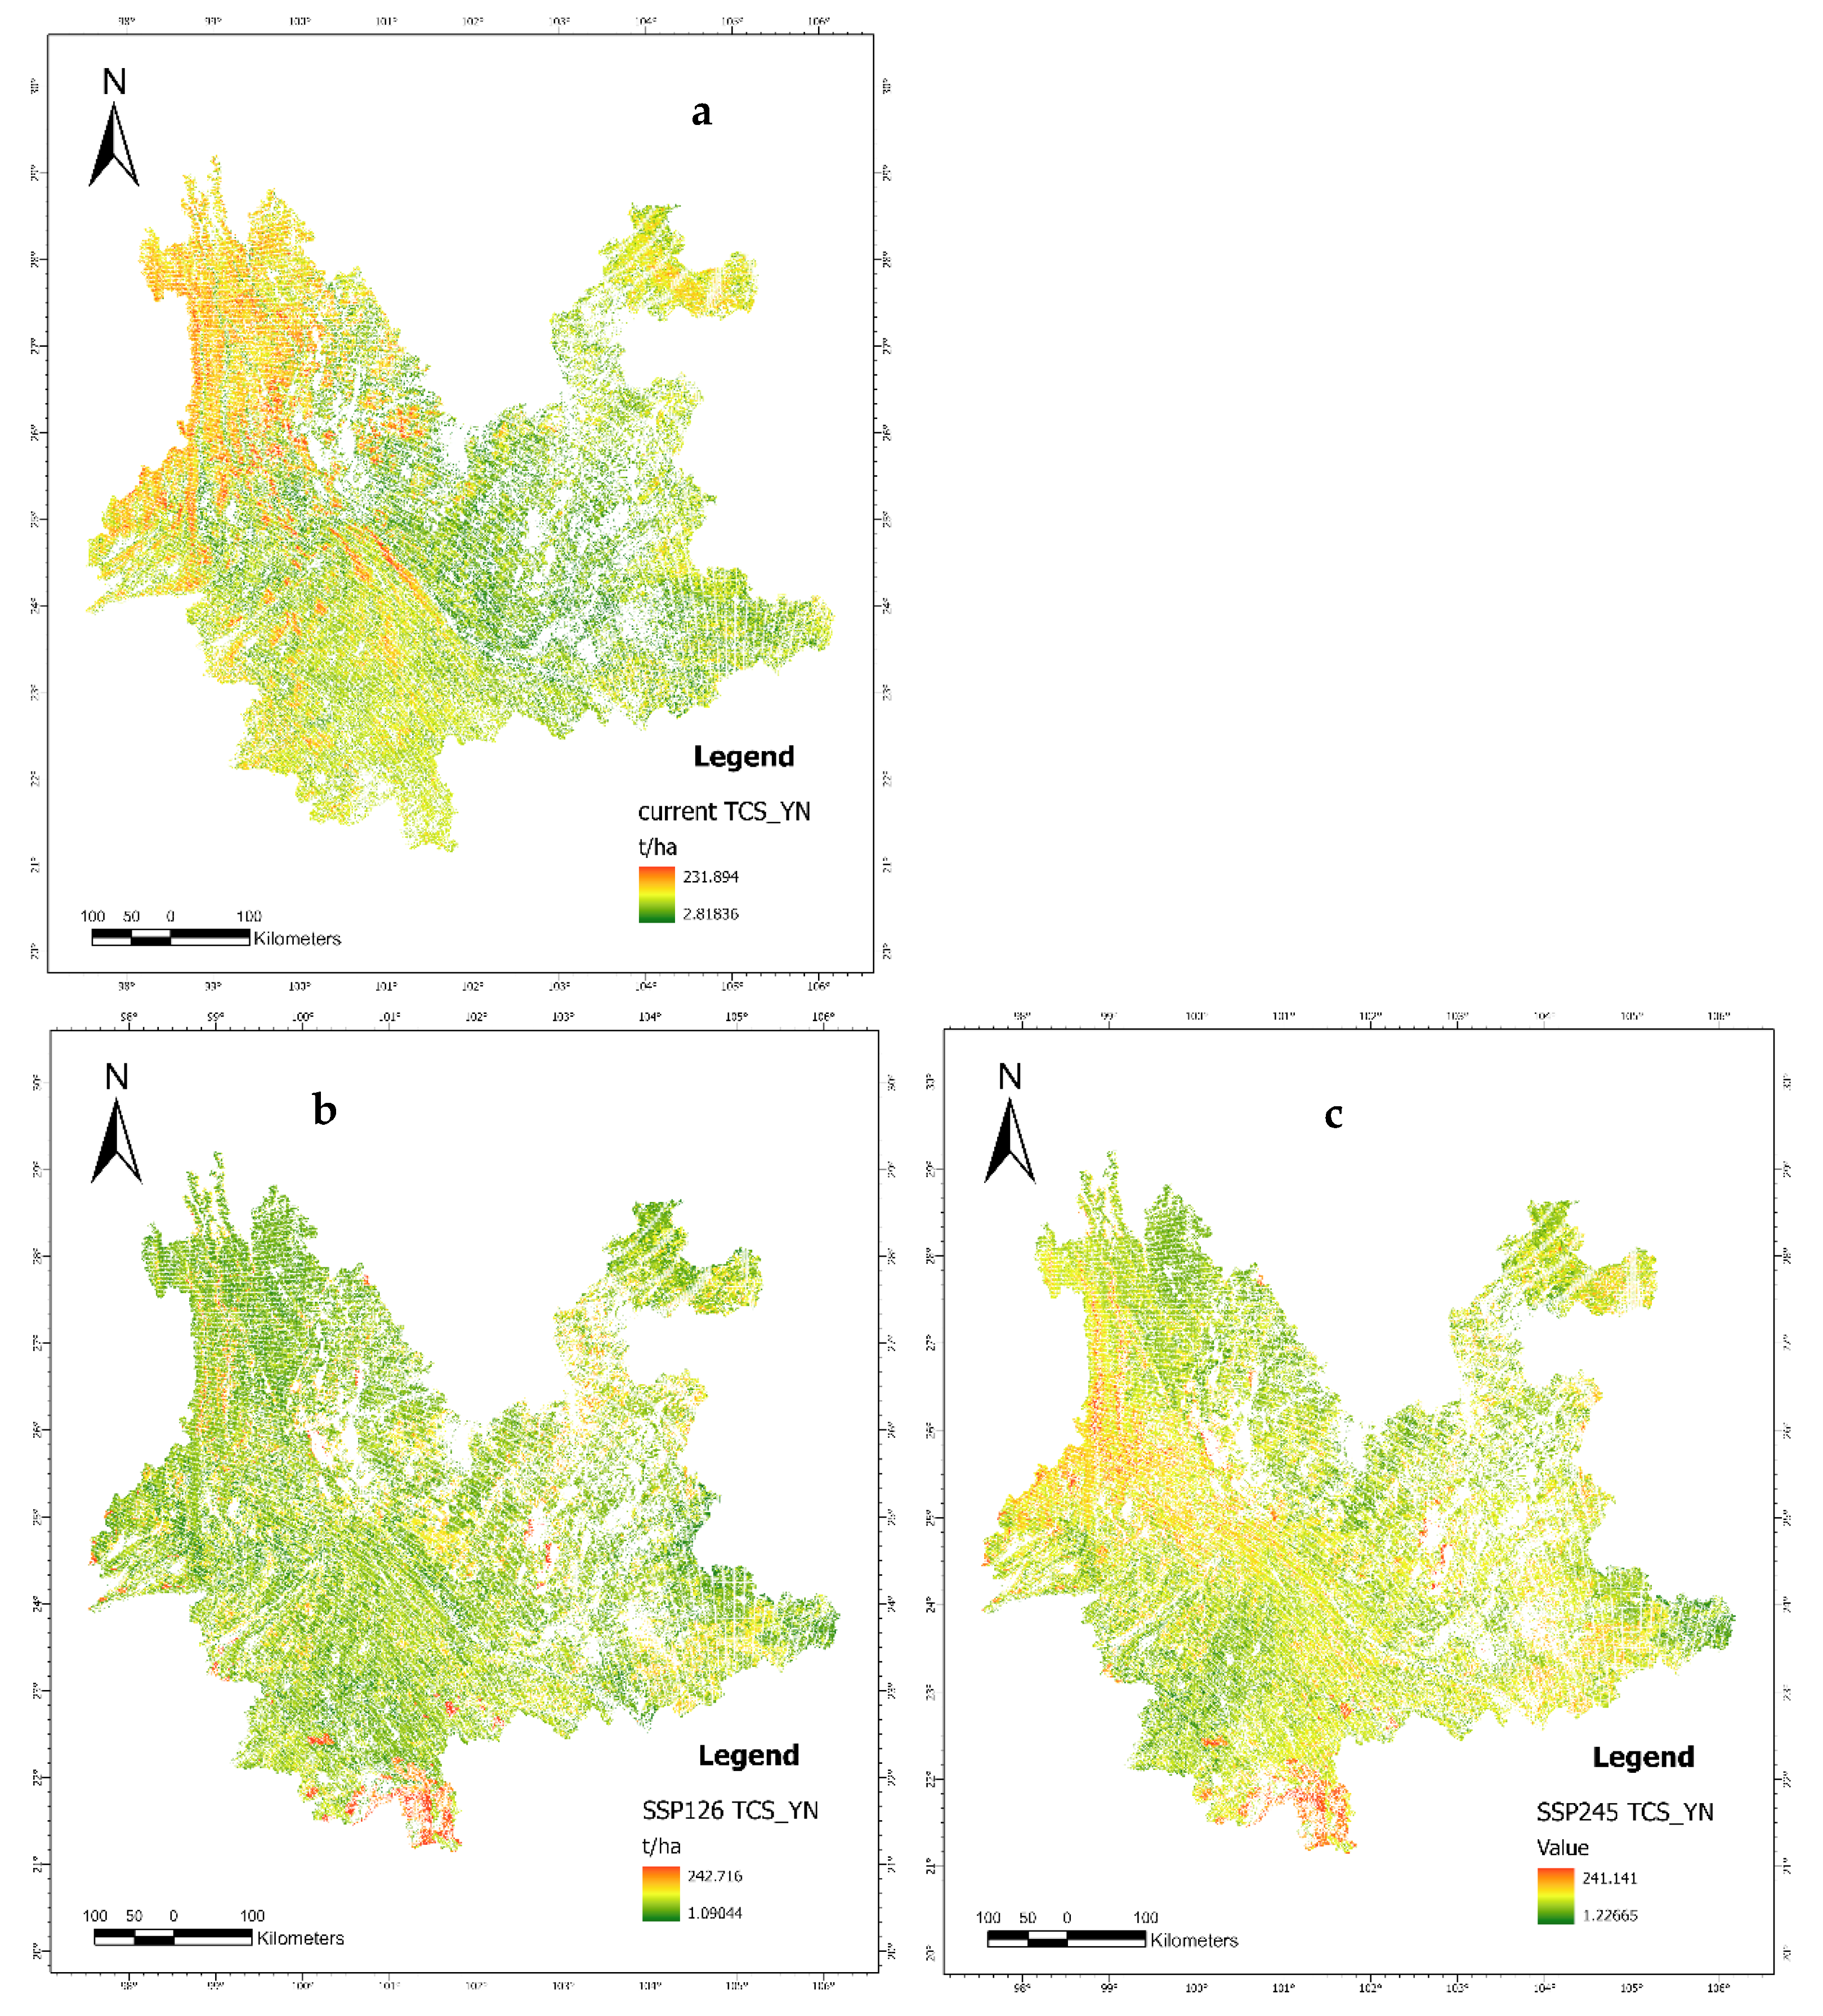
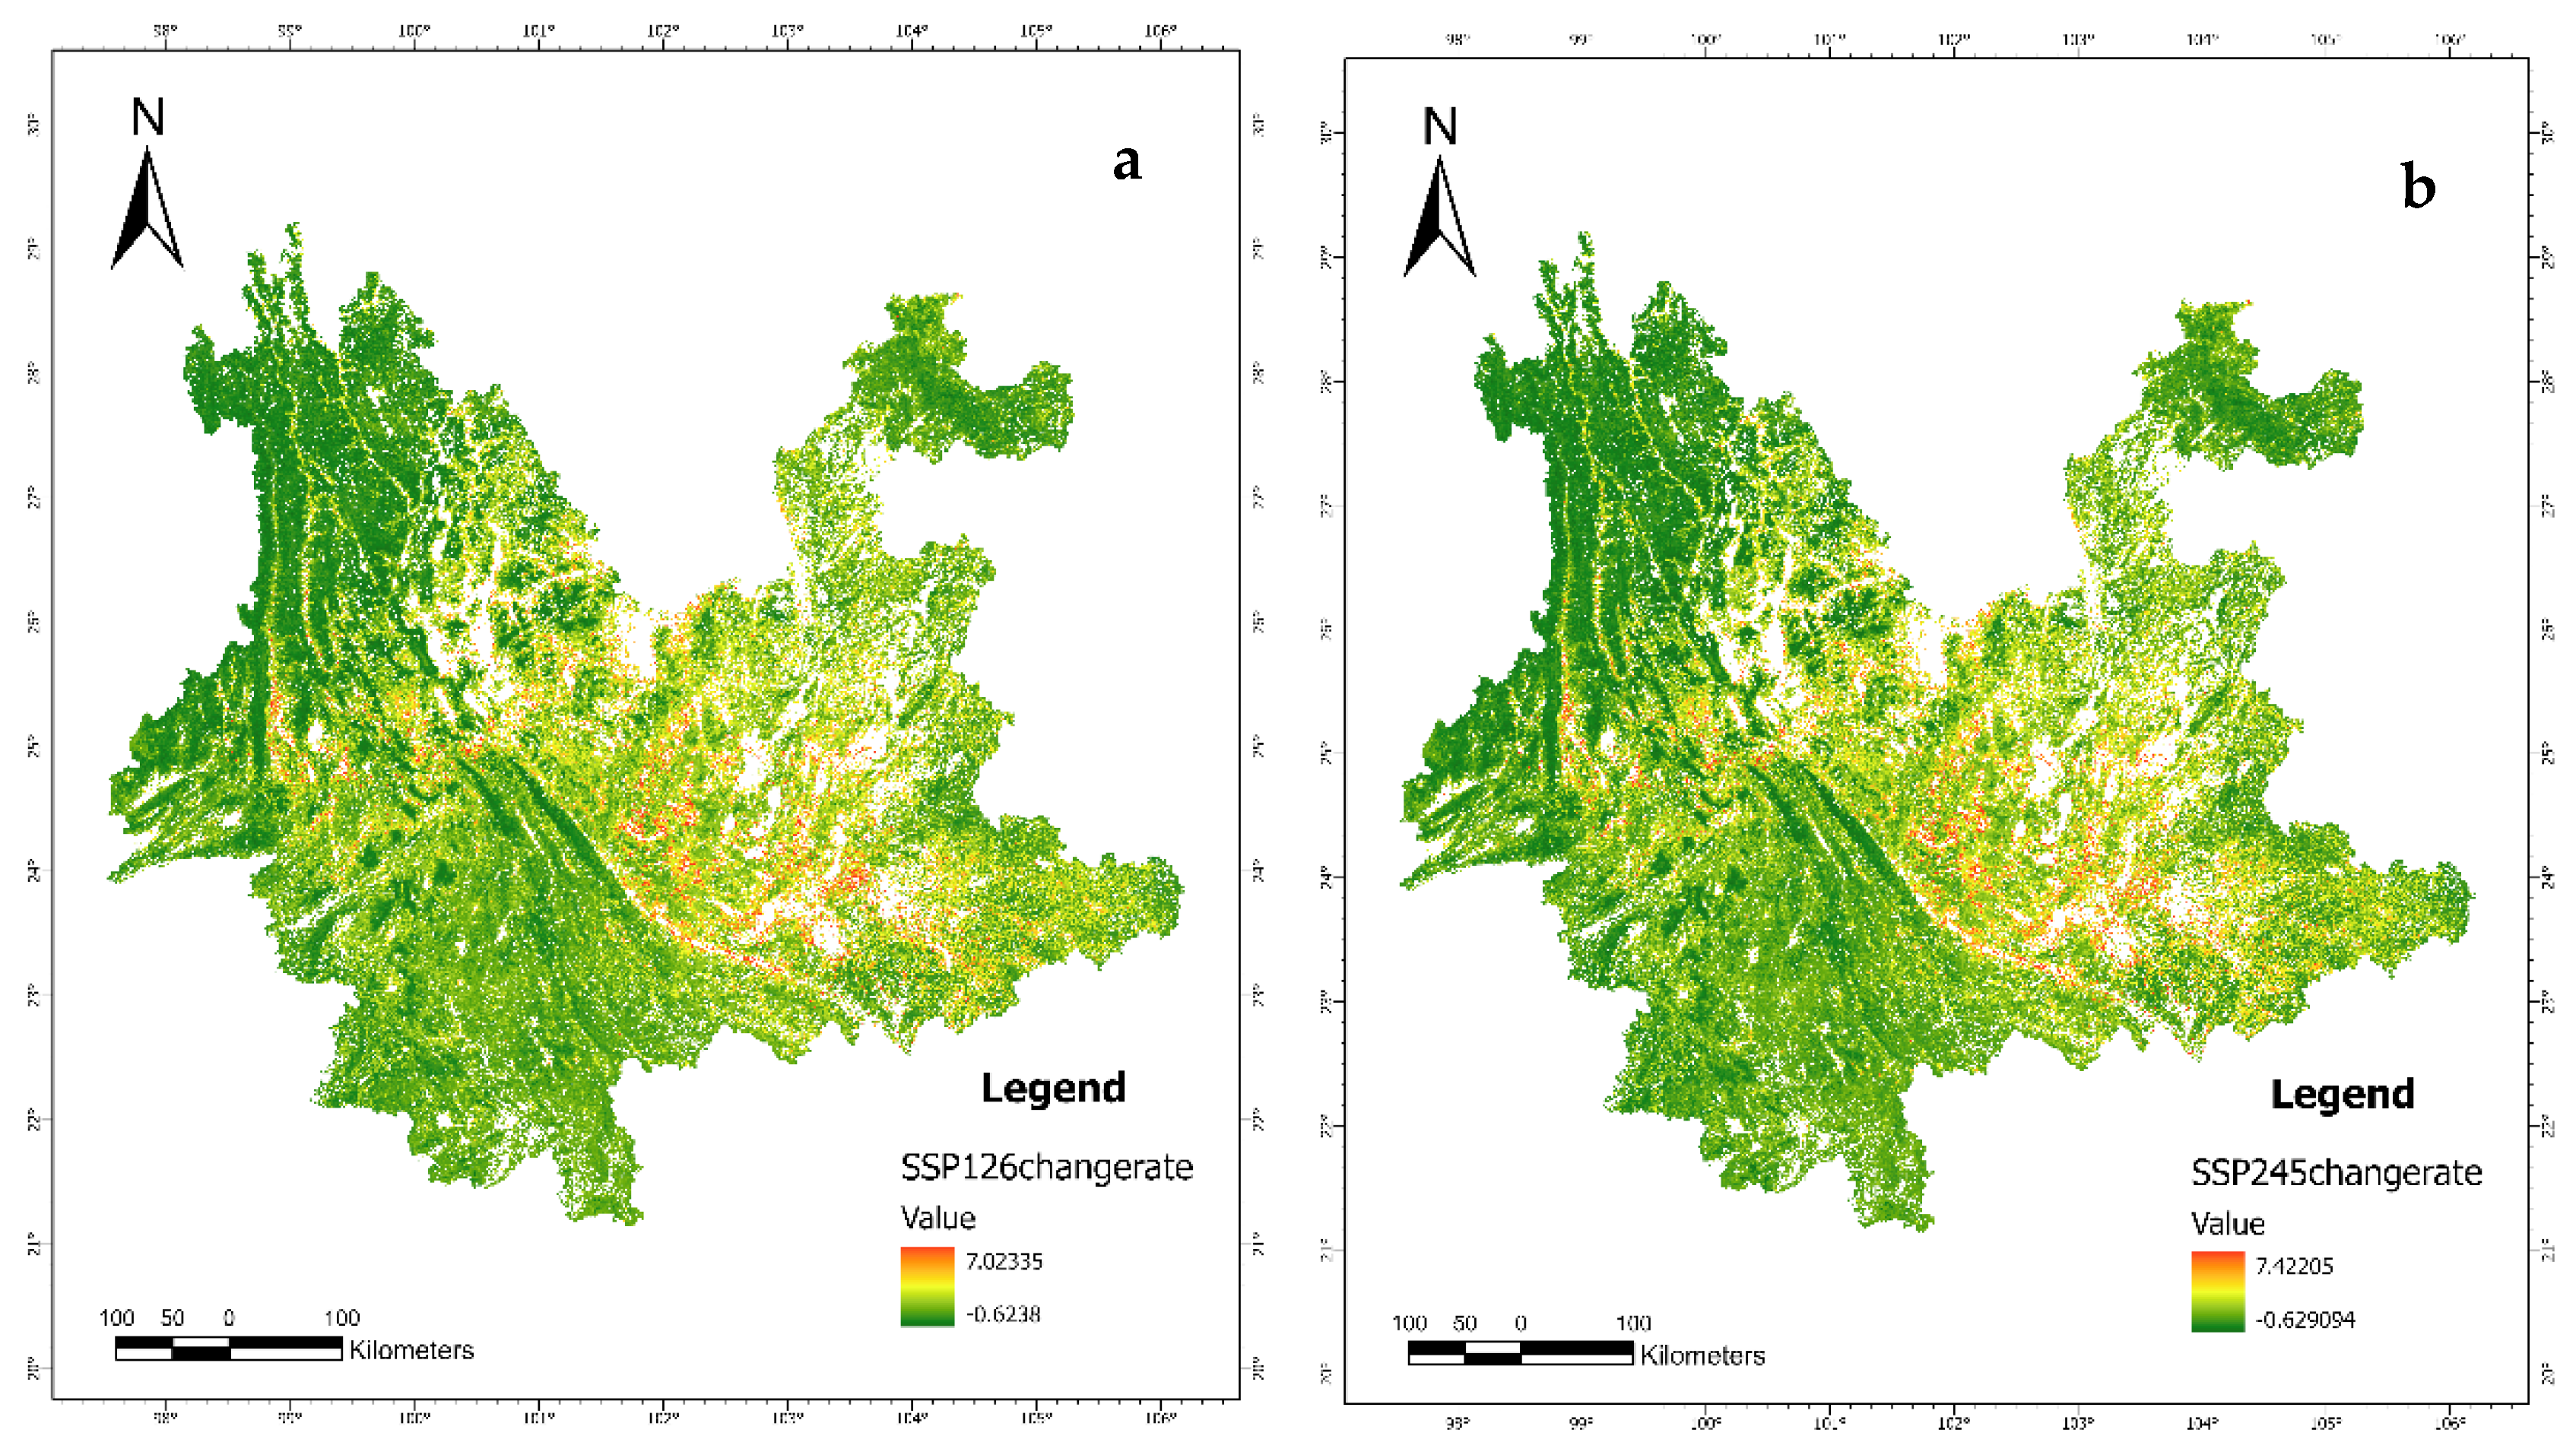
3.3. Total Carbon Storage Estimation

In this study, three different methods were used to estimate the biomass of the study area, namely, (1) a method based on the vegetation index, (2) a method without a diameter variable, and (3) a method with a diameter variable. First, the optimal model derived from the DBH data was applied to predict biomass for each pixel. Then, a separate model excluding the DBH variable was developed to estimate the biomass, allowing for a comparison of model accuracy. The aim was to identify the best method to estimate aboveground biomass and further uncover the driving factors of aboveground biomass on this basis.
Method with kNDVI: The study demonstrates that tree height, kNDVI mean, and tree age were key predictors for estimating aboveground biomass, with tree height contributing the most. The random forest model yielded a moderate fit with an R2 of 0.69 (Figure 6), indicating that these variables together explained a substantial portion of biomass variability. Although the MSE was somewhat high (2605.61 t/ha), this is quite typical in large-scale biomass estimations [51]. The findings suggest that while tree height is a key factor, vegetation indices like kNDVI and structural characteristics such as tree age also enhanced model accuracy. The random forest method was used to estimate aboveground biomass excluding DBH, resulting in an error R2 of 0.78 and an MSE of 1822 t/ha (Figure 7). The random forest method was used to estimate aboveground biomass with DBH, resulting in an error R2 of 0.97 and a mean squared error of 212.3 t/a (Figure 8).
The above results show that estimating biomass based on DBH variables has a high model fitting accuracy. Therefore, based on field survey data and ecological factors such as climate, terrain, and soil, the random forest model was adopted in this study to estimate the DBH distribution in Yunnan Province. The specific results are shown in the Figure 7. The R2 Score is 0.7742.
The image depicts a spatial distribution map of DBH with plot scale (DBH) (Figure 9) values across a geographic region, likely representing forest areas. The map is color-coded, with a gradient ranging from blue (representing lower DBH values, as low as approximately 47.4575 cm) to red (representing higher DBH values, up to around 314.178 cm). If we calculate the average 12 trees per plot in the actual survey, the average DBH distribution range is 4–26 cm. The variation in DBH values suggests differences in forest structure or tree growth patterns across the region. This map can provide insights into forest characteristics, such as tree size distribution, which is important for biomass estimation and ecological analysis in the region. In Yunnan Province, trees with higher DBH are mainly distributed in western and northern Yunnan, with a small distribution in southeast Yunnan, while trees with lower DBH are mainly distributed along the dry-hot river valleys and in the central and eastern rocky desertification areas of Yunnan.
The dominance of climate and soil variables in driving the DBH showed in Figure 8. Variables such as precipitation seasonality (BIO15), dry month precipitation (BIO14), and soil properties (e.g., slll25cm) dominate, suggesting that biomass is strongly influenced by environmental stressors like water availability and soil quality.
Vegetation Indices as Predictors: Indices like NDMVI, EVI, and SAVI play an important role, reflecting the vegetation’s structural and functional health. These indices integrate both climatic and edaphic factors, making them efficient predictors.
Topographic Influences: DEM and slope are moderate contributors, highlighting the importance of elevation-driven climatic gradients and water drainage.
Remote Sensing Features: Sentinel-2 texture features (b1_s2texture, etc.) and GOSIF_2023 contribute to biomass prediction but have a lower importance than climate or soil variables, likely due to their indirect relationship with biomass.
The model of predicted total carbon storage (TCS) based on DBH has the highest accuracy (Figure 10). On this basis, we further analyze the TCS distribution and its main driving factors in Yunnan Province. The image shows a spatial distribution map of TCS predictions across a region, using a 300 m resolution grid (Figure 6). The map is color-coded to represent TCS values in tons per hectare (t/ha), with a gradient ranging from green to red. Green areas correspond to lower TCS values (as low as approximately 1.17071 t/ha), while red areas represent higher TCS values (up to approximately 237.091 t/ha). This TCS prediction map can be used to assess carbon storage, vegetation density, and forest health, as well as to inform forest management and conservation strategies.
With the SSP126 scene, the TCS ranges from 1.09 t/ha to 242.71 t/ha and the mean TCS is 66.86 t/ha. With the SSP245 scene, the TCS ranges from 1.22 t/ha to 241.14 t/ha and the mean TCS is 67.52 t/ha. In the SSP126 climate scenario, the spatial pattern of TCS is highest in the south and relatively low in the north and east, while in the SSP245 climate scenario, it is higher in the west and south and lower in the north and southwest (Figure 11a,b).
The mean rate of change for SSP 126 to current is 0.23775, and the mean rate of change for SSP245 to current is 0.2485 (Figure 12).

4. Discussion

This study contributes to the growing body of research on remote sensing-based forest parameter estimation by demonstrating the effectiveness of integrating multi-source remote sensing data with machine learning algorithms for large-scale DBH estimation in Yunnan Province. Our results are in line with those of previous studies while also highlighting some key advancements and areas for further exploration.

4.1. Estimation of DBH Distribution and Biomass in Yunnan Province

This study presents a comprehensive approach to estimate the DBH distribution in Yunnan Province using integrated remote sensing data and machine learning models. It also explores the driving factors influencing DBH across different climate zones and applies the estimated DBH data to biomass and carbon storage estimation.

4.1.1. Comparison of Different Models for DBH Estimation

Several earlier studies have utilized remote sensing data for DBH estimation, employing various methodologies and data types. For instance, Wang et al. [52] demonstrated the use of LiDAR data for estimating tree height and DBH with high accuracy, although their approach is associated with the high costs and limited spatial coverage of LiDAR technology. Similarly, Ebadat Ghanbari Parmehr [53] used UAV-based aerial imagery to estimate tree canopy area and indirectly derive DBH, but this method also faced challenges related to data acquisition over large areas. Our study addresses these limitations by using more accessible and cost-effective satellite data, specifically, Sentinel-1 and Sentinel-2, which offer broader spatial coverage and high temporal resolution. Previous satellite-based studies, e.g., Corte [54] and Neuville [55], have utilized machine learning algorithms including random forests and support vector machines to predict forest parameters, yet these studies were confined to smaller study areas or specific forest types. In contrast, our research integrates these algorithms with multi-source remote sensing data to estimate DBH over a large, ecologically diverse region, achieving an R2 of 0.77. This result is comparable to or better than previous studies’ accuracy levels under the condition of covering a wide variety of forests, demonstrating the potential for scalable applications.
One of the novel contributions of this study is the integration of radar (Sentinel-1) and optical (Sentinel-2) data to capture a more comprehensive range of forest structural characteristics. Previous research has shown that combining different types of remote sensing data can improve parameter estimation by capturing various aspects of forest structure and conditions [56]. However, few studies have specifically explored this integration for DBH at plot-level estimation on such a large scale or just in one type of forest [57]. Our study confirms that combining radar and optical data provides complementary information, particularly in complex terrains like Yunnan Province, where cloud cover and diverse vegetation types often limit the effectiveness of single-source data. This study confirms the benefit of radar-optical integration, particularly in Yunnan Province’s complex topography, where persistent cloud cover and heterogeneous vegetation challenge single-source data approaches.
In addition to data integration, this study adopts a novel combination of machine learning models to enhance DBH estimation accuracy. By utilizing five machine learning algorithms, including random forests, support vector machines, gradient boosting neural network, and decision tree, the study addresses the complexity of the dataset and effectively captures the non-linear relationships among DBH and predictor variables such as spectral indices, topographic features, and climatic factors. This multi-algorithm strategy also allows the model to adapt to diverse landscape and vegetation types, which is crucial for scaling DBH estimation across large and complex regions like Yunnan. The results demonstrate that using an ensemble of models outperforms traditional single-algorithm approaches, consistent with findings from other studies [58] showing that combining machine learning models can increase the robustness of ecological predictions [59].

4.1.2. Driving Factors of DBH in Different Climate Zones

The results highlight the distinct environmental drivers of DBH across the three climate zones in Yunnan, reflecting the sensitivity of tree growth to specific climatic and soil conditions in each region. Diameter at breast height (DBH) is a key structural attribute of forest ecosystems, and its distribution in plateau climate regions is primarily influenced by precipitation variability, elevation, and temperature fluctuations. Our analysis indicates that the precipitation of the coldest quarter (BIO19: 0.1738) and precipitation seasonality (BIO15: 0.1392) are the most significant climatic drivers, highlighting the critical role of water availability during the dry season in regulating tree growth [60,61]. Elevation (0.152228) is another major determinant, affecting DBH distribution by modifying temperature and moisture availability, which, in turn, influence forest composition and productivity [62]. Additionally, temperature variability (BIO2: 0.091029, BIO7: 0.056624) plays an important role, suggesting that seasonal thermal stress is a key factor limiting DBH expansion in plateau environments [60].
Beyond climatic and topographic influences, tree height (0.080765) and stand age (0.053806) contribute to DBH variation, reflecting inherent growth potential and forest development stages. However, soil properties, including sand content (0.034011) and silt content (0.032904), have a relatively low importance, suggesting that in plateau regions, climatic and topographic constraints overshadow edaphic factors in determining tree growth patterns [63]. Compared with previous studies, our findings confirm that cold-season precipitation is a dominant limiting factor in plateau forests [60], while elevation remains a fundamental driver of DBH variation [62]. Additionally, the role of temperature seasonality in influencing forest structure is consistent with prior research on high-altitude ecosystems. These insights emphasize the need for adaptive forest management strategies that account for climatic constraints, particularly precipitation seasonality and temperature fluctuations. Future studies should integrate long-term climate monitoring and remote sensing technologies to improve DBH predictions and assess forest responses to climate change [64]).
In the south tropical humid region, the factors identified in our analysis are consistent with previous research on subtropical forest dynamics. Soil properties, elevation, and climate factors such as precipitation seasonality and temperature range are significant drivers of tree DBH in the south subtropical humid region. Understanding these factors is essential for forest management and conservation efforts in this area. Research on subtropical forest dynamics has identified various factors affecting tree growth and DBH. For instance, a study on the driving forces of forest dynamics in subtropical regions highlighted that tree mortality and recruitment are key factors influencing forest dynamics, though the specific mechanisms remain unclear [65].
Another study on the effects of global change on humid tropical forests found that climate factors, particularly temperature and precipitation, significantly influence forest productivity. This aligns with our finding that elevation (a proxy for temperature) and precipitation seasonality are important factors affecting DBH [66].
Additionally, research on soil organic carbon in subtropical forests indicates that soil properties, including texture and nutrient content, are crucial for forest productivity. This supports our observation that soil characteristics, such as sand content and soil layers, influence tree DBH [67].
Regarding the edge of tropical humid region, studies on DBH in tropical regions often emphasize the strong impact of climate and soil factors. Research in tropical forests by Schippers et al. [68] and Linger et al. [69] found that temperature-related variables, such as temperature seasonality and mean annual temperature, strongly correlate with forest growth rates and biomass distribution. Our study confirms this, with BIO3 (isothermality) and BIO2 (mean diurnal range) showing substantial feature importance.
Similarly, research by Soong et al. [70] on tropical tree growth found that soil fertility, specifically silt content, plays a critical role in DBH, which aligns with our findings. The relatively high importance of silt content (15.75%) in this study further supports these findings. However, previous research has focused more on temperature extremes and precipitation patterns (as seen in studies on forest resilience under climate change [71], while in our study, the aspect and soil layers appear to be relatively more influential.
These findings demonstrate that tree growth and DBH distribution in Yunnan are influenced by distinct climatic and edaphic factors across regions. By identifying these drivers, forest managers can tailor conservation and management strategies to the specific needs of each climate zone.
For DBH, the interaction between climatic factors (especially precipitation and temperature extremes), soil properties (like silt content), and topography plays a crucial role in determining tree growth. Water availability during cold and dry periods appears especially critical in influencing DBH across different subtropical zones. This understanding can help inform forest management practices, such as selecting species suited to specific climatic conditions or designing interventions to support tree growth in challenging environments. The diameter of trees’ growth response to weather factors was different among species and other tree-related factors, such as forest structure [72]. Further study is possible later if conditions permit [73].

4.2. Utilizing DBH Distribution Data for Biomass Allocation and TCS

4.2.1. Importance of DBH in Biomass Estimation

DBH is a well-established proxy for estimating tree biomass because it directly correlates with tree size and volume, which are key determinants of biomass. Several studies have shown that DBH is a reliable predictor for biomass in both tropical and temperate forests. For instance, DBH is often used in allometric equations to estimate aboveground biomass (AGB) and total carbon storage (TCS), which are central to understanding forest productivity, carbon storage, and ecosystem health [74,75].
In the context of Yunnan Province, which exhibits diverse climatic and ecological conditions, DBH distribution data offers a crucial input for estimating biomass allocation across various forest types. The random forest and gradient boosting models used in this study to predict DBH provided highly accurate estimates, with R2 values exceeding 0.97 in some cases, which further strengthens the potential for using DBH data in large-scale biomass predictions.

4.2.2. Biomass Allocation and Total Carbon Storage Estimation

The estimation of biomass allocation is closely linked to carbon storage, which is a key ecosystem function in forested areas. By using the DBH distribution data in conjunction with environmental variables, it is possible to generate accurate estimates of carbon stocks in forests. The study demonstrated that integrating DBH with variables such as NDVI (Normalized Difference Vegetation Index), kNDVI, and soil properties led to significant improvements in biomass and carbon storage estimation, with a model performance (R2 = 0.97) indicating strong predictive accuracy. The results showed that the total carbon storage of current forest types was 845.17TgC, similar to the result (871.30TgC) that was calculated by forest resources inventory [76]. The reason for the difference may be that the source of the original data, the different types of forest vegetation, and the estimation methods lead to the inconsistent estimation results. However, with the change in time, the carbon sequestration capacity of forest vegetation in Yunnan has been increasing, playing a large role as a carbon sink, and it is of great significance for China’s forests to play a role in carbon sequestration and emission reduction.
Biomass allocation models, such as those derived from allometric equations that use DBH as a predictor, are commonly used to estimate carbon storage in both tropical and temperate forests [77]. In this study, the inclusion of additional variables—such as vegetation indices (e.g., NDVI, EVI, SAVI) and topographic features (e.g., DEM, slope)—further refined the biomass estimates, making them more applicable for carbon storage assessments across the entire province.
The application of DBH-based biomass estimates can contribute to a better understanding of the forest’s role in global carbon cycling and its potential to mitigate climate change. Accurate carbon stock estimates are critical for developing forest management strategies aimed at increasing carbon sequestration, enhancing forest resilience, and supporting climate adaptation efforts [78,79].
Under different climate scenarios, the spatial distribution pattern of TCS in Yunnan Province is also different. The increase in carbon storage gradually expands from the southern part of Yunnan Province to the western part. With the increase in CO2 emission concentration, the average carbon storage also gradually increases, indicating that Yunnan Province has a large carbon sink potential based on the sample plot scale, and the results are consistent with those from the study of Shilong Piao et al. [80].

4.3. Implications for Future Research and Forest Management

Our findings indicate that remote sensing-based DBH estimation offers a promising avenue for large-scale forest monitoring, especially in regions with complex terrains and diverse forest types. By achieving an over 10% improvement in biomass estimation accuracy, our study underscores the critical role of accurate DBH data in assessing forest biomass and ecosystem functions. By accurately estimating DBH distribution, this study provides a scientific basis for forest management practices in Yunnan Province. Forest managers can use these estimates to monitor forest health, predict forest growth, and assess the impact of different management strategies on forest structure. For example, understanding DBH distribution helps in evaluating the potential for forest regeneration and carbon sequestration.
DBH data can also be used to assess ecosystem functions such as biomass allocation, primary productivity, and carbon storage. This is crucial for understanding how forests contribute to carbon cycling and mitigating climate change. The high accuracy of biomass estimates based on DBH distribution in this study suggests that these methods could be applied to assess ecosystem functions across broader regions.
The ability to predict biomass and carbon storage at a large scale is essential for improving global carbon balance models. By incorporating DBH estimates into biomass and carbon storage models, researchers can obtain more accurate estimates of forest carbon stocks, which is essential for understanding the role of forests in the global carbon cycle [79].

5. Conclusions

This study demonstrates the effectiveness of integrating remote sensing data with machine learning models to estimate DBH at plot-level distribution and TCS in Yunnan Province. The results show that the random forest, gradient boosting, and decision tree models are the most effective for the estimation of DBH at the plot level, with their performance varying by climate zone. In three different climate zones, namely, the subtropical humid zone, the tropical humid zone margin, and the plateau temperature zone, the dominant factors affecting tree DBH were similar and different. Topographic factors such as soil layer (sl1), altitude, and precipitation seasonality (BIO15) have great influence on DBH in the subtropical humid region. Temperature factors (e.g., BIO3 and BIO2) and soil texture (e.g., silt content) were the main driving factors in the tropical humid zone margin. In the plateau temperature region, b19 (which may be related to precipitation in a special period), altitude, and diurnal temperature range (BIO2) play a key role in DBH. In general, climate (temperature and precipitation), topography (elevation and slope) and soil (level and texture) together constitute important factors affecting DBH, but their weights are different in different climatic zones, which provides a scientific basis for regional forest management and ecological protection.
The study also identifies key environmental factors that drive DBH at plot level across different regions and highlights the importance of DBH in biomass and carbon storage estimation. Additionally, the results indicated that Yunnan Province has a large carbon sink potential based on the sample plot scale. These findings provide valuable insights for sustainable forest management, ecosystem functioning assessments, and global carbon balance research.

Author Contributions

Conceptualization, Z.Z.; methodology, H.Z.; validation, H.Z. and Y.M.; formal analysis, W.L.; investigation, W.L. and H.Z.; writing—original draft preparation, H.Z.; writing—review and editing, H.J.D.B.; visualization, W.L.; supervision, H.J.D.B.; project administration, Z.Z.; funding acquisition, H.Z. and Z.Z. All authors have read and agreed to the published version of the manuscript.

Funding

This research was funded by the Key Research and Development Program of Yunnan Province: (No. 202303AC100009); the National Natural Science Foundation of China (Grant No. 32260300); The Yunnan Postdoctoral Program (ynbh23010).

Data Availability Statement

Data will be made available on request.

Acknowledgments

We would like to thank Pudacuo National Forest Park Administration, Ailao Mountain National Ecological Monitoring Station, and Xishuangbanna Ecological Station of the Chinese Academy of Sciences for their support.

Conflicts of Interest

The authors declare no conflicts of interest.

References

  1. Pan, Y.; Birdsey, R.; Fang, J.; Houghton, R.; Kauppi, P.; Kurz, W.; Phillips, O.; Shvidenko, A.; Lewis, S.; Canadell, J.; et al. A Large and Persistent Carbon Sink in the World’s Forests. Science 2011, 333, 988–993. [Google Scholar] [CrossRef]
  2. Harris, N.; Gibbs, D.; Baccini, A.; Birdsey, R.; de Bruin, S.; Farina, M.; Fatoyinbo, L.; Hansen, M.; Herold, M.; Houghton, R.; et al. Global maps of twenty-first century forest carbon fluxes. Nat. Clim. Change 2021, 11, 1–7. [Google Scholar] [CrossRef]
  3. Available online: https://www.plantplus.cn/cn/standards/10 (accessed on 24 February 2025).
  4. Chave, J.; Réjou-Méchain, M.; Burquez, A.; Chidumayo, E.; Colgan, M.; Delitti, W.; Duque, A.; Eid, T.; Fearnside, P.; Goodman, R.; et al. Improved allometric models to estimate the aboveground biomass of tropical trees. Glob. Change Biol. 2014, 20, 3177–3190. [Google Scholar] [CrossRef]
  5. Strîmbu, V.; Ene, L.; Gobakken, T.; Gregoire, T.; Astrup, R.; Næsset, E. Post-stratified change estimation for large-area forest biomass using repeated ALS strip sampling. Can. J. For. Res. 2017, 47, 839–847. [Google Scholar] [CrossRef]
  6. Crockett, E.; Atkins, J.; Guo, Q.; Sun, G.; Potter, K.; Ollinger, S.; Silva, C.; Tang, H.; Woodall, C.; Holgerson, J.; et al. Structural and species diversity explain aboveground carbon storage in forests across the United States: Evidence from GEDI and forest inventory data. Remote Sens. Environ. 2023, 295, 113703. [Google Scholar] [CrossRef]
  7. Deng, Y.; Wang, J.; Liu, Q.; Feng, B.; Zhang, J. The F-LS Algorithm for Extracting Tree Breast-Height Diameter. Remote Sens. Inf. 2022, 37, 77–84. [Google Scholar]
  8. Pubudunzhu, B.; Guo, Q.; Zhu, X.; Zhu, L. Modeling Allometric Growth Equations for Tree Height and Breast-Height Diameter of Picea likiangensis in Linzhi, Tibetan Plateau. Cent. South For. Inventory Plan. 2014, 33, 13–15+66. [Google Scholar]
  9. Zhang, Z.; Wang, T.; Skidmore, A.K.; Cao, F.; She, G.; Cao, L. An improved area-based approach for estimating plot-level tree DBH from airborne LiDAR data. For. Ecosyst. 2023, 10, 100089. [Google Scholar] [CrossRef]
  10. Bi, H.; Fox, J.C.; Li, Y.; Lei, Y.; Pang, Y. Evaluation of nonlinear equations for predicting diameter from tree height. Can. J. For. Res. 2012, 42, 789–806. [Google Scholar] [CrossRef]
  11. Veras, H.; Neto, E.; Brasil, I.; Madi, J.P.; Araujo, E.; Camaño, J.; Figueiredo, E.; Papa, D.; Ferreira, M.; Corte, A.; et al. Estimating tree volume based on crown mapping by UAV pictures in the Amazon Forest. Sci. Electron. Arch. 2023, 16, 7. [Google Scholar] [CrossRef]
  12. Teobaldelli, M.; Cona, F.; Saulino, L.; Migliozzi, A.; D’Urso, G.; Langella, G.; Manna, P.; Saracino, A. Detection of Diversity and Stand Parameters in Mediterranean Forests Using Leaf-off Discrete Return LiDAR Data. Remote Sens. Environ. 2017, 192, 126–138. [Google Scholar] [CrossRef]
  13. Silva, C.; Klauberg, C.; Hudak, A.T.; Vierling, L.; Fennema, S.; Corte, A. Modeling and mapping basal area of Pinus taeda L. plantation using airborne LiDAR data. An. Acad. Bras. Ciências 2017, 89, 1895–1905. [Google Scholar] [CrossRef] [PubMed]
  14. Sun, Y.; Jin, X.; Pukkala, T.; Li, F. Predicting Individual Tree Diameter of Larch (Larix olgensis) from UAV-LiDAR Data Using Six Different Algorithms. Remote Sens. 2022, 14, 1125. [Google Scholar] [CrossRef]
  15. Fei, L.; Yue, C.; Jin, J.; Li, C.; Luo, H.; Wanting, X. Study on the inversion of basal area from airborne liDAR data. For. Resour. Manag. 2021, 15, 62–69. [Google Scholar]
  16. Dash, J.; Marshall, H.; Rawley, B. Methods for estimating multivariate stand yields and errors using k-NN and aerial laser scanning. Forestry 2015, 88, 237–247. [Google Scholar] [CrossRef]
  17. Lefsky, M.; Cohen, W.B.; Acker, S.; Parker, G.; Spies, T.A.; Harding, D. Lidar Remote Sensing of the Canopy Structure and Biophysical Properties of Douglas-Fir Western Hemlock Forests. Remote Sens. Environ. 1999, 70, 339–361. [Google Scholar] [CrossRef]
  18. Liu, H.; Zhang, Z.; Cao, L. Estimating forest stand characteristics in a coastal plain forest plantation based on vertical structure profile parameters derived from ALS data. J. Remote Sens. 2018, 22, 872–888. [Google Scholar] [CrossRef]
  19. Jucker, T.; Caspersen, J.; Chave, J.; Antin, C.; Barbier, N.; Bongers, F.; Dalponte, M.; van Ewijk, K.Y.; Forrester, D.I.; Haeni, M.; et al. Allometric equations for integrating remote sensing imagery into forest monitoring programmes. Glob. Change Biol. 2017, 23, 177–190. [Google Scholar] [CrossRef]
  20. Gonzalez de Tanago, J.; Sarmiento, A.L.; Bartholomeus, H.; Herold, M.; Avitabile, V.; Raumonen, P.; Martius, C.; Goodman, R.; Disney, M.; Manuri, S.; et al. Estimation of above-ground biomass of large tropical trees with Terrestrial LiDAR. Methods Ecol. Evol. 2017, 9, 223–234. [Google Scholar] [CrossRef]
  21. Panagiotidis, D.; Abdollahnejad, A.; Surovy, P.; Chiteculo, V. Determining tree height and crown diameter from high-resolution UAV imagery. Int. J. Remote Sens. 2017, 38. [Google Scholar] [CrossRef]
  22. Abdollahnejad, A.; Panagiotidis, D.; Surový, P. Forest canopy density assessment using different approaches-review. J. For. Sci. 2017, 63, 107–116. [Google Scholar] [CrossRef]
  23. Abdollahnejad, A.; Panagiotidis, D.; Surový, P. Estimation and Extrapolation of Tree Parameters Using Spectral Correlation between UAV and Pléiades Data. Forests 2018, 9, 85. [Google Scholar] [CrossRef]
  24. Fassnacht, F.; Latifi, H.; Stereńczak, K.; Modzelewska, A.; Lefsky, M.; Waser, L.; Straub, C.; Ghosh, A. Review of studies on tree species classification from remotely sensed data. Remote Sens. Environ. 2016, 186, 64–87. [Google Scholar] [CrossRef]
  25. Immitzer, M.; Atzberger, C.; Koukal, T. Tree Species Classification with Random Forest Using Very High Spatial Resolution 8-Band WorldView-2 Satellite Data. Remote Sens. 2012, 4, 2661–2693. [Google Scholar] [CrossRef]
  26. Kc, Y.; Liu, Q.; Saud, P.; Gaire, D.; Adhikari, H. Estimation of Above-Ground Forest Biomass in Nepal by the Use of Airborne LiDAR, and Forest Inventory Data. Land 2024, 13, 213. [Google Scholar] [CrossRef]
  27. Dubayah, R.; Blair, J.; Goetz, S.; Fatoyinbo, L.; Hansen, M.; Healey, S.; Hofton, M.; Hurtt, G.; Kellner, J.; Luthcke, S.; et al. The Global Ecosystem Dynamics Investigation: High-resolution laser ranging of the Earth’s forests and topography. Sci. Remote Sens. 2020, 1, 100002. [Google Scholar] [CrossRef]
  28. Hansen, M.C.; Potapov, P.; Moore, R.; Hancher, M.; Turubanova, S.; Tyukavina, A.; Thau, D.; Stehman, S.; Goetz, S.; Loveland, T.; et al. High-Resolution Global Maps of 21st-Century Forest Cover Change. Science 2013, 342, 850–853. [Google Scholar] [CrossRef]
  29. Ferraz, A.; Saatchi, S.; Mallet, C.; Meyer, V. Lidar detection of individual tree size in tropical forests. Remote Sens. Environ. 2016, 183, 318–333. [Google Scholar] [CrossRef]
  30. Motohka, T.; Nasahara, K.; Oguma, H.; Tsuchida, S. Applicability of Green-Red Vegetation Index for Remote Sensing of Vegetation Phenology. Remote Sens. 2010, 2, 2369–2387. [Google Scholar] [CrossRef]
  31. Abdollahnejad, A.; Panagiotidis, D. Tree Species Classification and Health Status Assessment for a Mixed Broadleaf-Conifer Forest with UAS Multispectral Imaging. Remote Sens. 2020, 12, 3722. [Google Scholar] [CrossRef]
  32. Mascaro, J.; Asner, G.; Muller-Landau, H.; van Breugel, M.; Hall, J.; Dahlin, K. Controls over aboveground forest carbon density on Barro Colorado Island, Panama. Biogeosciences Discuss. 2010, 8, 1615–1629. [Google Scholar] [CrossRef]
  33. Clark, M.; Roberts, D.; Clark, D. Hyperspectral discrimination of tropical rain forest tree species at leaf to crown scales. Remote Sens. Environ. 2005, 96, 375–398. [Google Scholar] [CrossRef]
  34. Breiman, L. Random Forests. Mach. Learn. 2001, 45, 5–32. [Google Scholar] [CrossRef]
  35. Xie, B.; Jones, P.; Dwivedi, R.; Bao, L.; Liang, R. Evaluation, comparison, and unique features of ecological security in southwest China: A case study of Yunnan Province. Ecol. Indic. 2023, 153, 110453. [Google Scholar] [CrossRef]
  36. Yang, R.; He, Y.; Zhong, C.; Yang, Z.; Wang, X.; Xu, M.; Cao, L. Study on the Spatiotemporal Evolution and Influencing Factors of Forest Coverage Rate (FCR): A Case Study on Yunnan Province Based on Remote Sensing Image Interpretation. Forests 2024, 15, 238. [Google Scholar] [CrossRef]
  37. Forestry Department of Yunnan Province. Forest Site Classification and Its Application in Yunnan; China Forestry Publishing House: Beijing, China, 1990.
  38. Gong, Z.; Ge, W.; Guo, J.; Liu, J. Satellite remote sensing of vegetation phenology: Progress, challenges, and opportunities. ISPRS J. Photogramm. Remote. Sens. 2024, 217, 149–164. [Google Scholar] [CrossRef]
  39. Cheng, K.; Chen, Y.; Xiang, T.; Yang, H.; Liu, W.; Ren, Y.; Guan, H.; Hu, T.; Ma, Q.; Guo, Q. A 2020 forest age map for China with 30 m resolution. Earth Syst. Sci. Data 2024, 16, 803–819. [Google Scholar] [CrossRef]
  40. Hengl, T.; de Jesus, J.M.; Heuvelink, G.; Gonzalez, M.; Kilibarda, M.; Blagotić, A.; Shangguan, W.; Wright, M.; Geng, X.; Bauer-Marschallinger, B.; et al. SoilGrids250m: Global gridded soil information based on machine learning. PLoS ONE 2017, 12, e0169748. [Google Scholar] [CrossRef] [PubMed]
  41. Margolis, H.A.; Nelson, R.F.; Montesano, P.M.; Beaudoin, A.; Sun, G.; Andersen, H.-E.; Wulder, M.A. Combining satellite lidar, airborne lidar, and ground plots to estimate the amount and distribution of aboveground biomass in the boreal forest of North America. Can. J. For. Res. 2015, 45, 838–855. [Google Scholar] [CrossRef]
  42. Cortes, C.J.M.L. Support-Vector Networks; AT&T Bell Labs.: Holmdel, NJ, USA, 1995. [Google Scholar]
  43. Friedman, J.H. Greedy Function Approximation: A Gradient Boosting Machine. Ann. Stat. 2001, 1189–1232. Available online: https://www.jstor.org/stable/2699986 (accessed on 24 February 2025). [CrossRef]
  44. McCulloch, W.S.; Pitts, W. A logical calculus of the ideas immanent in nervous activity. Bull. Math. Biophys. 1943, 5, 115–133. [Google Scholar] [CrossRef]
  45. Quinlan, J.R. Induction of decision trees. Mach. Learn. 1986, 1, 81–106. [Google Scholar] [CrossRef]
  46. Rumelhart, D.E.; Hinton, G.E.; Williams, R.J. Learning representations by back-propagating errors. Nature 1986, 323, 533–536. [Google Scholar] [CrossRef]
  47. Murphy, K.P. Machine Learning: A Probabilistic Perspective (Adaptive Computation and Machine Learning Series); The MIT Press: London, UK, 2012. [Google Scholar]
  48. Roy, A.D.; Yule, G.U.; Kendall, M.G. An Introduction to the Theory of Statistics. Econ. J. 1968, 60, 788. [Google Scholar] [CrossRef]
  49. Fang, J.; Chen, A.; Peng, C.; Zhao, S.; Ci, L. Changes in Forest Biomass Carbon Storage in China Between 1949 and 1998. Science 2001, 292, 2320–2322. [Google Scholar] [CrossRef] [PubMed]
  50. Wulder, M.A.; White, J.C.; Goward, S.N.; Masek, J.G.; Irons, J.R.; Herold, M.; Cohen, W.B.; Loveland, T.R.; Woodcock, C.E. Landsat continuity: Issues and opportunities for land cover monitoring. Remote Sens. Environ. 2008, 112, 955–969. [Google Scholar] [CrossRef]
  51. Avitabile, V.; Herold, M.; Heuvelink, G.B.M.; Lewis, S.L.; Phillips, O.L.; Asner, G.P.; Armston, J.; Ashton, P.S.; Banin, L.; Bayol, N.; et al. An integrated pan-tropical biomass map using multiple reference datasets. Glob. Change Biol. 2016, 22, 1406–1420. [Google Scholar] [CrossRef] [PubMed]
  52. Wang, F.; Heenkenda, M.K.; Freeburn, J.T. Estimating tree Diameter at Breast Height (DBH) using an iPad Pro LiDAR sensor. Remote Sens. Lett. 2022, 13, 568–578. [Google Scholar] [CrossRef]
  53. Ghanbari Parmehr, E.; Amati, M. Individual Tree Canopy Parameters Estimation Using UAV-Based Photogrammetric and LiDAR Point Clouds in an Urban Park. Remote Sens. 2021, 13, 2062. [Google Scholar] [CrossRef]
  54. Corte, A.P.D.; Souza, D.V.; Rex, F.E.; Sanquetta, C.R.; Mohan, M.; Silva, C.A.; Zambrano, A.M.A.; Prata, G.; de Almeida, D.R.A.; Trautenmüller, J.W.; et al. Forest inventory with high-density UAV-Lidar: Machine learning approaches for predicting individual tree attributes. Comput. Electron. Agric. 2020, 179, 105815. [Google Scholar] [CrossRef]
  55. Neuville, R.; Bates, J.S.; Jonard, F. Estimating Forest Structure from UAV-Mounted LiDAR Point Cloud Using Machine Learning. Remote Sens. 2021, 13, 352. [Google Scholar] [CrossRef]
  56. Balling, J.; Slagter, B.; Woude, S.; Herold, M.; Reiche, J. ALOS-2 PALSAR-2 ScanSAR and Sentinel-1 data for timely tropical forest disturbance mapping: A case study for Sumatra, Indonesia. Int. J. Appl. Earth Obs. Geoinf. 2024, 132, 103994. [Google Scholar] [CrossRef]
  57. Reiche, J.; Lucas, R.; Mitchell, A.L.; Verbesselt, J.; Hoekman, D.H.; Haarpaintner, J.; Kellndorfer, J.M.; Rosenqvist, A.; Lehmann, E.A.; Woodcock, C.E.; et al. Combining satellite data for better tropical forest monitoring. Nat. Clim. Change 2016, 6, 120–122. [Google Scholar] [CrossRef]
  58. Verrelst, J.; Camps-Valls, G.; Muñoz-Marí, J.; Rivera, J.P.; Veroustraete, F.; Clevers, J.G.P.W.; Moreno, J. Optical remote sensing and the retrieval of terrestrial vegetation bio-geophysical properties—A review. ISPRS J. Photogramm. Remote Sens. 2015, 108, 273–290. [Google Scholar] [CrossRef]
  59. Belgiu, M.; Drăguţ, L. Random forest in remote sensing: A review of applications and future directions. ISPRS J. Photogramm. Remote Sens. 2016, 114, 24–31. [Google Scholar] [CrossRef]
  60. Wang, Y.; Liu, Y.; Chen, P.; Song, J.; Fu, B. Interannual precipitation variability dominates the growth of alpine grassland above-ground biomass at high elevations on the Tibetan Plateau. Sci. Total Environ. 2024, 931, 172745. [Google Scholar] [CrossRef]
  61. Mehmood, K.; Anees, S.A.; Rehman, A.; Rehman, N.U.; Muhammad, S.; Shahzad, F.; Liu, Q.; Alharbi, S.A.; Alfarraj, S.; Ansari, M.J.; et al. Assessment of climatic influences on net primary productivity along elevation gradients in temperate ecoregions. Trees For. People 2024, 18, 100657. [Google Scholar] [CrossRef]
  62. Zhang, X.; Wang, Y.; Wang, J.; Yu, M.; Zhang, R.; Mi, Y.; Xu, J.; Jiang, R.; Gao, J. Elevation Influences Belowground Biomass Proportion in Forests by Affecting Climatic Factors, Soil Nutrients and Key Leaf Traits. Plants 2024, 13, 674. [Google Scholar] [CrossRef] [PubMed]
  63. Cao, W.; Liu, T.; Wang, X. Effects of soil properties on vegetation community composition across a semiarid ecosystem. J. Arid. Environ. 2022, 198, 104700. [Google Scholar] [CrossRef]
  64. Li, C.; Li, M.; Iizuka, K.; Liu, J.; Chen, K.; Li, Y. Effects of Forest Canopy Structure on Forest Aboveground Biomass Estimation Using Landsat Imagery. IEEE Access 2021, 9, 5285–5295. [Google Scholar] [CrossRef]
  65. Ma, L.; Lian, J.; Lin, G.; Cao, H.; Huang, Z.; Guan, D. Forest dynamics and its driving forces of sub-tropical forest in South China. Sci. Rep. 2016, 6, 22561. [Google Scholar] [CrossRef] [PubMed]
  66. Cusack, D.F.; Karpman, J.; Ashdown, D.; Cao, Q.; Ciochina, M.; Halterman, S.; Lydon, S.; Neupane, A. Global change effects on humid tropical forests: Evidence for biogeochemical and biodiversity shifts at an ecosystem scale. Rev. Geophys. 2016, 54, 523–610. [Google Scholar] [CrossRef]
  67. Li, S.; Zhang, A.; Song, H.; Guo, W.; Tang, Z.; Lei, G.; Qi, L. The Dominant Factor Affecting Soil Organic Carbon in Subtropical Phyllostachys edulis Forests Is Climatic Factors Rather Than Soil Physicochemical Properties. Forests 2023, 14, 958. [Google Scholar] [CrossRef]
  68. Schippers, P.; Sterck, F.; Vlam, M.; Zuidema, P.A. Tree growth variation in the tropical forest: Understanding effects of temperature, rainfall and CO2. Glob. Change Biol. 2015, 21, 2749–2761. [Google Scholar] [CrossRef] [PubMed]
  69. Linger, E.; Hogan, J.A.; Cao, M.; Zhang, W.-F.; Yang, X.-F.; Hu, Y.-H. Precipitation influences on the net primary productivity of a tropical seasonal rainforest in Southwest China: A 9-year case study. For. Ecol. Manag. 2020, 467, 118153. [Google Scholar] [CrossRef]
  70. Soong, J.L.; Janssens, I.A.; Grau, O.; Margalef, O.; Stahl, C.; Van Langenhove, L.; Urbina, I.; Chave, J.; Dourdain, A.; Ferry, B.; et al. Soil properties explain tree growth and mortality, but not biomass, across phosphorus-depleted tropical forests. Sci. Rep. 2020, 10, 2302. [Google Scholar] [CrossRef] [PubMed]
  71. Deb, J.C.; Phinn, S.; Butt, N.; McAlpine, C. Climate change impacts on tropical forests: Identifying risks for tropical Asia. J. Trop. For. Sci. 2018, 30, 182–194. [Google Scholar]
  72. Lin, S.; Li, Y.; Li, Y.; Chen, Q.; Wang, Q.; He, K. Influence of tree size, local forest structure, topography, and soil resource availability on plantation growth in Qinghai Province, China. Ecol. Indic. 2021, 120, 106957. [Google Scholar] [CrossRef]
  73. Nabeshima, E.; Kubo, T.; Hiura, T. Variation in tree diameter growth in response to the weather conditions and tree size in deciduous broad-leaved trees. For. Ecol. Manag. 2010, 259, 1055–1066. [Google Scholar] [CrossRef]
  74. Zolkos, S.; Goetz, S.; Dubayah, R. Dubayah, A meta-analysis of terrestrial aboveground biomass estimation using lidar remote sensing. Remote Sens. Environ. 2013, 128, 289–298. [Google Scholar] [CrossRef]
  75. Dai, Z.; Birdsey, R.A.; Johnson, K.D.; Dupuy, J.M.; Hernandez-Stefanoni, J.L.; Richardson, K. Modeling carbon stocks in a secondary tropical dry forest in the Yucatan Peninsula, Mexico. Water Air Soil Pollut. 2014, 225, 1–15. [Google Scholar] [CrossRef]
  76. Li, L. Dynamic Change of Carbon Storage and Carbon Sink Potential of Forest Vegetation in Yunnan Province from 1992 to 2007; Yunnan University of Finance and Economics: Kunming, China, 2012. [Google Scholar]
  77. Vashum, K.T.; Jayakumar, S. Methods to estimate above-ground biomass and carbon stock in natural forests—A review. J. Ecosyst. Ecography 2012, 2, 1–7. [Google Scholar] [CrossRef]
  78. Sleeter, B.M.; Liu, J.; Daniel, C.; Rayfield, B.; Sherba, J.; Hawbaker, T.J.; Zhu, Z.; Selmants, P.C.; Loveland, T.R. Effects of contemporary land-use and land-cover change on the carbon balance of terrestrial ecosystems in the United States. Environ. Res. Lett. 2018, 13, 045006. [Google Scholar] [CrossRef]
  79. Schimel, D. Forests in the Global Carbon Cycle. In Challenges and Opportunities for the World’s Forests in the 21st Century; Springer: Berlin/Heidelberg, Germany, 2013; pp. 231–239. [Google Scholar]
  80. Yao, L.; Liu, T.; Qin, J.; Jiang, H.; Yang, L.; Smith, P.; Chen, X.; Zhou, C.; Piao, S. Carbon sequestration potential of tree planting in China. Nat. Commun. 2024, 15, 8398. [Google Scholar] [CrossRef] [PubMed]
Figure 1. Yunnan Province in China and the plot of the study area.
Forests 16 00453 g001
Figure 2. Technical route.
Forests 16 00453 g002
Figure 3. The driving factors of DBH in plateau temperature region.
Forests 16 00453 g003
Figure 4. The driving factors of DBH in south subtropical humid region.
Forests 16 00453 g004
Figure 5. The driving factors of DBH in edge of humid region.
Forests 16 00453 g005
Figure 6. Accuracy of model with kNDVI.
Forests 16 00453 g006
Figure 7. Accuracy of the model without DBH.
Forests 16 00453 g007
Figure 8. Accuracy of model with DBH.
Forests 16 00453 g008
Figure 9. DBH (Plot scale) of Yunnan Province. Note: The DBH is the level of the plot, the size of each plot is 30 × 30 m, and the displayed value is the sum of DBH of all trees in the plot.
Forests 16 00453 g009
Figure 10. Feature importance of DBH in Yunnan Province.
Forests 16 00453 g010
Figure 11. Predicts total carbon storage of Yunnan Province: (a) current, (b) 2040–2060 SSP126, and (c) 2040–2060 SSP245.
Forests 16 00453 g011
Figure 12. Change rate of total carbon storage in Yunnan Province. (a) ROC for SSP126(2040–2060) to current and (b) ROC for SSP245 (2040–2060) to current.
Forests 16 00453 g012
Table 1. List of variables.
Factors RemarkData Source
Environmental factorBIO1:Annual Mean Temperature (°C)www.worldclim.org
accessed from 1970–2000
BIO2:Mean Diurnal Range (Mean of monthly (max temp–min temp)) (°C)
BIO3:Isothermality (BIO2/BIO7) (×100)
BIO4:Temperature Seasonality (standard deviation ×100)
BIO5:Max Temperature of Warmest Month (°C)
BIO6:Min Temperature of Coldest Month (°C)
BIO7:Temperature Annual Range (BIO5-BIO6) (°C)
BIO8:Mean Temperature of Wettest Quarter (°C)
BIO9:Mean Temperature of Driest Quarter (°C)
BIO10:Mean Temperature of Warmest Quarter (°C)
BIO11:Mean Temperature of Coldest Quarter (°C)
BIO12:Annual Precipitation (mm)
BIO13:Precipitation of Wettest Month (mm)
BIO14:Precipitation of Driest Month (mm)
BIO15:Precipitation Seasonality (Coefficient of Variation) (mm)
BIO16:Precipitation of Wettest Quarter (mm)
BIO17:Precipitation of Driest Quarter (mm)
BIO18:Precipitation of Warmest Quarter (mm)
BIO19:Precipitation of Coldest Quarter (mm)
Topographic featureElevationThis refers to the height above sea levelhttps://earthexplorer.usgs.gov/ accessed in 2000
SlopeThe slope refers to the steepness of the terrainDerive from the DEM in use of arcgis
AspectAspect refers to the direction a slope facesDerive from the DEM in use of arcgis
Spectral datakNDVIKernel Normalized Difference Vegetation Index: This is a vegetation index used to assess the health and density of vegetationDerive from Landsat 8 and Sentinel-2 in use of GEE
GOSIFGlobal Solar-Induced Chlorophyll Fluorescence is a global dataset that provides information on solar-induced chlorophyll fluorescence (SIF), which is an energy flux re-emitted by plants a few nanoseconds after light absorptionhttps://doi.org/10.3390/rs11050517 accessed in 2020
Soil propertysiltSilt is a type of soil particle that is finer than sand but coarser than clayThe Second National Soil Survey
sandSand is a granular material composed of finely divided rock and mineral particles
clayClay is a fine-grained soil that is plastic when wet and hard when dry
sl1-sl7SoilGrids250m Global gridded soil information base, sl1 represents a soil depth of 0 cm, sl2 represents a soil depth of 5 cm, sl3 represents a soil depth of 15 cm, sl4 represents a soil depth of 30 cm, sl5 represents a soil depth of 60 cm, sl6 represents a soil depth of 100 cm, and sl7 represents a soil depth of 250 cmhttps://www.resdc.cn/Default.aspx accessed on June 2020
Vegetation characteristicsTree heightThis is a measure of the vertical growth of treesDerive from Sentinel_1
Tree ageA 2020 forest age map of China with 30 m resolution[39]
Ground measurementsDBHDiameter at breast heightInvestigation
SpeciesIdentify plant specieshttps://www.iplant.cn/
Multi-source remote sensingSentinel_1Derive the tree height and the VV (vertical transmit/vertical receive) and VH (vertical transmit/horizontal receive) polarized bandsSentinel-1|NASA Earthdata
Sentinel_2Derive the Kndvi, b1texture, b2texture, b3texture, and b4textureSentinel-2|NASA Earthdata
Land use dataDerive the distribution of forest ecosystemhttps://data.tpdc.ac.cn/en/data accessed on July 2020
Landsat 8Derive the kNDVIwww.resdc.cn/data.aspx accessed on June 2020
UAV Lidar dataUAV near ground remote sensingInvestigation
Table 2. Accuracy of different models.
ModelsMSERMSER2
Random Forest437.18720.9090.895
Gradient Boosting967.20231.1000.769
Neural Network2340.84348.3820.440
Decision Tree46.5656.8240.989
Support Vector Machine3822.29161.8250.086
Table 3. Accuracy of different models in different regions.
Climatic RegionModelsMSERMSER2
Plateau temperature zoneRandom Forest916.70130.2770.820
Gradient Boosting1201.67334.6650.765
Neural Network3135.47555.9950.386
Decision Tree1287.54535.8820.748
Support Vector Machine4458.34366.7710.127
South subtropical humid regionRandom Forest421.34520.5270.804
Gradient Boosting270.39416.4440.874
Neural Network1588.49839.8560.260
Decision Tree924.09230.3990.570
Support Vector Machine2064.10145.4320.039
Edge of tropical humid regionRandom Forest148.23312.1750.956
Gradient Boosting55.9527.4800.983
Neural Network1260.23935.5000.625
Decision Tree126.17011.2330.962
Support Vector Machine3240.89956.9290.035
Note: Model performance comparison (three of these types are used as examples). Table 2 presents the performance of different machine learning models (random forest, gradient boosting, neural network, decision tree, and support vector machine) for predicting biomass across three climatic regions (plateau temperature zone, south subtropical humid region, and edge of tropical humid region).
Disclaimer/Publisher’s Note: The statements, opinions and data contained in all publications are solely those of the individual author(s) and contributor(s) and not of MDPI and/or the editor(s). MDPI and/or the editor(s) disclaim responsibility for any injury to people or property resulting from any ideas, methods, instructions or products referred to in the content.

