The Impact of Forest Rents on Ecological Footprints in China: The Moderating Role of Government Effectiveness


Abstract
1. Introduction
2. Literature Review and Hypotheses
2.1. Forest Rents and Ecological Sustainability
2.2. Government Effectiveness and Ecological Sustainability
2.3. Fossil Fuel Consumption and Ecological Sustainability
2.4. Foreign Direct Investment and Ecological Sustainability
2.5. Economic Growth, Population, and Ecological Sustainability
3. Materials and Methods
3.1. Data and Sources
- -
- Ecological Footprints of Forest Products (EFFs): This was used as the main dependent variable for the study. It is measured by the total footprints of forest products in Gha. Data were sourced from the Global Footprints Network (GFN) database, which provides standardized ecological footprint metrics. The forest-specific footprint was extracted from the total ecological footprint to isolate the impact of forest-related activities.
- -
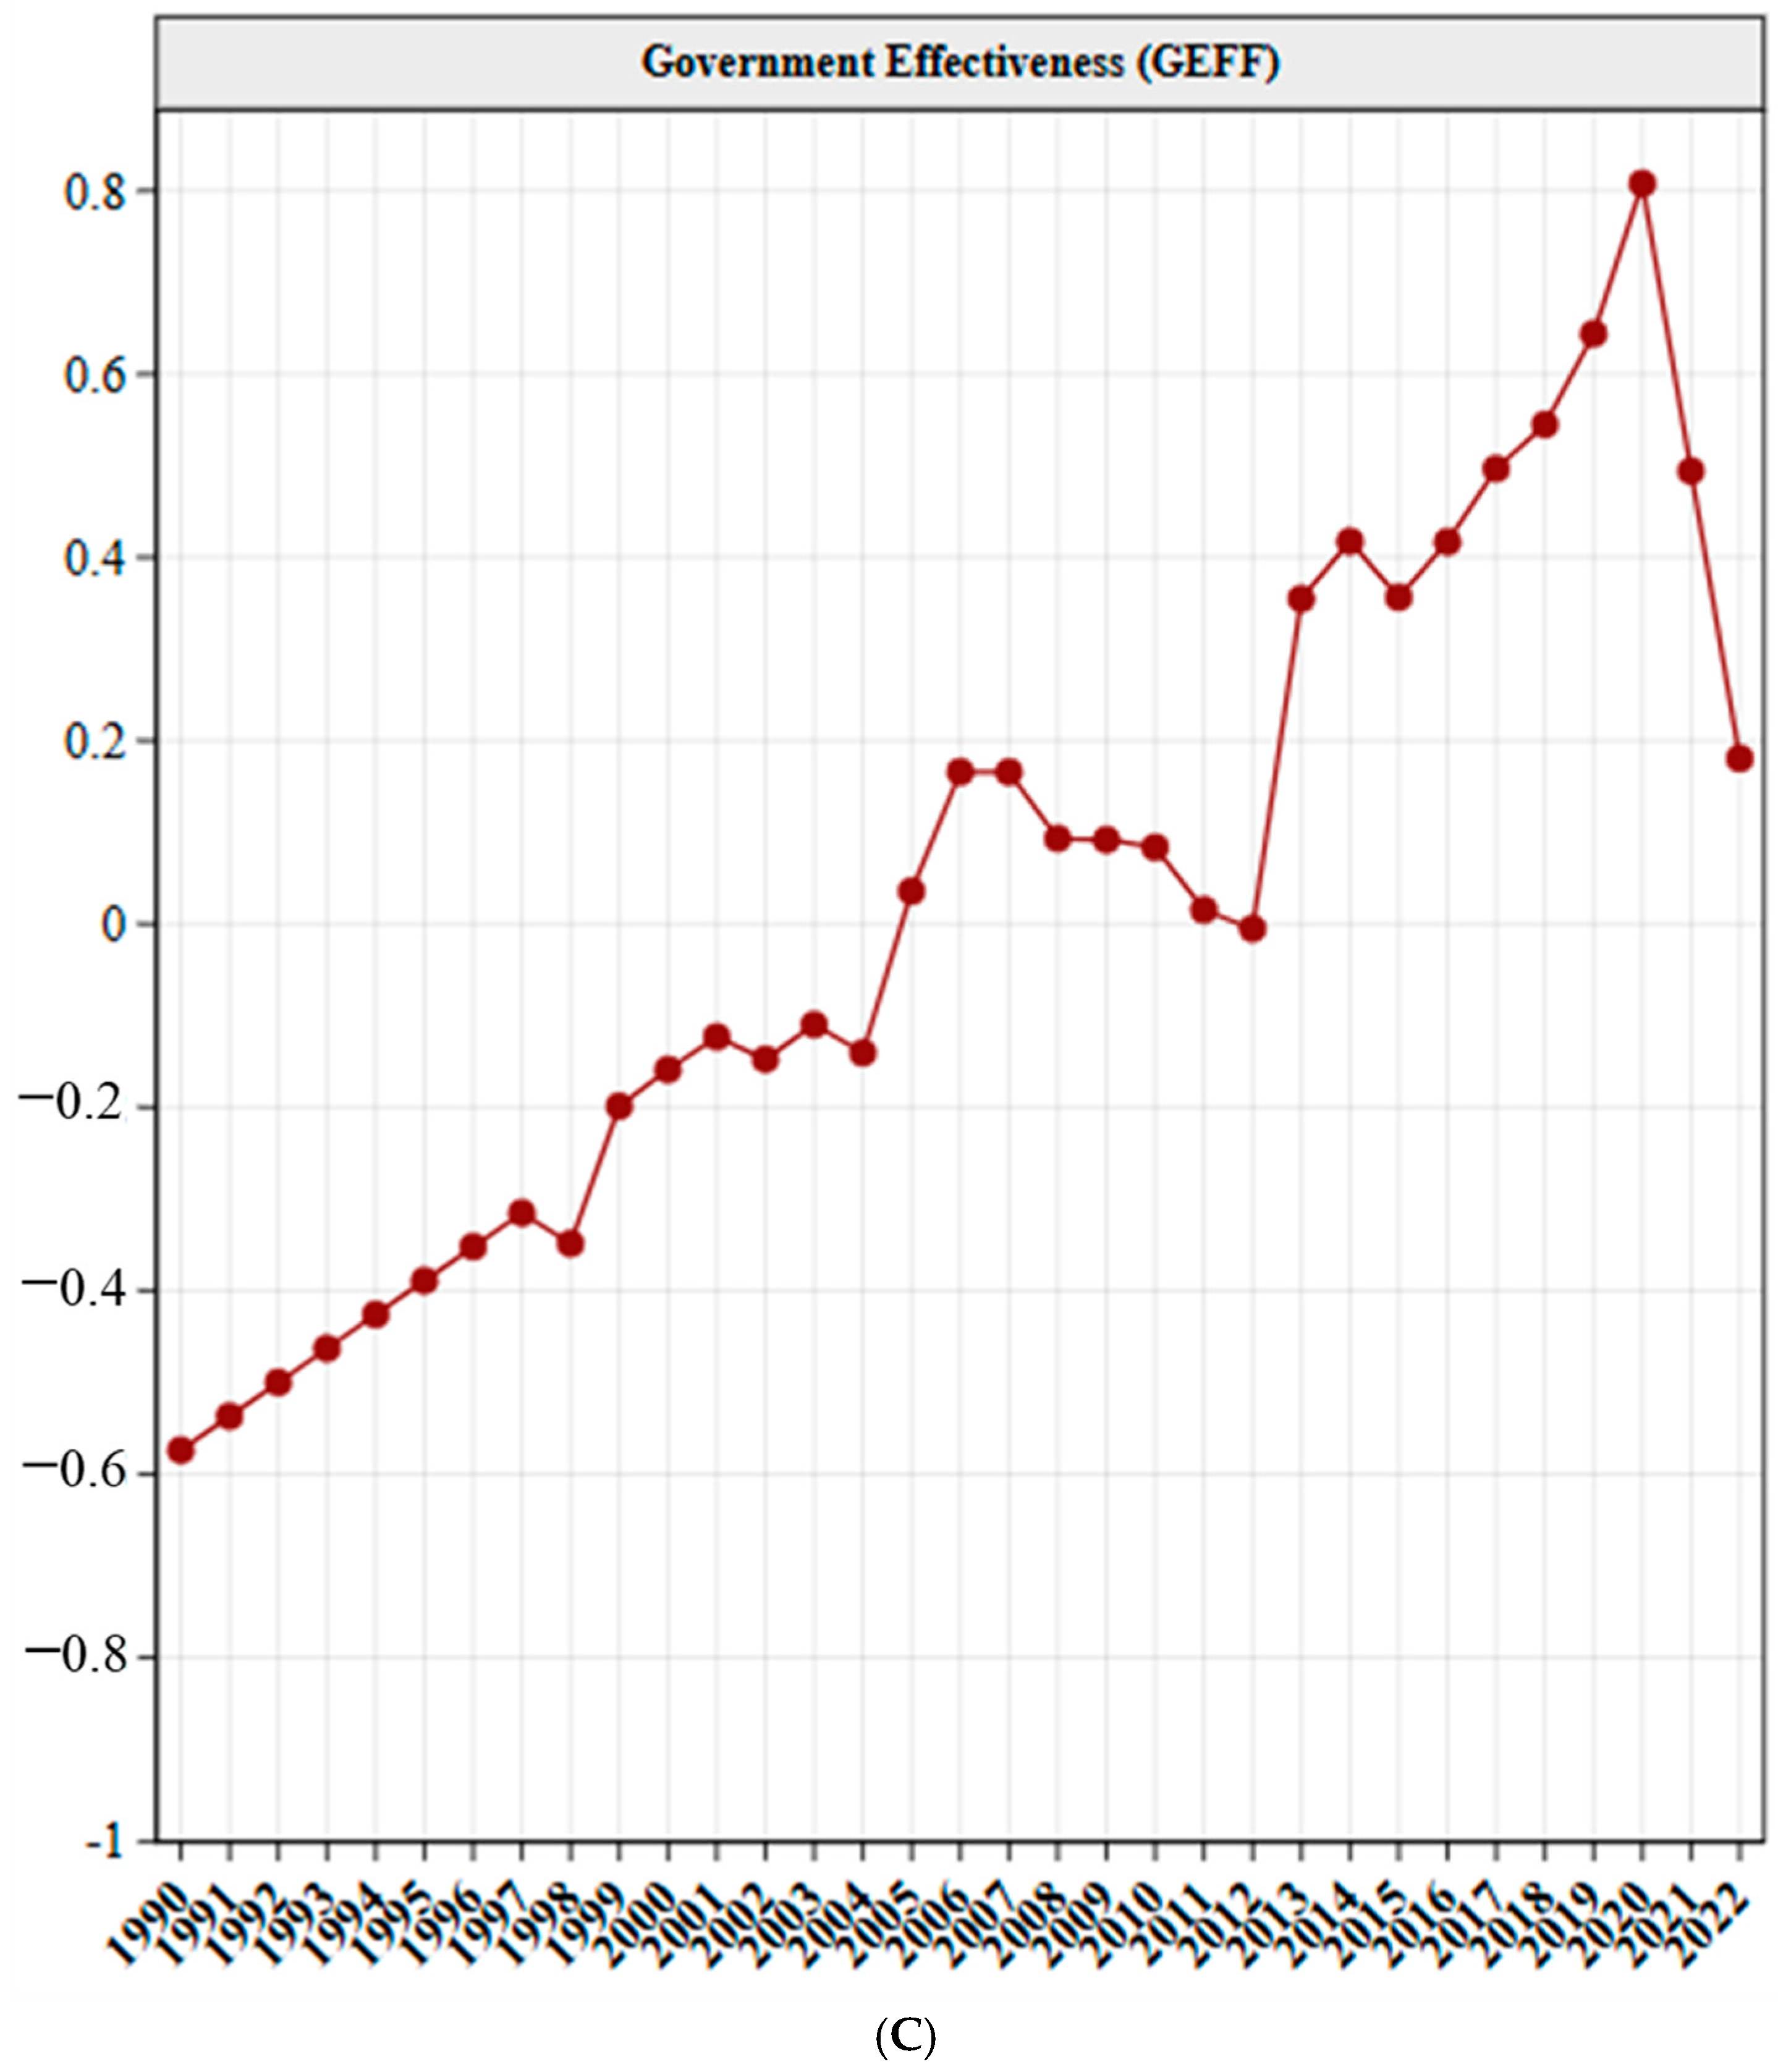
- Government Effectiveness (GEFF): In our study, GEFF is considered a major independent variable, and how it influences dependent variables was determined. It is measured in estimates by the World Bank, based on surveys and expert assessments that measure the quality of public services, civil service, policy formulation, and implementation. This variable was sourced from the Worldwide Governance Indicators (WGIs) database;
- -
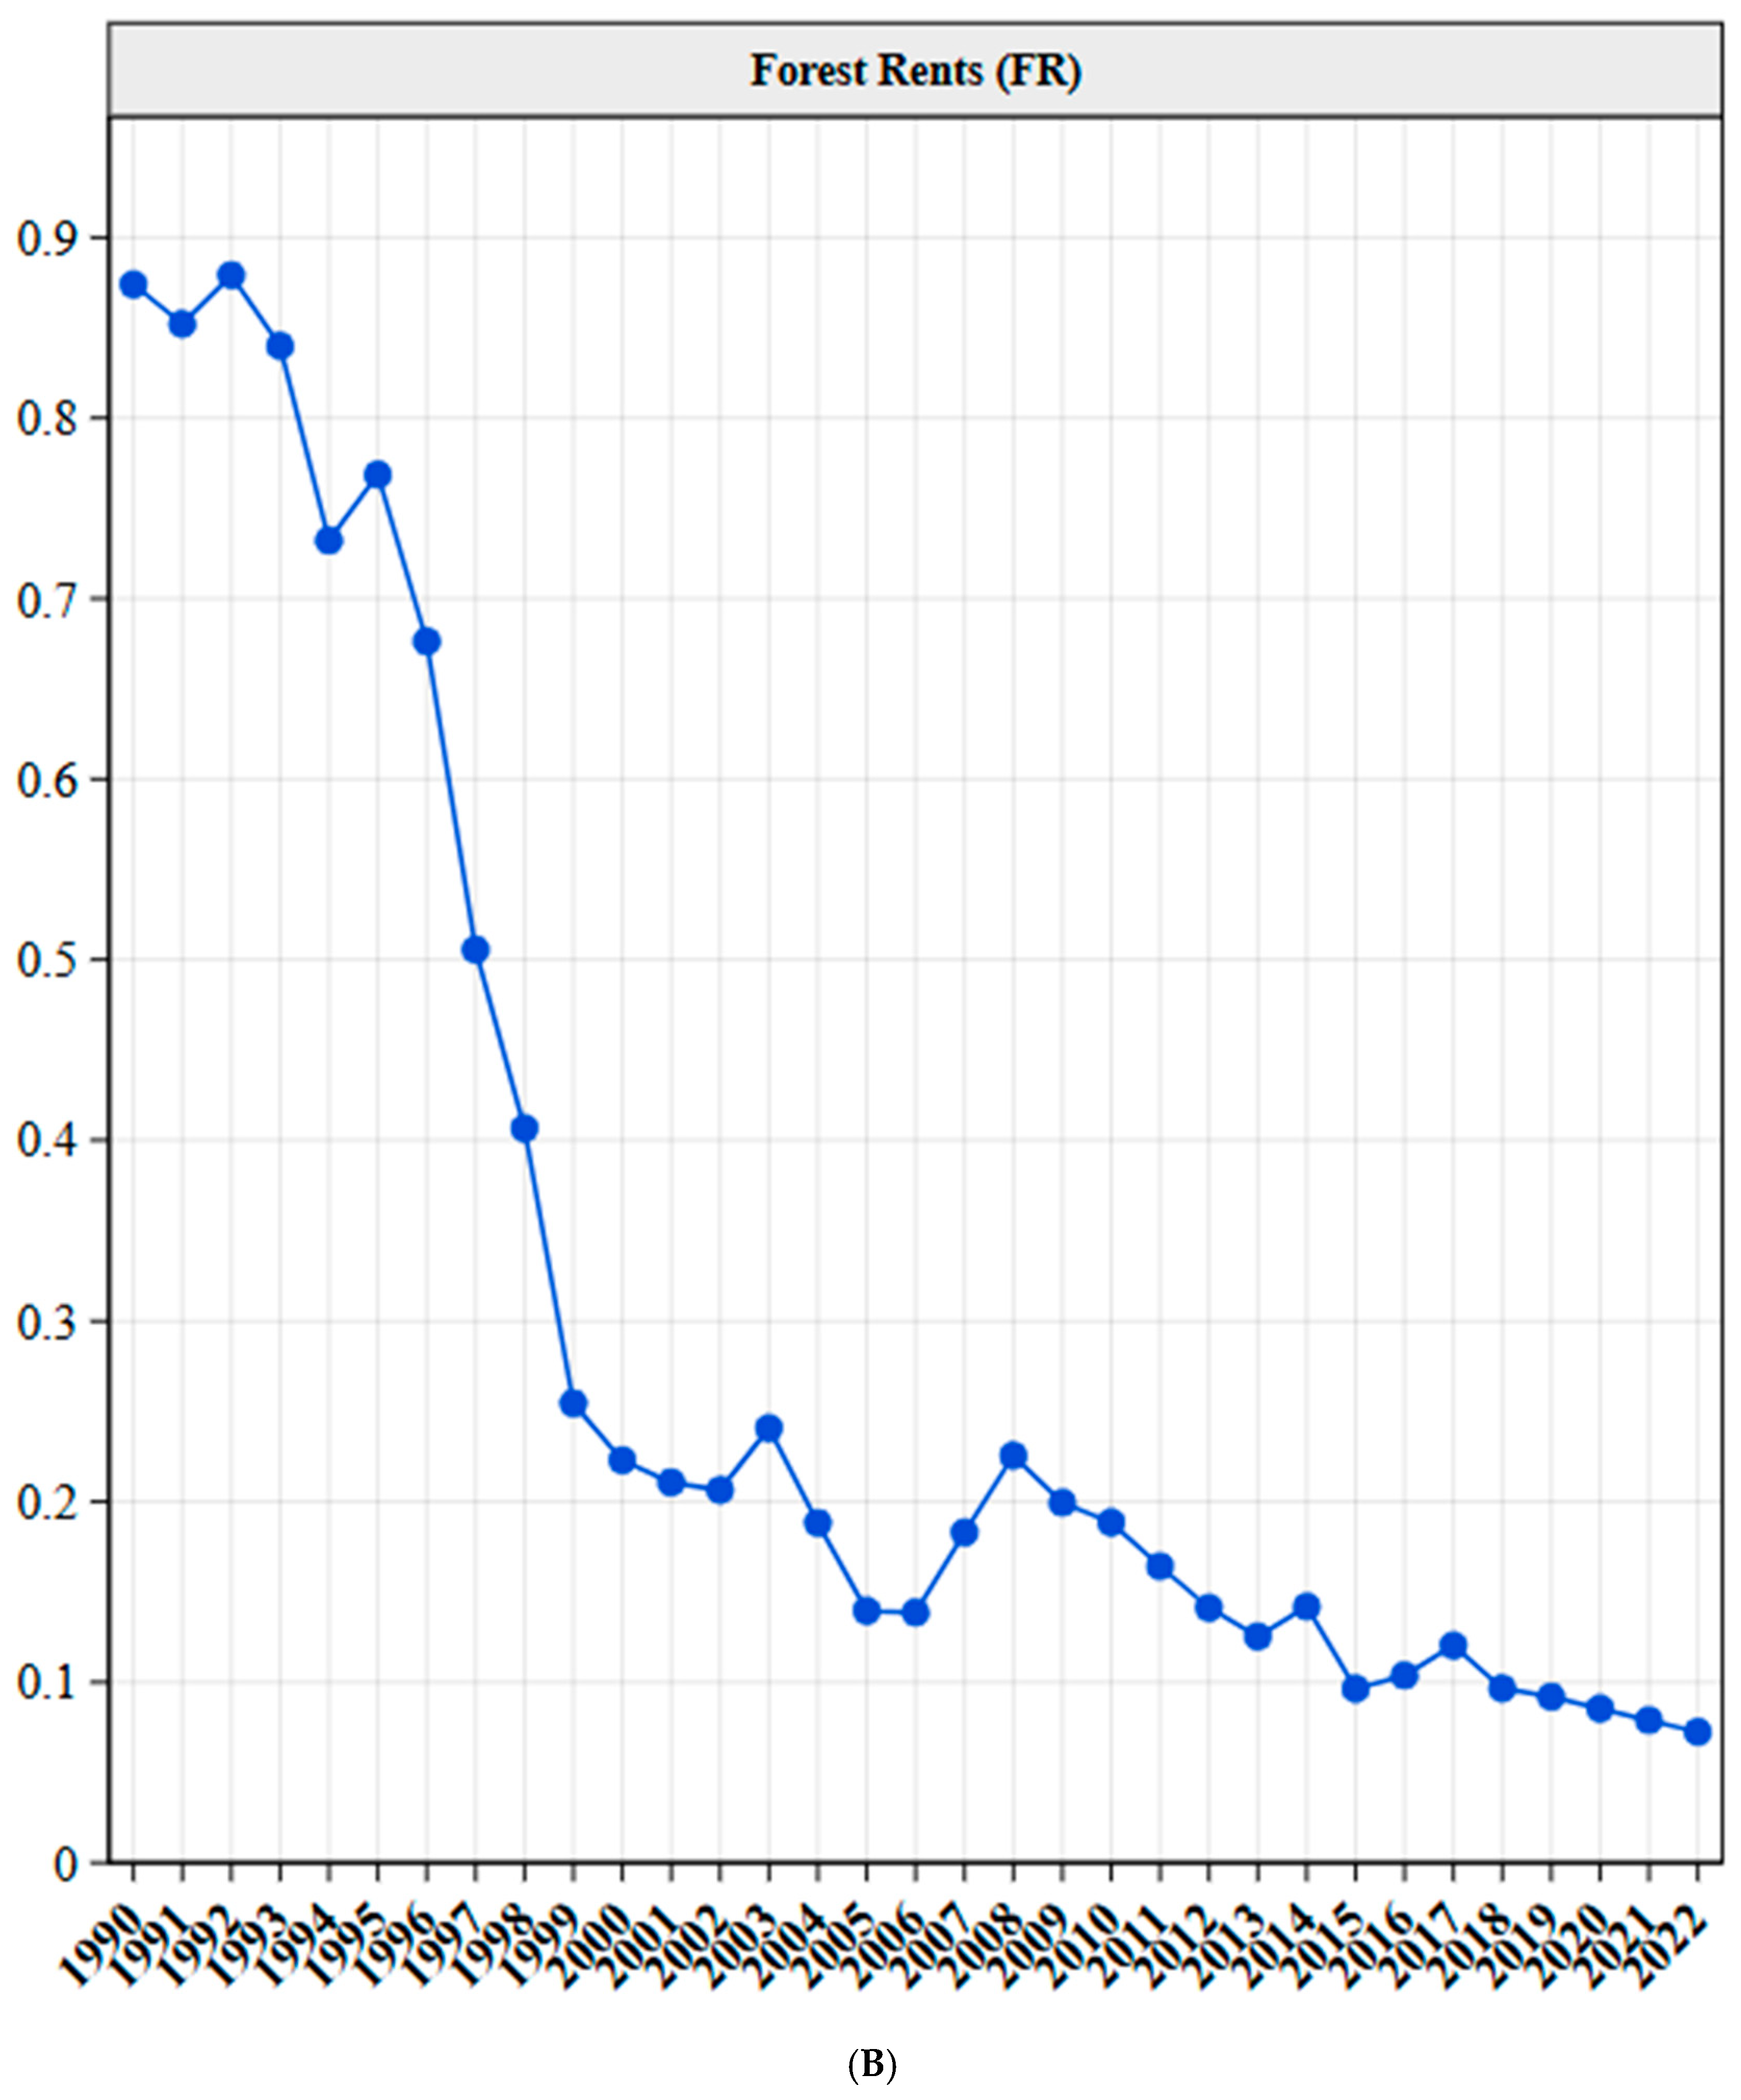
- Forest Rents (FRs): In this study, forest rents are considered a main independent variable, and their impact on dependent variables was assessed. This is calculated by determining the difference between the value of timber production and the cost of production, expressed as a percentage of GDP. Data were obtained from the WDIs database;
- -
- Fossil Fuel Consumption (FFC): Fossil fuel consumption, which is the final energy consumption derived from fossil fuels, including coal, oil, and natural gas, is also considered a main independent variable in this study. Data were obtained from the World Development Indicators (WDIs) database, which provides standardized metrics on energy use across countries. The variable is calculated as the ratio of energy consumption from fossil fuels to the total final energy consumption, expressed as a percentage;
- -
- Foreign Direct Investment (FDI): FDI is considered a control variable. It is the net inflows of investment from foreign entities into a country, expressed as a percentage of GDP. It includes investments in physical assets, such as factories, infrastructure, and natural resources, as well as financial assets. FDI is calculated as the total net inflows of foreign investment divided by GDP, expressed as a percentage (Net Inflows (% of GDP)). Data on FDI were sourced from the WDI database;
- -
- Gross Domestic Product (GDP): GDP is included as a control variable to account for the impact of economic growth on ecological footprints. Gross domestic product represents the total monetary value of all goods and services produced within a country in a given year. It is a widely used indicator of economic growth and development. GDP is measured in current US dollars, adjusted for inflation, to reflect the real economic output of a country. GDP data were obtained from the WDI database;
- -
- Population (POP): This refers to the total number of people residing in a country. Population is included as a control variable because it directly affects ecological footprints. It is a fundamental demographic variable that influences resource consumption, land use, and environmental pressure. The variable is measured as the total population count in a given year. Data were sourced from the WDI database.
3.2. Diagnostic Tests
3.2.1. Unit Root Test
3.2.2. Serial Correlation Test
3.2.3. Heteroskedasticity Test
3.2.4. Variance Inflation Factor (VIF)
3.3. Methodology and Estimation Strategy
4. Results
4.1. Diagnostics Test Results
4.2. Regression Analysis
4.3. Granger Causality Analysis
5. Discussion and Policy Implications
6. Conclusions
Author Contributions
Funding
Data Availability Statement
Acknowledgments
Conflicts of Interest
References
- Raihan, A.; Tuspekova, A. Nexus between Energy Use, Industrialization, Forest Area, and Carbon Dioxide Emissions: New Insights from Russia. J. Environ. Sci. Econ. 2022, 1, 1–11. [Google Scholar] [CrossRef]
- Isfat, M.; Raihan, A. Current Practices, Challenges, and Future Directions of Climate Change Adaptation in Bangladesh. Int. J. Res. Publ. Rev. 2022, 3, 3429–3437. [Google Scholar]
- Raihan, A.; Hasan, M.A.; Voumik, L.C.; Pattak, D.C.; Akter, S.; Ridwan, M. Sustainability in Vietnam: Examining Economic Growth, Energy, Innovation, Agriculture, and Forests’ Impact on CO2 Emissions. World Dev. Sustain. 2024, 4, 100164. [Google Scholar] [CrossRef]
- Raihan, A.; Voumik, L.C.; Zimon, G.; Sadowska, B.; Rashid, M.; Akter, S. Prioritising Sustainability: How Economic Growth, Energy Use, Forest Area, and Globalization Impact on Greenhouse Gas Emissions and Load Capacity in Poland? Int. J. Sustain. Energy 2024, 43, 2361410. [Google Scholar] [CrossRef]
- Shah, S.; Race, D. Greening the Blue Pacific: Lessons on Reducing Emissions from Deforestation and Forest Degradation (REDD+). Policy Econ. 2024, 166, 103263. [Google Scholar] [CrossRef]
- Wang, C.; Jin, J.; Davies, C.; Chen, W.Y. Urban Forests as Nature-Based Solutions: A Comprehensive Overview of the National Forest City Action in China. Curr. For. Rep. 2024, 10, 119–132. [Google Scholar] [CrossRef]
- Chen, Z.; Dayananda, B.; Du, H.; Zhou, G.; Wang, G. Assessing Carbon Sequestration Potential in State-Owned Plantation Forests in China and Exploring Feasibility for Carbon Offset Projects. Forests 2024, 15, 886. [Google Scholar] [CrossRef]
- GFW Forest-Related Greenhouse Gas Fluxes in China. Available online: https://www.globalforestwatch.org/dashboards/country/CHN/?category=summary (accessed on 14 January 2025).
- Huang, D.; Shen, H.; Miao, Y.; Ding, R.; Lin, Y.; Tan, H. The Impacts of Forest Resources, Green Investment, Healthcare, and Education on Environmental Pollution: China Carbon Neutrality Program. J. Clean. Prod. 2024, 467, 143038. [Google Scholar] [CrossRef]
- Hao, L.; Meng, Q.; Umar, M.; Long, C. Mineral Resources and Intellectual Capital: Asymmetrical Impacts and Sustainable Development Outcomes. Resour. Policy 2024, 91, 104936. [Google Scholar] [CrossRef]
- Thanh, T.T.; Van Song, N.; Thanh Huyen, N.T.; Ha, L.T.; Lan Huong, T.T. An Exploration of Linkage between Climate-Related Financial Policies and Natural Rents: Evidence from the Global Database. Resour. Policy 2024, 88, 104450. [Google Scholar] [CrossRef]
- Debonheur, K.D.; Avom, D.; Ouedraogo, I. The Effect of Natural Resources Rents on Human Development in Selected African Countries. Nat. Resour. Forum. 2024, 48, 803–837. [Google Scholar] [CrossRef]
- Ongo Nkoa, B.E.; Song, J.S.; Minkoue Bikoula, B. Natural Resource Rents in Developing Countries: Is the Positive Influence on the Fragilities Real? Resour. Policy 2024, 89, 104541. [Google Scholar] [CrossRef]
- Achuo, E.D.; Miamo, C.W.; Kouhomou, C.Z. Resource Rents and Environmental Pollution in Developing Countries: Does the Quality of Institutions Matter? Rev. Dev. Econ. 2024, 28, 360–387. [Google Scholar] [CrossRef]
- Yasin, I.; Ahmad, N.; Amin, S.; Sattar, N.; Hashmat, A. Does Agriculture, Forests, and Energy Consumption Foster the Carbon Emissions and Ecological Footprint? Fresh Evidence from BRICS Economies. Environ. Dev. Sustain. 2024. [Google Scholar] [CrossRef]
- Dubey, R.; Bryde, D.J.; Dwivedi, Y.K.; Graham, G.; Foropon, C.; Papadopoulos, T. Dynamic Digital Capabilities and Supply Chain Resilience: The Role of Government Effectiveness. Int. J. Prod. Econ. 2023, 258, 108790. [Google Scholar] [CrossRef]
- Li, R.; Hu, S.; Wang, Q. Reexamining the Impact of Natural Resource Rent and Corruption Control on Environmental Quality: Evidence from Carbon Emissions and Ecological Footprint in 152 Countries. Nat. Resour. Forum. 2024, 48, 636–660. [Google Scholar] [CrossRef]
- Irfan, M.; Quddus, A.; Shahzad, F.; Wang, Y. Do ICT Trade Balances and Natural Resources Foster Carbon Emissions? The Role of Government Effectiveness and Green Technology Innovation. Struct. Change Econ. Dyn. 2025, 72, 320–329. [Google Scholar] [CrossRef]
- Radwan, A.; Hongyun, H.; Achraf, A.; Mustafa, A.M. Energy Use and Energy-Related Carbon Dioxide Emissions Drivers in Egypt’s Economy: Focus on the Agricultural Sector with a Structural Decomposition Analysis. Energy 2022, 258, 124821. [Google Scholar] [CrossRef]
- Raihan, A. The Dynamic Nexus between Economic Growth, Renewable Energy Use, Urbanization, Industrialization, Tourism, Agricultural Productivity, Forest Area, and Carbon Dioxide Emissions in the Philippines. Energy Nexus 2023, 9, 100180. [Google Scholar] [CrossRef]
- Obuobi, B.; Zhang, Y. Green Investment and Its Transformative Impact on Energy Use in Agriculture: A Holistic Approach towards Carbon Dioxide Emissions. Energy 2024, 309, 133075. [Google Scholar] [CrossRef]
- Noor, M.; Khan, D.; Khan, A.; Rasheed, N. The Impact of Renewable and Non-Renewable Energy on Sustainable Development in South Asia. Environ. Dev. Sustain. 2023, 26, 14621–14638. [Google Scholar] [CrossRef]
- Khan, I.; Xue, J.; Zaman, S.; Mehmood, Z. Nexus Between FDI, Economic Growth, Industrialization, and Employment Opportunities: Empirical Evidence from Pakistan. J. Knowl. Econ. 2023, 14, 3153–3175. [Google Scholar] [CrossRef]
- Nam, H.-J.; Ryu, D. FDI and Human Development: The Role of Governance, ODA, and National Competitiveness. J. Int. Financ. Mark. Inst. Money 2023, 85, 101769. [Google Scholar] [CrossRef]
- Rakshit, B. Dynamics between Trade Openness, FDI and Economic Growth: Evidence from an Emerging Economy. J. Int. Trade Law Policy 2022, 21, 16–41. [Google Scholar] [CrossRef]
- Tian, L.; Zhai, Y.; Zhang, Y.; Tan, Y.; Feng, S. Pollution Emission Reduction Effect of the Coordinated Development of Inward and Outward FDI in China. J. Clean. Prod. 2023, 391, 136233. [Google Scholar] [CrossRef]
- Sheng, X.; Yi, R.; Tang, D.; Lansana, D.D.; Obuobi, B. The Severity of Foreign Direct Investment Components on China’s Carbon Productivity. J. Clean. Prod. 2023, 424, 138929. [Google Scholar] [CrossRef]
- Ahmed, F.; Kousar, S.; Pervaiz, A.; Shabbir, A. Do Institutional Quality and Financial Development Affect Sustainable Economic Growth? Evidence from South Asian Countries. Borsa Istanb. Rev. 2022, 22, 189–196. [Google Scholar] [CrossRef]
- Khan, I.; Hou, F.; Irfan, M.; Zakari, A.; Le, H.P. Does Energy Trilemma a Driver of Economic Growth? The Roles of Energy Use, Population Growth, and Financial Development. Renew. Sustain. Energy Rev. 2021, 146, 111157. [Google Scholar] [CrossRef]
- Obuobi, B.; Zhang, Y.; Nketiah, E.; Adu-Gyamfi, G.; Cudjoe, D. Renewable Energy Demand, Financial Reforms, and Environmental Quality in West Africa. Environ. Sci. Pollut. Res. 2022, 29, 69540–69554. [Google Scholar] [CrossRef]
- Global Footprints Network Data. Available online: https://data.footprintnetwork.org/ (accessed on 18 November 2023).
- WDI Data Bank. World Development Indicators. Available online: https://databank.worldbank.org/source/world-development-indicators# (accessed on 20 November 2023).
- WGI Data Bank. Worldwide Governance Indicators. Available online: https://databank.worldbank.org/source/worldwide-governance-indicators# (accessed on 20 November 2023).
- Dickey, D.A.; Fuller, W.A. Distribution of the Estimators for Autoregressive Time Series with a Unit Root. J. Am. Stat. Assoc. 1979, 74, 427–431. [Google Scholar] [CrossRef]
- Perron, P. Testing for a Unit Root in a Time Series with a Changing Mean. J. Bus. Econ. Stat. 1990, 8, 153–162. [Google Scholar] [CrossRef]
- Zhang, Y.; Obuobi, B.; Hwarari, D.; Zhang, Z. A Comprehensive Model Assessment of China’s Forestry and Climate Change. Forests 2023, 14, 1454. [Google Scholar] [CrossRef]
- Laureti, L.; Costantiello, A.; Leogrande, A. The Role of Government Effectiveness in the Light of ESG Data at Global Level. SSRN Electron. J. 2023. [Google Scholar] [CrossRef]
- Nzama, L.; Sithole, T.; Kahyaoglu, S.B. The Impact of Government Effectiveness on Trade and Financial Openness: The Generalized Quantile Panel Regression Approach. J. Risk Financ. Manag. 2022, 16, 14. [Google Scholar] [CrossRef]


| Variable | Description | Mean | Med. | SD | Skew. | Kurt. | JB | Prob. | Source |
|---|---|---|---|---|---|---|---|---|---|
| EFFs | Ecological footprints on forests | 19.288 | 19.186 | 0.200 | 0.594 | 1.898 | 3.608 | 0.165 | [31] |
| FRs | Forest rents | −1.501 | −1.668 | 0.797 | 0.561 | 2.054 | 2.962 | 0.227 | [32] |
| GEFF | Government effectiveness | 0.017 | 0.015 | 0.373 | 0.230 | 2.109 | 1.382 | 0.501 | [33] |
| FFC | Fossil fuel consumption | 4.441 | 4.464 | 0.076 | −0.069 | 1.761 | 2.137 | 0.343 | [32] |
| FDI | Foreign direct investment | 0.930 | 1.248 | 0.754 | −1.411 | 4.664 | 14.750 | 0.001 | [32] |
| GDP | Gross domestic product | 28.698 | 28.643 | 1.285 | −0.120 | 1.593 | 2.801 | 0.247 | [32] |
| POP | Population | 20.986 | 20.994 | 0.067 | −0.373 | 2.128 | 1.810 | 0.404 | [32] |
| Correlation matrix | |||||||||
| EFFs | FRs | GEFF | FFC | FDI | GDP | POP | |||
| EFFs | 1.000 | ||||||||
| FRs | −0.622 | 1.000 | |||||||
| GEFF | 0.570 | −0.707 | 1.000 | ||||||
| FFC | 0.798 | −0636 | 0.531 | 1.000 | |||||
| FDI | −0.688 | 0.450 | −0.460 | −0.535 | 1.000 | ||||
| GDP | 0.529 | −0.727 | 0.637 | 0.779 | −0.495 | 1.000 | |||
| POP | 0.502 | −0.766 | 0.539 | 0.579 | −0.465 | 0.683 | 1.000 | ||
| ADF | PP | |||||||
|---|---|---|---|---|---|---|---|---|
| Level | 1D | Level | 1D | |||||
| Stats. | Sig. | Stats. | Sig. | Stats. | Sig. | Stats. | Sig. | |
| EFFs | 0.941 | 0.995 | −4.066 | 0.004 *** | 1.260 | 0.998 | −3.887 | 0.006 *** |
| FRs | −1.019 | 0.734 | −4.758 | 0.001 *** | −1.018 | 0.735 | −4.713 | 0.001 *** |
| FFC | 0.126 | 0.963 | −5.152 | 0.000 *** | 0.098 | 0.961 | −5.159 | 0.000 *** |
| GEFF | −1.586 | 0.478 | −4.071 | 0.004 *** | −1.582 | 0.480 | −3.033 | 0.043 ** |
| FDI | 0.708 | 0.990 | −2.927 | 0.054 * | 0.003 | 0.952 | −2.897 | 0.057 * |
| GDP | −1.588 | 0.476 | −2.845 | 0.064 * | −1.215 | 0.656 | −2.813 | 0.068 * |
| POP | −0.452 | 0.888 | −3.256 | 0.026 ** | −5.318 | 0.000 *** | −3.256 | 0.026 ** |
| Test | F-Statistic | Sig. |
|---|---|---|
| Serial Correlation LM Test: | ||
| Null hypothesis: no serial correlation | ||
| Breusch–Godfrey | 1.651 | 0.213 |
| Heteroskedasticity Test: | ||
| Null hypothesis: homoskedasticity | ||
| Breusch–Pagan–Godfrey | 0.994 | 0.450 |
| Variable | Centered VIF |
|---|---|
| FRs | 3.206 |
| GEFF | 3.780 |
| FFC | 4.046 |
| FDI | 3.979 |
| GDP | 3.268 |
| POP | 3.822 |
| Quantiles | ||||||
|---|---|---|---|---|---|---|
| OLS | 0.2 | 0.4 | 0.5 | 0.7 | 0.8 | |
| Variable | β | β | β | β | β | β |
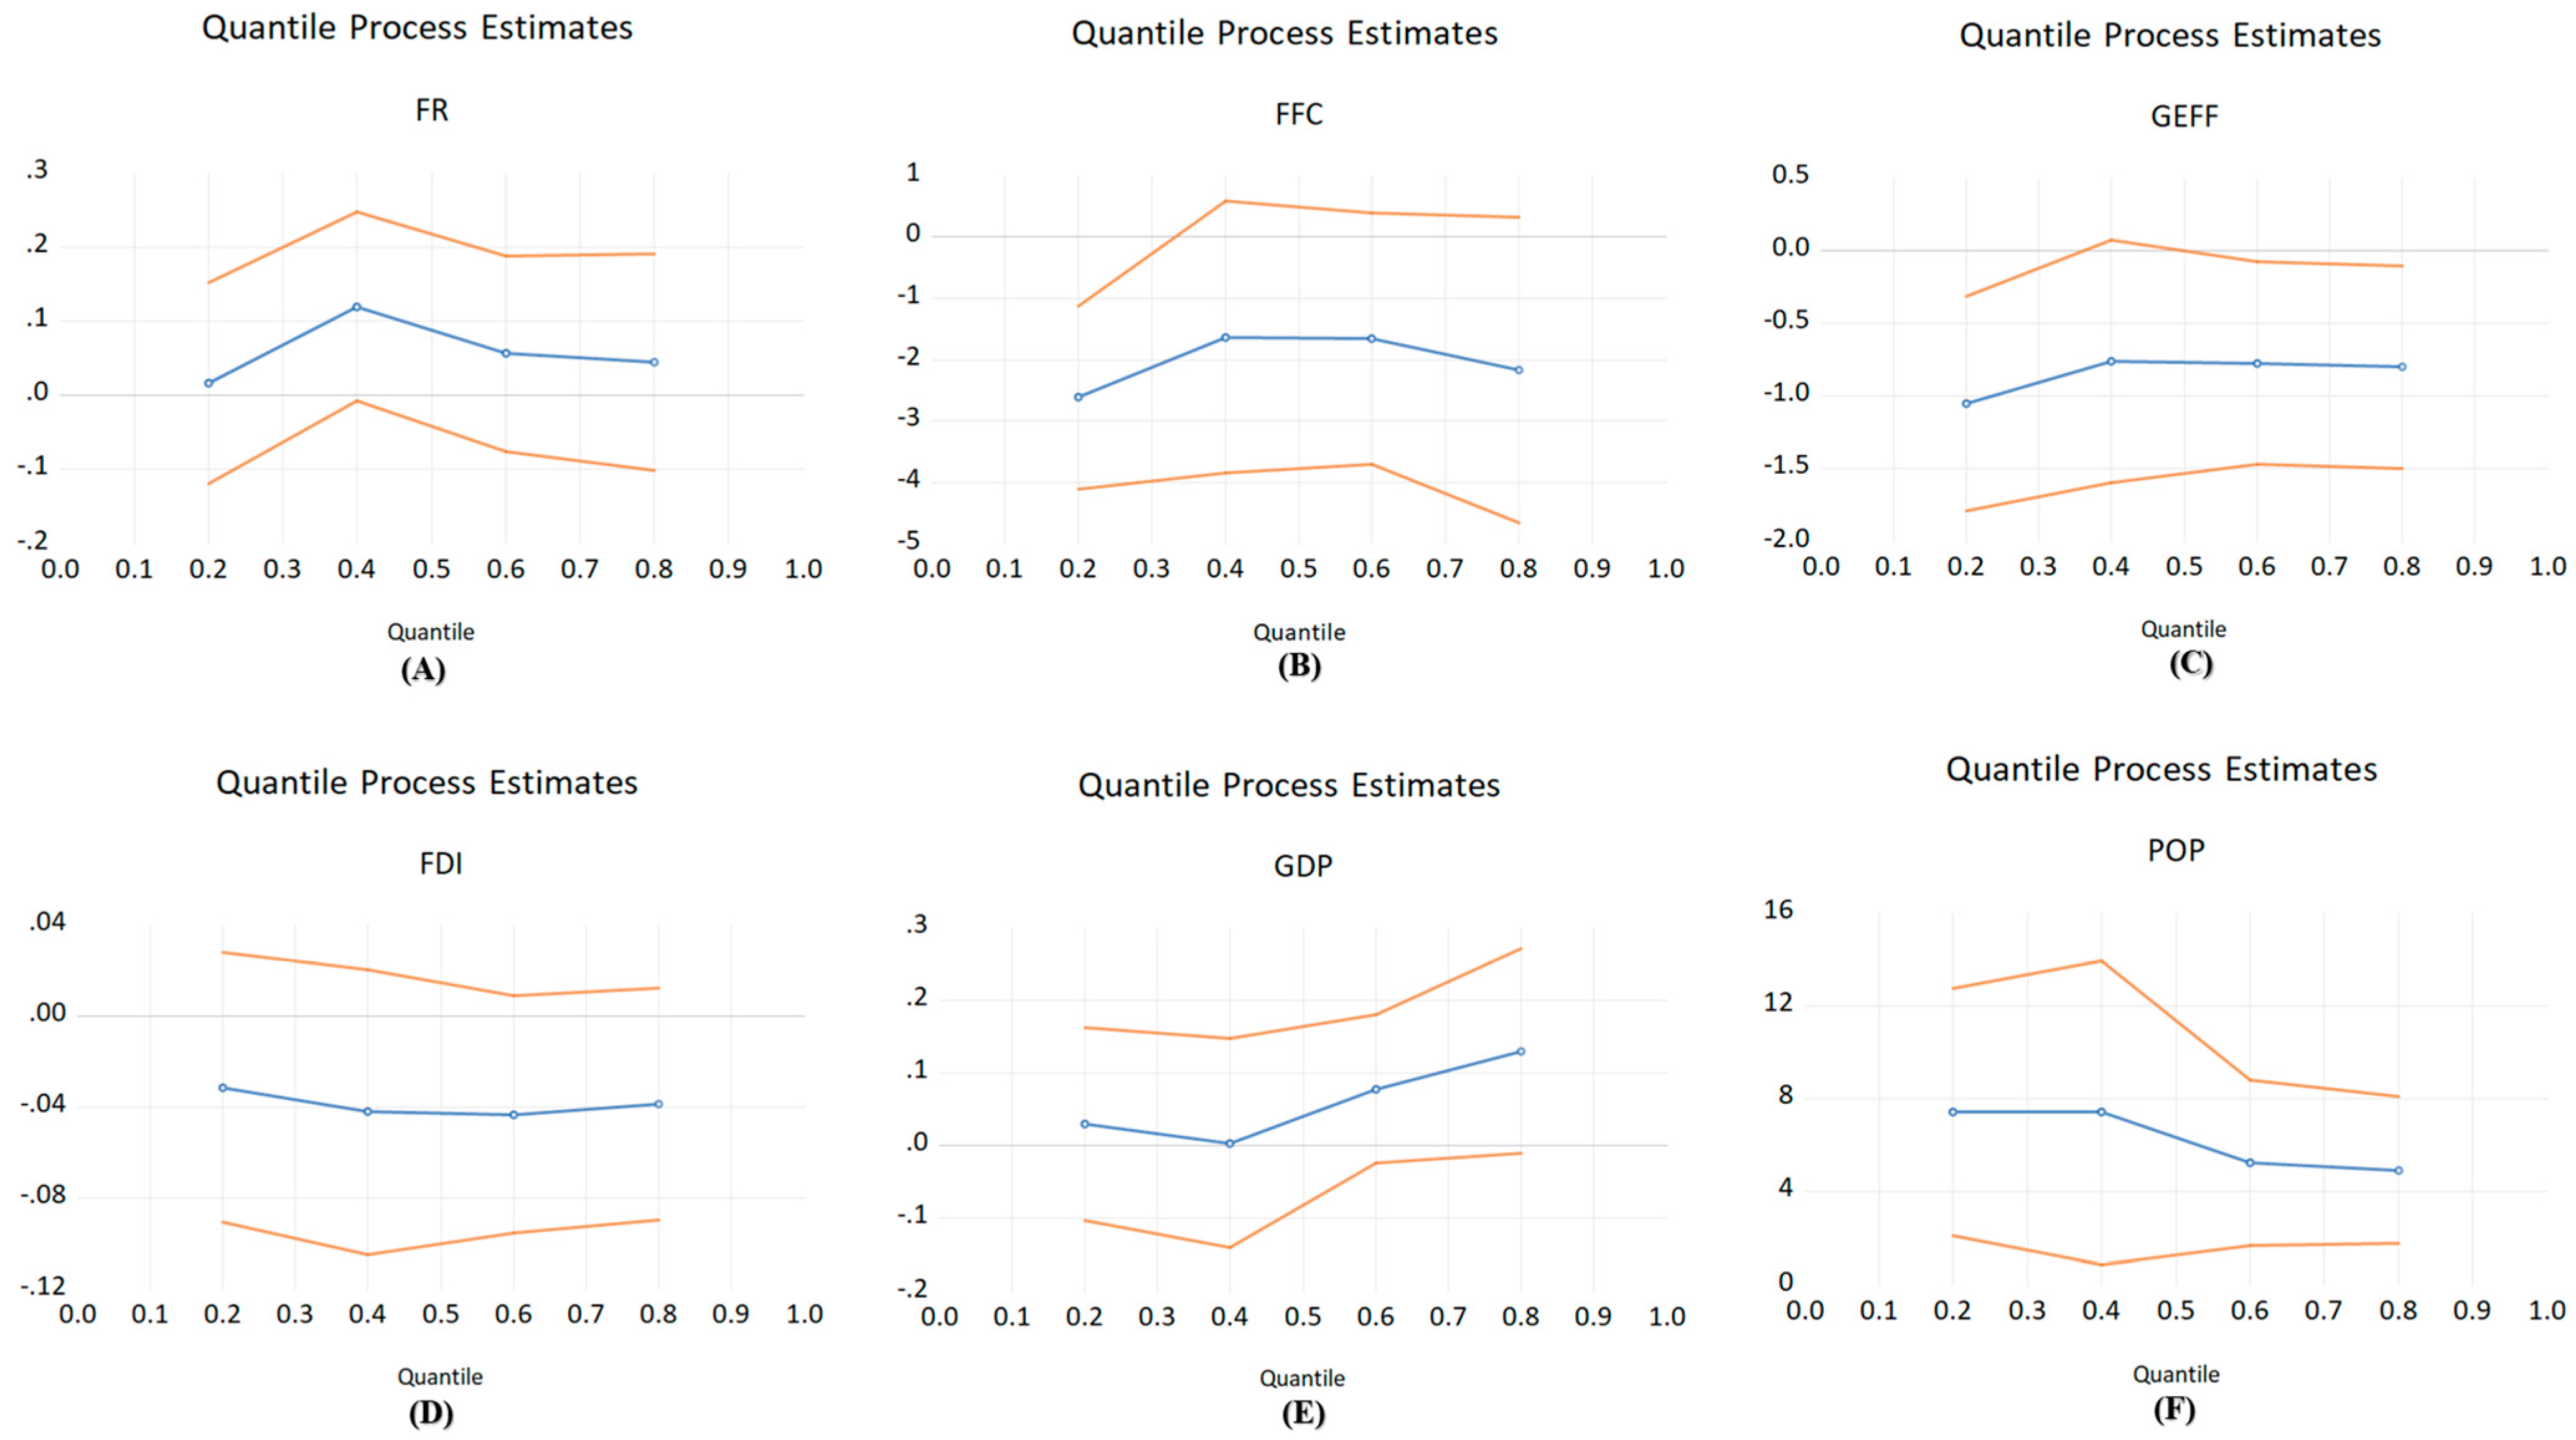
| FRs | 0.145 *** | 0.017 ** | 0.120 * | 0.077 ** | 0.048 * | 0.045 * |
| (0.045) | (0.069) | (0.065) | (0.073) | (0.078) | (0.075) | |
| FFC | −1.396 ** | −2.617 *** | −1.633 | −1.735 | −1.979 | −2.171 ** |
| (0.645) | (0.758) | (1.132) | (1.320) | (1.334) | (1.272) | |
| FDI | −0.096 *** | −0.032 | −0.042 | −0.021 ** | −0.041 | −0.039 |
| (0.014) | (0.030) | (0.032) | (0.034) | (0.027) | (0.026) | |
| GDP | 0.106 ** | 0.030 | 0.003 | 0.059 | 0.129 * | 0.130* |
| (0.045) | (0.068) | (0.073) | (0.071) | (0.070) | (0.072) | |
| POP | 3.163 ** | 7.433 ** | 7.415 ** | 6.244 * | 4.495 ** | 4.929 *** |
| (1.199) | (2.723) | (3.338) | (3.506) | (1.713) | (1.605) | |
| GEFF | 0.446 | −1.051 ** | −0.760 * | −0.819 * | −0.707 * | −0.802 ** |
| (0.066) | (0.377) | (0.424) | (0.445) | (0.376) | (0.353) | |
| C | −43.640 | −126.012 ** | −129.004 * | −105.651 | −69.895 ** | −78.172 ** |
| 23.358 | (53.214) | (64.397) | (67.485) | (32.526) | (30.752) | |
| R-squared | 0.956 | [0.807] | [0.823] | [0.847] | [0.863] | [0.867] |
| Prob. | 0.000 | 0.000 | 0.000 | 0.000 | 0.000 | 0.000 |
| Wald Tests | ||||||
| Slope | 9.995 * | |||||
| Symmetry | 4.443 ** | |||||
| EFFs | FRs | GEFF | FFC | FDI | GDP | POP | |
|---|---|---|---|---|---|---|---|
| EFFs | 1.801 | 1.093 | 0.695 | 7.987 | 1.591 | 8.598 | |
| (0.185) | (0.350) | (0.508) | (0.002) *** | (0.223) | (0.001) *** | ||
| FRs | 4.931 | 2.380 | 2.318 | 3.633 | 1.416 | 3.874 | |
| (0.015) ** | (0.112) | (0.119) | (0.041) * | (0.261) | (0.034) ** | ||
| GEFF | 3.566 | 1.190 | 5.265 | 9.973 | 0.352 | 0.487 | |
| (0.043) ** | (0.320) | (0.012) | (0.001) *** | (0.707) | (0.620) | ||
| FFC | 2.088 | 0.871 | 3.161 | 5.365 | 2.603 | 1.325 | |
| (0.144) | (0.431) | (0.059) | (0.010) ** | (0.090) * | (0.280) | ||
| FDI | 1.156 | 0.406 | 0.583) | 0.654 | 1.066 | 2.021 | |
| (0.330) | (0.670) | (0.566 | 0.529 | 0.359 | (0.153) | ||
| GDP | 2.440 | 1.673 | 5.233 | 0.689 | 4.280 | 2.580 | |
| (0.107) | (0.207) | (0.012) ** | 0.511 | (0.025) ** | (0.095) * | ||
| POP | 4.738 | 4.112 | 5.956 | 1.668 | 7.313 | 1.752 | |
| (0.018) ** | (0.028) ** | (0.007) ** | (0.208) | (0.003) *** | (0.193) |
Disclaimer/Publisher’s Note: The statements, opinions and data contained in all publications are solely those of the individual author(s) and contributor(s) and not of MDPI and/or the editor(s). MDPI and/or the editor(s) disclaim responsibility for any injury to people or property resulting from any ideas, methods, instructions or products referred to in the content. |
© 2025 by the authors. Licensee MDPI, Basel, Switzerland. This article is an open access article distributed under the terms and conditions of the Creative Commons Attribution (CC BY) license (https://creativecommons.org/licenses/by/4.0/).
Share and Cite
Zhu, Z.-G.; Zhang, Y.; Obuobi, B. The Impact of Forest Rents on Ecological Footprints in China: The Moderating Role of Government Effectiveness. Forests 2025, 16, 415. https://doi.org/10.3390/f16030415
Zhu Z-G, Zhang Y, Obuobi B. The Impact of Forest Rents on Ecological Footprints in China: The Moderating Role of Government Effectiveness. Forests. 2025; 16(3):415. https://doi.org/10.3390/f16030415
Chicago/Turabian StyleZhu, Zheng-Guo, Yifeng Zhang, and Bright Obuobi. 2025. "The Impact of Forest Rents on Ecological Footprints in China: The Moderating Role of Government Effectiveness" Forests 16, no. 3: 415. https://doi.org/10.3390/f16030415
APA StyleZhu, Z.-G., Zhang, Y., & Obuobi, B. (2025). The Impact of Forest Rents on Ecological Footprints in China: The Moderating Role of Government Effectiveness. Forests, 16(3), 415. https://doi.org/10.3390/f16030415