Article

Concentration Characteristics of Culturable Airborne Microbes in the Urban Forests of Yangzhou

1
Jiangsu Academy of Forestry, Nanjing 211153, China
2
Jiangsu Yangzhou Urban Ecosystem Observation and Research Station, Yangzhou 225006, China
3
College of Horticulture and Landscape Architecture, Yangzhou University, Yangzhou 225009, China
*
Authors to whom correspondence should be addressed.
These authors contributed equally to this work.
Forests 2025, 16(2), 378; https://doi.org/10.3390/f16020378
Submission received: 24 January 2025 / Revised: 14 February 2025 / Accepted: 17 February 2025 / Published: 19 February 2025
(This article belongs to the Section Urban Forestry)

Abstract

:
Culturable airborne microorganisms significantly impact air quality and human health in urban forest land. Their concentrations serve as key air quality indicators. Over a year, this study analyzed airborne microorganisms in six forest stands within the Zhuyu Bay Scenic Area, Yangzhou, Jiangsu Province, China, to assess concentration characteristics and seasonal variations. Results showed that bacterial concentrations peaked in spring and summer, while fungal concentrations were highest in March. Microbial levels remained elevated from April to June, with variations among forest stands. A correlation analysis linked humidity, temperature, negative ion concentration, particulate matter 2.5 (PM2.5), and air pressure to microorganism fluctuations. To further explore the impact mechanism of urban microclimate on air microorganism concentrations, this study confirmed a strong positive influence of climatic factors on microorganism concentrations, particularly temperature and humidity. In conclusion, this study identifies seasonal patterns and microclimate interactions that affect airborne microorganism concentrations in urban forests. Findings contribute to ecosystem assessment, urban ecological planning, and climate improvement strategies, supporting informed decision-making.

1. Introduction

As a vital natural resource [1], forests support ecological stability, foster social connections, and enhance human health and well-being [2]. The COVID-19 pandemic underscored the importance of urban forests [3]. Data analysis using the KDDI Location Analyzer (a web application that estimates extrapolated populations based on census and smartphone location data) revealed a significant increase in nature trail visitors in 2020 and a rise in repeat visits to urban parks. This trend intensified in 2021, highlighting the public’s growing appreciation and frequent use of urban forests during and after the pandemic [4]. Therefore, the development and conservation of urban forests serve as an ecological foundation for sustainable urban development and a crucial safeguard for public health and well-being.
Bioaerosols, which are composed of biological materials or byproducts of biological processes, mainly include bacteria, fungi, archaea, viruses, pollen, microbial fragments, and metabolic products (e.g., endotoxins, mycotoxins, and DNA) [5]. Airborne microorganisms, a key component of bioaerosols, are highly diverse and widely dispersed in the atmosphere [5]. Pathogenic microorganisms can transmit long distances via bioaerosols, posing potential risks to human health and ecosystems [6]. Consequently, the composition and abundance of airborne microorganisms are closely linked to public health [7,8]. Recent studies indicate that urban forest structure and function significantly influence the formation and distribution of airborne microbial communities. Landscape patterns, plant species, soil properties, and human activity strongly impact bacterial and fungal populations [9]. Li et al. found that, in areas where Masson pine coverage exceeded 30%, bacterial and fungal pathogen abundance was significantly lower [9]. This suggests that forest composition is crucial in shaping airborne microbial communities and mitigating bioaerosol-related health risks.
Urban forests face numerous challenges, including rising carbon dioxide levels, climate warming, drought, wildfires, pest outbreaks, and nitrogen deposition. Microorganisms mediate forest responses to these environmental stressors, especially fungi and bacteria [10]. Forest functions are declining with the changing climate conditions, such as global warming [11]. Climate change directly and indirectly affects microorganisms. Factors influencing airborne microorganisms include temperature, humidity, particulate matter 2.5 (PM2.5), negative air ions (NAIs), and air pressure. Temperature significantly impacts the seasonal variation in bacterial communities [12] and indirectly affects seasonal fungal spore distribution by regulating metabolic rates and volatile compound release from host plants [13]. Low humidity enhances aerosols electrical charge, facilitating bacterial dispersion over long distances [14]. PM2.5 is a carrier for microorganisms, contributing to bacterial community formation [15]. NAIs can significantly reduce airborne bacterial concentrations by disrupting microbial cell membranes through electrostatic neutralization [16]. Additionally, they promote microbial aerosols coagulation and settling, lowering transmission risks [17]. Atmospheric pressure also plays a role—low-pressure conditions increase air turbulence, transporting surface microorganisms to higher altitudes [18]. In contrast, high-pressure conditions stabilize the atmospheric, limiting vertical diffusion but extending horizontal transport at high altitudes [19]. Understanding these interactions is crucial for effective forest management and climate change mitigation [20]. Biotic and abiotic factors influence airborne microbial communities that exhibit distinct ecological and geographical characteristics, with their distribution being driven by both biotic and abiotic factors [21]. Seasonal climatic variations predominantly drive long-term spatial and temporal changes in microbial communities within urban forests [22], impacting air quality. However, research on the key factors influencing microbial composition and structure in urban green spaces remains limited, necessitating further investigation to explore microbial-level climate change mitigation strategies.
With rapid urbanization, the construction and protection of urban forests have become increasingly critical [23], as has the study of culturable microorganisms in these environments. While extensive research has examined microbial dynamics and their impact on human health [24,25], studies on the concentration characteristics of culturable airborne microorganisms and their relationship with climatic factors remain scarce. This study addresses this gap through a one-year sampling analysis of six forest stand types in the Zhuyu Bay Scenic Area, Yangzhou City, Jiangsu Province, China. It systematically compares the concentration characteristics of culturable airborne microorganisms and explores their correlation with climatic factors. These findings will help to clarify further the important position of urban forests in the urban environment and deepen our insights into the role of airborne microorganisms in climate change and public health.

2. Materials and Methods

2.1. Site Description

The microbial sampling sites in this study are located in the Zhuyu Bay Scenic Area (32.43° N, 119.48° E) of Yangzhou City, Jiangsu Province, China. The region is in the transitional zone between a subtropical monsoon humid climate and a temperate monsoon climate, exhibiting distinct climatic characteristics. The annual average temperature is 15.8 °C, and the annual average precipitation is 864 mm. The four seasons are demarcated, with abundant heat and plentiful rainfall [26]. Additionally, the Zhuyu Bay Scenic Area is one of the key sites of the National Urban Ecosystem Observation and Research Station in Yangzhou City, Jiangsu Province. To ensure the diversity and representativeness of the samples, six different forest stands within the Zhuyu Bay Scenic Area were carefully selected as sample plots. These include Metasequoia glyptostroboides (SSL), Cornus officinalis (SZY), a bamboo forest (ZL), a mixed pine and cypress forest (SBL), a mixed broad-leaved shrub forest (ZKG), and a mixed broad-leaved tree forest (ZKQ) [27]. The trees within these forest stands are interconnected, consisting of pure tree species types with high representativeness. The areas of the six sample plots are 8 m × 10 m, 10 m × 5 m, 10 m × 8 m, 8 m × 8 m, 8 m × 8 m, and 8 m × 8 m, respectively. The average tree ages are 5 years, 10 years, 8 years, 5 years, 5 years, and 8 years, respectively [28].

2.2. Airborne Microbial Collection

This study employed the FA-1 sampler (Qingdao Juchuang Environmental Protection Group Co., Ltd., Qingdao, China) to collect cultivable airborne microorganisms. Prior to sampling, the sampler was sterilized in an autoclave at 180 °C for 2 h to ensure aseptic conditions and eliminate potential microbial contamination. The sterilized sampler was then placed in a biosafety cabinet to maintain a sterile environment. After each sampling session, the sampler was thoroughly cleaned with a 5% bleach solution and 75% ethanol to prevent cross-contamination.
The FA-1 sampler is a six-stage cascade sampler, with each stage being equipped with a sampling plate containing 400 evenly distributed holes. The sampler draws air through Petri dishes containing nutrient agar to achieve a graded collection of airborne particles, operating at an airflow rate of 28.3 L/min. The specific grading is as follows: particles with a diameter ≥7.0 μm are collected in the first stage; particles of 4.7–7.0 μm are collected in the second stage; particles of 3.3–4.7 μm are collected in the third stage; particles of 2.1–3.3 μm are collected in the fourth stage; particles of 1.1–2.1 μm are collected in the fifth stage; and particles of 0.65–1.1 μm are collected in the sixth stage. This graded collection method enables precise analysis of airborne microbial particles of different sizes [5].
A year-long monthly sampling of cultivable airborne microorganisms across the six different forest stands began in November 2023. The collected microorganisms include bacteria and fungi. Bacteria were cultured on Luria–Bertani agar, while fungi were cultured on Sabouraud dextrose agar. During sampling, the sampler was positioned 1.5 m above the ground and operated at a constant airflow rate of 28.3 L/min for 5 min to ensure consistency and standardization of the sampling process [5]. After collection, bacterial samples were incubated at 37 °C for 48 h, while fungal samples were incubated at 28 °C for 72 h. An optimal environment for microbial growth was established by precisely controlling the culture conditions, facilitating subsequent analysis and research.

2.3. Determination of Airborne Microbial Concentration

After incubation, the colony-forming units (CFUs) on each culture plate were counted. The sample concentration was expressed as CFU per cubic meter of air (CFU/m3). During microbial sampling, microbial particles may impact the same location on the plate through the same sieve hole, leading to overlapping colonies, which can affect the accuracy of colony counting. The colony counts using Equation (1) minimized this error. The bacterial concentration was calculated using Equation (2), while the fungal concentration was calculated using Equation (3). The total concentrations of bacteria and fungi were obtained through Equations (4) and (5), respectively, and the total microbial concentration was calculated using Equation (6). The proportion of bacterial concentration was calculated using Equation (7), whereas the proportion of fungal concentration was calculated using Equation (8). These calculation methods represent the relative abundance of bacteria and fungi in the microbial community and their inter-relationships.
Pr = N ( 1 N + 1 N 1 + 1 N 2 + + 1 N r + 1 )
B C i ( C F U / m 3 ) = B T i × 1000 t min   ×   F ( L / min )
F C i ( C F U / m 3 ) = F T i   ×   1000 t min   ×   F ( L / min )
B C = B C 1 + B C 2 + B C 6
F C = F C 1 + F C 2 + F C 6
T C = B C + F C
B P = B C / T C × 100 %
F P = F C / T C × 100 %
In Equation (1), Pr represents the corrected colony count for each stage, N denotes the number of holes in each stage, and r is the enumerated colony count. In Equations (2) and (3), BCi and FCi refer to the bacterial and fungal concentrations at different stages (stages 1 to 6) of the sampler, respectively. BTi and FTi represent the corrected colony counts for bacteria and fungi at each stage, where i ranges from 1 to 6. F is the sampling flow rate, measured in L/min, and t is the sampling time. In Equations (4)–(8), TC, BC, and FC represent the total concentrations of microorganisms, bacteria, and fungi, respectively. BC1 to BC6 denote the bacterial concentrations for stages 1 to 6, while FC1 to FC6 indicate fungal concentrations for stages 1 to 6. BP and total fungal concentration (FP) are the proportions of bacterial and fungal concentrations.

2.4. Microclimate Environment and Data Collection

Automatic observation equipment was deployed in the core area of the scenic spot (Table 1) to obtain urban microclimate data for the Zhuyu Bay Scenic Area. The air intake of the equipment was set 3 m above the ground, and sensors collected climate data in real time. During the study period, five key climatic factors related to cultivable airborne microorganisms were closely monitored: air temperature (AT), air moisture (AM), PM2.5 concentration, NAI concentration, and air pressure (AP). Since 1 November 2023, the observation equipment has automatically collected climatic data once every hour based on a preset program, storing the data in the system. The observation equipment was calibrated and maintained twice a month to ensure accuracy. The raw data were preprocessed, and outliers and missing values were screened and removed using the R programming language (version 4.3.2) to ensure the reliability of subsequent analyses.

2.5. Statistical Analysis

Bar charts depicting bacterial counts, fungal counts, and total microbial concentrations across different months and forest stands were generated using the R programming language. The Kruskal–Wallis test was performed to assess the data normality and homogeneity of variance. Additionally, variance analysis was used to compare microbial concentration differences among various months within the same forest stand to determine statistical significance. Density distribution charts illustrating variations in five climatic factors (AT, AM, PM2.5, NAIs, and AP) throughout the year were also plotted using the R programming language. The correlation coefficients between key variables, including PM2.5, NAIs, AP, AM, AT, TC, FP, and BP, were calculated using statistical software, and their significance levels were analyzed [29]. Relationships between each pair of variables were visually represented through scatter plots. Finally, partial least squares path modeling (PLS-PM) was employed to explore the inter-relationships between airborne microorganisms and the five climatic factors, providing insights into how climatic conditions influence airborne microbial communities.

3. Results

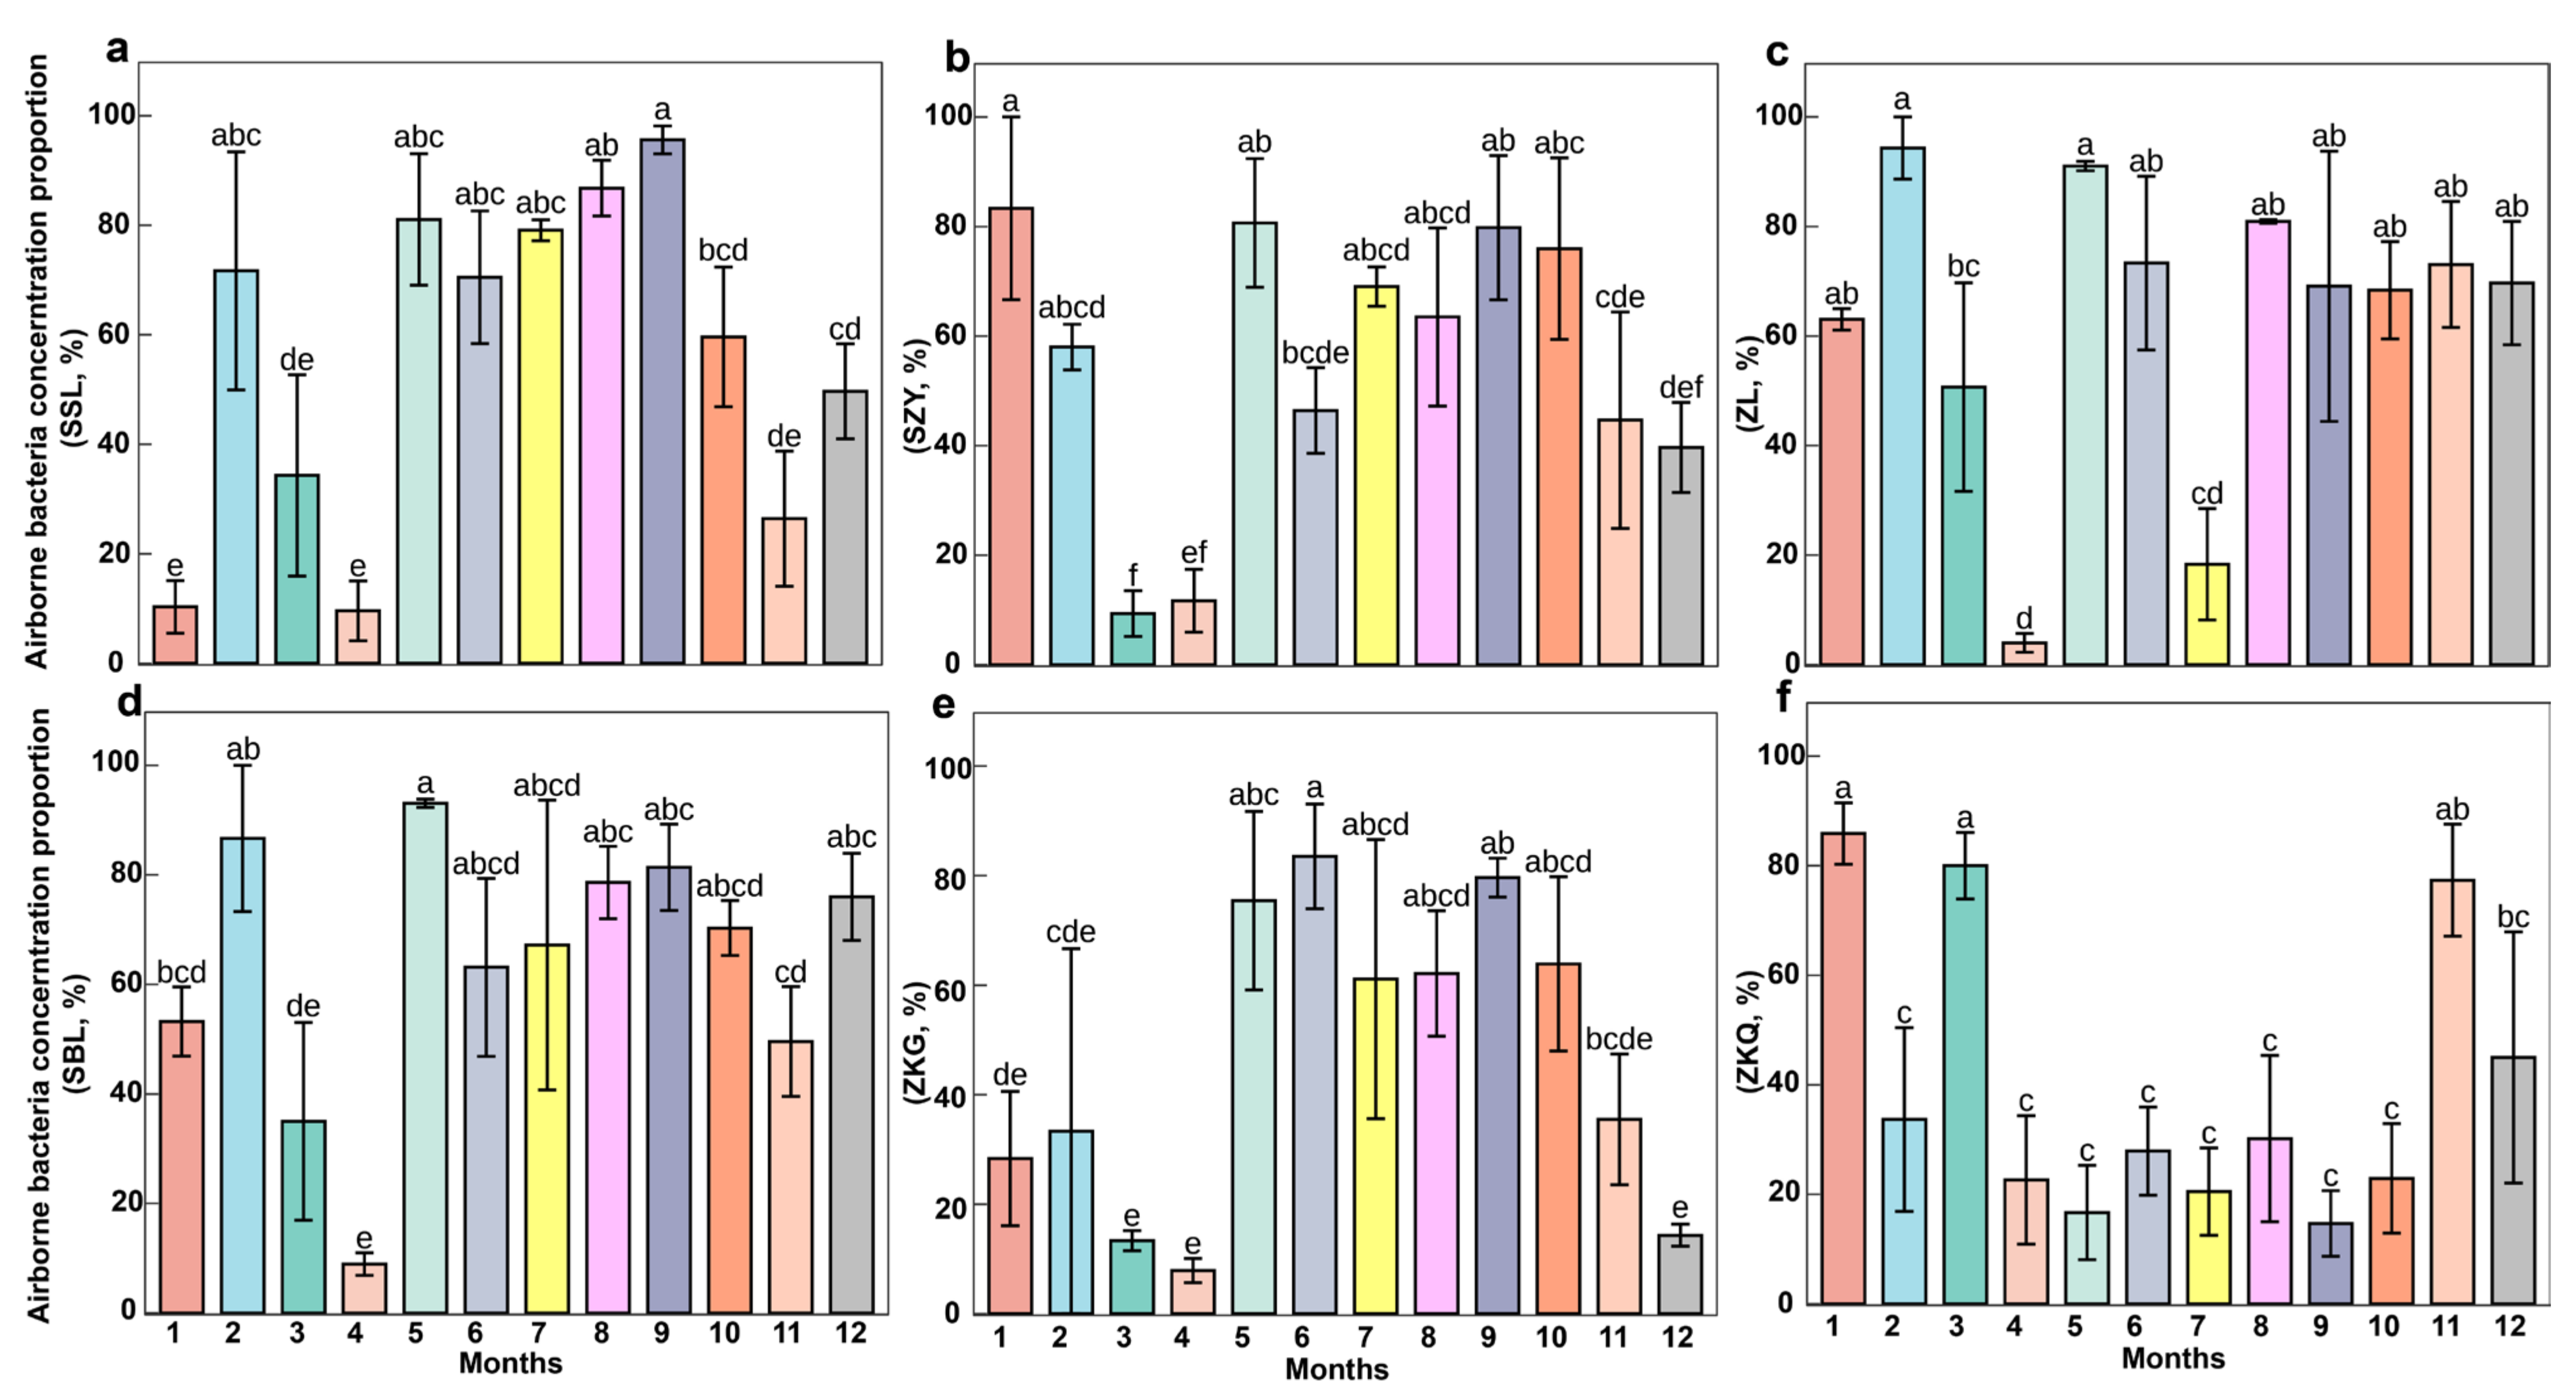
3.1. Proportion of Bacteria in Airborne Microorganisms Across Different Forest Stands

The proportion of bacterial counts among airborne microorganisms in various Zhuyu Bay Scenic Area forest stands was analyzed (Figure 1). The results indicated significant seasonal variations in bacterial proportions across different months. In SSL, the bacterial proportion peaked at 95% in September but was relatively low in January and April. In SZY, the bacterial proportion was 83% in January but dropped to 10% in March. In ZL, it reached 95% but dropped to just 5% in April. In SBL, the bacterial proportion was 92% in May but decreased to 10% in April. In ZKG, the bacterial proportion fluctuated but remained relatively low overall, reaching 83% in June and 12% in April. In ZKQ, the bacterial proportions were generally below 30% throughout the year, with the lowest value of 17% in September than the other forest stands. The bacterial proportion in SZY was significantly different from that of other stands, while no significant differences were observed between ZL and the other forest stands. In contrast, ZKQ consistently exhibited significantly lower bacterial proportions in most months, indicating that this forest stand had relatively fewer airborne bacterial microorganisms.

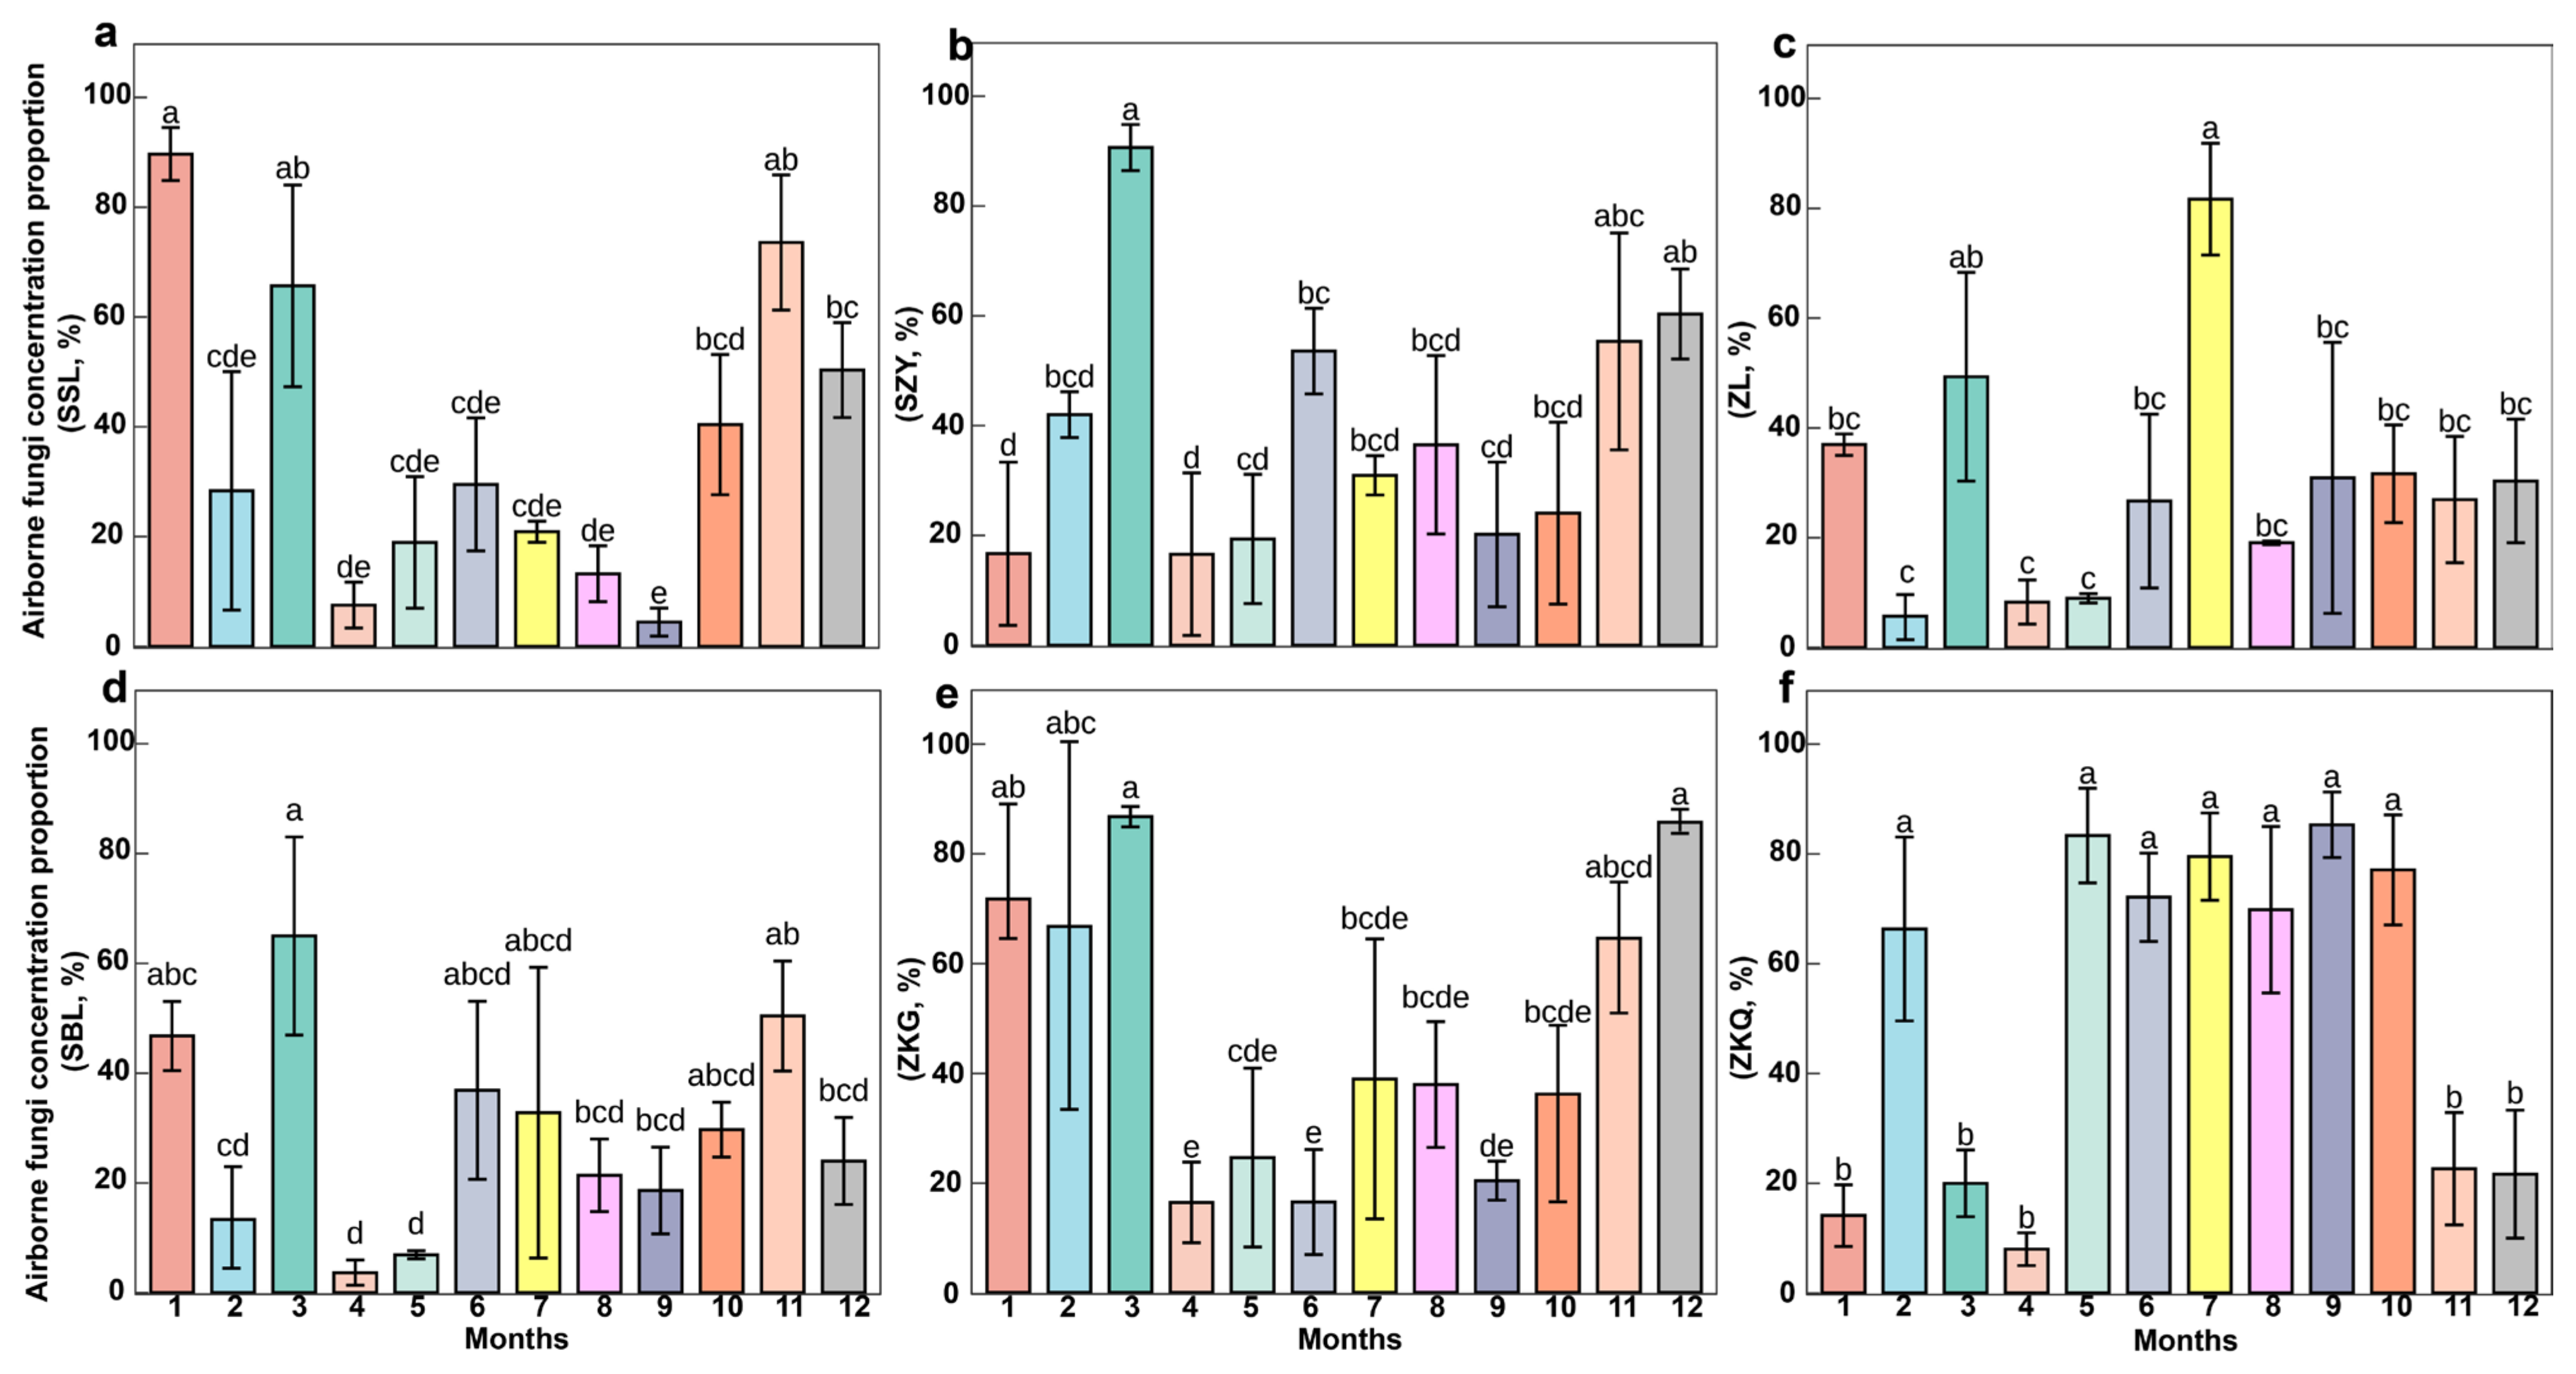
3.2. Proportion of Fungi in Airborne Microorganisms Across Different Forest Stands

This study analyzed the fungal proportions among airborne microorganisms in six Zhuyu Bay Scenic Area forest stands. The results demonstrated distinct seasonal variations (Figure 2). In SSL, fungal proportions fluctuated significantly throughout the year, peaking in January and November, but remaining lower from April to September. In SZY, fungal proportions were highest in March, with another peak in December, while January and April exhibited lower values. In ZL, fungal proportions were significantly higher in July, with lower and more stable proportions being seen in other months. In SBL, fungal proportions peaked in January and March but remained relatively low and stable for the rest of the year. In ZKG, fungal proportions were most prominent in March and December, with minor fluctuations in other months. In ZKQ, fungal proportions remained relatively high from May to October, with significant differences from other months. A comparative analysis showed that SSL exhibited the most significant variations in fungal proportions. SZY, ZKG, and ZKQ demonstrated distinct outbreaks and periodic characteristics. Meanwhile, ZL maintained relatively stable fungal proportions throughout the year because it was less affected.

3.3. Total Concentration of Airborne Microorganisms Across Different Forest Stands

The total concentration of airborne microorganisms varied significantly across forest stands throughout the year, displaying distinct seasonal patterns (Figure 3). In SSL, airborne microbial concentrations ranged from 47 CFU/m3 to 3557 CFU/m3, with significant differences being seen between the highest and the lowest values. In SZY, microbial concentrations were higher in April, June, and August, showing intermittent peak growth patterns. In ZL, microbial concentrations were significantly higher in June than in other months, with lower and more stable concentrations throughout the rest of the year. In SBL, microbial concentrations remained relatively steady with mild fluctuations. In ZKG, microbial concentrations fluctuated throughout the year but remained generally low. In ZKQ, microbial concentrations fluctuated greatly, reaching the highest level in June, while concentrations in February and December were relatively lower.

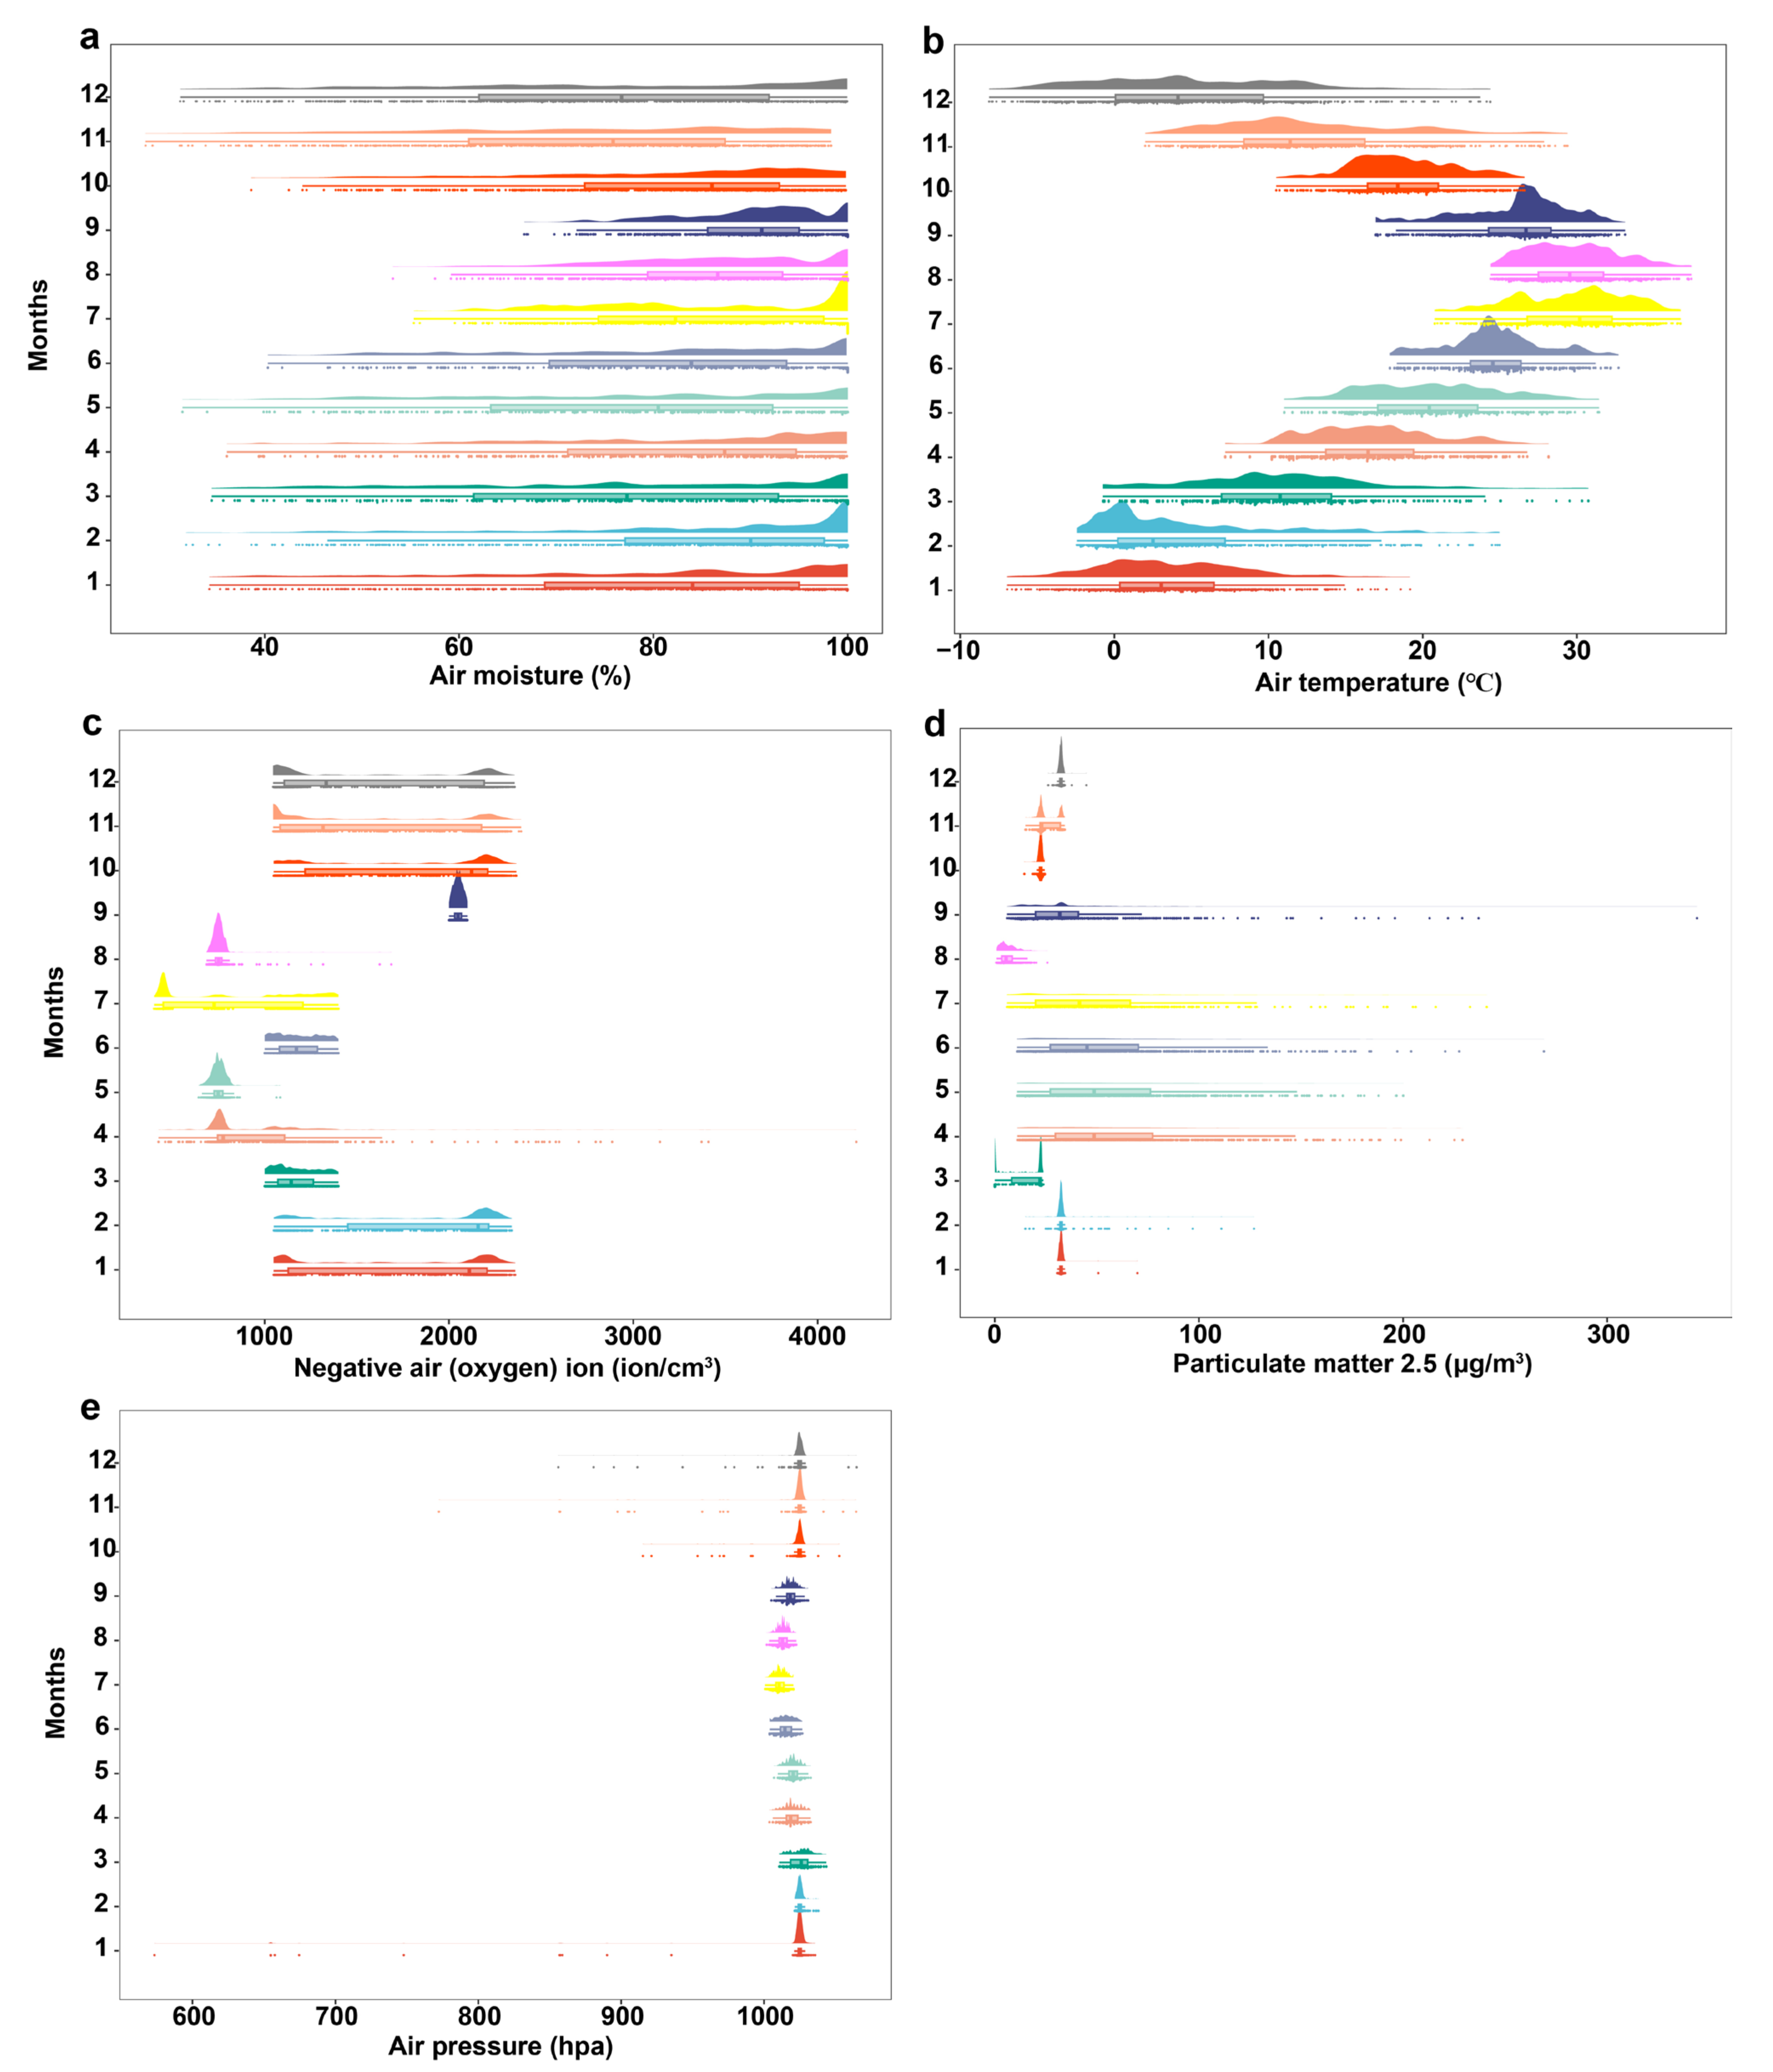
3.4. Changes in Air Factors

Several trends were observed by monitoring AM, AT, NAIs, PM2.5, and AP. AM tends to reach 90% or higher in summer, while, in winter, it typically remains around 50% and can drop even lower in some cases (Figure 4a). AT is generally high in summer, often exceeding 25 °C, but drops significantly in winter, usually approaching 0 °C (Figure 4b). NAIs exhibit relatively high peaks in April–May and September–October while remaining lower during other months (Figure 4c). The concentration of PM2.5 shows an increasing trend in winter but remains lower in summer (Figure 4d). AP remains relatively stable throughout the year, although higher values are recorded in January and lower values are observed in July–August (Figure 4e).

3.5. Correlation Analysis

A correlation analysis examined the relationships among the eight air factors (PM2.5, NAIs, AP, AM, AT, TC, FP, and BP) (Figure 5). The results revealed varying degrees of positive correlation among these factors. The total microbial concentration (TC) was significantly positively correlated with NAIs at the 0.05 significance level, with a correlation coefficient of 0.319, suggesting a moderate co-variation trend. The total bacterial concentration (BP) showed a significant positive correlation with PM2.5 at the 0.01 significance level, with a correlation coefficient of 0.460. Additionally, BP exhibited a strong positive correlation with AP at the 0.01 significance level, with a coefficient of 0.479, indicating a close relationship between bacterial concentration, PM2.5, and AP. The FP positively correlated with PM2.5 at the 0.01 significance level, with a correlation coefficient of 0.457. However, FP demonstrated an even stronger correlation with AP at the 0.001 significance level, with a correlation coefficient of 0.722, highlighting a robust association between FP and AP.

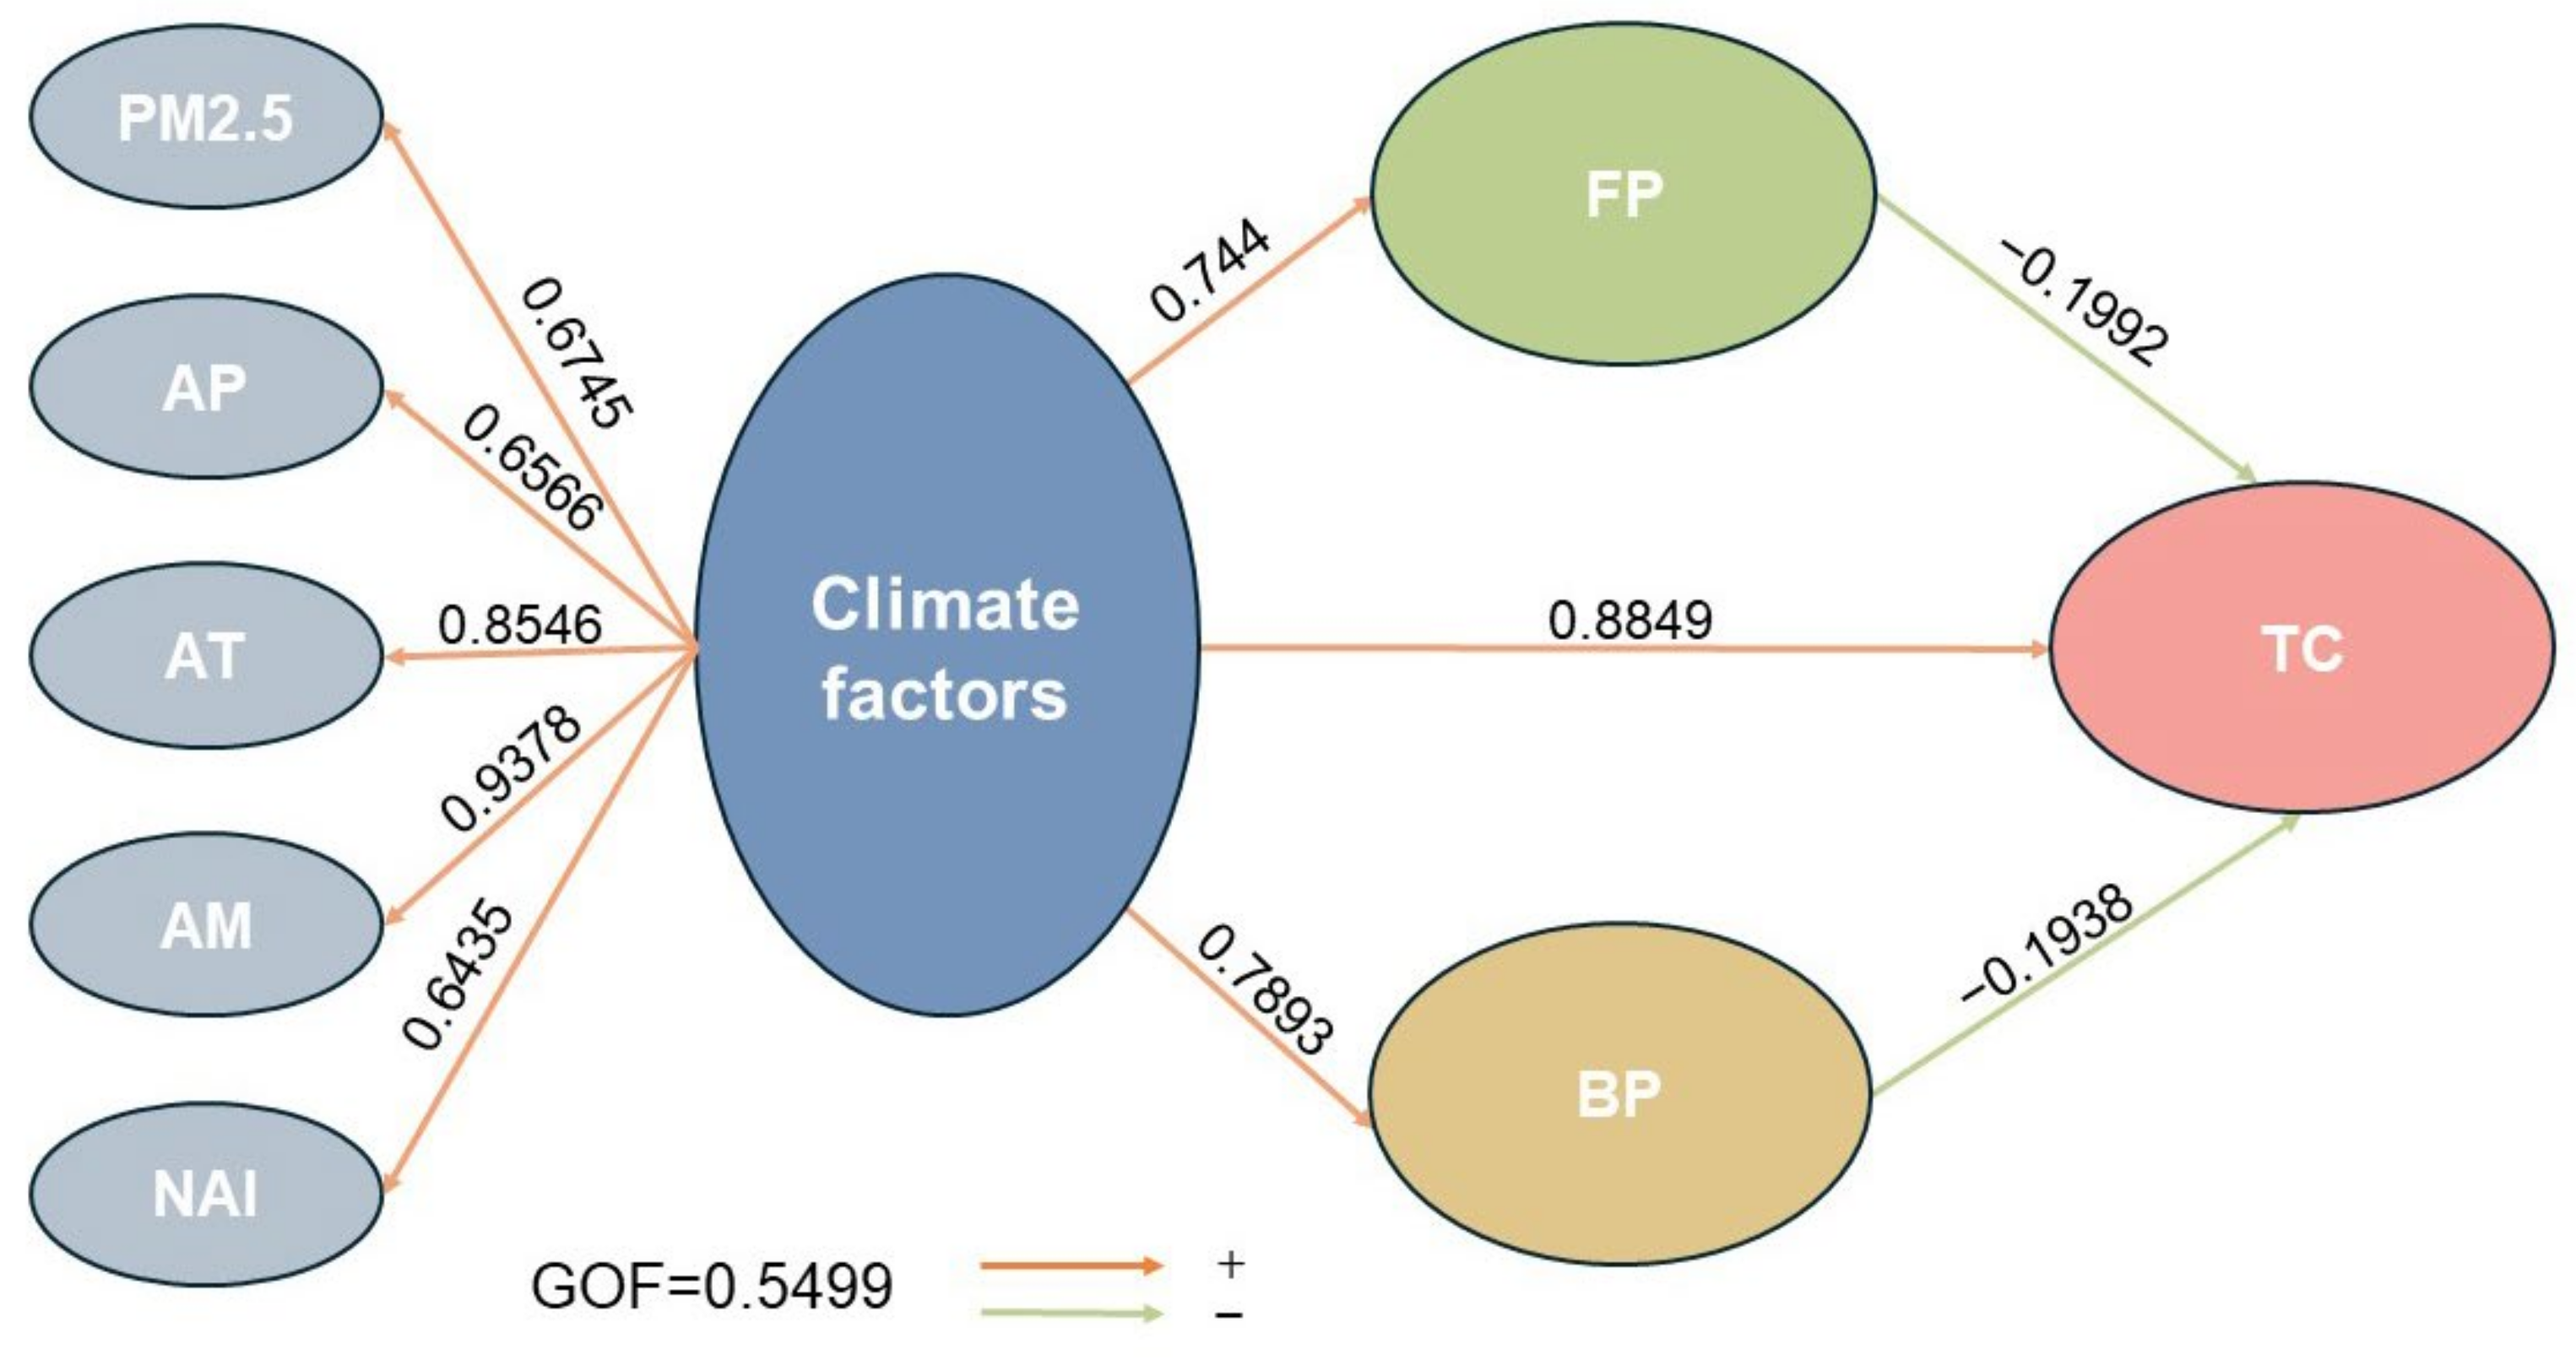
3.6. Relationships Between Air Factors, Bacterial Concentration, Fungal Concentration, and Total Microbial Concentration

Partial least squares path modeling (PLS-PM) was employed for analysis to investigate further the impact of air factors, FP, and BP on cultivable airborne microorganisms (Figure 6). The findings indicated that PM2.5, AP, AT, AM, and NAIs were significantly associated with climatic factors. Among them, AM had the strongest association, suggesting it plays a key role in influencing climatic conditions. Climatic factors significantly positively impact the TC with a path coefficient of 0.8849, reinforcing their importance in microbial regulation. Similarly, climatic factors strongly influenced FP and BP, emphasizing their role in determining microbial concentrations.

4. Discussion

This study examines the concentration characteristics and variations in cultivable airborne microorganisms across different forest stand types and the correlation between climatic factors and airborne microorganisms. Regarding the proportions of fungal and bacterial counts, the ZKG forest stand exhibits a higher proportion of bacterial counts and a lower proportion of fungal counts in summer. In contrast, the opposite trends can be observed in winter. In contrast, the ZKQ forest stand follows the opposite trends to the seasonal variation trends observed for the ZKG forest stand. This seasonal dynamic suggests that the ZKG and ZKQ forest stands are better adapted to fluctuations in urban climatic conditions [22], thereby maintaining a relatively stable microbial community structure throughout different seasons. Moreover, seasonal variations in climatic factors significantly influence microbial concentrations and air quality. Research has shown that mixed forests, comprising broad-leaved and coniferous trees, possess strong antibacterial properties and are optimal for improving air quality and public health [30]. The seasonal dynamic changes observed in the ZKG and ZKQ forest stands may be closely associated with the antibacterial properties of their mixed forest compositions. This characteristic helps regulate the concentration of airborne microorganisms and enhances ecosystem services for the urban environment. While ZKG and ZKQ are promising tree species for urban forestry, planning and construction must consider various factors, including urban functional zoning, spatial layout, and microclimatic characteristics [31]. Studies indicate that urban forest-based rehabilitation programs can significantly improve the well-being of older adults, ultimately enhancing them to relieve stress and depression, thereby improving their quality of life [32].
In this study, TC across six forest stands exhibited dynamic fluctuations throughout the year, with bacterial and fungal concentrations varying monthly. These findings indicate that forest ecosystems play a crucial regulatory role in microbial concentration distribution and in the dynamic changes in microbial communities, suggesting significant heterogeneity in the microenvironment created by different forest stands. Additionally, due to its adaptability to varying climatic conditions and unique metabolic characteristics, microbial diversity plays a key role in mitigating the adverse effects of climate change. Microorganisms and their biological components may help counteract these impacts by providing adaptive responses [33]. Furthermore, certain microbial strains contribute to forest growth and resilience [34].
Microorganisms have great potential but face numerous challenges in addressing global climate change. Justin V. Remais noted that, in the context of global warming and other climatic changes, the replication, aging, and dissemination rates of airborne pathogens will fluctuate, with pathogenic bacteria, protozoa, viruses, and fungi exhibiting significant variation in their responses to these changes [35]. Forests play crucial role in climate regulation [36], and their future largely depends on the performance and balance of mycorrhizal fungi, saprophytic fungi, bacteria, and fungal plant pathogens [10]. In this study, we observed dynamic waxing and waning fluctuations in the relative abundance of bacteria and fungi across certain forest stands. For example, bacterial concentrations were lower in the SSL, while fungal concentrations were relatively higher in January. However, in February, bacterial concentrations increased while fungal concentrations decreased. This suggests that, even within the same location, the composition of airborne microorganisms undergoes significant seasonal variations [37]. These fluctuations may be closely related to climatic factors and microbial interactions [38]. This conclusion is further supported by the PLS-PM structural equation model, which demonstrates that climatic factors directly influence bacterial and fungal concentrations.
Our findings indicate that climatic factors variables significantly impact airborne microorganism concentrations, with multiple factors collectively affecting different types of microorganisms. Climatic factors govern the production, release, dispersion, and deposition of microorganisms and influence the diversity and abundance of biological particles in the air [39]. Research has shown that regardless of geographical location or predominant climatic conditions, air temperature and AM are key parameters influencing the concentration of dry spores in the atmosphere [40]. This finding aligns with the results of our study. Specifically, AM (0.9378) and AT (0.8546) exhibit the strongest correlations with climatic factors, indirectly suggesting that AM plays a critical regulatory role in microorganisms. However, while AT contributes, it is not the primary determinant of microbial concentration. Instead, microbial concentration is influenced by the combined effects of multiple factors, with AM exerting a more complex and potentially significant influence than temperature [41]. Additionally, urban characteristics such as topography, layout, and scale significantly impact the distribution of AM [42]. Beyond the key factors examined in this study, other environmental parameters, such as rainfall, influence airborne microbial concentrations. Rainfall helps cleanse the atmosphere by removing aerosol particles that serve as microbial carriers, theoretically reducing airborne microorganism levels. However, multiple studies have reported that rainfall can sometimes increase microbial concentrations in the air [43,44]. Therefore, conducting in-depth research on the dynamic variations in airborne microorganisms and their influencing factors is essential for understanding the ecological functions of urban forests, enhancing urban air quality, and optimizing urban planning.
This study focuses on urban forests as complex composite ecosystems, emphasizing two major microbial groups: bacteria and fungi. In-depth research successfully reveals the close relationship between airborne microorganisms and climatic factors, bridging the research gap between traditional forest ecology and microbiology. In terms of methodology, the study skillfully integrates classical microbial cultivation techniques with environmental factor monitoring. This approach optimizes the standardized sampling procedures for urban ecological microorganisms and fosters an organic intersection between microbial ecology and urban climatology. This interdisciplinary research provides a reliable climatic framework for assessing the “microbial regulation services” of urban forests. It offers a solid theoretical foundation for urban planners to optimize tree species configurations. Furthermore, it can potentially contribute to developing airborne microbial risk early warning systems based on meteorological forecasts. However, the current study has certain limitations. First, the relatively limited sample size and geographic coverage may affect the generalizability and representativeness of the findings. Second, constraints in the selection of climatic factors and microbial data collection may not fully capture the complex relationship between airborne microorganisms and climatic variables. Additionally, the practical applications of this research remain underexplored. Future research should focus on the following areas to address these challenges: first, integrating metagenomic techniques to analyze functional genes and gain a deeper understanding of microbial functions and mechanisms; second, expanding the range of forest stands and spatial gradients to enhance the diversity and comprehensiveness of the study. These advancements will help overcome the current study’s limitations and contribute significantly to the research and development of urban forest ecosystems.

5. Conclusions

This study investigated the concentration characteristics of cultivable airborne microorganisms throughout the year in different forest stands. Among the six forest stands, the ZKG and ZKQ forest stands are dominant in terms of the proportion of microbial counts. Additionally, this study analyzed the relationship between air factors and microbial concentration, finding that air moisture (AM) is one of the key factors affecting microbial concentration. These findings provide an important foundation for future research on urban forest microorganisms and can serve as a reference for policymakers in developing sustainable and eco-friendly urban landscape plans. The results of this study are of great significance to the fields of ecosystem services, urban ecological planning, and urban climate improvement, and also provide a scientific basis for relevant policy decisions.

Author Contributions

Conception and design of the research: X.W., Y.Y. and W.X.; acquisition of data: S.Q.; analysis and interpretation of data: C.X. and L.L.; statistical analysis: S.Q.; drafting the manuscript: X.W.; revision of manuscript for important intellectual content: X.W., Y.Y. and W.X. All authors have read and agreed to the published version of the manuscript.

Funding

This study was funded by the Research on accounting standard and realization mechanism of forestry ecological products value in the Jiangsu Province (No. LYKJ [2024]02), the Forestry Science and Technology Innovation and Promotion Project of Jiangsu Province ‘Long-term Research Base of Forest and Wetland Positioning Monitoring in Jiangsu Province’ (No. LYKJ [2020]21).

Data Availability Statement

The raw data supporting the conclusions of this article will be made available by the authors on request.

Conflicts of Interest

The authors declare no conflicts of interest.

References

  1. Pearce, D.W. The Economic Value of Forest Ecosystems. Ecosyst. Health 2002, 7, 284–296. [Google Scholar] [CrossRef]
  2. Karjalainen, E.; Sarjala, T.; Raitio, H. Promoting human health through forests: Overview and major challenges. Environ. Health Prev. Med. 2009, 15, 1–8. [Google Scholar] [CrossRef] [PubMed]
  3. Weinbrenner, H.; Breithut, J.; Hebermehl, W.; Kaufmann, A.; Klinger, T.; Palm, T.; Wirth, K. “The Forest Has Become Our New Living Room”—The Critical Importance of Urban Forests During the COVID-19 Pandemic. Front. For. Glob. Change 2021, 4, 672909. [Google Scholar] [CrossRef]
  4. Kim, H.; Shoji, Y.; Mameno, K.; Kubo, T.; Aikoh, T. Changes in visits to green spaces due to the COVID-19 pandemic: Focusing on the proportion of repeat visitors and the distances between green spaces and visitors’ places of residences. Urban For. Urban Green. 2023, 80, 127828. [Google Scholar] [CrossRef]
  5. Lou, X.; Yang, Q.; Xie, J.; Fang, Z. Concentration characteristics of culturable airborne microbes in family homes in Hangzhou, China. Aerobiologia 2023, 39, 119–131. [Google Scholar] [CrossRef]
  6. Song, L.; Zhou, J.; Wang, C.; Meng, G.; Li, Y.; Jarin, M.; Wu, Z.; Xie, X. Airborne pathogenic microorganisms and air cleaning technology development: A review. J. Hazard. Mater. 2022, 424, 127429. [Google Scholar] [CrossRef]
  7. Kumar, P.; Kausar, M.A.; Singh, A.B.; Singh, R. Biological contaminants in the indoor air environment and their impacts on human health. Air Qual. Atmos. Health 2021, 14, 1723–1736. [Google Scholar] [CrossRef]
  8. Hisano, M.; Searle, E.B.; Chen, H.Y.H. Biodiversity as a solution to mitigate climate change impacts on the functioning of forest ecosystems. Biol. Rev. 2017, 93, 439–456. [Google Scholar] [CrossRef]
  9. Li, H.; Wu, Z.-F.; Yang, X.-R.; An, X.-L.; Ren, Y.; Su, J.-Q. Urban greenness and plant species are key factors in shaping air microbiomes and reducing airborne pathogens. Environ. Int. 2021, 153, 106539. [Google Scholar] [CrossRef]
  10. Baldrian, P.; López-Mondéjar, R.; Kohout, P. Forest microbiome and global change. Nat. Rev. Microbiol. 2023, 21, 487–501. [Google Scholar] [CrossRef]
  11. Forzieri, G.; Dakos, V.; McDowell, N.G.; Ramdane, A.; Cescatti, A. Emerging signals of declining forest resilience under climate change. Nature 2022, 608, 534–539. [Google Scholar] [CrossRef] [PubMed]
  12. Bowers, R.M.; McLetchie, S.; Knight, R.; Fierer, N. Spatial variability in airborne bacterial communities across land-use types and their relationship to the bacterial communities of potential source environments. ISME J. 2011, 5, 601–612. [Google Scholar] [CrossRef] [PubMed]
  13. Fröhlich-Nowoisky, J.; Kampf, C.J.; Weber, B.; Huffman, J.A.; Pöhlker, C.; Andreae, M.O.; Lang-Yona, N.; Burrows, S.M.; Gunthe, S.S.; Elbert, W. Bioaerosols in the Earth system: Climate, health, and ecosystem interactions. Atmos. Res. 2016, 182, 346–376. [Google Scholar] [CrossRef]
  14. Lighthart, B. The ecology of bacteria in the alfresco atmosphere. FEMS Microbiol. Ecol. 1997, 23, 263–274. [Google Scholar] [CrossRef]
  15. Gao, J.-F.; Fan, X.-Y.; Li, H.-Y.; Pan, K.-L. Airborne bacterial communities of PM2. 5 in Beijing-Tianjin-Hebei megalopolis, China as revealed by Illumina MiSeq sequencing: A case study. Aerosol Air Qual. Res. 2017, 17, 788–798. [Google Scholar] [CrossRef]
  16. Jiang, S.-Y.; Ma, A.; Ramachandran, S. Negative air ions and their effects on human health and air quality improvement. Int. J. Mol. Sci. 2018, 19, 2966. [Google Scholar] [CrossRef]
  17. Kolarž, P.; Ilić, A.Ž.; Janković, M.; Janićijević, A.; Trbovich, A. Estimating aerosol particle removal in indoor air by ion-enhanced deposition. J. Aerosol Sci. 2023, 173, 106199. [Google Scholar] [CrossRef]
  18. Santl-Temkiv, T.; Amato, P.; Gosewinkel, U.; Thyrhaug, R.; Charton, A.; Chicot, B.; Finster, K.; Bratbak, G.; Londahl, J. High-flow-rate impinger for the study of concentration, viability, metabolic activity, and ice-nucleation activity of airborne bacteria. Environ. Sci. Technol. 2017, 51, 11224–11234. [Google Scholar] [CrossRef]
  19. DasSarma, P.; DasSarma, S. Survival of microbes in Earth’s stratosphere. Curr. Opin. Microbiol. 2018, 43, 24–30. [Google Scholar] [CrossRef]
  20. Ibáñez, A.; Garrido-Chamorro, S.; Barreiro, C. Microorganisms and Climate Change: A Not so Invisible Effect. Microbiol. Res. 2023, 14, 918–947. [Google Scholar] [CrossRef]
  21. Šantl-Temkiv, T.; Amato, P.; Casamayor, E.O.; Lee, P.K.H.; Pointing, S.B. Microbial ecology of the atmosphere. FEMS Microbiol. Rev. 2022, 46, fuac009. [Google Scholar] [CrossRef] [PubMed]
  22. Núñez, A.; García, A.M.; Moreno, D.A.; Guantes, R. Seasonal changes dominate long-term variability of the urban air microbiome across space and time. Environ. Int. 2021, 150, 106423. [Google Scholar] [CrossRef] [PubMed]
  23. Uçar, Z.; Akay, A.E.; Bilici, E. Towards Green Smart Cities: Importance of Urban Forestry and Urban Vegetation. Int. Arch.Photogramm. Remote Sens. Spat. Inf. Sci. 2020, XLIV-4/W3-2020, 399–403. [Google Scholar] [CrossRef]
  24. McSpadden Gardener, B.B.; Weller, D.M. Changes in Populations of Rhizosphere Bacteria Associated with Take-All Disease of Wheat. Appl. Environ. Microbiol. 2001, 67, 4414–4425. [Google Scholar] [CrossRef]
  25. Zhang, Y.-J.; Li, S.; Gan, R.-Y.; Zhou, T.; Xu, D.-P.; Li, H.-B. Impacts of Gut Bacteria on Human Health and Diseases. Int. J. Mol. Sci. 2015, 16, 7493–7519. [Google Scholar] [CrossRef]
  26. Zhou, Y.; Shao, M.; Li, X. Temporal and Spatial Evolution, Prediction, and Driving-Factor Analysis of Net Primary Productivity of Vegetation at City Scale: A Case Study from Yangzhou City, China. Sustainability 2023, 15, 14518. [Google Scholar] [CrossRef]
  27. Wan, X.; Zhou, R.; Li, L.; Yang, C.; Lian, J.; Zhang, J.; Liu, S.; Xing, W.; Yuan, Y. Factors Influencing the Concentration of Negative Air Ions in Urban Forests of the Zhuyu Bay Scenic Area in Yangzhou, China. Atmosphere 2024, 15, 316. [Google Scholar] [CrossRef]
  28. Wan, X.; Zhou, R.; Yuan, Y.; Xing, W.; Liu, S. Microbiota associated with urban forests. PeerJ 2024, 12, e16987. [Google Scholar] [CrossRef]
  29. Gu, Z. Complex heatmap visualization. iMeta 2022, 1, e43. [Google Scholar] [CrossRef]
  30. Liao, Z.-N.; Xu, H.-J.; Ma, J.; Li, M.; He, C.; Zhang, Q.; Xu, S. Seasonal and vegetational variations of culturable bacteria concentrations in air from urban forest parks: A case study in Hunan, China. Environ. Sci. Pollut. Res. 2022, 29, 28933–28945. [Google Scholar] [CrossRef]
  31. Godefroid, S.; Koedam, N. Distribution pattern of the flora in a peri-urban forest: An effect of the city–forest ecotone. Landsc. Urban Plan. 2003, 65, 169–185. [Google Scholar] [CrossRef]
  32. Han, I.D.; Koo, C.-D. The Effect of Forest Healing Program on the Resilience of Elderly People in Urban Forest. J. People Plants Environ. 2018, 21, 293–303. [Google Scholar] [CrossRef]
  33. Elshafei, A.M. General Overview of Climate Change and Global Warming: Their Effect on Microorganisms. Int. J. Environ. Clim. Change 2022, 12, 1378–1387. [Google Scholar] [CrossRef]
  34. Valiullin, L.R.; Mukhammadiev, R.S.; Egorov, V.; Mukhammadiev, R.S.; Yarullin, A.I.; Sakhnov, V.V.; Singh, R.K.; Sushkova, S.N.; Kozmenko, S.V.; Minkina, T.M. Microorganism Isolates Stimulate Forest Crop Growth and Protection. Preprints 2023, preprint. [Google Scholar]
  35. Hutchins, D.A.; Jansson, J.K.; Remais, J.V.; Rich, V.I.; Singh, B.K.; Trivedi, P. Climate change microbiology—Problems and perspectives. Nat. Rev. Microbiol. 2019, 17, 391–396. [Google Scholar] [CrossRef]
  36. Canadell, J.G.; Raupach, M.R. Managing Forests for Climate Change Mitigation. Science 2008, 320, 1456–1457. [Google Scholar] [CrossRef]
  37. Calderón-Ezquerro, M.d.C.; Serrano-Silva, N.; Brunner-Mendoza, C. Aerobiological study of bacterial and fungal community composition in the atmosphere of Mexico City throughout an annual cycle. Environ. Pollut. 2021, 278, 1165858. [Google Scholar] [CrossRef]
  38. Els, N.; Greilinger, M.; Reisecker, M.; Tignat-Perrier, R.; Baumann-Stanzer, K.; Kasper-Giebl, A.; Sattler, B.; Larose, C. Comparison of Bacterial and Fungal Composition and Their Chemical Interaction in Free Tropospheric Air and Snow Over an Entire Winter Season at Mount Sonnblick, Austria. Front. Microbiol. 2020, 11, 980. [Google Scholar] [CrossRef]
  39. Zhai, Y.; Li, X.; Wang, T.; Wang, B.; Li, C.; Zeng, G. A review on airborne microorganisms in particulate matters: Composition, characteristics and influence factors. Environ. Int. 2018, 113, 74–90. [Google Scholar] [CrossRef]
  40. Pyrri, I.; Kapsanaki-Gotsi, E. Functional relations of airborne fungi to meteorological and pollution factors in a Mediterranean urban environment. Fungal Ecol. 2017, 30, 48–54. [Google Scholar] [CrossRef]
  41. Zhang, G.; Liu, S.; Li, Y.; Zhou, Z.; Cheng, Q.; Wang, Q. Microbial pollution assessment of storage environment for the ancient Buddhist relics in Tibetan Palace Museum. Aerobiologia 2023, 39, 275–283. [Google Scholar] [CrossRef]
  42. Huang, X.; Song, J. Urban moisture and dry islands: Spatiotemporal variation patterns and mechanisms of urban air humidity changes across the globe. Environ. Res. Lett. 2023, 18, 103003. [Google Scholar] [CrossRef]
  43. Joung, Y.S.; Ge, Z.; Buie, C.R. Bioaerosol generation by raindrops on soil. Nat. Commun. 2017, 8, 14668. [Google Scholar] [CrossRef] [PubMed]
  44. Joung, Y.S.; Buie, C.R. Aerosol generation by raindrop impact on soil. Nat. Commun. 2015, 6, 7083. [Google Scholar] [CrossRef]
Figure 1. Analysis of bacterial counts throughout the year in the six forest stands. (a) SSL; (b) SZY; (c) ZL; (d) SBL; (e) ZKG; (f) ZKQ. The letters a, b, c, d, e, and f indicate significant differences. Different letters denote significant differences, while the same letters indicate no significant differences (p < 0.05).
Forests 16 00378 g001
Figure 2. Analysis of fungal counts throughout the year in the six forest stands. (a) SSL; (b) SZY; (c) ZL; (d) SBL; (e) ZKG; (f) ZKQ. The letters a, b, c, d and e indicate significant differences. Different letters denote significant differences, while the same letters indicate no significant differences (p < 0.05).
Forests 16 00378 g002
Figure 3. Analysis of total microbial concentration (bacteria and fungi) throughout the year in six different forest stands. (a) SSL; (b) SZY; (c) ZL; (d) SBL; (e) ZKG; (f) ZKQ. The letters a, b, c and d indicate significant differences. Different letters denote significant differences, while the same letters indicate no significant differences (p < 0.05).
Forests 16 00378 g003
Figure 4. Cloud and rain charts of air factors. (a) Air moisture (AM); (b) air temperature (AT); (c) negative air ions (NAI); (d) particulate matter 2.5 (PM2.5); (e) air pressure (AP). Different colors in the figure represent different months.
Forests 16 00378 g004
Figure 5. Correlation matrix plot of air factors and microbial concentrations. Scatter plot: distribution of data points; fitted line: linear fit relationship between variables; shaded area: confidence interval of the fitted line; Corr: correlation coefficient. * indicates significance at the 0.05 level, ** indicates significance at the 0.01 level, *** indicates significance at the 0.001 level.
Forests 16 00378 g005
Figure 6. Partial least squares path modeling (PLS-PM) among five air factors, airborne microorganisms, and climatic factors. Orange arrows indicate positive correlations (+), green arrows indicate negative correlations (−), and the values labeled on the arrows are the correlation coefficients. GOF: Goodness of Fit.
Forests 16 00378 g006
Table 1. Types of environmental factor variables observed in this experiment.
FactorsAbbreviationMeasurement RangeModelBrandOrigin
Air moistureAM0%–99.9%PH-ATERH-165PuhouNanjing, China
Air temperatureAT−20 to 80 °CPH-ATERH-165PuhouNanjing, China
Negative air (oxygen) ionNAI0–500,000 ion/cm3AN-200AnionChongqing, China
Particulate matter 2.5PM2.50–999 μg/m3PH-PM-999PuhouNanjing, China
Air pressureAP300–1100 hpaPH-APRE-101PuhouNanjing, China
Disclaimer/Publisher’s Note: The statements, opinions and data contained in all publications are solely those of the individual author(s) and contributor(s) and not of MDPI and/or the editor(s). MDPI and/or the editor(s) disclaim responsibility for any injury to people or property resulting from any ideas, methods, instructions or products referred to in the content.

