Article

Chromosome-Level Genome Assembly of Myricaria laxiflora and Identification of Candidate MylAP2/ERF Genes Involved in Flooding Stress

1
Yangtze River Biodiversity Research Centre, China Three Gorges Corporation, Wuhan 430010, China
2
Hubei Key Laboratory of Rare Resource Plants in Three Gorges Reservoir Area, Yichang 443134, China
3
National Engineering Research Center of Eco-Environment Protection for Yangtze River Economic Belt, China Three Gorges Corporation, Wuhan 430014, China
4
Beijing Key Laboratory of Growth and Developmental Regulation for Protected Vegetable Crops, College of Horticulture, China Agricultural University, Beijing 100193, China
5
College of Horticulture and Forestry, Huazhong Agricultural University, Wuhan 430070, China
6
Key Laboratory of Tree Breeding and Cultivation, National Forestry and Grassland Administration, Research Institute of Forestry, Chinese Academy of Forestry, Beijing 100091, China
*
Authors to whom correspondence should be addressed.
These authors contributed equally to this work.
Forests 2025, 16(2), 295; https://doi.org/10.3390/f16020295
Submission received: 3 January 2025 / Revised: 22 January 2025 / Accepted: 3 February 2025 / Published: 8 February 2025
(This article belongs to the Special Issue Abiotic and Biotic Stress Responses in Trees Species)

Abstract

:
M. laxiflora is an endangered plant that grows in the Yangtze River floodplain of China and often suffers from flooding stress. Due to the lack of a reference genome for M. laxiflora, the molecular regulatory mechanism of waterlogging stress in this plant remains unclear. In this study, we report a high-quality reference genome of M. laxiflora with a size of 1.29 Gb. A total of 23,666 gene-encoding proteins and 5457 ncRNAs were predicted in this reference genome. A comparative genome analysis revealed that 902 and 4299 gene families significantly expanded and contracted, respectively, in M. laxiflora. The expansions of the 902 gene families were significantly related to the “response to stress”, “response to abiotic stimulus”, and “response to oxygen-containing compounds” pathways. In the M. laxiflora genome, 101 MylAP2/ERF genes were identified and divided into five subgroups. Several MeJA-, ABA-, and hypoxia-responsive elements were found in the promoter regions of these MylAP2/ERF genes. According to the transcriptome data analysis, 74 MylAP2/ERF genes responded to flooding stress. Moreover, three genes (MylAP2/ERF49/78/91) that belong to the same branch as the RAP2.2 gene exhibited different expression trends under flooding stress. Our results provide valuable information on the molecular regulatory mechanism of flooding stress in M. laxiflora.

1. Introduction

M. laxiflora (Tamaricaceae, 2n = 24) is a perennial deciduous shrub belonging to the Tamaricaceae family [1,2]. It is a typical rare plant in the riparian zone and is mainly distributed in the middle and upper reaches of the Yangtze River in China [1]. M. laxiflora is a flood-tolerant plant that sleeps in summer and autumn, reproduces in winter and spring, and grows on gravel beaches in the Yangtze River water level rise and fall zone [3,4]. During the annual flood season of the Yangtze River, M. laxiflora hibernates underwater, and when it reaches the dry season, it begins to grow rapidly and reproduce [2]. The construction of the Three Gorges Dam (TGD) has seriously threatened the native habitat environment of M. laxiflora [5]. During the summer, when M. laxiflora plants are affected by floods, plant death is prevented by regulating the total soluble sugar, fructose, and starch contents in the body. M. laxiflora could be an ideal plant for studying the molecular mechanisms of plant flooding tolerance [6,7]. A number of researchers have investigated the effects of flooding stress on the physiological response of M. laxiflora [2,8,9]. However, little is known about the molecular mechanism underlying this plant’s waterlogging tolerance, partly due to the lack of a high-quality reference genome.
Significant progress has been made in understanding the molecular regulatory mechanisms of plants’ waterlogging tolerance [10,11,12]. Plants’ responses to waterlogging stress are sequentially completed through processes such as signal transduction, substance induction, metabolic adaptation, and morphological adaptation (the formation of aerated tissue, adventitious roots, etc.), including the induction of low-oxygen proteins, transcription factors, ethylene synthesis, and the production and clearance of reactive oxygen species (ROS) [13,14,15,16]. Some plant hormones, including ethylene, gibberellin, and auxin, have been proven to be involved in plants’ adaptation to flood stress [17]. Early signal (ethylene) production can be detected within a few hours after plants are subjected to waterlogging stress, indicating that ethylene plays an important role in regulating plants’ waterlogging tolerance [10,17]. Under waterlogging stress, the expression of ACS (ACC synthase), the gene encoding the ethylene synthesis precursor ACC (1-aminocyclopropane-1-carboxylate), is significantly increased [18,19,20,21]. In Arabidopsis, waterlogging stress induces the expression of AtACS5, AtACS7, and AtACS8 [20]. The expression of the OsACS5 gene in rice is also induced by waterlogging stress [19]. After being subjected to waterlogging stress, the ethylene precursor ACC, which is produced in the roots of plants, is transported to the stem through the xylem and then oxidized to ethylene, thereby mediating the plant’s waterlogging tolerance [21].
Transcription factors that are known to play important roles in the response to waterlogging stress include MYB, bZIP, bHLH, and ERF [22]. Among these transcription factors, the regulation of plant waterlogging tolerance mechanisms by ERF transcription factors has been extensively studied. The expression of the rice ERF transcription factors SK1 and SK2 is induced under waterlogging stress, activating the gibberellin (GA) pathway to promote internode elongation and growth in rice, thereby enabling the normal growth and development of rice under waterlogging stress [23]. The overexpression of the ERF transcription factor Sub1A in waterlogging-sensitive rice varieties can significantly enhance the waterlogging tolerance of transgenic lines [24,25]. The expression of TaERFVI.1 in wheat is also induced by waterlogging stress [26,27]. The overexpression of TaERFVI.1 can significantly improve the waterlogging tolerance of wheat and has no adverse effect on yield [27]. The ZmEREB180 transcription factor in maize enhances its waterlogging tolerance by promoting the growth of adventitious roots [28]. The overexpression of the ERF transcription factor RAP2.2 in Arabidopsis enables it to adapt to flooding stress [29]. Other ERF members, such as HRE1 and HRE2, have similar functions to those of RAP2.2 in Arabidopsis [30]. These findings demonstrate that ERF transcription factors play an important role in regulating plants’ flood tolerance response [31,32,33]. However, the role of ERF transcription factors in the flood tolerance of M. laxiflora remains unclear.
In this study, a high-quality chromosome-level reference genome was assembled for M. laxiflora. This reference genome has a genome size of 1.29 Gb, a heterozygosity rate of 0.65%, and a GC content of 35%. A total of 23,666 protein-coding genes were predicted, and 23,631 genes were found on the 12 assembled chromosomes, accounting for as much as 99.8%. In addition, a total of 101 MylAP2/ERF transcription factors were identified within the reference genome. There were 74 MylAP2/ERF genes whose expression significantly changed under flooding stress in M. laxiflora. Our results provide valuable information for future research on M. laxiflora.

2. Results

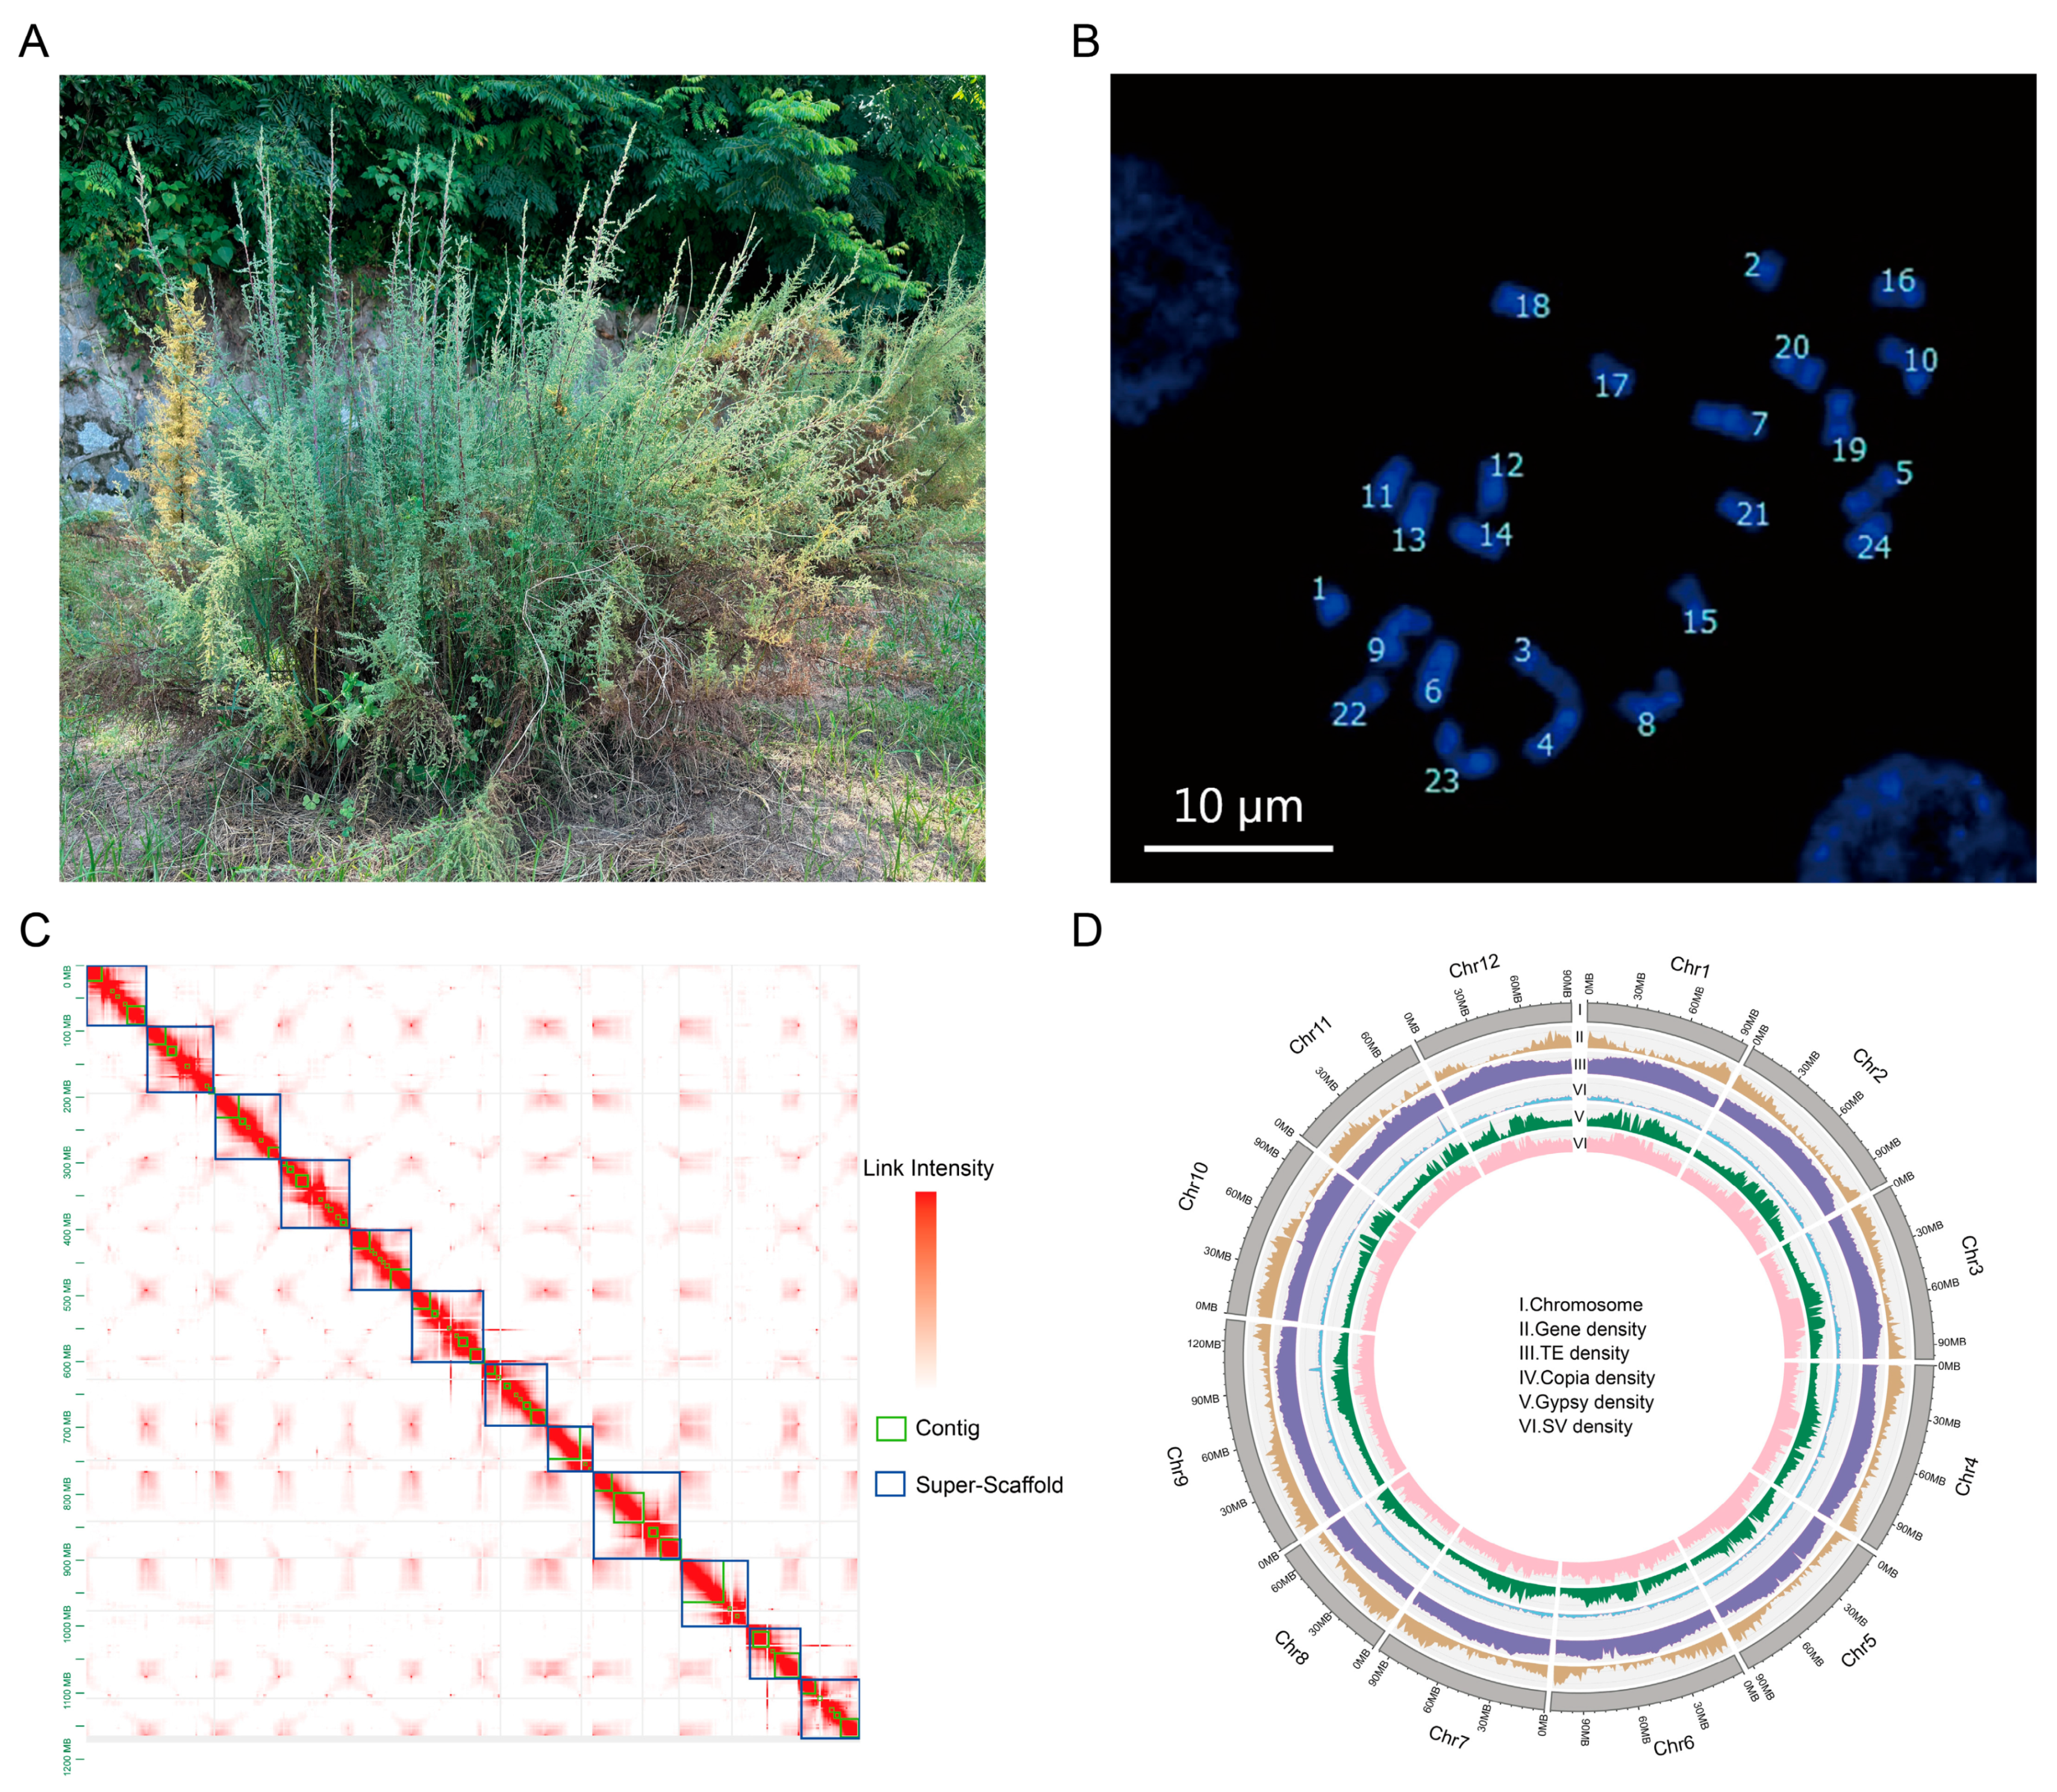
2.1. M. laxiflora Genome Survey, Sequencing, and Assembly

The variety (LS7) of M. laxiflora from the Yangtze River in China exhibits good tolerance to flood stress. To avoid sample contamination, one of the branches was cut to obtain asexual LS7 seedlings. The root tips, leaves, stems, flowers, fruits, and roots of the LS7 seedlings were collected for genome assembly (Figure 1A). To obtain a high-quality genome, we first evaluated its chromosome number and genome size. The results showed that M. laxiflora is diploid, with 24 chromosomes (Figure 1B). According to our K-mer (K = 17) analysis, the estimated genome size was 1.26 Gb, with a heterozygosity of 0.65% and a repeat sequence proportion of 69.89% (Figure S1). Following this, a total of 49.2 Gb (~44.7×) of HiFi data were generated, and the amount of data was sufficient to meet the requirements for genome assembly (Table S1). Moreover, a GC depth analysis was performed for the HiFi data, which showed a concentrated distribution of GC content, indicating that there was no contamination in the sequencing samples (Figure S2). The preliminary assembly of contigs using HiFi data revealed that the size of the contig was 1.32 Gb, the length of the N50 was 29.5 Mb, and the continuity of the contig was good. A total of 155 Gb of Hi-C data were obtained, with 77.4 Gb of effective Hi-C reads (~64×) (Table S1). The contigs were scaffolded at the chromosome level using Hi-C data. A total of 618 scaffolds on the 12 chromosomes were generated, and the size of the assembled M. laxiflora genome was 1.29 Gb. As shown in the Hi-C heatmap, there was an enrichment of intrachromosomal interactions without significant assembly errors (Figure 1C). To evaluate the genome integrity, a Benchmarking Universal Single-Copy Ortholog (BUSCO) analysis was conducted, and the results showed that the integrity of this genome was 93%, which suggested that the assembled M. laxiflora genome had good integrity (Table 1). These results indicated that we obtained a high-quality reference genome for M. laxiflora.

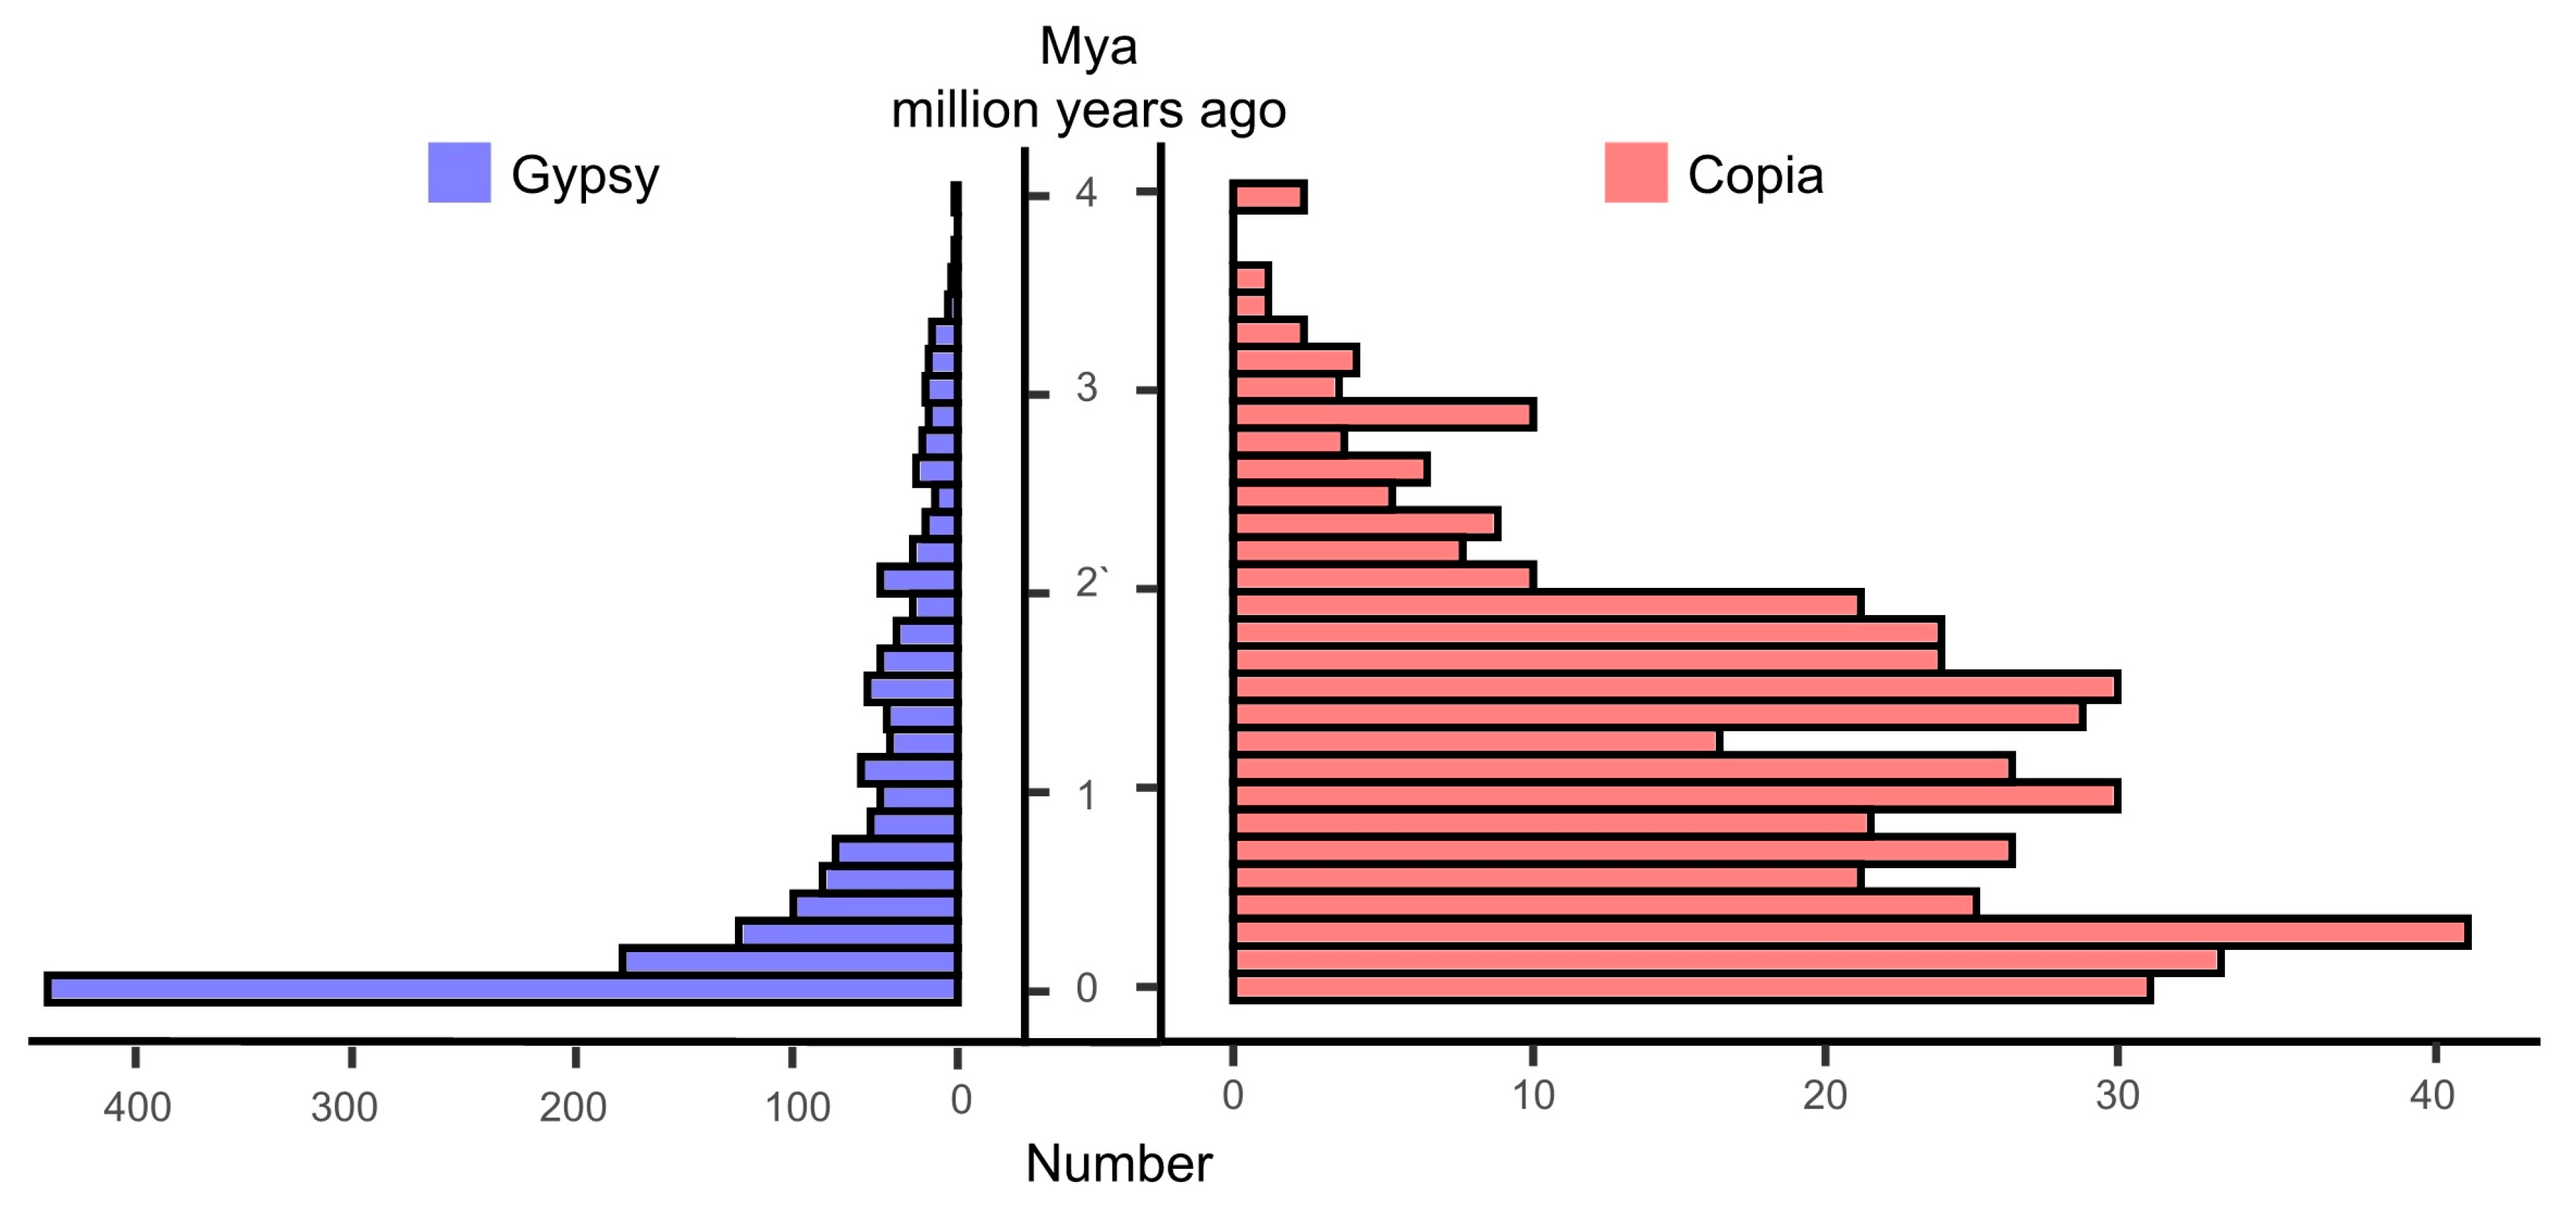
2.2. Genome Annotation

We used a range of methods to annotate the genome of M. laxiflora, including ab initio prediction, homology-based prediction, and RNA-seq-based prediction (Table 2). A total of 23,666 protein-coding genes were predicted, and 23,631 genes were found on the 12 assembled chromosomes, accounting for as much as 99.8% of the total genes (Figure 1D, Table S2). The average length of these genes was 6996.15 bp, and the average exon length was 378.23 bp. A total of 20,691 predicted genes (87.43%) were annotated from five public databases, namely, the NR, KOG, GO, KEGG, and TrEMBL databases (Table S3). Among all the annotated genes, 1270 were identified as transcription factors (TFs), accounting for 5.37% of all genes, including those in the bHLH (124), MYB (111), and AP2/ERF (101) families. In addition, we conducted a similarity search and annotation of noncoding RNA (ncRNA) genes, generating a total of 5457 ncRNA genes, including 94 microRNA (miRNA) genes, 566 transfer RNA (tRNA) genes, 2648 ribosomal RNA (rRNA) genes, 953 small nucleolar RNA (snoRNA) genes, and 214 small nuclear RNA (snRNA) genes.
A total of 996.66 Mb of repetitive sequences (77.16% of the total sequences) were identified by using comprehensive methods, including homology-based and de novo prediction (Table 3). Among these repetitive sequences, long terminal repeats (LTRs) were the most abundant, accounting for 28.04% of the total genome sequence. Most LTRs were Ty3-retrotransposons (21.76%) and Copia (4.50%) components. The amplification of Ty3-retrotransposons was a main driving factor in the genome evolution of M. laxiflora. In addition, we found that the complete LTR insertion in the genome of M. laxiflora has been a continuous process, with most insertions occurring over the past 4 million years (Figure 2). In addition, a total of 397,683 simple sequence repeats were identified, which will provide useful molecular markers for the molecular breeding of M. laxiflora.

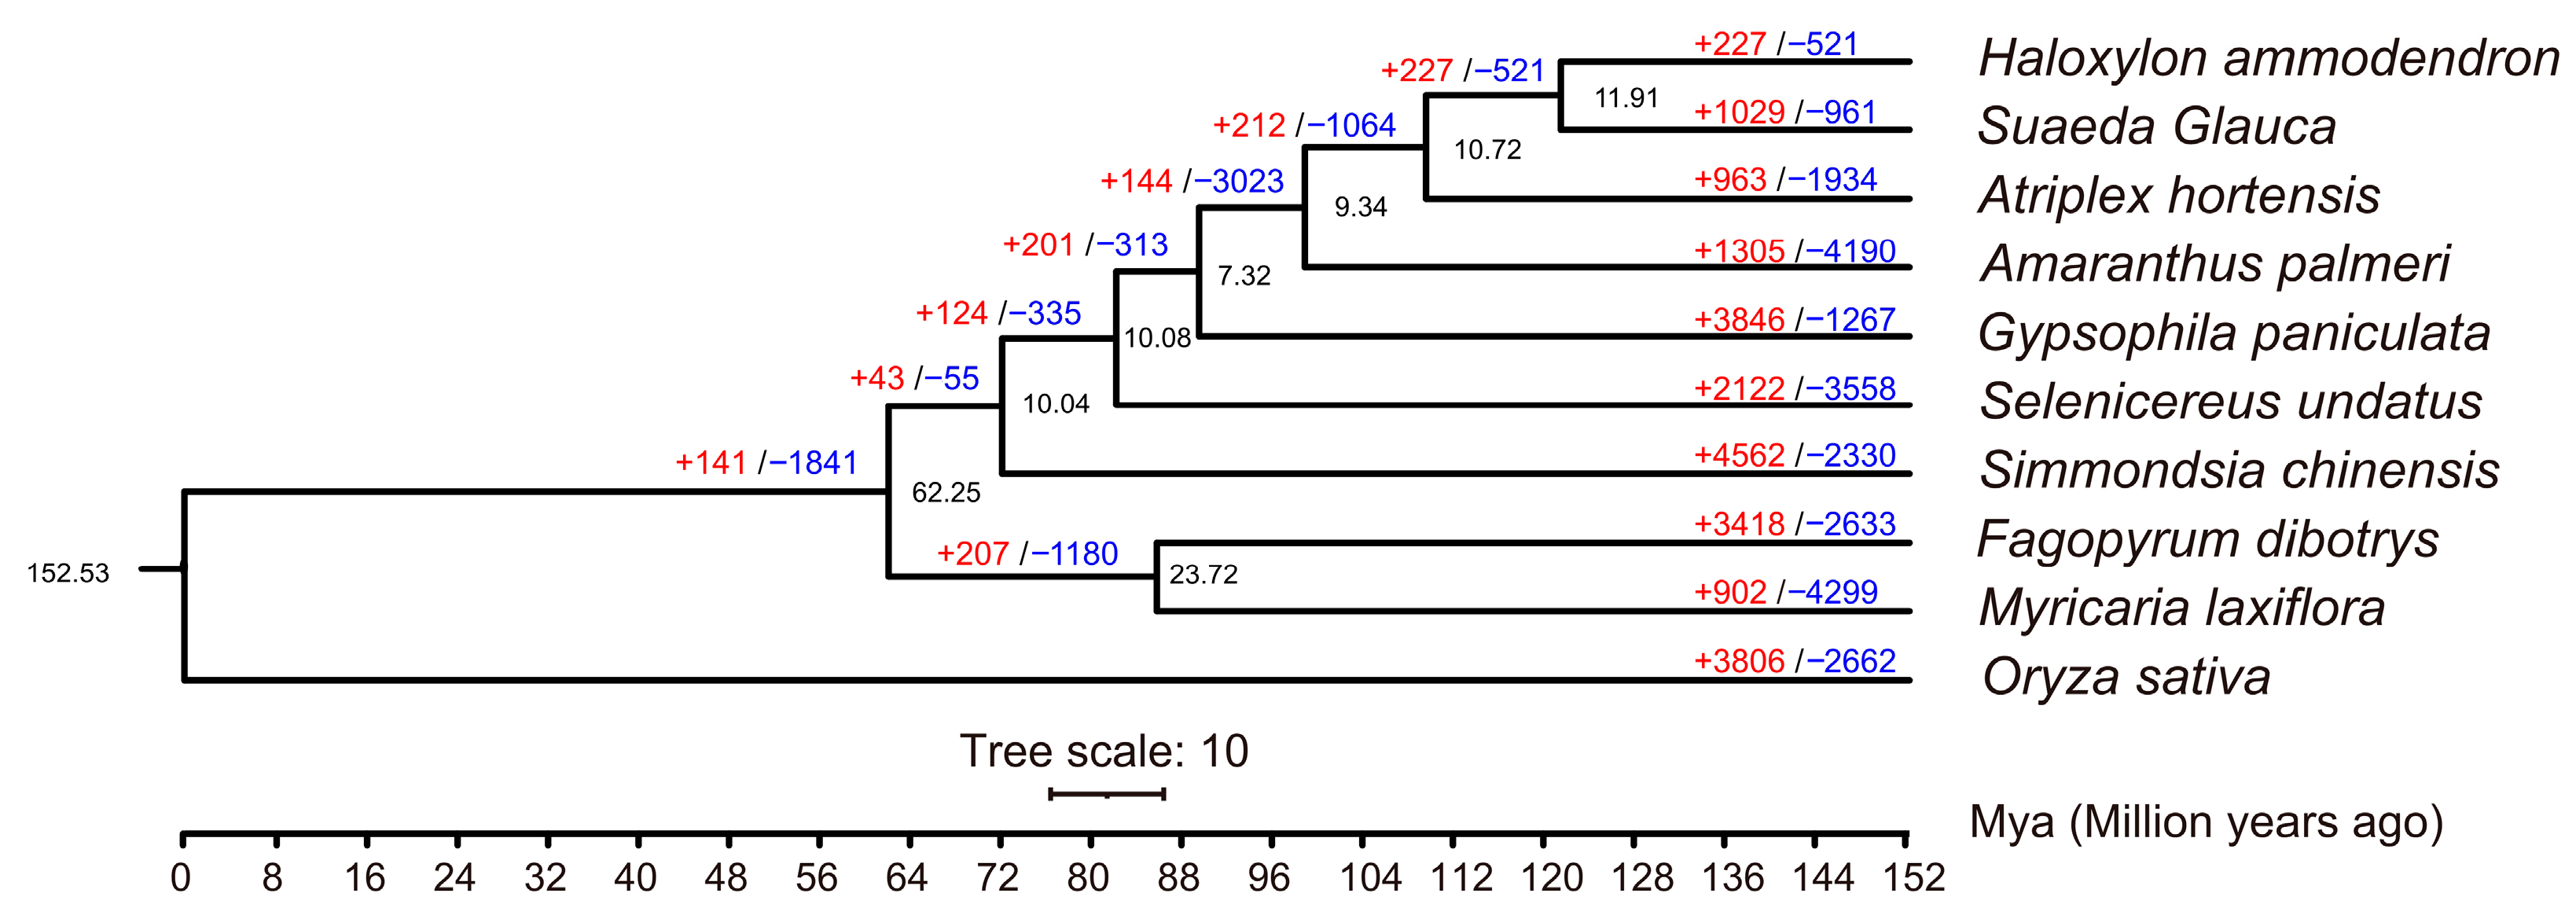
2.3. Analysis of the Expression and Contraction of Gene Families

In order to further understand which gene families in the M. laxiflora genome have changed significantly during evolution, we analyzed the contraction and expansion of gene families. Ten different species were selected (Table S4), including rice as the outgroup and other closely related species for M. laxiflora. Among the ten species, a total of 14,687 gene families were identified, of which 6242 were present in all species. In addition, 120 single-copy orthologous genes were identified in the ten species. A phylogenetic tree analysis revealed that M. laxiflora was most closely related to Fagopyrum dibotrys, and the two species diverged by approximately 87 Mya (Figure 3).
In addition, 902 and 4299 gene families were found to expand and contract significantly in the M. laxiflora genome. A GO analysis revealed that the expanded genes were mostly enriched in the “response to stress”, “response to abiotic stimulus”, and “response to oxygen-containing compounds” pathways (Figure S3 and Table S5). The contracted genes were mostly enriched in the “phosphate-containing compound metabolism”, “phosphorus metabolic process”, and “response to biotic stimulus” pathways (Figure S4 and Table S6).

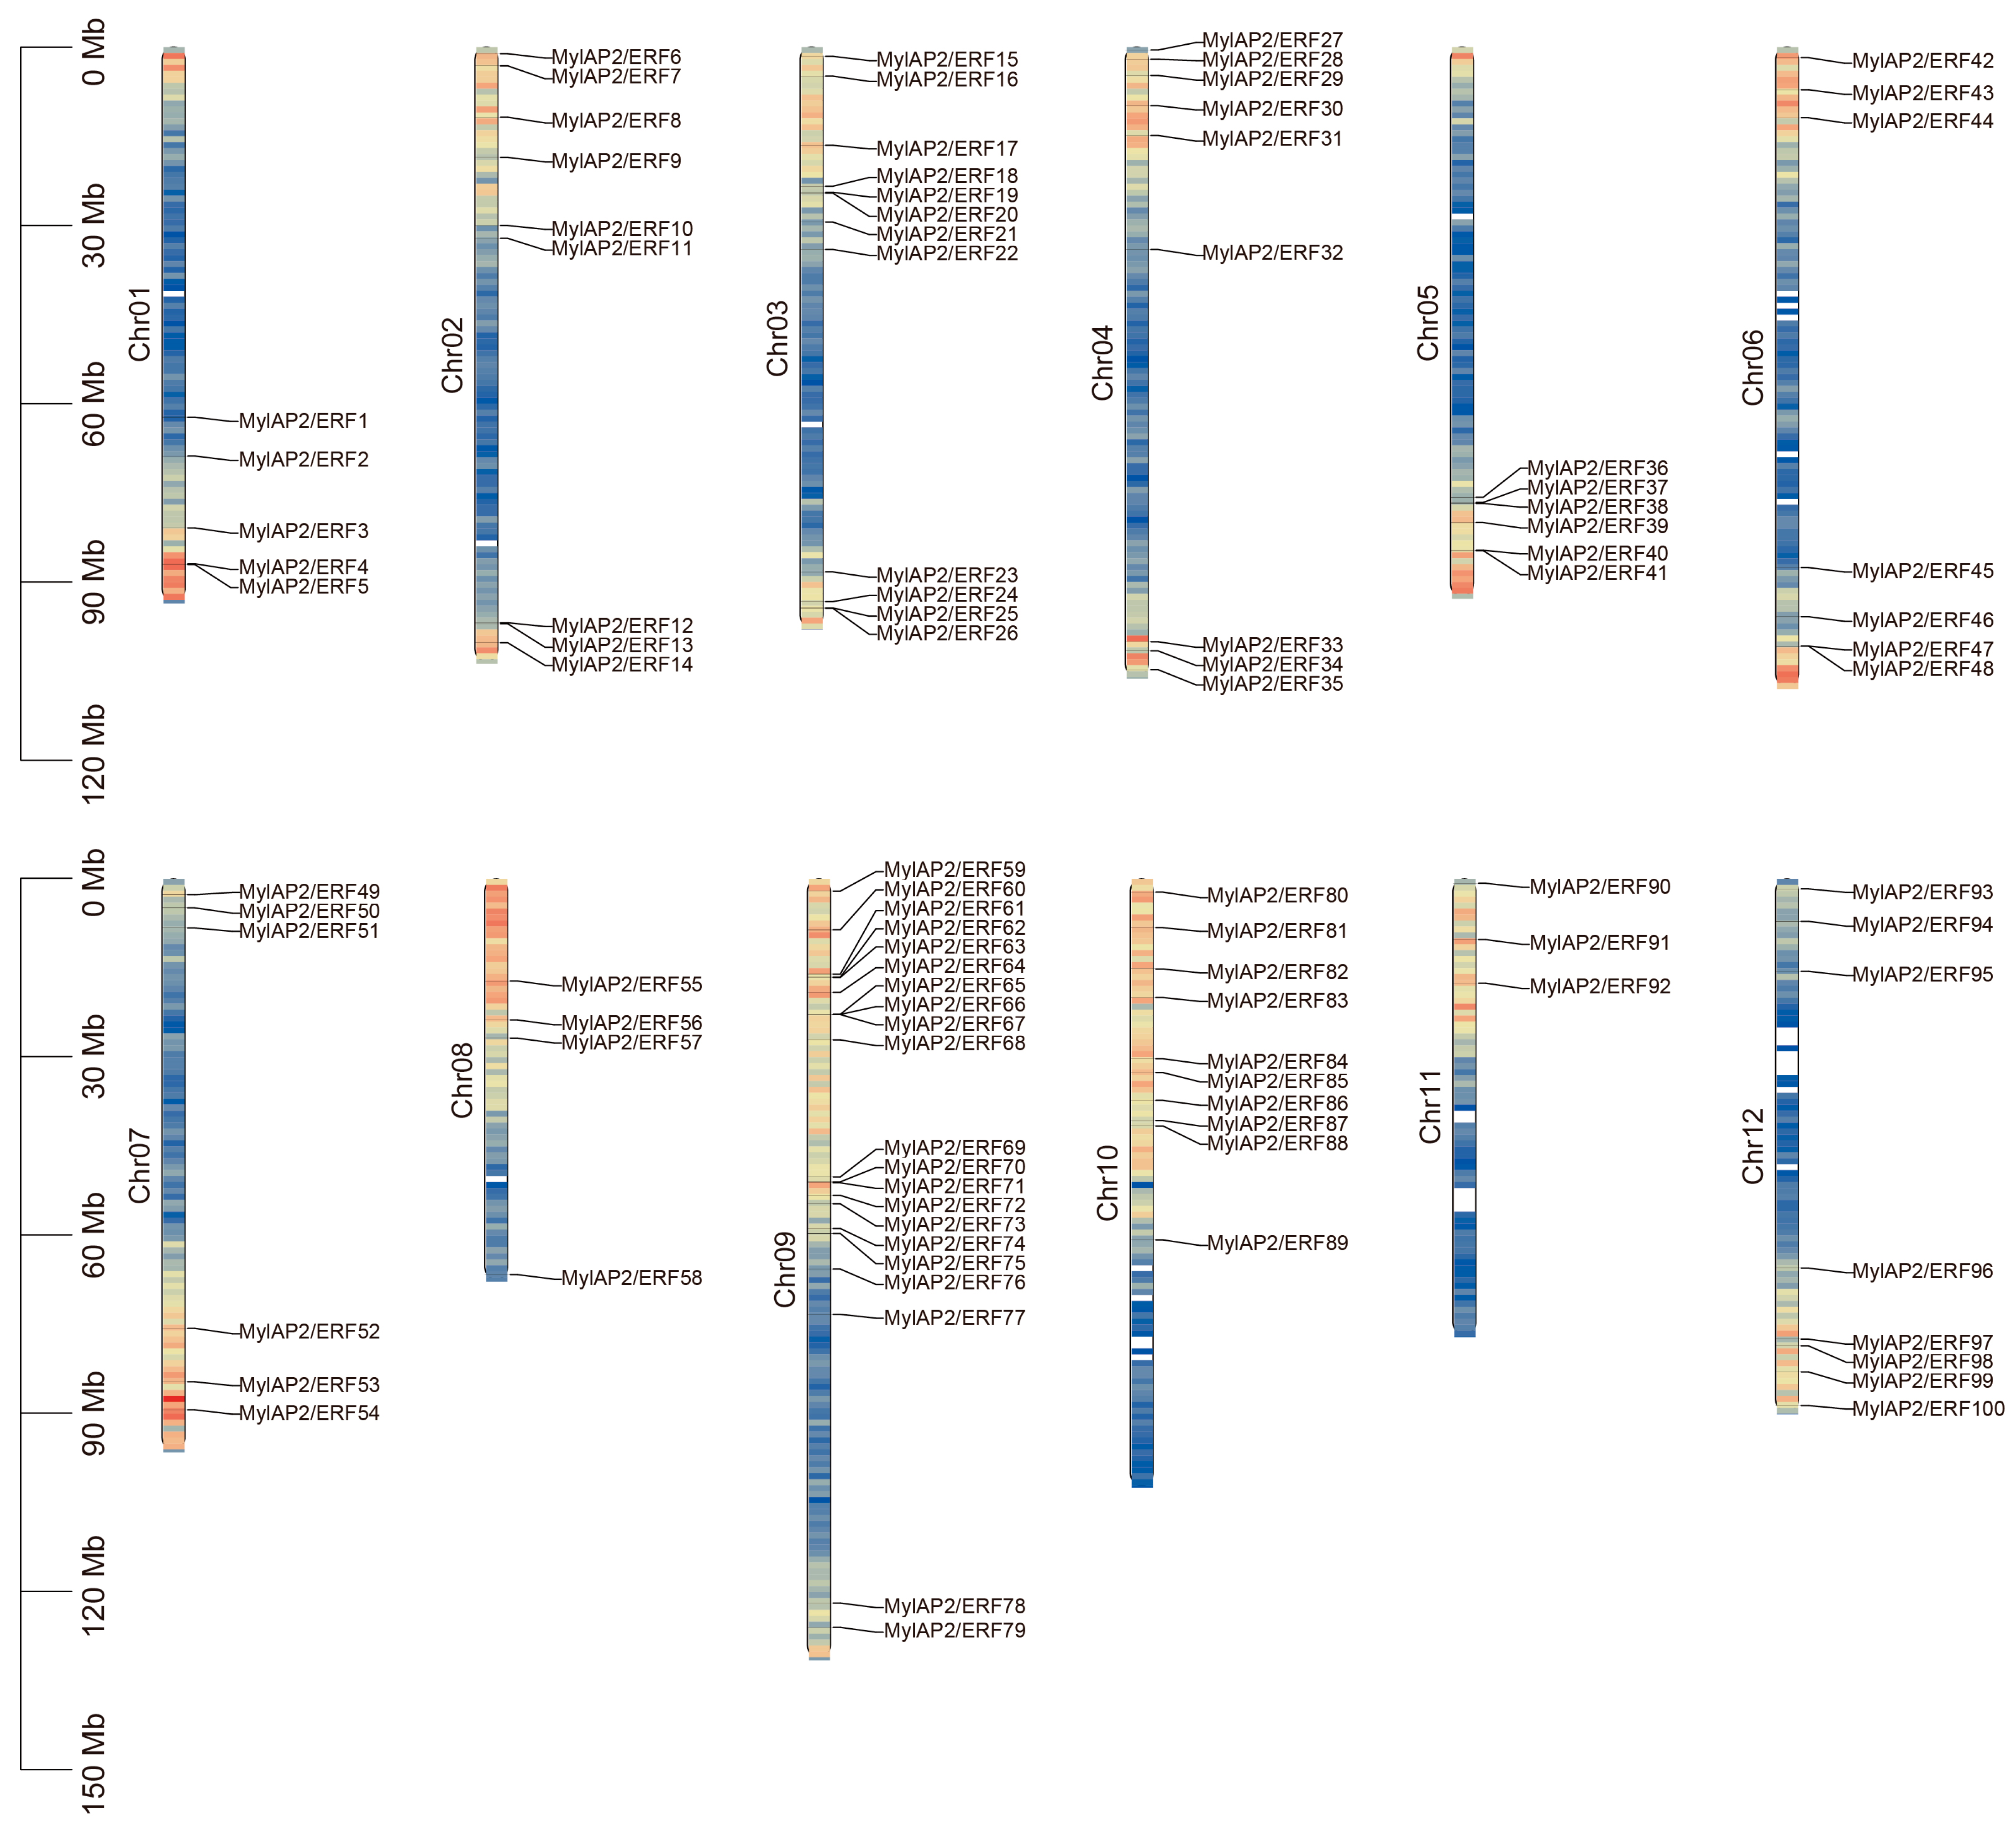
2.4. AP2/ERF Gene Families Identified in the M. laxiflora Genome

To further investigate the waterlogging tolerance of M. laxiflora, we identified and screened the AP2/ERF gene family in this reference genome using HMM and domain analysis. A total of 101 AP2/ERF genes were found in the M. laxiflora genome (Table S7). These 101 members were unevenly distributed on 12 chromosomes of the M. laxiflora genome (Figure 4). Among them, the MylAP2/ERF genes were the most distributed on chr 9, with a maximum of 21 members, while the MylAP2/ERF genes were the least distributed on chr 11, with only 3 members. These results suggest that on chromosome 9, the MylAP2/ERF gene undergoes the most gene duplication events. Subsequently, we renamed the AP2/ERF genes MylAP2/ERF1-MylAP2/ERF101 based on their chromosomal position. In addition, we found that only 100 MylAP2/ERF genes were on the chromosome, and 1 gene (MylAP2/ERF101) was not on the chromosome.

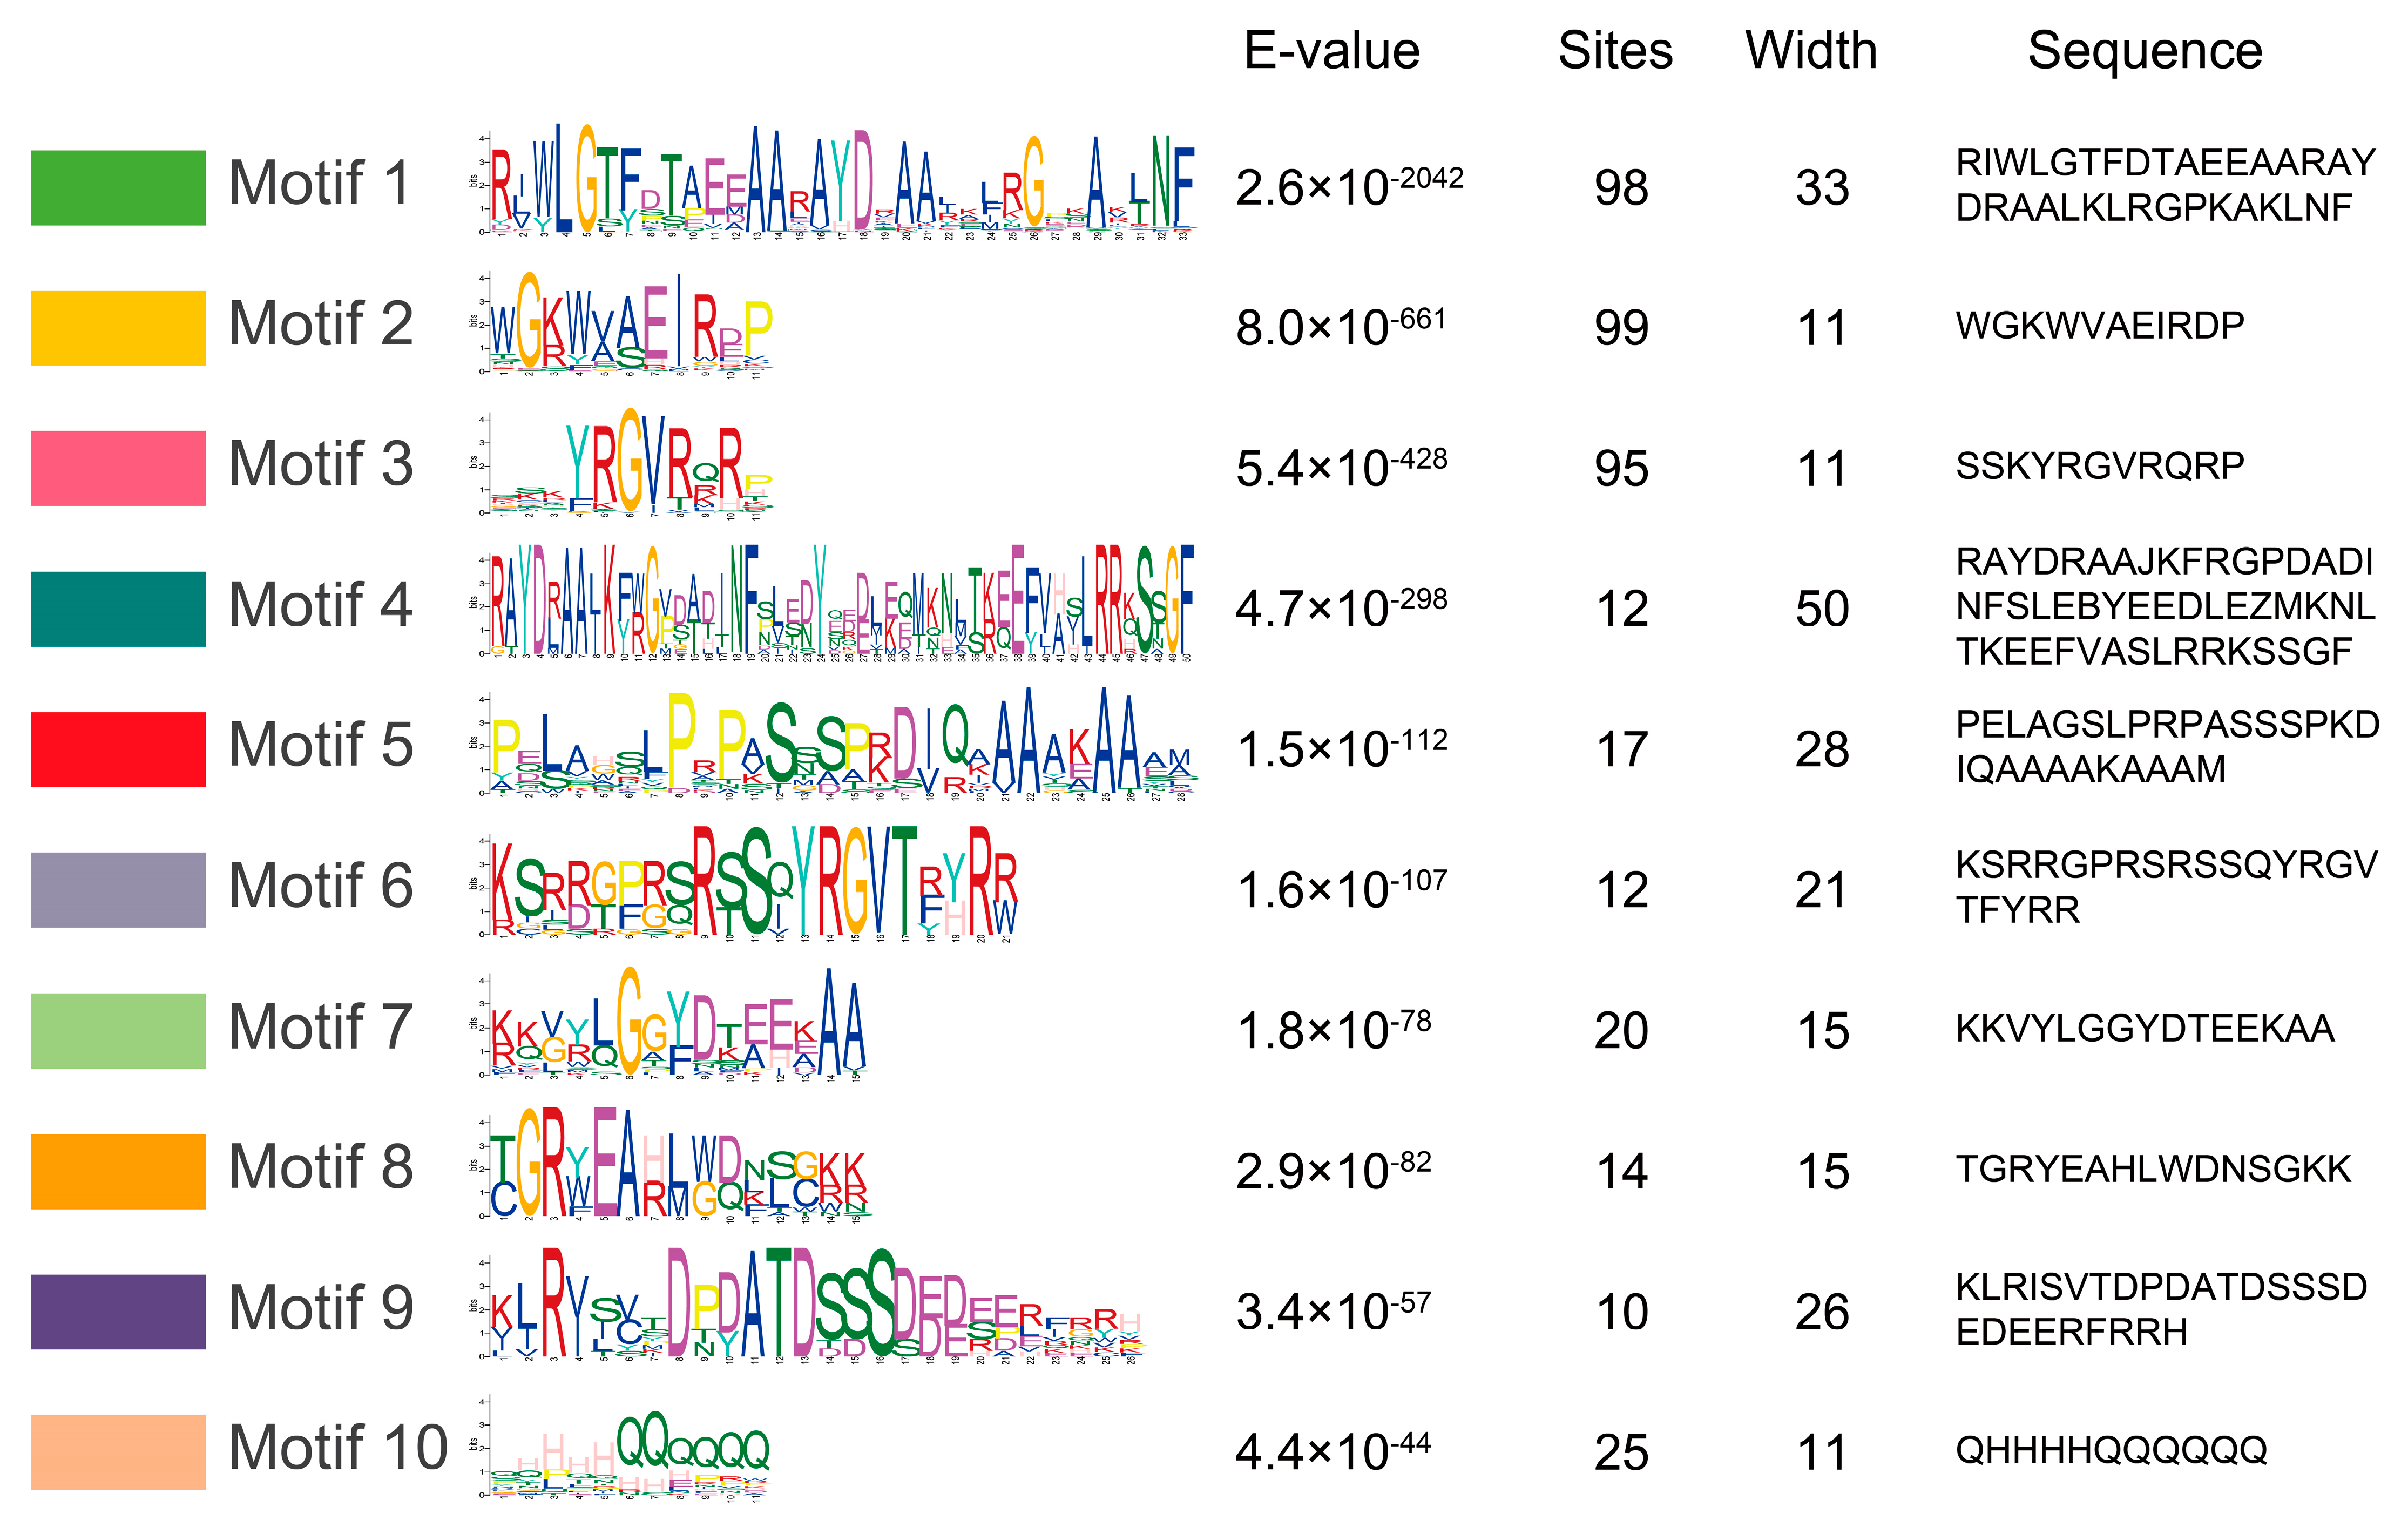
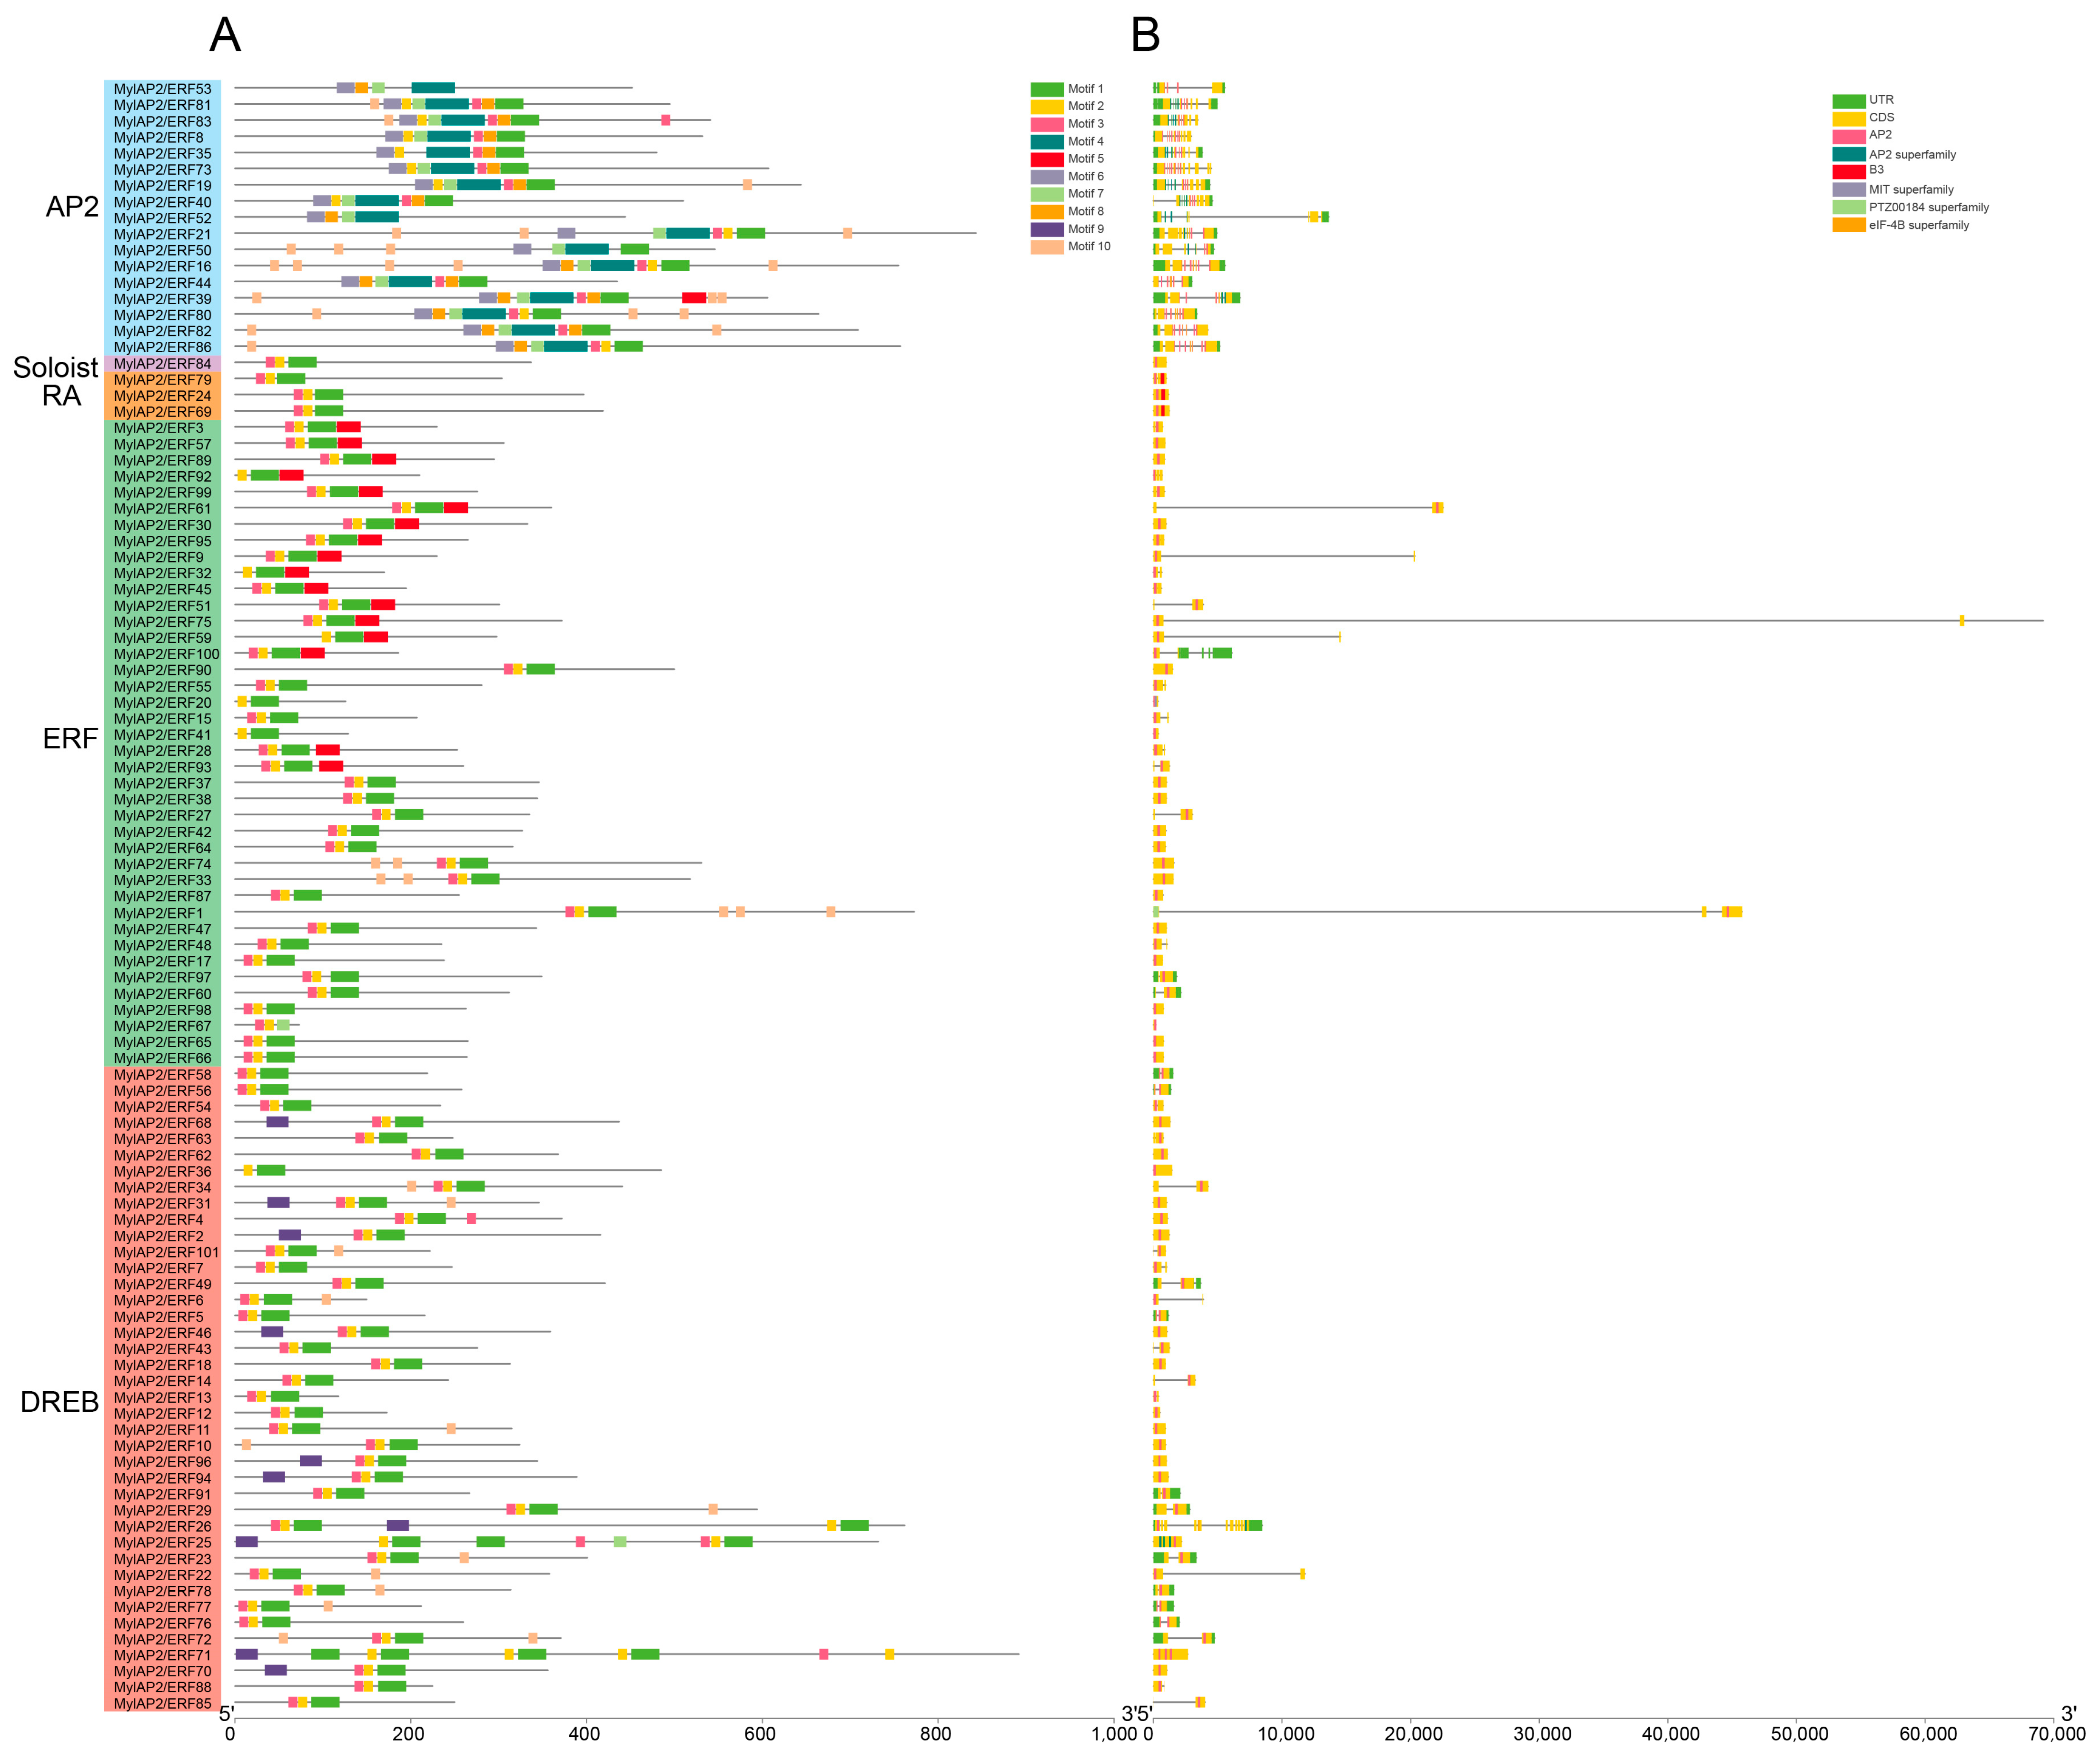
2.5. Phylogenetic and Motif Analyses of the MylAP2/ERFs

To elucidate the evolutionary relationship of the AP2/ERF gene family between M. laxiflora and Arabidopsis, which is a model plant, we constructed a phylogenetic tree using the MEGA 11 software with the NJ method, using the parameters of the Poisson model with the bootstrap repetition value set to 1000. The phylogenetic tree included 101 MylAP2/ERFs and 142 AtAP2/ERF members. A total of 243 AP2/ERF proteins were assigned to five subgroups, namely, the AP2 (APETALA2), Soloist (few unclassified factors), RAV (related to ABI3/VP1), ERF (ethylene response factor), and DREB (dehydration-responsive element-binding protein) subgroups (Figure 5). The ERF subgroup had the greatest number of members, with 104: 64 AtAP2/ERFs and 40 MylAP2/ERFs. The Soloist subgroup had the fewest members, with only two AP2/ERF members: one AtAP2/ERF and one MylAP2/ERF. The AP2 subgroup consisted of 17 AtAP2/ERFs and 17 MylAP2/ERFs, totaling 34 AP2/ERF members. The DREB subgroup consisted of 94 AP2/ERF members: 54 AtAP2/ERFs and 40 MylAP2/ERFs. The RAV subgroup consisted of six AtAP2/ERFs and three MylAP2/ERFs, amounting to a total of nine AP2/ERF members. RAP2.2 (AT3G14230), RAP2.12 (AT1G53910), RAP2.3 (AT3G16770), HRE1 (AT1G72360), and HRE2 (AT2G47520) have been shown to be important in plant flooding stress in Arabidopsis. Interestingly, we found that the MylAP2/ERF49, MylAP2/ERF78, and MylAP2/ERF91 genes clustered together with these genes, indicating that they had similar functions in flooding stress in M. laxiflora.
To identify the conserved motifs of MylAP2/ERFs, the MEME online tool was used for analysis. A total of 10 different conserved motifs were found in the 101 MylAP2/ERF members (Figure 6). The results showed that the sequence lengths of the 10 motifs ranged from a minimum of 11 amino acids (Motif 2, Motif 3, and Motif 10) to a maximum of 50 amino acids (Motif 4).
Some motifs were conserved among the MylAP2/ERF members, while others were unique to only a few MylAP2/ERF members (Figure 7). For example, Motif 1, Motif 2, and Motif 3 were present in most MylAP2/ERFs, with 98, 99, and 95 MylAP2/ERF genes, indicating that these three motifs were the most important components of the MylAP2/ERF protein. However, Motif 4, Motif 6, Motif 7, Motif 8, and Motif 10 were mainly present in the AP2 subgroup; Motif 5 was mainly present in the ERF subgroup; and Motif 9 was only present in the DREB subgroup. These results suggested that these motifs may be conserved in different subgroups of MylAP2/ERFs. In addition, the gene structures of 101 MylAP2/ERF members were analyzed, and the results showed that the gene structures in the same subgroup were very similar (Figure 7).

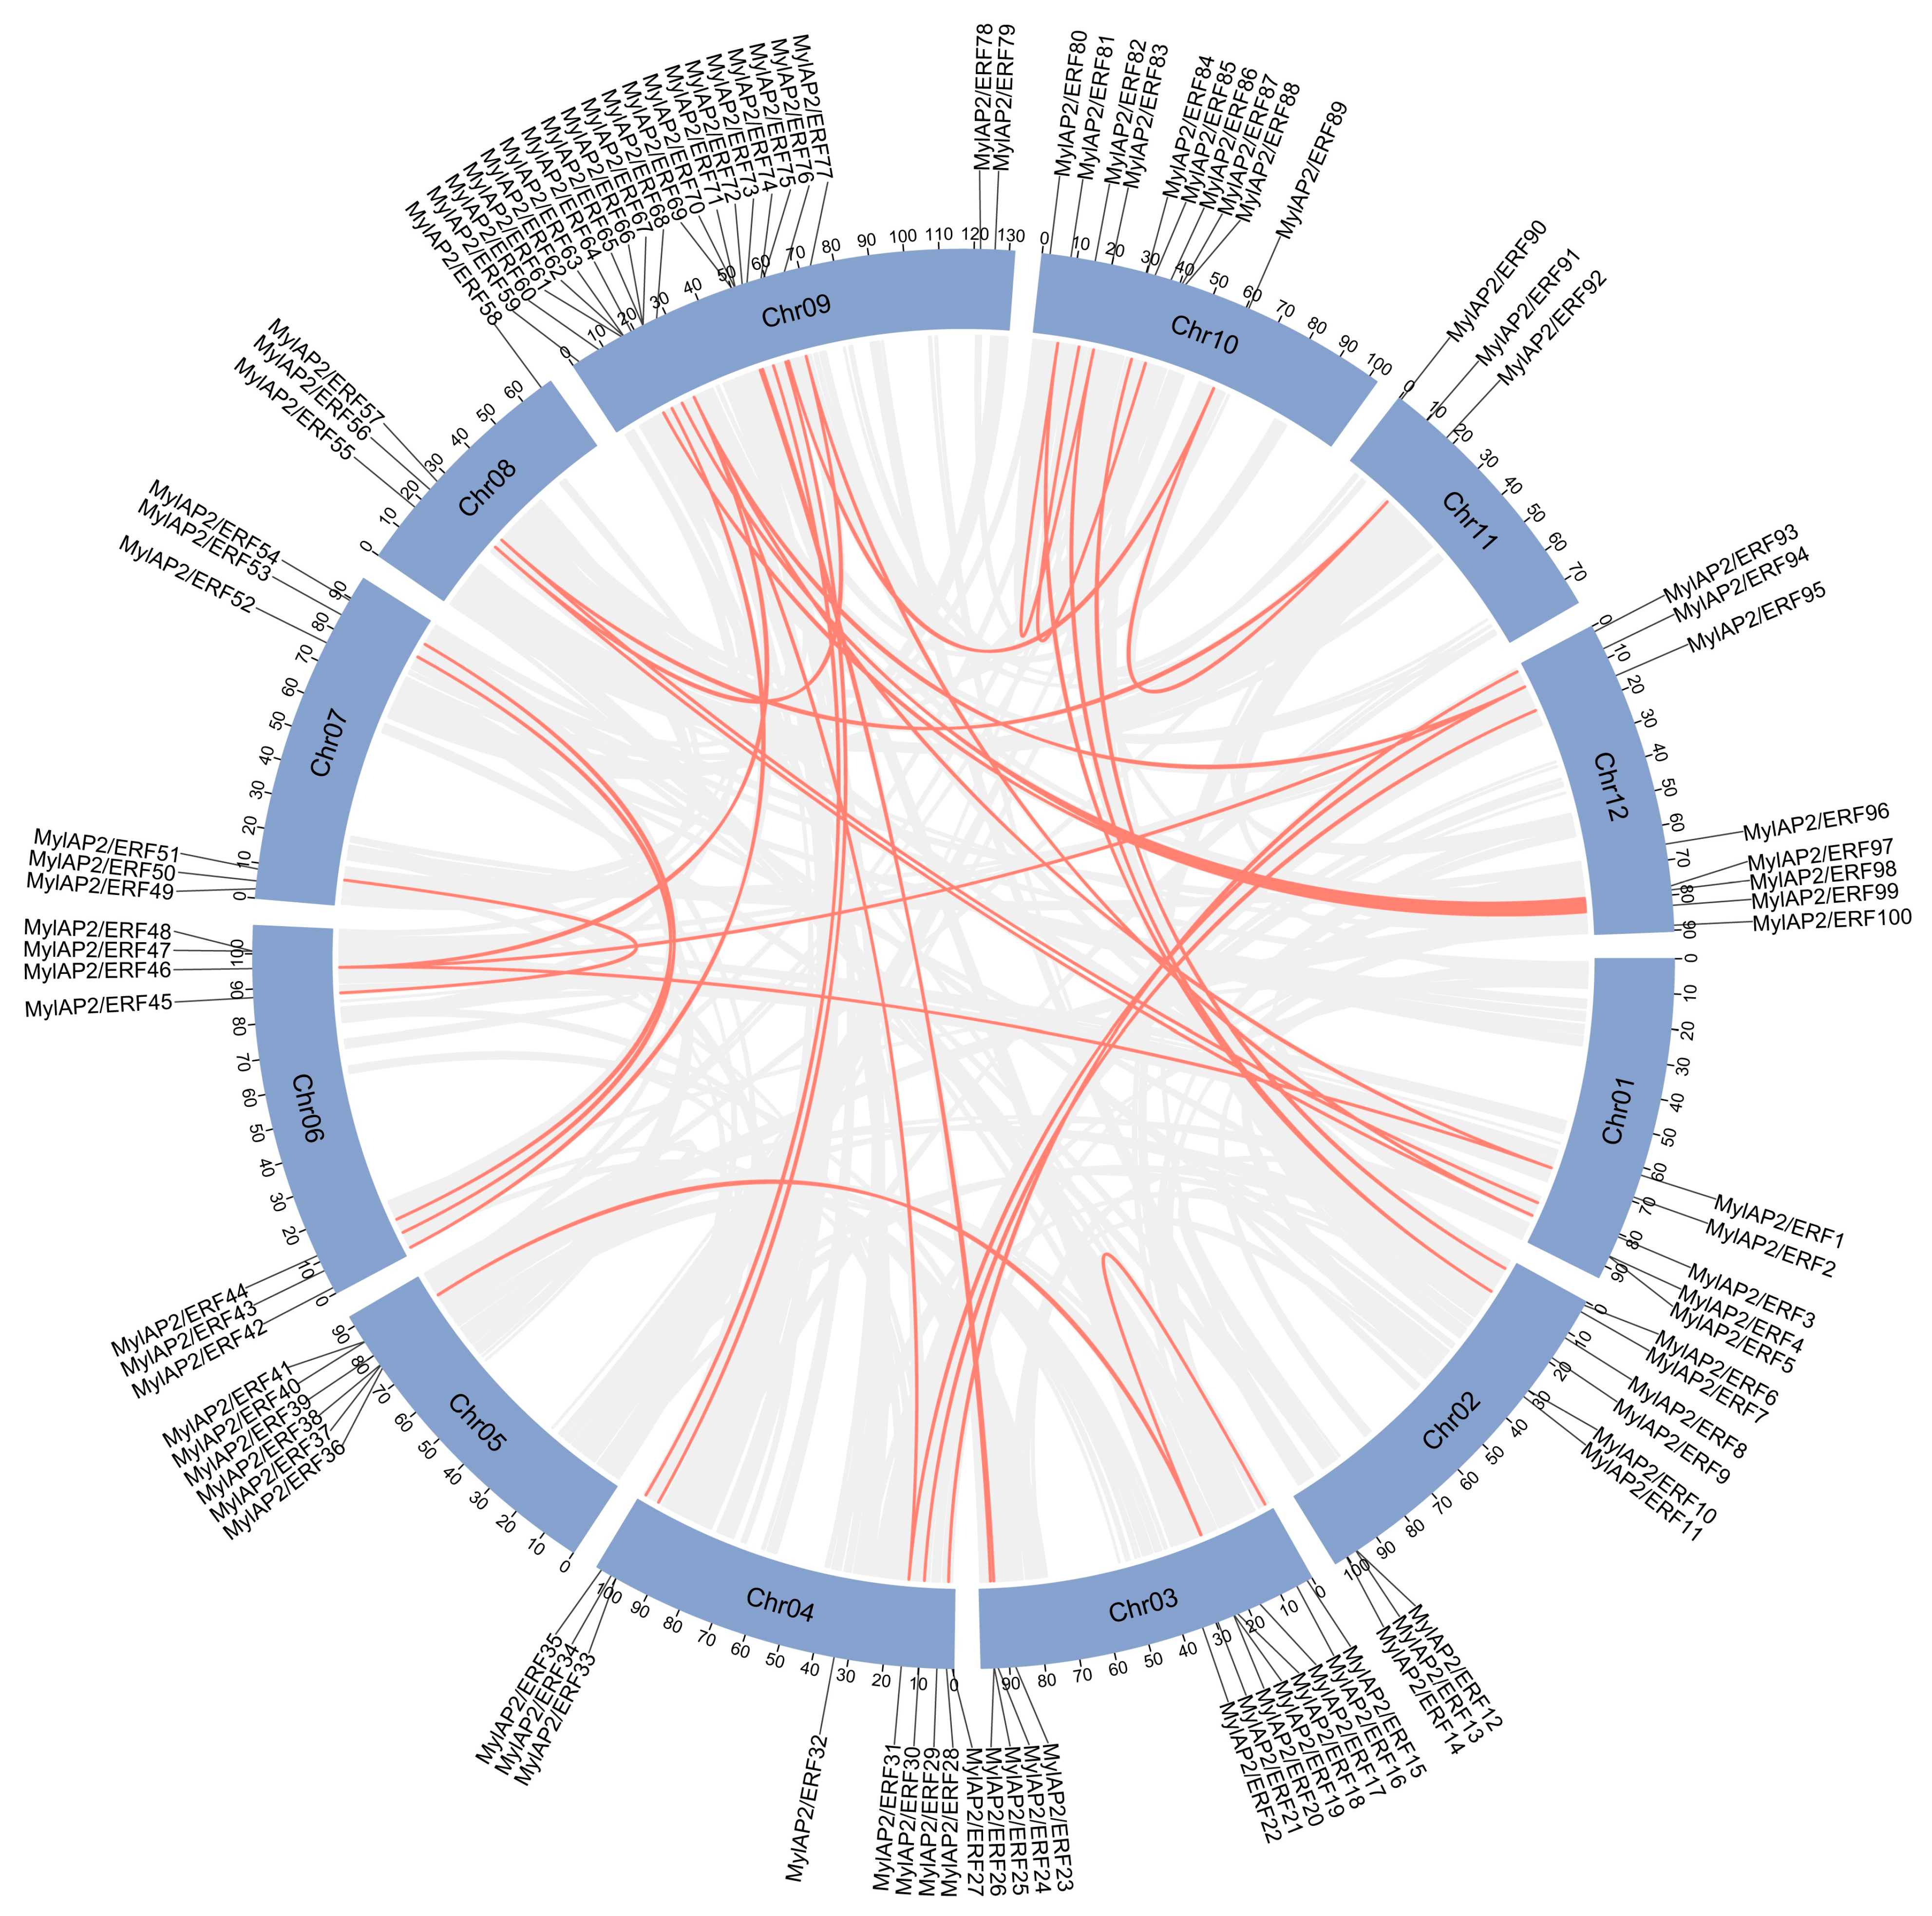
2.6. Gene Duplication Analysis of the MylAP2/ERF Genes

To investigate possible gene duplication events between MylAP2/ERF genes, we localized the predicted MylAP2/ERF genes using assembled genome data. A total of 10 tandem duplication events involving 21 MylAP2/ERF genes were detected between MylAP2/ERF members (Figure 8 and Table S8). For example, there was a tandem duplication event between MylAP2/ERF4 and MylAP2/ERF5 on chr 1. In addition, 32 fragment duplications involving 47 MylAP2/ERF genes, such as fragment duplication events between MylAP2/ERF2 on chromosome 1 and MylAP2/ERF46 on chromosome 6, were detected (Figure 8 and Table S9). These results indicated that duplication events are widely involved in the evolution of MylAP2/ERFs.

2.7. Analysis of Cis-Acting Elements in the Promoter Region of MylAP2/ERFs

To further explore the potential function of the MylAP2/ERF genes, the PlantCARE database was used to analyze the cis-acting elements in the upstream 2000 bp promoter region of the start codon (ATG) of the 101 MylAP2/ERF genes. A total of 15 important cis-acting elements were identified, including genes related to zein metabolism regulation, the abscisic acid response, the salicylic acid response, the low-temperature response, anaerobic induction, the drought response, the auxin response, the gibberellin response, the methyl jasmonate response, the defense and stress response, seed-specific regulation, hypoxia-specific induction, root-specific regulation, flavonoid biosynthesis, and the trauma response (Figure 9). Among the 101 MylAP2/ERF genes, the maximum predicted number of cis-acting elements on MylAP2/ERF45 was 28, while only 1 cis-acting element was predicted on MylAP2/ERF59. In addition, the top 3 cis-acting elements among the 101 MylAP2/ERF genes were 248 methyl jasmonate (MeJA)-responsive elements, 224 abscisic acid (ABA)-responsive elements, and 188 anaerobic-induced responsive elements. These results indicated that these MylAP2/ERF genes may be widely involved in the anaerobic stress response process.

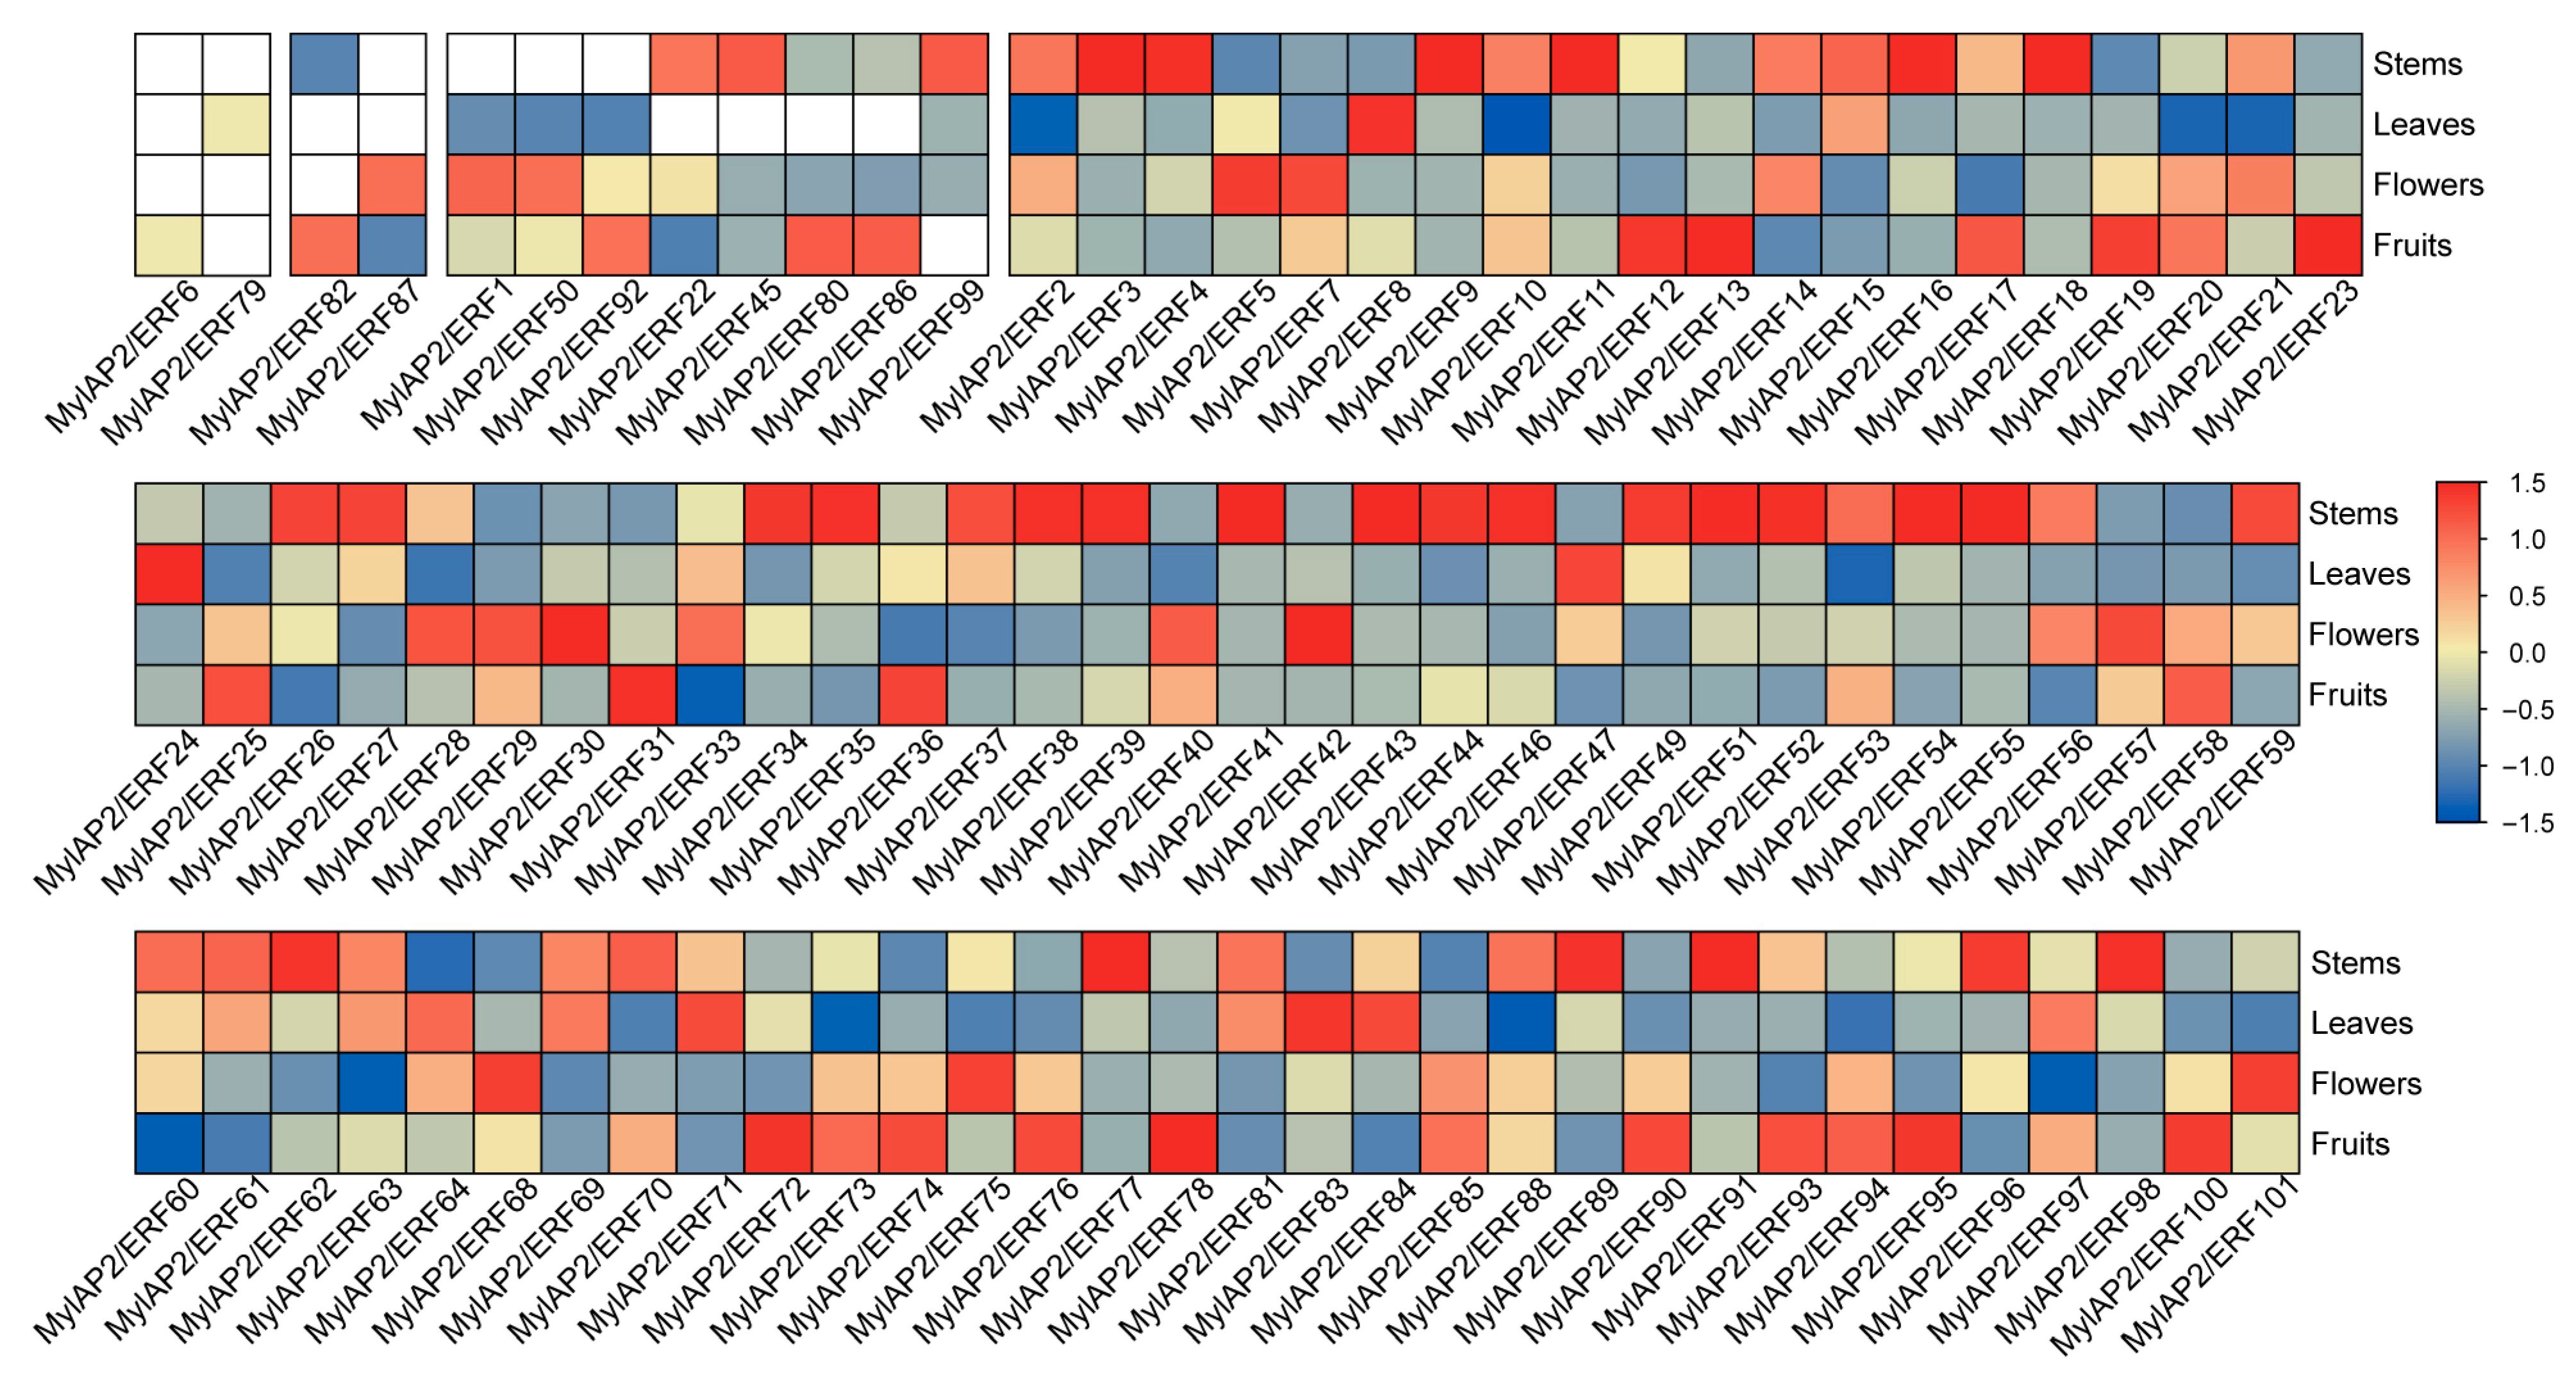
2.8. Expression Patterns of MylAP2/ERF Members in Different Tissues

To clarify the expression patterns of MylAP2/ERF gene family members in different tissues, the expression levels of four tissues of M. laxiflora—the stems, leaves, flowers, and fruits—were obtained by using RNA-seq. As shown in Figure 10, out of 101 MylAP2/ERFs, 96 genes were expressed in the above four tissues, while 5 genes were not expressed. Unexpressed genes may be expressed in other specific tissues or specifically under certain biotic or abiotic stresses. Among the 96 DEGs, 2, 2, 8, and 84 were expressed in one, two, three, and four different tissues, respectively. For example, MylAP2/ERF6 was only expressed in fruits, while MylAP2/ERF79 was only expressed in leaves; MylAP2/ERF82 was expressed in stems and fruits, and MylAP2/ERF87 was expressed in fruits and flowers. These results indicated that MylAP2/ERF can participate in the growth and development of water cypress branches at different stages through its expression in different tissues.

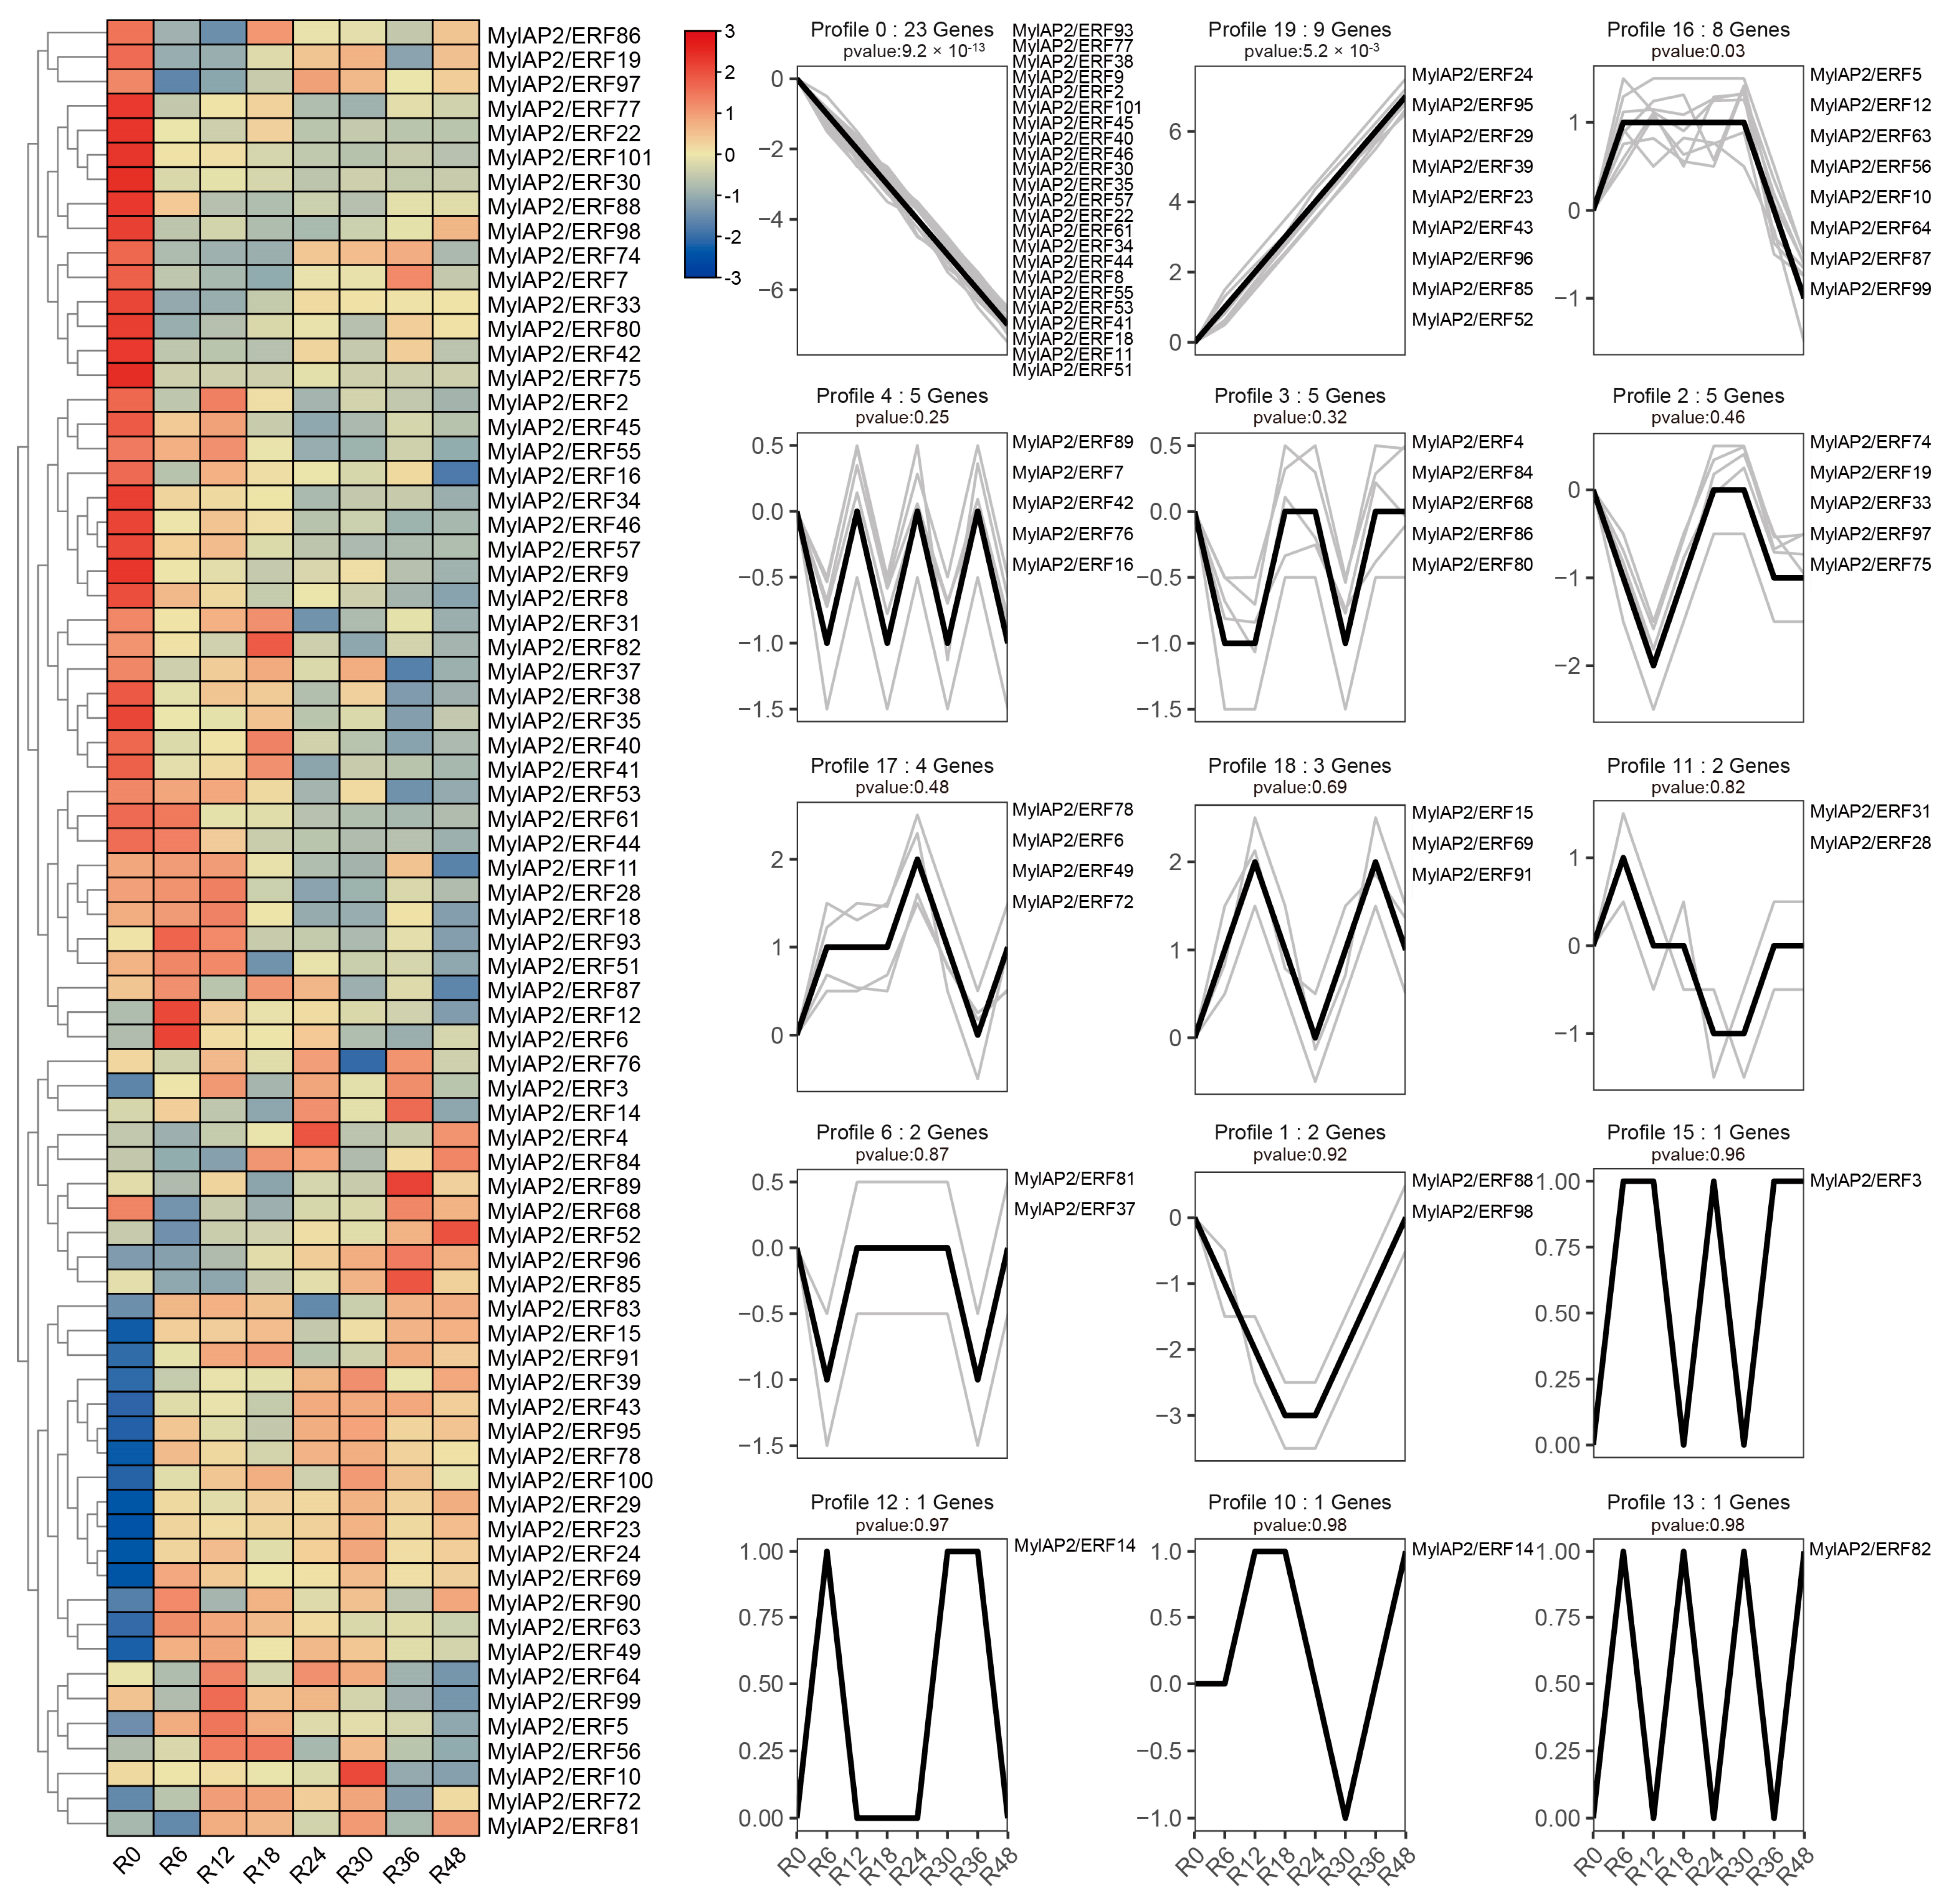
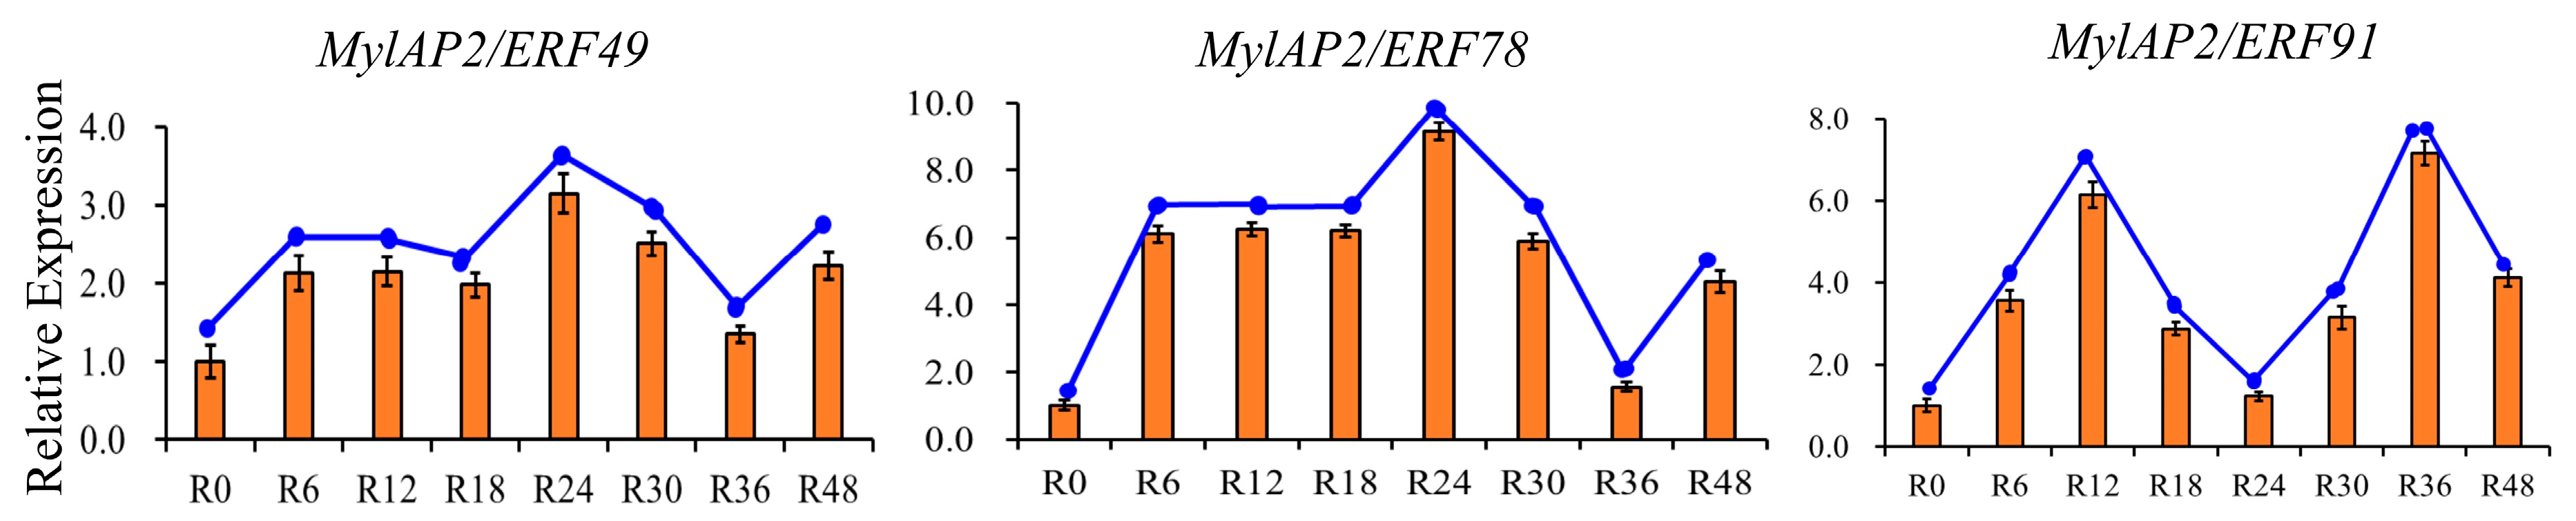
2.9. Analysis of the Expression Patterns of MylAP2/ERF Under Flooding Stress

To further clarify whether members of the MylAP2/ERF family respond to flooding stress, transcriptome data of M. laxiflora at different time points under flooding treatment were downloaded from a public database. As shown in Figure 11, 74 MylAP2/ERF genes exhibited significant changes in their expression abundance under flooding stress at different time points. Based on the expression trends at different time points under flooding stress, these 74 genes were classified into 15 different profiles. Among the 15 different profiles, there were 3 major profiles (50 MylAP2/ERF genes, p < 0.05). The expression of the 23 MylAP2/ERF genes, which belong to profile 0, continued to decrease with increasing waterlogging stress duration. The expression of genes in profile 19 (9 MylAP2/ERF genes) continued to increase with increasing waterlogging stress duration. The abundance of genes in profile 16 (8 MylAP2/ERF genes) tended to increase, then remained unchanged, and finally decreased. The expression of MylAP2/ERF49 and MylAP2/ERF78 first increased and then decreased with increasing flooding duration (profile 17), while the expression of MylAP2/ERF91 (profile 18) first increased, then decreased, and increased again with increasing flooding duration. To confirm the RNA-seq results, qRT–PCR was conducted, and the Pearson correlation coefficients (PCC) between RT-PCR and RNA-Seq data for each gene were calculated. The results showed that high correlations between transcriptome and RNA-Seq data were exhibited for each gene, the average Pearson correlation coefficient was more than 0.88, and MylAP2/ERF49/78 and MylAP2/ERF91 exhibited different expression patterns under flooding stress (Figure 12). These results reflect the validity of the RNA-Seq data.

3. Discussion

High-quality reference genomes are highly important for basic biological research on a species [34,35]. With continuous progress in sequencing technology, reference genomes of an increasing number of species have been assembled [36]. M. laxiflora, a unique stress-resistant and flood-tolerant plant in the Yangtze River Basin of China, is an ideal species for studying the genetic mechanism of plants’ responses to flooding [6,7]. This study used a combination of second-generation sequencing data, HiFi sequencing, and Hi-C methods to obtain a reference genome with an N50 length of 29.5 Mb and a genome size of 1.29 Gb. Therefore, the integration strategy used here was proven to be very effective in assembling the genome of M. laxiflora. Moreover, a total of 23,666 protein-coding genes and 5457 ncRNAs were predicted within the reference genome using multiple strategies. These results provide basic information for subsequent research on M. laxiflora. The AP2/ERF gene family is an important transcription factor family and is involved in plants’ growth, development, and response to various abiotic stresses [37]. Previous studies have shown significant differences in the number of AP2/ERF gene family members among different plants [38,39,40,41]. For example, 147 AtAP2/ERF members were found in Arabidopsis, 214 ZmAP2/ERF members were found in maize, and 543 AP2/ERF members were found in Tritipyrum. In this study, a total of 101 MylAP2/ERF members were found in the genome of M. laxiflora, which is relatively fewer than those of the aforementioned species. In addition, there are certain differences in the number of AP2/ERF subfamilies among different species. Most plants include four subgroups: AP2, RAV, ERF, and DREB. The ERF and DREB subfamilies had more members, while the Soloist subgroup had fewer members in plants. Among the 214 AP2/ERF members in maize, 166 (77.5%) belong to the ERF and DREB subgroups, and no members of the Soloist subgroup were found in Tritipyrum, rice, or maize [39,40,41]. In this study, only one Soloist member (MylAP2/ERF84) was found, while 80 members (79.2%) of the ERF and DREB subfamilies were found. These results indicate that the number of AP2/ERF family members is mainly determined by the number of ERF and DREB subfamily members.
Whole-genome replication is one of the main driving forces for the expansion of plant gene families and is mainly achieved through two processes: tandem duplication and fragment duplication [42,43]. Previous studies have shown that the AP2/ERF gene family is involved in multiple whole-genome replication events in different species. A total of 79 fragment duplications were detected in the AP2/ERF gene family of maize, and 32 tandem duplication events and 72 fragment duplication events were detected in the AP2/ERF gene family study of Tritipyrum [40,41]. In M. laxiflora, a total of 10 tandem repeat events involving 21 MylAP2/ERF members and 32 fragment repeat events involving 47 MylAP2/ERF members were found. These findings suggest that compared with tandem repeat events, fragment repeat events may play a more important role in the expansion of the AP2/ERF gene family in plants.
Flooding stress is one of the abiotic stresses that plants suffer from, as they are exposed to cyclic or long-term hypoxic environments that limit their energy requirements for aerobic respiration and maintenance of life activities. Multiple studies have shown that AP2/ERF members (RAP2.2, HRE1, and HRE2) play important roles in the process of flooding stress in plants [29,30]. The overexpression of the Arabidopsis RAP2.2 gene can significantly increase the expression of hypoxia-responsive genes (PDC1 and ADH1), thereby significantly improving the survival rate of plants in hypoxic environments [29]. However, in rap2.2 mutant plants, the expression levels of ADH1 and PDC1 were not significantly reduced, suggesting that other ERF members or transcription factors may synergistically participate in the plants’ hypoxia response [29]. Similarly, the overexpression of HRE1 and HRE2 can quickly induce the expression of ADH1 and PDC1, thereby improving plants’ hypoxia tolerance [30]. In this study, transcriptome data analyses at different time points of flooding stress showed that the expression levels of 74 MylAP2/ERF members changed significantly. Among the 74 MylAP2/ERF members, the expression levels of 23 MylAP2/ERF members continued to decrease, while the expression levels of 9 MylAP2/ERF members continued to increase. The results of the phylogenetic analysis revealed that the expression of MylAP2/ERF49, MylAP2/ERF78, and MylAP2/ERF91 in M. laxiflora and of RAP2.2, HRE1, and HRE2 in Arabidopsis were in the same branch, and the expression levels of MylAP2/ERF49 and MylAP2/ERF78 tended to first increase and then decrease with increasing flooding stress duration, while the expression of MylAP2/ERF91 first increased, then decreased, and finally increased again with increasing flooding stress duration. In summary, members of the AP2/ERF gene family play important roles in plants’ response to waterlogging and hypoxia stresses.
M. laxiflora alterniflora is an important plant species in the Yangtze River Basin in China, but its growth and development are often impacted by flooding stress, which poses a serious threat to its growth and development [3]. In recent years, with the development of sequencing technology and biotechnology, it has become possible to further improve the waterlogging tolerance of M. laxiflora [2]. In this study, we assembled a high-quality reference genome for the first time, with a genome size of 1.29 Gb. At the same time, 101 AP2/ERF members were identified from the reference genome, and 74 MylAP2/ERF members were found to respond to flooding stress. In future research, these AP2/ERF members could be precisely modified using biotechnology to improve the waterlogging tolerance of M. laxiflora. Therefore, this study provides valuable information for the further study of the biological function and molecular regulatory mechanism of the AP2/ERF gene in M. laxiflora and other plants.

4. Materials and Methods

4.1. Plant Materials

LS7, which was collected from the Yangtze River Basin in China, was used for genome assembly in this study. The age of the mother stock was fifteen years. We also collected tissues from the roots, leaves, flowers, and stems on 27 October 2021. The location of the collected samples was the Rare Plant Research Institute of Yangtze River, and the temperature was maintained at 10–21 °C. These tissues were collected during the non-flooding stress season. To avoid sample contamination, asexual propagation of LS7 was carried out using cutting methods. Roots, leaves, stems, flowers, and fruits were collected from 10 independent asexual propagation lines of LS7. Each sample had three replicates and was quickly stored in liquid nitrogen for subsequent DNA and RNA sequencing.

4.2. Sequencing and Genome Assembly

All sequencing libraries were constructed according to the quality requirements of the sequencing equipment. The HiFi (High-Fidelity) and Hi-C (High-throughput/resolution chromosome conformation capture) libraries were prepared according to previously described procedures [44]. RNA was isolated from different tissues (leaves, stems, flowers, and fruits). The RNA-seq library was prepared using the Illumina platform (Illumina, Santiago, CA, USA). A total of 16.99 Gb, 11.16 Gb, 10.24 Gb, 10.75 Gb, and 11.39 Gb of RNA-seq raw data were obtained for the roots, leaves, stems, flowers, and fruits, respectively. The raw reads were then filtered by using the SOAP filter software with the following parameters: −n 0.1 −l 5 −q 0.5 −Q 2 −G −5 1 [45]. A K-mer analysis was used to estimate the genome size [46]. After removing any HiFi reads that were less than 1 kb in length and adapters, 49.2 Gb of clean reads, representing ~44.7 × sequencing coverage of the M. laxiflora genome, were used to assembly the contig using the Falcon v0.3.0 software with the following parameters: −output-multi −min-idt 0.70 −min-cov 2 −max-n-read 800 [47]. In addition, the BLASR software was used to map the reads to contigs with the following parameters: −bestn 40 −maxScore −500 −m 4 [48]. Approximately 155.51 Gb of raw data were sequenced from a Hi-C library, and ~77.43 Gb of valid reads were obtained after quality control. The clean Hi-C reads were mapped to the genome assembly through BWA alignment using mem mode with the parameter -SP5M. The repetitive reads were removed by using the HiC-Pro with the default parameters [49]. Juicer software was used to aggregate and separate the raw Hi-C links [50]. Juicebox software was used to adjust the placement and orientation errors [51].

4.3. Genome Annotation and Repeat Analysis

To predict the genes, three methods—de novo prediction, homology-based prediction, and transcriptome-based prediction—were used. The FGENESH and AUGUSTUS software packages were used to conduct the de novo prediction [52,53], and HISAT2 (v2.2.1) and StringTie (v2.2.0) were used to conduct the transcriptome-based prediction based on the RNA-seq data from five different tissues with default parameters [54,55]. To identify the tRNA members, the tRNAscan-SE (v2.0) software was used [56]. In addition, the Rfam database was used to identify the noncoding RNAs, including the miRNA, snRNA, and rRNA. A repeat library of the genome was built using Repeat-Modeler (V2.0.1) and LTR_retriever (V2.9.0), which was further used to identify TEs with RepeatMasker (V4.1.0). To determine the LTR insertion time, we used LTR_finder and LTR_harvest to predict the retrotransposons in the genome, and LTR_retriever was used to consolidate the predictions and calculate the insertion time.

4.4. Identification and Chromosomal Distribution of the AP2/ERF Gene Family in M. laxiflora

The conserved AP2/ERF domain PF00847, which was obtained from the Pfam database (https://pfam.xfam.org/, accessed on 10 December 2023), was used to identify proteins in the M. laxiflora reference genome [57]. A hidden Markov model (HMM) analysis with a parameter E-value < 1 × 10⁻¹⁰ and > 85 bits was conducted to identify the candidate MylAP2/ERF members in the reference genome of M. laxiflora. Finally, TBtools software (v1.108, Chen, C., GZ, China) was used to visualize the chromosome position, which was named based on its position on the chromosome. The cDNA sequence length, protein sequence length, molecular weight, and theoretical isoelectric points of the identified MylAP2/ERF members were obtained from the GFF file of the M. laxiflora reference genome, which was assembled in this study using TBtools [58]. The subcellular localization of these MylAP2/ERF proteins was predicted using the WoLF PSORT online tool (https://wolfpsort.hgc.jp/, accessed on 15 December 2023).

4.5. Phylogenetic and Motif Analyses of MylAP2/ERFs

The MEGA11 software was used to conduct the phylogenetic analysis of all members of the AP2/ERF gene family in M. alterniflora and Arabidopsis [59]. Before constructing the phylogenetic tree, the MEGA11 software was used to align the AP2/ERF protein sequences from M. alterniflora and Arabidopsis with the default parameters. Using the NJ method to construct phylogenetic trees for MylAP2/ERF and AtAP2/ERF, the parameters used were the Poisson model and the bootstrap duplicate value, which was set to 1000, while the remaining parameters were set to their default values. A conserved motif analysis was conducted among the MylAP2/ERF members using the MEME online program (https://meme-suite.org/meme/index.html, accessed on 18 December 2023), and the default parameters were used, with a maximum motif number of 10.

4.6. Gene Duplication Event and Cis-Acting Element Analysis

The identification and analysis of gene duplication events in the MylAP2/ERF gene family were performed using MCScanX software (https://github.com/wyp1125/MCScanX, accessed on 28 December 2023), and the results were visualized using TBtools [58]. The upstream 2000 bp sequence of the MylAP2/ERF gene start codon (ATG) was extracted as the promoter region using TBtools, and the online website PlantCARE (https://bioinformatics.psb.ugent.be/webtools/plantcare/html/, accessed on 28 December 2023) was used to predict the cis-acting elements in the promoter regions of these MylAP2/ERF members.

4.7. Expression Analysis of MylAP2/ERF Genes

The expression analysis of these MylAP2/ERF genes revealed different tissue and flooding stress expression patterns. Transcriptome data were obtained for different tissues (leaves, flowers, stems, and fruits) of M. laxiflora. The transcriptome data for M. laxiflora roots under flooding stress conditions at different time points were downloaded from the public database NCBI (PRJNA840865). The RNA-seq data aligned with the reference genome that was obtained in this study by using Hisat2 software. The gene expression levels were calculated based on the fragments per kilobase of exon per million mapped fragments (FPKMs). Differentially expressed genes were retrieved using DESeq2 with the following parameters: padj < 0.05 and |log2FC| ≥ 1 [60]. Finally, a heatmap of all relevant data was drawn using TBtools [58]. The primer sequences used in this study are listed in Table S10. The reference gene used for qRT-PCR was the actin gene. Three technical duplicates were conducted for qRT-PCR expression study.

5. Conclusions

Here, we identified a high-quality reference genome of M. laxiflora by using HiFi sequencing and Hi-C. The total assembly size of the M. laxiflora genome was 1.29 Gb, with a scaffold N50 size of 29.5 Mb. A total of 23,666 gene-encoding proteins and 5457 ncRNAs were predicted in this reference genome. In the M. laxiflora genome, a total of 101 MylAP2/ERF genes were identified and divided into five subgroups: 40 belonging to the ERF subgroup, 40 belonging to the DREB subgroup, 17 belonging to the AP2 subgroup, 3 belonging to the RAV subgroup, and 1 belonging to the Soloist subgroup. A total of 10 tandem repeat events and 32 fragment duplication events were found among the 101 MylAP2/ERF genes. A large number of MeJA-, ABA-, and hypoxia-responsive elements were found in the promoter regions of these MylAP2/ERF genes. According to the transcriptome data analysis, a total of 74 MylAP2/ERF genes responded to flooding stress. Moreover, three genes (MylAP2/ERF49/78/91) that belong to the same branch as the RAP2.2 gene exhibited different expression trends under flooding stress. Our results provide valuable information on the molecular regulatory mechanism of flooding stress in M. laxiflora.

Supplementary Materials

The following supporting information can be downloaded at https://www.mdpi.com/article/10.3390/f16020295/s1: Figure S1: The results of the K-mer analysis; Figure S2: The GC depth analysis based on the HiFi data; Figure S3: GO analysis of the expanded genes; Figure S4: GO analysis of the contracted genes; Table S1: The data produced in this study; Table S2: The gene numbers of the 12 chromosomes in M. laxiflora; Table S3: Annotation of gene functions in the genome of M. laxiflora; Table S4: The species genome information; Table S5: GO analysis of expansion genes; Table S6: GO analysis of contracted genes; Table S7: Information on the 101 MylAP2/ERFs identified in this study; Table S8: Tandem duplication events among the MylAP2/ERF members; Table S9: Fragment duplication events among the MylAP2/ERF family members; Table S10: The primers used in this study.

Author Contributions

B.D., H.C. and X.M. collected the plant materials; G.H., D.W. and J.L. designed the project; W.X., L.L., G.L., Z.Y., Z.X., H.Z. and J.W. worked on sequencing and data analysis; and W.X. and L.L. wrote the manuscript. All authors have read and agreed to the published version of the manuscript.

Funding

This research was funded by the Natural Science Foundation of Hubei Province of China (2023AFB549), the Yangtze River Hydropower Ecological Environmental Protection Special Fund of China Three Gorges Corporation (WWKY-2021-0131) and the National Natural Science Foundation of China (U2240222).

Data Availability Statement

The final chromosome-level genome and annotation files of Myricaria laxiflora are available at figshare: https://doi.org/10.6084/m9.figshare.25375366.v1.

Conflicts of Interest

Authors Weibo Xiang, Linbao Li, Guiyun Huang, Bicheng Dun, Junchen Wang, Huiyuan Chen, Xiaobo Ma, Haibo Zhang, Zhiqiang Xiao and Di Wu were employed by the China Three Gorges Corporation. The remaining authors declare that the research was conducted in the absence of any commercial or financial relationships that could be construed as a potential conflict of interest.

References

  1. Li, L.; Wu, D.; Zhen, Q.; Zhang, J.; Qiu, L.; Huang, G.; Yang, C. Morphological structures and histochemistry of roots and shoots in Myricaria laxiflora (Tamaricaceae). Open Life Sci. 2021, 16, 455–463. [Google Scholar] [CrossRef] [PubMed]
  2. Li, L.; Huang, G.; Xiang, W.; Zhu, H.; Zhang, H.; Zhang, J.; Ding, Z.; Liu, J.; Wu, D. Integrated Transcriptomic and Proteomic Analyses Uncover the Regulatory Mechanisms of Myricaria laxiflora Under Flooding Stress. Front. Plant Sci. 2022, 13, 924490. [Google Scholar] [CrossRef]
  3. Wu, J.; Zhao, Z.; Jin, Y.; Shen, Z. Investigation and study on the endemic plant Myricaria laxiflora in the Three-Gorge reservoir area. Wuhan Bot. Res. 1998, 16, 111–116. [Google Scholar]
  4. Wang, Y.; Wu, J.; Tao, Y.; Li, Z.; Huang, H. Natural distribution and ex situ conservation of endemic species Myricaria laxiflora in water-level-fluctuation Zone within Three-Gorges reservoir area of Changjiang River. Wuhan Bot. Res. 2003, 21, 415–422. [Google Scholar]
  5. Bao, D.; Lu, Z.; Jiang, M.; Xu, S.; Yao, Q.; Liu, Q.; Wang, Q. Population structure and dynamics of remanent Myricaria laxiflora downstream from the Three Gorges dam. J. Wuhan Bot. Res. 2010, 28, 711–716. [Google Scholar]
  6. Chen, F.Q.; Xie, Z.Q. Survival and growth responses of Myricaria laxiflora seedlings to summer flooding. Aquat. Bot. 2009, 90, 333–338. [Google Scholar] [CrossRef]
  7. Chen, F.; Guan, S.; Ma, Y.; Xie, Z.; Lv, K.; Huang, Y.; Jia, G. Impact of regulated water level fluctuations on the sexual reproduction of remnant Myricaria laxiflora populations. Glob. Ecol. Conserv. 2019, 18, e00628. [Google Scholar] [CrossRef]
  8. Guan, S.; Chen, F.; Zhou, J.; Xie, Z.; Huang, Y. Spatiotemporal photosynthetic physiology responses of remnant Myricaria laxiflora populations to regulated water level fluctuations. Conserv. Physiol. 2020, 8, coaa020. [Google Scholar] [CrossRef]
  9. Zhou, J.; Chen, F.; Lv, K.; Wu, Y.; Huang, Y. Summer dormancy in an endangered riparian shrub Myricaria laxiflora: Changes in branches, leaves, and nonstructural carbohydrates. Glob. Ecol. Conserv. 2021, 31, e01809. [Google Scholar] [CrossRef]
  10. Jia, W.; Ma, M.; Chen, J.; Wu, S. Plant Morphological, Physiological and Anatomical Adaptation to Flooding Stress and the Underlying Molecular Mechanisms. Int. J. Mol. Sci. 2021, 22, 1088. [Google Scholar] [CrossRef]
  11. Fukao, T.; Barrera-Figueroa, B.E.; Juntawong, P.; Pena-Castro, J.M. Submergence and waterlogging stress in plants: A review highlighting research opportunities and understudied aspects. Front. Plant Sci. 2019, 10, 340. [Google Scholar] [CrossRef]
  12. Bailey-Serres, J.; Voesenek, L.A.C.J. Flooding stress: Acclimations and genetic diversity. Annu. Rev. Plant Biol. 2008, 59, 313–339. [Google Scholar] [CrossRef]
  13. Bailey-Serres, J.; Lee, S.C.; Brinton, E. Waterproofing crops: Effective flooding survival strategies. Plant Physiol. 2012, 160, 1698–1709. [Google Scholar] [CrossRef]
  14. Nishiuchi, S.; Yamauchi, T.; Takahashi, H.; Kotula, L.; Nakazono, M. Mechanisms for coping with submergence and waterlogging in rice. Rice 2012, 5, 2. [Google Scholar] [CrossRef]
  15. Setter, T.L.; Waters, I. Review of prospects for germplasm improvement for waterlogging tolerance in wheat, barley and oats. Plant Soil. 2013, 253, 1–34. [Google Scholar] [CrossRef]
  16. Voesenek, L.A.C.J.; Bailey-Serres, J. Flood adaptive traits and processes: An overview. New Phytol. 2015, 206, 57–73. [Google Scholar] [CrossRef]
  17. Loreti, E.; van Veen, H.; Perata, P. Plant responses to flooding stress. Curr. Opin. Plant Biol. 2016, 33, 64–71. [Google Scholar] [CrossRef]
  18. Booker, M.A.; DeLong, A. Producing the Ethylene Signal: Regulation and Diversification of Ethylene Biosynthetic Enzymes. Plant Physiol. 2015, 169, 42–50. [Google Scholar] [CrossRef]
  19. Zhou, Z.; Vriezen, W.; Van Caeneghem, W.; Van Montagu, M.; Van Der Straeten, D. Rapid induction of a novel ACC synthase gene in deepwater rice seedlings upon complete submergence. Euphytica 2001, 121, 137–143. [Google Scholar] [CrossRef]
  20. Lee, S.C.; Mustroph, A.; Sasidharan, R.; Vashisht, D.; Pedersen, O.; Oosumi, T.; Voesenek, L.A.C.J.; Bailey-Serres, J. Molecular characterization of the submergence response of the Arabidopsis thaliana ecotype Columbia. New Phytol. 2011, 190, 457–471. [Google Scholar] [CrossRef]
  21. Sasidharan, R.; Voesenek, L.A.C.J. Ethylene-mediated acclimations to flooding stress. Plant Physiol. 2015, 169, 3–12. [Google Scholar] [CrossRef] [PubMed]
  22. Bailey-Serres, J.; Fukao, T.; Gibbs, D.J.; Holdsworth, M.J.; Lee, S.C.; Licausi, F.; Perata, P.; Voesenek, L.A.C.J.; van Dongen, J.T. Making sense of low oxygen sensing. Trends Plant Sci. 2012, 17, 129–138. [Google Scholar] [CrossRef]
  23. Hattori, Y.; Nagai, K.; Furukawa, S.; Song, X.J.; Kawano, R.; Sakakibara, H.; Wu, J.; Matsumoto, T.; Yoshimura, A.; Kitano, H.; et al. The ethylene response factors SNORKEL1 and SNORKEL2 allow rice to adapt to deep water. Nature 2009, 460, 1026–1030. [Google Scholar] [CrossRef]
  24. Niroula, R.K.; Pucciariello, C.; Ho, V.T.; Novi, G.; Fukao, T.; Perata, P. SUB1A-dependent and -independent mechanisms are involved in the flooding tolerance of wild rice species. Plant J. 2012, 72, 282–293. [Google Scholar] [CrossRef]
  25. Jung, K.H.; Seo, Y.S.; Walia, H.; Cao, P.; Fukao, T.; Canlas, P.E.; Amonpant, F.; Bailey-Serres, J.; Ronald, P.C. The submergence tolerance regulator Sub1A mediates stress-responsive expression of AP2/ERF transcription factors. Plant Physiol. 2010, 152, 1674–1692. [Google Scholar] [CrossRef]
  26. Yang, L.; Li, N.; Liu, Y.; Miao, P.; Liu, J.; Wang, Z. Updates and Prospects: Morphological, Physiological, and Molecular Regulation in Crop Response to Waterlogging Stress. Agronomy 2023, 13, 2599. [Google Scholar] [CrossRef]
  27. Wei, X.; Xu, H.; Rong, W.; Ye, X.; Zhang, Z. Constitutive expression of a stabilized transcription factor group VII ethylene response factor enhances waterlogging tolerance in wheat without penalizing grain yield. Plant Cell Environ. 2019, 42, 1471–1485. [Google Scholar] [CrossRef]
  28. Yu, F.; Liang, K.; Fang, T.; Zhao, H.; Han, X.; Cai, M.; Qiu, F. A group VII ethylene response factor gene, ZmEREB180, coordinates waterlogging tolerance in maize seedlings. Plant Biotechnol. J. 2019, 17, 2286–2298. [Google Scholar] [CrossRef]
  29. Hinz, M.; Wilson, I.W.; Yang, J.; Buerstenbinder, K.; Llewellyn, D.; Dennis, E.S.; Sauter, M.; Dolferus, R. Arabidopsis RAP2.2: An ethylene response transcription factor that is important for hypoxia survival. Plant Physiol. 2010, 153, 757–772. [Google Scholar] [CrossRef]
  30. Licausi, F.; van Dongen, J.T.; Giuntoli, B.; Novi, G.; Santaniello, A.; Geigenberger, P.; Perata, P. HRE1 and HRE2, two hypoxia-inducible ethylene response factors, affect anaerobic responses in Arabidopsis thaliana. Plant J. 2010, 62, 302–315. [Google Scholar] [CrossRef]
  31. Hartman, S.; Liu, Z.; Van Veen, H.; Vicente, J.; Reinen, E.; Martopawiro, S.; Zhang, H.; Van Dongen, N.; Bosman, F.; Bassel, G.W.; et al. Ethylene-mediated nitric oxide depletion preadapts plants to hypoxia stress. Nat. Commun. 2019, 10, 4020. [Google Scholar] [CrossRef] [PubMed]
  32. Gibbs, D.J.; Tedds, H.M.; Labandera, A.M.; Bailey, M.; White, M.D.; Hartman, S.; Sprigg, C.; Mogg, S.L.; Osborne, R.; Dambire, C.; et al. Oxygen-dependent proteolysis regulates the stability of angiosperm polycomb repressive complex 2 subunit VERNALIZATION 2. Nat. Commun. 2018, 9, 5438. [Google Scholar] [CrossRef] [PubMed]
  33. Gibbs, D.J.; Md Isa, N.; Movahedi, M.; Lozano-Juste, J.; Mendiondo, G.M.; Berckhan, S.; Marin-De La Rosa, N.; Vicente Conde, J.; Sousa Correia, C.; Pearce, S.P.; et al. Nitric oxide sensing in plants is mediated by proteolytic control of group VII ERF transcription factors. Mol. Cell 2014, 53, 369–379. [Google Scholar] [CrossRef]
  34. Yan, Z.; Sang, L.; Ma, Y.; He, Y.; Sun, J.; Ma, L.; Li, S.; Miao, F.; Zhang, Z.; Huang, J.; et al. A de novo assembled high-quality chromosome-scale Trifolium pratense genome and fine-scale phylogenetic analysis. BMC Plant Biol. 2022, 22, 332. [Google Scholar] [CrossRef]
  35. Whibley, A.; Kelley, J.L.; Narum, S.R. The changing face of genome assemblies: Guidance on achieving high-quality reference genomes. Mol. Ecol. Resour. 2021, 21, 641–652. [Google Scholar] [CrossRef]
  36. Marks, R.A.; Hotaling, S.; Frandsen, P.B.; VanBuren, R. Representation and participation across 20 years of plant genome sequencing. Nat. Plants 2021, 7, 1571–1578. [Google Scholar] [CrossRef]
  37. Ma, Z.; Hu, L.; Jiang, W. Understanding AP2/ERF Transcription Factor Responses and Tolerance to Various Abiotic Stresses in Plants: A Comprehensive Review. Int. J. Mol. Sci. 2024, 25, 893. [Google Scholar] [CrossRef]
  38. Hu, F.; Zhang, Y.; Guo, J. Identification and Characterization of AP2/ERF Transcription Factors in Yellow Horn. Int. J. Mol. Sci. 2022, 23, 14991. [Google Scholar] [CrossRef]
  39. Nakano, T.; Suzuki, K.; Fujimura, T.; Shinshi, H. Genome-wide analysis of the ERF gene family in Arabidopsis and rice. Plant Physiol. 2006, 140, 411–432. [Google Scholar] [CrossRef]
  40. Zhang, J.; Liao, J.; Ling, Q.; Xi, Y.; Qian, Y. Genome-wide identification and expression profiling analysis of maize AP2/ERF superfamily genes reveal essential roles in abiotic stress tolerance. BMC Genom. 2022, 23, 125. [Google Scholar] [CrossRef]
  41. Liu, X.; Zhou, G.; Chen, S.; Jia, Z.; Zhang, S.; Ren, M.; He, F. Genome-wide analysis of the AP2/ERF gene family in Tritipyrum and the response of TtERF_B2-50 in salt-tolerance. BMC Genom. 2023, 24, 541. [Google Scholar] [CrossRef]
  42. Lynch, M.; Conery, J.S. The evolutionary fate and consequences of duplicate genes. Science 2000, 290, 1151–1155. [Google Scholar] [CrossRef]
  43. Cannon, S.B.; Mitra, A.; Baumgarten, A.; Young, N.D.; May, G. The roles of segmental and tandem gene duplication in the evolution of large gene families in Arabidopsis thaliana. BMC Plant Biol. 2004, 4, 10. [Google Scholar] [CrossRef]
  44. Lieberman-Aiden, E.; van Berkum, N.L.; Williams, L.; Imakaev, M.; Ragoczy, T.; Telling, A.; Amit, I.; Lajoie, B.R.; Sabo, P.J.; Dorschner, M.O.; et al. Comprehensive mapping of long-range interactions reveals folding principles of the human genome. Science 2009, 326, 289–293. [Google Scholar] [CrossRef] [PubMed]
  45. Luo, R.; Liu, B.; Xie, Y.; Li, Z.; Huang, W.; Yuan, J.; He, G.; Chen, Y.; Pan, Q.; Liu, Y.; et al. SOAPdenovo2: An empirically improved memory-efficient short-read de novo assembler. Gigascience 2012, 1, 18. [Google Scholar] [CrossRef]
  46. Marçais, G.; Kingsford, C. A fast, lock-free approach for efficient parallel counting of occurrences of k-mers. Bioinformatics 2011, 27, 764–770. [Google Scholar] [CrossRef] [PubMed]
  47. Chin, C.S.; Peluso, P.; Sedlazeck, F.J.; Nattestad, M.; Concepcion, G.T.; Clum, A.; Dunn, C.; O’Malley, R.; Figueroa-Balderas, R.; Morales-Cruz, A.; et al. Phased diploid genome assembly with single-molecule real-time sequencing. Nat. Methods 2016, 13, 1050. [Google Scholar] [CrossRef]
  48. Chaisson, M.J.; Tesler, G. Mapping single molecule sequencing reads using basic local alignment with successive refinement (BLASR): Application and theory. BMC Bioinform. 2012, 13, 238. [Google Scholar] [CrossRef]
  49. Servant, N.; Varoquaux, N.; Lajoie, B.R.; Viara, E.; Chen, C.J.; Vert, J.P.; Heard, E.; Dekker, J.; Barillot, E. HiC-Pro: An optimized and flexible pipeline for Hi-C data processing. Genome Biol. 2015, 16, 259. [Google Scholar] [CrossRef]
  50. Durand, N.C.; Robinson, J.T.; Shamim, M.S.; Machol, I.; Mesirov, J.P.; Lander, E.S.; Aiden, E.L. Juicebox provides a visualization system for Hi-C contact maps with unlimited zoom. Cell Syst. 2016, 3, 99–101. [Google Scholar] [CrossRef]
  51. Durand, N.C.; Shamim, M.S.; Machol, I.; Rao, S.S.; Huntley, M.H.; Lander, E.S.; Aiden, E.L. Juicer provides a one-click system for analyzing loop-resolution Hi-C experiments. Cell Syst. 2016, 3, 95–98. [Google Scholar] [CrossRef] [PubMed]
  52. Stanke, M.; Steinkamp, R.; Waack, S.; Morgenstern, B. AUGUSTUS: A web server for gene finding in eukaryotes. Nucleic Acids Res. 2004, 32, W309–W312. [Google Scholar] [CrossRef] [PubMed]
  53. Salamov, A.A.; Solovyev, V.V. Ab initio gene finding in drosophila genomic DNA. Genome Res. 2000, 10, 516–522. [Google Scholar] [CrossRef]
  54. Kim, D.; Langmead, B.; Salzberg, S.L. HISAT: A fast spliced aligner with low memory requirements. Nat. Methods 2015, 12, 357. [Google Scholar] [CrossRef]
  55. Pertea, M.; Pertea, G.M.; Antonescu, C.M.; Chang, T.C.; Mendell, J.T.; Salzberg, S.L. StringTie enables improved reconstruction of a transcriptome from RNA-seq reads. Nat. Biotechnol. 2015, 33, 290. [Google Scholar] [CrossRef]
  56. Lowe, T.M.; Eddy, S.R. tRNAscan-SE: A program for improved detection of transfer RNA genes in genomic sequence. Nucleic Acids Res. 1997, 25, 955–964. [Google Scholar] [CrossRef]
  57. Finn, R.D.; Bateman, A.; Clements, J.; Coggill, P.; Eberhardt, R.Y.; Eddy, S.R.; Heger, A.; Hetherington, K.; Holm, L.; Mistry, J.; et al. Pfam: The protein families database. Nucleic Acids Res. 2014, 42, D222–D230. [Google Scholar] [CrossRef]
  58. Chen, C.; Chen, H.; Zhang, Y.; Thomas, H.R.; Frank, M.H.; He, Y.; Xia, R. TBtools: An Integrative Toolkit Developed for Interactive Analyses of Big Biological Data. Mol. Plant 2020, 13, 1194–1202. [Google Scholar] [CrossRef]
  59. Wang, Y.; Tang, H.; Debarry, J.D.; Tan, X.; Li, J.; Wang, X.; Lee, T.H.; Jin, H.; Marler, B.; Guo, H.; et al. MCScanX: A toolkit for detection and evolutionary analysis of gene synteny and collinearity. Nucleic Acids Res. 2012, 40, e49. [Google Scholar] [CrossRef]
  60. Love, M.I.; Huber, W.; Anders, S. Moderated estimation of fold change and dispersion for RNA-seq data with DESeq2. Genome Biol. 2014, 15, 550. [Google Scholar] [CrossRef]
Figure 1. Genome assembly of M. laxiflora. (A). The field growth of M. laxiflora, which we named LS7. (B). Karyotype analysis plots used DAPI dye of M. laxiflora; bar = 10 μm. (C). Hi-C heatmap. The blue box on the diagonal represents the super-scaffold. The green box represents the contig., and the red represents the link intensity. (D). Circular representation of the pseudochromosomes. I: Ideogram of the 12 chromosomes, with scale in Mb. II: Gene density along each chromosome (number of genes per Mb). III: Repeat content along each chromosome (% nucleotides per Mb). IV: Copia retrotransposons content (% nucleotides per Mb). V: Gypsy retrotransposons content (% nucleotides per Mb). VI: SV density (% SV per Mb).
Forests 16 00295 g001
Figure 2. Insertion time distributions of Gypsy and Copia LTR (long terminal repeat–retrotransposons) elements. Mya means million years ago.
Forests 16 00295 g002
Figure 3. The phylogenetic relationships between M. laxiflora and other species. The numbers of gene expansions (red, +) and contractions (blue, −) are shown on the branches. The divergence times are displayed below the phylogenetic tree.
Forests 16 00295 g003
Figure 4. Distribution of AP2/ERF genes on 12 chromosomes of M. laxiflora genome. Colors in chromosomes represent gene density.
Forests 16 00295 g004
Figure 5. Phylogenetic tree of the AP2/ERF gene family from M. laxiflora and Arabidopsis. Different colors indicate the different subgroups.
Forests 16 00295 g005
Figure 6. Conserved motifs of MylAP2s/ERFs from M. laxiflora.
Forests 16 00295 g006
Figure 7. Gene structures and motif compositions of MylAP2s/ERFs from M. laxiflora. (A): Motif compositions of MylAP2s/ERFs. (B): Gene structures of MylAP2s/ERFs.
Forests 16 00295 g007
Figure 8. Gene duplication events between MylAP2/ERF genes from M. laxiflora. Gray lines indcate whole-genome synteny blocks, while red lines indicate replicated MylAP2/ERFs gene pairs.
Forests 16 00295 g008
Figure 9. Cis-acting elements in the promoter region of MylAP2/ERFs from M. laxiflora.
Forests 16 00295 g009
Figure 10. Expression patterns of MylAP2/ERF members in different tissues. The red color indicates a high expression level, and the blue signifies a low expression level.
Forests 16 00295 g010
Figure 11. Expression patterns of MylAP2/ERF under water flooding stress. The heatmap to the left shows the expression of MylaAP2/ERF members at different time points under flooding stress. R0–R48 represent the different time points after flooding stress. The right-side figure shows the 15 different expression profiles (profile 0–19) for these MylaAP2/ERF members under flooding stress.
Forests 16 00295 g011
Figure 12. Expression patterns of MylAP2/ERF49, MylAP2/ERF78, and MylAP2/ERF91 under flooding stress determined using qRT–PCR.
Forests 16 00295 g012
Table 1. Statistics of the M. laxiflora assembly.
SectionM. laxiflora
Size (bp)1,291,671,364
Contig N50 (Mb)29.52
Contig L5039
Contig N90 (Mb)0.96
Contig L90190
Chromosome number12
Scaffold number618
Busco93.00%
Repeat percentage76.16%
Table 2. Statistics of gene model features for M. laxiflora.
SectionResults
Genome size (bp)1,291,671,364
Repeat sequence (bp)996,660,267
Number of genes23,666
Gene average length (CDS)1311
Gene average length (DNA)6996
Exon number per gene5.79
Exon average length (bp)378
Genome GC content (%)34.32%
Table 3. Statistics of repeat elements in the genome of M. laxiflora.
ElementNumber of ElementsLength Occupied (bp)Percentage
Retroelements399,663383,047,69029.66%
       SINEs3552,029,4560.16%
       Penelope000.00%
       LINEs30,13118,800,8391.46%
       CRE/SLACS630140,2220.01%
          L2/CR1/Rex276116,5250.01%
          R1/LOA/Jockey000.00%
          R2/R4/NeSL996600,4920.05%
          RTE/Bov-B1846359,1320.03%
          L1/CIN426,38317,584,4681.36%
       LTR elements369,177362,217,39528.04%
        BEL/Pao798234,5610.02%
        Ty1/Copia79,47258,072,5414.50%
        Ty3-retrotransposons/DIRS1267,560281,010,28021.76%
           Retroviral000.00%
DNA transposons161,68492,770,6237.18%
       obo-Activator78,53338,677,2312.99%
       Tc1-IS630-Pogo48470,8900.01%
       En-Spm000.00%
       MuDR-IS905000.00%
       PiggyBac000.00%
       Tourist/Harbinger79973,859,6620.30%
       Other (Mirage, P-element, Transib)000.00%
Rolling circles61295,289,1210.41%
Unclassified820,451357,710,55927.69%
Total interspersed repeats 833,528,87264.53%
Small RNA484510,899,5260.84%
Satellites:411314,453,3541.12%
Simple repeats222,441119,244,5499.23%
Low complexity33,66213,244,8451.03%
Disclaimer/Publisher’s Note: The statements, opinions and data contained in all publications are solely those of the individual author(s) and contributor(s) and not of MDPI and/or the editor(s). MDPI and/or the editor(s) disclaim responsibility for any injury to people or property resulting from any ideas, methods, instructions or products referred to in the content.

