Abstract
Identification of paleoclimate oscillation from various climate proxies across different regions is important for the mechanistic research of paleoclimate. Phytoliths from the lacustrine sediment of central NE China were extracted for paleoclimate reconstruction and abrupt event recognition. The combined phytolith assemblages; indices of Iw, Iph, D/P, Pi/P, and T/P; and the 66.4% PCA information with 95% confidence ellipse showed six global synchronously paleo-stages in the past 25,000 years: mixed coniferous broadleaf forest in a semi-humid cool climate (25,165–22,180 cal aB.P.), cold and arid steppe (22,180–18,080 cal aB.P.), semi-humid and semi-arid steppe (18,080–11,380); semi-humid cool grassland (11,380–7790 cal aB.P.), humid warm forest steppe (7790–4300 cal aB.P.), and semi-arid and cool meadow steppe (4300 cal aB.P. to the present). The global abrupt events of the 4.2-kiloyear event, 8.2-kiloyear event, Younger Dryas (YD), Heinrich1 (H1), and Heinrich2 (H2) were also captured by phytolith indices. The regional character of the reduction in humidity of the YD might have been affected by the combined influence of the Okhotsk High and the surrounding mountains. These findings not only strengthen phytolith palaeoresearch but also provide basic information for the mechanistic research of palaeoclimate in the edge area of Northeast Asia and promote global climate change research.
1. Introduction
Paleoclimatic event research is important for understanding the evolution of the Earth’s climate system to predict future climate changes [1]. The Earth has experienced dramatic climate changes since the Last Glacial Maximum (LGM), encompassing various climate scenarios that may occur in the future [2]. The period since 25 kyr B.P. is regarded as a focused interval for palaeoclimate reconstruction to better understand climate-changing patterns [3,4]. Research has been conducted using vegetation inversion models [2,3], dynamic downscale simulation [4,5,6], integrated multi-indicator analysis [7,8,9], etc. Such studies have provided basic data for research on climate processes. However, the achievements have varied from place to place, which affects our understanding of the mechanisms of climate events and regional responses. The strengthening of regional research is an important way to improve this situation.
The central Songnen Plain of Northeast China is a low-lying depression (Figure 1) located in the northern marginal zone of the East Asian summer monsoon. The ecosystem is sensitive and fragile and is dominated by desert and arid–semiarid grassland (perennial herbaceous) [10,11,12,13,14]. The accumulated thick Quaternary sediments contain various indices for high-resolution palaeoclimate research since the Last Glacial Maximum [15,16,17,18,19]. Some research has been conducted on the palaeovegetation process [20,21,22], the palaeotemperature sequence [23], climate events [24,25,26,27,28,29], etc. Most of these studies have mainly focused on the most recent 15,000 years around mountainous lakes and peatlands. Fewer high-resolution studies have been conducted in the central plain, proceeding slowly. High-resolution paleoclimate processes and paleoclimatic event analysis are urgent and necessary to improve palaeoresearch in Northeast China.
The characteristics of plant classification [30,31] and the ease of in situ perversion of phytoliths show their potential to facilitate precise results in palaeoclimate research [32]. It has been 190 years since phytolith research began in the form of a shape study for plant classification [33]. Recent research has demonstrated that phytoliths of the saddle, trapeziform sinuate, scutiform, etc., are in agreement with the plant taxa [34,35,36,37]. Although the calibrated phytolith D/P (broad-leaved tree cover density), Pi/P (pine cover density), T/P (tree cover density), Iw (warm index), and Iph (humidity-aridity index) indices, as well as transfer models, have differentiated herbaceous and woody communities and Poaceae and non-Poaceae, in addition to revealing the paleoclimatic process [38,39,40,41,42,43,44,45], advancing quantitative paleoclimate reconstructions [46,47,48], there are still many discussions on its function. To fully exploit its unique advantages in reconstructing climate changes, it is necessary to verify the phytolith-based paleoclimate evolution of strata older than the Holocene.
In January 2021, a core in the central Lamasi Lake, Songnen Plain (Figure 1), was drilled. Accelerator Mass Spectrometry Carbon-14 (AMS14C) dated the sediments at a depth of 558 cm to 25 ka B.P., indicating that the sediments at 558–0 cm represent fluvial–lacustrine deposits of the Daxingtun Formation and Holocene lacustrine deposits. In this paper, in situ phytoliths from the 1 cm interval samples were analyzed for local palaeovegetation and palaeoclimate reconstruction [49,50]. The Heinrich2 and Heinrich1 events, the Younger Dryas, the 8.2-kiloyear event, and the 4.2-kiloyear event in the past 25,000 years were recognized, with strong synchronization to global climate changes. However, fewer precipitation changes during Younger Dryas showed differing regional characteristics relative to other areas in Northeast China. This is hypothesized to be due to the local performance of Okhotsk High in a special geographical and geomorphological background. These results not only strengthen the phytolith’s function in paleo-research on the Pleistocene but also provide important information for palaeoclimate research in the edge area of the Northeast Asian monsoon.

Figure 1.
Geographic location of the study area. (a) Map of the extent of the study area in China. (b) Topographic map of the study area. Solid arrows indicate the dominant directions of the Northeast Monsoon and Subtropical Monsoon, originating from the Okhotsk High and the Western Pacific Subtropical High, respectively. Modified from the Atlas of Physical Geography of China [51]. (c) The exact location of Lamasi Lake, with the drilling location.
2. Materials and Methods
2.1. Overview of the Study Area
The central Songnen Plain in Northeast China is an alluvial plain formed by the Songhua River, Nenjiang River, Hulan River, Lalin River, Taoer River, Wuyur River, and Shuangyang River. The region is dotted with various lakes, and the Quaternary sediments are thick. With a cold, dry winter and warm, rainy summer, the annual precipitation ranges from 529.7 to 644.8 mm, indicating poor arid and semi-arid hydrothermal conditions.
The core is located in the central part of Lamasi Lake (124°5′47.56″ E, 46°17′38.69″ N) (Figure 1), southwest of Heilongjiang Province. The water surface elevation is 137.5 m, with an area of 51 km2, a maximum depth of 3.7 m, and a storage capacity of 1.5 × 10⁸ m3. It spans semi-arid and cold–temperate continental monsoon zones, with black soils, chernozem soil, meadow soils, and saline and alkaline soils distributed in the surrounding area.
The vegetation here is meadow grassland, with common shrubs such as Armeniaca sibirica, Salix mongolica, and Lespedeza davurica and major herbaceous plants such as Stipa baicalensis, Stipa capillata, Filifolium sibiricum, Hemarthria sibirica, Chloris sibiricum, Leymus chinensis, Verbena sibirica, and Chloris virgata, Arundinella anomala, Calamagrostis epigeios, Achnatherum pekinense, Agropyron cristatum, etc. Carex neurocarpa, Thalictrum aquilegiifolium, Phragmites australis, Typha orientalis, etc., grow in some wet habitats. Ephedra sinica, Artemisia, Chenopodiaceae and some salt-tolerant grasses are common under poorer moisture conditions and in saline soils. Stipa grandis communities can be found on high terrain or the tops of dunes [52].
2.2. Sample Collection
The core was drilled using a deep-water sediment drill (SDIVC-D) produced by SDI in Dallas, TX, USA. It was sealed by freezing and transferred to PVC tubes after on-site description and photography. The lithological characteristics are described as follows:
Samples at 558–473 cm are characterized by dark-gray pelitic silt-fine sand and gray-green silt-fine sand. Samples at 473–379 cm are characterized by dark-yellow–gray pelitic silt and silty mud. At 379–284 cm, samples are characterized by dark-yellow–gray and gray–black silty mud, with relatively high moisture. Samples at 284–189 cm are characterized by gray–black and gray-green pelitic silt with high moisture content, while at 189–84 cm, samples are characterized by gray-green mud to yellow–gray and gray-black silty mud. Finally, at 84–0 cm, samples are characterized by gray-green to dark-green silty mud with yellow-brown rust spots.
For essential high-resolution palaeo-records [53,54] to distinguish palaeoclimatic events [55], continuous sampling was conducted at 1 cm intervals. Tools were cleaned before each sampling to avoid contamination, and the separated samples were sealed and refrigerated immediately.
2.3. Stratigraphic Dating
Six samples from depths of 45 cm, 95 cm, 145 cm, 224 cm, 419 cm, and 558 cm were selected for AMS14C dating at the Beta Analytic Laboratory in the United States. The dating results are presented in Table 1. For the surface sediments (0–20 cm), 210Pb dating was conducted at 1 cm intervals.

Table 1.
AMS14C dating of the sediments in the studied core.
The CRS model of the 210Pb activity index showed that the top 20 cm was deposited in 113 years (i.e., from 1908 to 2021 CE). A Bayesian time–depth model was constructed from the six AMS14C datings (Table 1) and the 210Pb dating using “WinBacon 2.2” and R software (4.1.2 version) (Figure 2) [56,57,58,59,60]. The results showed that this profile has been accumulated for approximately 25,000 years.
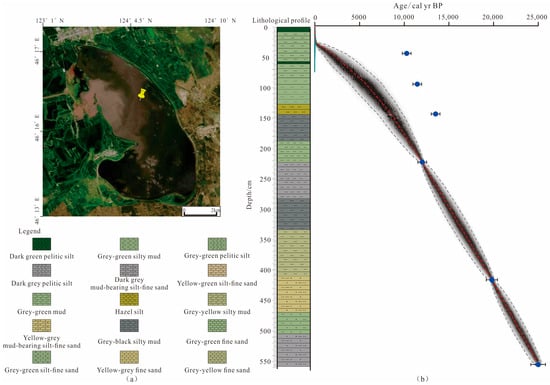
Figure 2.
(a) Drill location. (b) Bayesian time–depth curve for the drilled AMS14C profile. The red dotted line represents the weighted mean of the age-depth model, and the grey shading indicates the 95% confidence range.
The regional upper Quaternary strata here include the Middle–Upper Pleistocene Qiqihar Formation (Qp2–3q), the Upper Pleistocene Daxingtun Formation (Qp3d), Holocene high floodplain sediments (Qh1–2fp), low floodplain sediments (Qh2–3fp), lacustrine sediments (Qh3l), swamp sediments (Qh3s), and aeolian sediments (Qh3e) [61]. According to the regional background, the dark, gray–green, and gray–yellow silty sand–mud of 558–189 cm (fluvial-lacustrine facies) exhibited simultaneity with the Daxingtun Formation, which was found to be composed of sub-clay, sand, and silty sand, while the gray–black sandy mud at 189–0 cm (lacustrine facies) exhibited simultaneity with Holocene lacustrine sediments. Therefore, the studied section at 558–0 cm represents the Daxingtun Formation and the Holocene.
2.4. Experimentation and Data Processing
2.4.1. Phytolith Extraction and Identification
Procedures for phytolith extraction from sediments have been confirmed after various experiments and comparisons from the late 1940s to the early 21st century [62,63,64]. Based on previous results, a wet washing method was used to extract the phytoliths in this study: (1) a 1 g sample was weighed; (2) 10 mL of 10% HCl was added in a 60 °C shaking water bath to remove carbonates; (3) 10 mL of 40% HNO3 was used to remove organic matter; (4) a tablet of fully dispersed Lycopodium spores (10,315 grains) was added before washing to a neutral pH; (5) 2.38 g/mL ZnBr heavy liquid was used to separate the phytoliths; (6) samples were washed until a neutral pH was reached for slides made with Canada balsam.
Referring to the International Code for Phytolith Nomenclature ICPN1.0 [65], ICPN2.0 [66], and the research results of Wang Yongji and Lü Houyuan [67], identification was conducted under a 400× optical microscope. Over 350 forms were counted per sample [35,68].
2.4.2. Data Processing
Calculation of the phytolith-based palaeovegetation index:
D/P is the ratio of dicotyledon spherical morphotypes (D) versus Poaceae phytoliths (P) tracing broad-leaved tree cover density [36]. Poaceae phytoliths include bilobate, cross, saddle, trapeziform polylobate, bulliform flabellate, lanceolate, and elongated dentate forms.
Pi/P is the ratio of spherical pine with a socket morphotype (Pi) versus Poaceae phytoliths (P), recording pine cover density [69].
T/P is the sum of the Pi/P and D/P ratios, recording the overall tree (T) cover density or opening degree of vegetation. The use of these three ratios in phytolith sequences would greatly improve the reconstruction of pine timberline shifts, forest development, and spatial and temporal variations in the forest’s opening [69].
- (1)
- Calculation of the phytolith-based palaeoclimate index:
The warmth Index (Iw) is the ratio of the abundance of warm phytoliths to the total of warm and cool groups [70]. Warm phytoliths include saddle, bilobate, square, and bulliform flabellate forms. Cool phytoliths include elongate, lanceolate, trapeziform sinuate, and rondel forms.
The humidity–aridity index (Iph) is the percentage of Chloridoideae short-cell phytoliths relative to the sum of Panicoideae and Chloridoideae short-cell phytoliths [71]. Chloridoideae plants are represented by short saddle phytoliths, while Panicoideae plants are represented by bilobate and cruciform phytoliths.
3. Results
3.1. Phytolith Identification Results
A total of 14 types of phytoliths were identified in this profile: conifer type (Figure 3ag–ak), broad-leaved (Figure 3ad–af), bulliform flabellate (Figure 3w–y), short saddle (Figure 3f–h), long saddle (Figure 3i–j), hat (Figure 3d–e), trapeziform polylobate (Figure 3q–r), lanceolate (Figure 3s–t), entirely elongate (Figure 3ab), square, rectangle (Figure 3z–aa), Pteridophyte-type (Figure 3u–v), bilobate (Figure 3k–m), and cylindrical polylobate (Figure 3n).
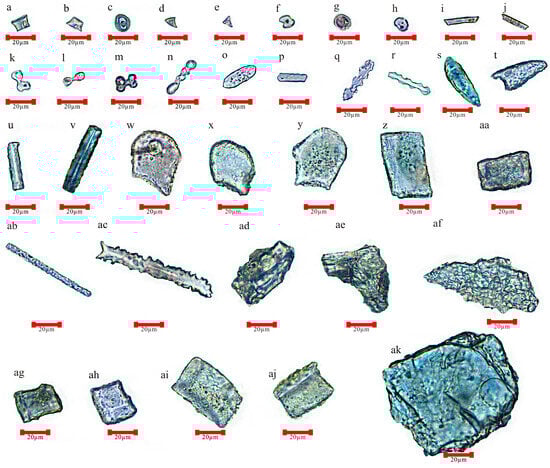
Figure 3.
Main phytolith types in the Lamasi Lake of the Songnen Plain over the past 25 kyrs. (a–c) flat hat; (d,e) point hat; (f–h) short saddle; (i,j) long saddle; (k–m) bilobate; (n) cylindrical polylobate; (o,p) trapeziform sinuate; (q,r) trapeziform polylobate; (s,t) lanceolate; (u,v) Pteridophyte-type; (w–y) bulliform flabellate; (z,aa) rectangle; (ab) entirely elongated; (ac) elongated dentate; (ad–af) broad-leaved blocky; (ag–ak) conifer-type blocky.
3.2. Phytolith Assemblage Zones
The phytolith concentrations and percentages fluctuated throughout the core (Figure 4 and Figure 5). The fluctuating zones were analyzed with Tilia software 2.0.41 based on the stratigraphically constrained cluster analysis of the incremental squares [72]. The profile was divided into six zones and several sub-zones. The same zone and sub-zone levels in the mean dendrogram revealed relatively homogeneous vegetation (Figure 4 and Figure 5):
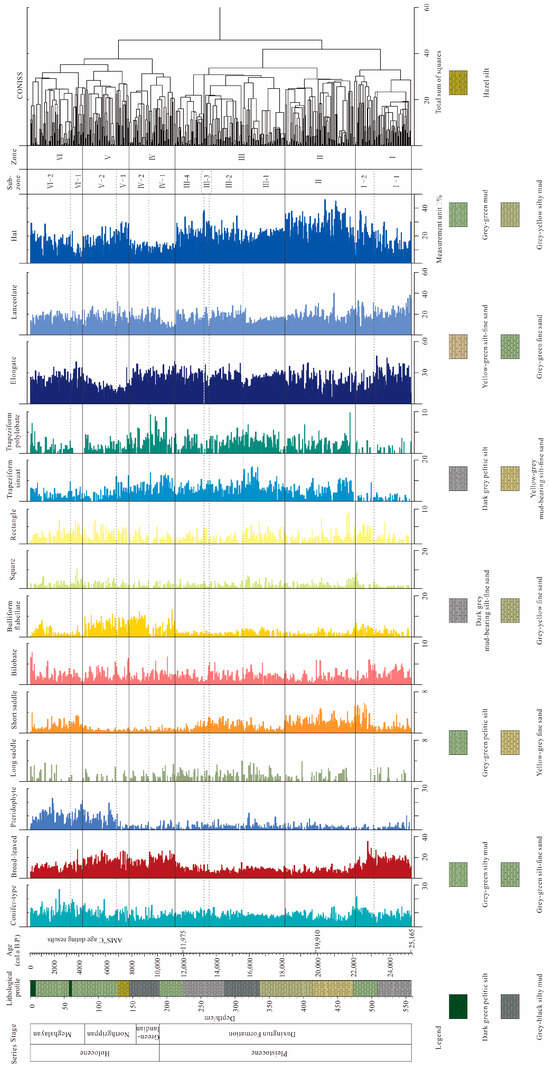
Figure 4.
Variation in the percentage content of phytoliths in the studied profile.
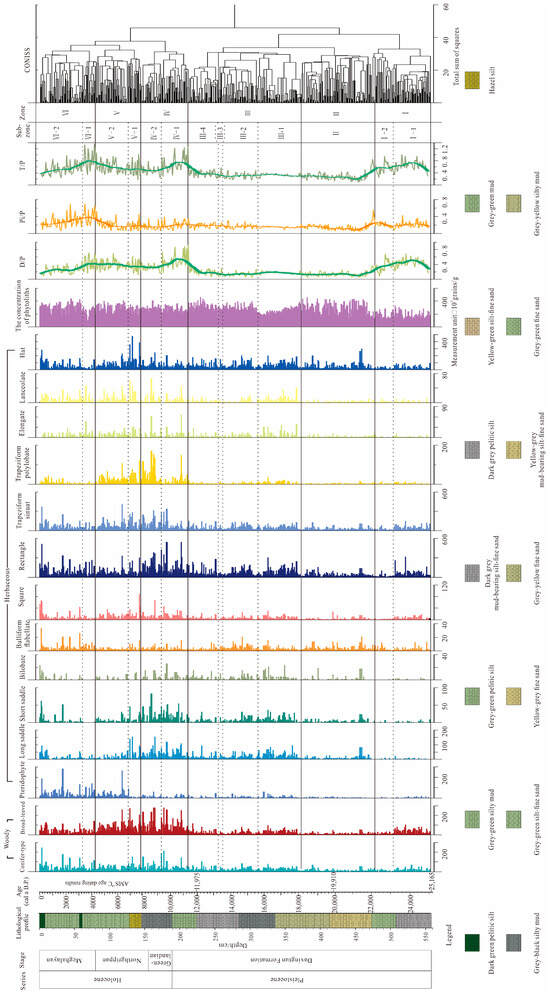
Figure 5.
Phytolith concentration and palaeovegetation index diagram on the studied profile.
Zone I: 558–478 cm (approx. 25,165–22,180 cal aB.P.): The average concentration of coniferous phytoliths was higher than that of broad-leaved phytoliths. The high D/P and T/P values and low contents of the short saddle, elongate, lanceolate, and hat phytoliths showed a weak herbaceous cover (Figure 5). These indicated a landscape of well-developed broad-leaved and conifer forest, with limited grassland cover. This zone was divided into two sub-zones:
Sub-zone I-1: 558–504 cm (approx. 25,165–23,160 cal aB.P.): The contents of short saddle, broad-leaved, and bulliform flabellate phytoliths increased slowly, while lanceolate phytoliths significantly decreased and elongate, conifer-type, trapeziform, and Pteridophyte-type phytoliths fluctuated.
Sub-zone I-2: 504–478 cm (approx. 23,160–22,180 cal aB.P.): The contents of saddle, bulliform flabellate, and conifer phytoliths increased noticeably, while hat, elongate, and rectangular phytoliths decreased.
Zone II: 478–373 cm (approx. 22,180–18,080 cal aB.P.): The total phytolith concentration reached the highest value in this zone. Woody phytoliths dropped significantly, while pteridophyte-type, elongate, bulliform flabellate, square, and rectangular phytoliths changed little, and trapeziform and saddle phytoliths significantly increased. This reflected a decrease in woody vegetation and an increase in herbaceous vegetation, together with the lower values of the D/P, Pi/P, and T/P indices (Figure 5).
Zone III: 373–212 cm (approx. 18,080–11,380 cal aB.P.): Woody plants and triangular herbaceous phytoliths rose in this zone. Trapeziform, saddle, bulliform flabellate, square, and rectangular phytoliths increased notably. The D/P, Pi/P, and T/P indices remained stable (Figure 5), indicating that diverse herbaceous vegetation dominated this zone, while the forest changed little. Four sub-zones were recognized:
Sub-zone III-1: 373–312 cm (approx. 18,080–15,600 cal aB.P.): Contents of broad-leaved, bilobate, saddle, bulliform flabellate, square, and rectangular phytoliths increased, while those of lanceolate, elongate, hat, trapeziform polylobate, and conifer phytoliths decreased.
Sub-zone III-2: 312–262 cm (approx. 15,600–13,560 cal aB.P.): The contents of broad-leaved, bilobate, saddle, bulliform flabellate, square, and rectangular phytoliths decreased gently, while lanceolate, elongate, hat, trapeziform polylobate, and conifer phytoliths increased.
Sub-zone III-3: 262–255 cm (approx. 13,560–13,280 cal aB.P.): The contents of broad-leaved, bilobate, saddle, bulliform flabellate, square, and rectangular phytoliths increased, while lanceolate, elongate, hat, trapeziform polylobate, and conifer phytoliths decreased.
Sub-zone III-4: 255–212 cm (approx. 13,560–11,380 cal aB.P.): The percentages of saddle, square, and rectangular phytoliths decreased significantly, but the contents of lanceolate, elongate, hat, trapeziform polylobate, and conifer phytoliths increased.
Zone IV: 212–145 cm (approx. 11,380–7790 cal aB.P.): The concentration of broad-leaved phytoliths increased significantly, and that of herbaceous phytoliths (trapeziform sinuate, trapeziform polylobate, elongate, lanceolate, bulliform flabellate, square, and rectangular) grew substantially (Figure 4 and Figure 5). Together with the increased D/P and T/P indices (Figure 5), these results indicated that forest plants were plentiful, although the herbaceous diversity remained high. This zone transitioned into a forest–steppe landscape dominated by broad-leaved forests, divided into two sub-zones:
Sub-zone IV-1: 212–174 cm (approx. 11,380–9340 cal aB.P.): The contents of broad-leaved, bilobate, saddle, bulliform flabellate, square, and rectangular phytoliths increased, while those of lanceolate, elongate, hat, trapeziform polylobate, and conifer phytoliths decreased.
Sub-zone IV-2: 174–145 cm (approx. 9340–7790 cal aB.P.): The contents of broad-leaved, bilobate, saddle, and square phytoliths decreased slightly, while bulliform flabellate and rectangular phytoliths increased significantly.
Zone V: 145–80 cm (approx. 7790–4300 cal aB.P.): Broad-leaved phytolith concentrations remained high. The concentration of pteridophyte and hat phytoliths increased significantly. The high and stable oscillating D/P value and increased Pi/P and T/P values suggested that the forest changed little, but the herbaceous diversity increased. It was a humid forest–steppe environment (Figure 5). This zone included two subzones:
Sub-zone V-1: 145–127 cm (approx. 7790–6820 cal aB.P.): Broad-leaved and bilobate phytoliths increased, and bulliform flabellate phytolith slightly decreased, but hat phytolith contents increased, which indicated sparsely treed grassland.
Sub-zone V-2: 127–80 cm (approx. 6820–4300 cal aB.P.): Pteridophyte and bulliform flabellate phytoliths increased significantly, while hat, trapeziform, and polylobate phytoliths decreased significantly.
Zone VI: 80–0 cm (approx. 4300 cal a B.P. to present): Broad-leaved phytoliths decreased, while conifer and triangular phytoliths increased notably. The decreased D/P and Pi/P indices reflected a significant forest decline, with herbaceous moisture expanded. This zone was also divided into two sub-zones:
Sub-zone VI-1: 80–62 cm (approx. 4300–3330 cal aB.P.): Broad-leaved, bilobate, saddle, bulliform flabellate, square, and rectangular phytoliths slightly increased, then decreased. Conifer elongate phytoliths significantly increased, while lanceolate, hat, and trapeziform polylobate phytoliths slightly decreased.
Sub-zone VI-2: 62–0 cm (approx. since 3330 cal aB.P.): Saddle, bulliform flabellate, bilobate, lanceolate, hat, and trapeziform polylobate phytoliths increased, while broad-leaved, square, and rectangular phytoliths decreased.
In the I-II zones, square, rectangular, and triangular rod-shaped fern phytolith concentrations were relatively low and changed little. Square and rectangular phytoliths mainly originate from the short cells or motor cells of Poaceae, which sometimes represent side views of each other [73]. Their contents reflect the water pressure for plant growth [74,75]. Ferns prefer moist conditions and are not cold-tolerant [76]. Therefore, combined with other phytolith types in these two zones, their relatively low concentrations indicated less herbaceous moisture in colder environments.
In summary, the above phytolith assemblage zones showed a vegetation process from mixed coniferous and broadleaf forests to cold, arid grasslands; semi-humid and semi-arid grasslands; humid forest grasslands; and semi-arid meadow grasslands in the past 25,000 years.
3.3. PCA Ordination of the Phytolith Assemblages
A total of 10 types of phytoliths, including conifer, broad-leaved, saddle, bulliform flabellate, bilobate, lanceolate, square, rectangular, triangular rod-shaped, and cylindrical polylobate, were selected for detrended correspondence analysis (DCA) to determine the appropriate ordination model. The results showed that the length of the first axis of the DCA was <15, and the sequence of phytolith types was linear. This indicated that the percentages of 10 major phytolith types can be processed with PCA ordination [77].
In Figure 6, the first and second axes capture 55.9% and 10.5% of the total variance, respectively, with a 95% confidence ellipse. On the axis of PC1, square, rectangular, triangular rod-shaped, bulliform flabellate, broad-leaved, lanceolate, saddle, and bilobate phytoliths have positive loadings, while conifer and trapeziform polylobate phytoliths have negative loadings. On the axis of PC2, square, rectangular, triangular rod-shaped, bulliform flabellate, and broad-leaved phytoliths have positive loadings, while trapeziform polylobate, saddle, bilobate lanceolate, and conifer phytoliths have negative loadings. Thus, PC1 represents the temperature, with higher loadings indicating higher temperatures, and PC2 represents humidity, with higher loadings indicating higher humidity.
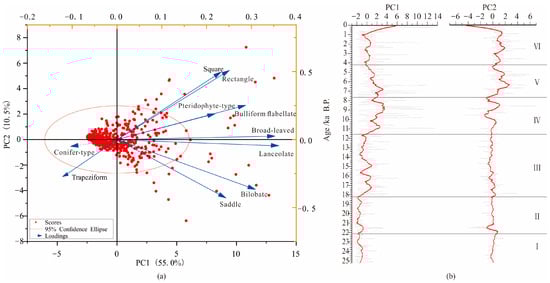
Figure 6.
PCA ordination of major phytolith types for the studied core. (a) Results of phytolith PCA analyses; (b) the score curves for the principal components (PC1, PC2). The roman numerals are the zone numbers following Figure 4 and Figure 5. The red lines are trend lines of PC1 and PC2 score changes with depth.
4. Discussion
4.1. Palaeoclimate Processes Indicated by Phytoliths
The succession of vegetation and corresponding climate process imply the interaction mechanisms between regional ecosystems and the global climate system. The vegetation in Songnen Plain is closely related to the East Asian summer monsoon and shows high sensitivity to climate changes [78,79]. Since the LGM, with climate fluctuation, it has alternated between grassland and forest many times [8].
The palaeoclimatic indices (Iw and Iph) established based on the morphology of Poaceae phytoliths greatly promoted climate research [70,74,80,81,82,83]. In this paper, the warm index ranged from 0.1 to 0.4 and was classified into three levels: cold (0.1 < Iw < 0.2), cool (0.2 < Iw < 0.3), and warm (0.2 < Iw < 0.3) (Figure 7). The Iph index ranged from 0.15 to 0.75 and was classified into four levels: humid (0.15 < Iph < 0.3), semi-humid (0.3 < Iph < 0.45), semi-arid (0.45 < Iph < 0.6), and arid (0.6< Iph< 0.75). Combined with the PCA ordination (Figure 6), the D/P, Pi/P, and T/P indices and paleoclimate process were deduced as follows (Figure 7):
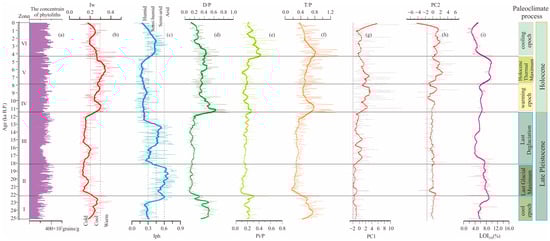
Figure 7.
The paleoclimate process documented by phytoliths in the studied profile. (a) Changes in phytolith concentration; (b) the Iw index curve; (c) the Iph index curve; (d) the D/P index curve; (e) the Pi/P index curve; (f) the T/P index curve; (g) the score curve of the first principal component axis (PC1); (h) the score curve of the second principal component axis (PC2); (i) LOI550 curve. From b to i, the fine serrated line represents the index changes with depth and the thickened line in it represents the index changing trend.
For 25,165~22,180 cal aB.P., the average Iw was 0.25, and the average Iph was 0.37, indicating a cool and humid climate. The low phytolith concentration and loss on ignition (LOI550) reflected low herbaceous cover because trees contribute fewer phytoliths and less loss on ignition than herbaceous vegetation. Bases on the combination of high values of the D/P, and T/P indices; low PC1 values; and the dark-gray–green silty sand, it can be inferred that the lakeshore of Lamasi Lake was dominated by mixed coniferous and broad-leaved forest and that the climate was cool and humid. The vegetation around Wudalianchi also indicated a cool and humid climate. It was a little warmer and wetter than the following LGM period, and we called it a “cool epoch”.
For 22,180–18,080 cal aB.P., the average values of Iw (0.15) and Iph (0.59); the high phytolith concentration and LOI550; and the low D/P, Pi/P, T/P, and PC1 indices corresponded to the coldest and driest state. This was also reflected by the deep-yellow silty mud. During this period, glaciers in the Alps, North America, and North Europe extended [6], the sea level declined [84], and herbaceous vegetation in East Asia expanded [8], expressing characteristics of the Last Glacial Maximum (LGM). Therefore, it was inferred to be the LGM.
For 18,080–11,380 cal aB.P., the Iw and Iph indices reflected a cool–wet to cold–dry fluctuation. The higher PC1 values and dark-gray–green sediments also reflected such conditions (Figure 7). Pollen data from Sihailongwan [27] and the C27/C31 values from the Hohor Basin verified this fluctuating phase—the Last Deglaciation [85]. It was generally cold and dry, including several brief warm intervals, showing global synchronization [86,87].
For 11,380–7790 cal aB.P., the increased D/P and T/P indices showed that forests thrived again. The increased PC1 implied mild temperatures, and PC2 implied fluctuations in humidity. Based on the rising Iw (0.28) and LOI550 and falling Iph (0.23), a moderate warming and humid state was inferred. From a global perspective, this warming occurred in northern Europe, North America, South America, and Northeast Asia [88,89,90], corresponding to the early Holocene, which we called a “warming epoch”.
For 7790–4300 cal aB.P., the high phytolith concentration, D/P, PC1, PC2, and LOI550 reflected lusher vegetation. The Iw (0.31) and Iph (0.22) indicated warm and humid conditions, which were verified by gray–yellow and gray–green sediments. This was widely recognized as the most favorable climatic phase of the Holocene, referred to as the “Holocene Thermal Maximum” or the “Great Warm Period” [91].
From 4300 cal aB.P. to present, the decreased Iw and increased Iph indicated a cooler and drier climate, and the decreased D/P, T/P, PC1, PC2, and LOI550 confirmed the transition from warm and humid to cooler and semi-arid. During this period, a cooling and drought climate was exhibited in the Qinghai-Tibet Plateau, Xinjiang, and the Loess Plateau [92], as well as other regions in the north hemisphere [93,94]. It belonged to the late Holocene, and we named it a “cooling epoch”.
In summary, in the phytolith assemblages zones (Figure 4 and Figure 5), the Iw and Iph indices (Figure 7) clearly showed six climate transitions in the past 25,000 years: a semi-humid and cool epoch called a “cool epoch” before the Last Glacial Maximum; an arid and cold epoch during the LGM; a semi-humid, semi-arid, and cold epoch during the Last Deglaciation; a semi-humid and cool epoch called a “warming epoch”; a humid and warm during epoch the Holocene Thermal Maximum; a semi-arid and cool epoch called a “cooling epoch”—all of which were inferred to the Late Pleistocene and Holocene through the PC1 and PC2 of phytolith PCA ordination (Figure 7).
4.2. The Global Climate Events Discovered by Phytoliths
Since 25 ka B.P., the northern hemisphere has experienced a series of rapid climate oscillations, including the Heinrich2 (H2), Heinrich1 (H1), Younger Dryas (YD), 8.2 kyr event, and 4.2 kyr event. These rapid oscillations have been recorded differently in numerous climatic proxies across different regions [95,96,97]. In the central Songnen Plain of Northeast China, these events were also captured by the phytoliths from lacustrine sediments.
Heinrich 2: In this profile, about 22,500 cal a B.P., the Iph suddenly increased, while the Iw sharply decreased, indicating a temperature drop and a rapid shift to drier conditions. This sudden drought lasted nearly 1000 years, corresponding to the rangeability and duration of Heinrich 2 [98,99,100]. This might be a weakening manifestation of the Asian summer monsoon in the Songnen Plain, which caused drought and continuous cooling in many regions in northern Asia [101,102].
Heinrich 1: About 16,200 cal aB.P., the Iw sharply decreased, while the Iph sharply increased, indicating another sudden cooling and drying event after the H2 event. The coarser loess particles near the Great Khinggan Mountains indicated reduced precipitation and lower temperatures [2]. Pollen from Hulun Lake shows a sharp temperature drop and significant aridification [103]; this can also be found across Asia [104], the Hexi Corridor [105], and the Loess Plateau [106]. Therefore, this event represents the Heinrich 1 (H1), which occurred in the Songnen Plain and corresponded to global changes.
Younger Dryas: About 11,000 cal aB.P., the Iw plummeted, while the Iph increased slightly, reflecting a marked cooling but limited humidity changes. At this time, Hulun Lake was occupied by desert grassland [97], Moon Lake in the Great Kingan Mountains experienced a cooling winter [107], and Xiaolongwan Lake showed increased moisture [108]. Judging from these synchronous phenomena, the 11, 000 cal aB.P. cooling event was inferred to be the Younger Dryas, though it slightly lagged behind other regions.
The 8.2-kyr event: This abrupt event occurred about 8400 cal aB.P., with decreased warm and arid indices, signaling a slightly cooler and wetter shift. The International Stratigraphic Commission defines the sudden temperature drop about 8300 years ago as the onset of the Northgrippian; here, the abrupt change happened about 8400 years ago. It could mark the beginning of the mid-Holocene in this region.
The 4.2-kyr event: About 4600 cal aB.P., the humidity–aridity index (Iph) significantly increased, while the warmth index (Iw) sharply decreased, indicating rapid cooling and aridity; a sudden reduction in LOI550 verified this phenomenon. This cooling event was recorded at 4.0 ka B.P. in the Gushantun Bog [109], 3.9 ka B.P. in the Jinchuan peat bog [110], and 4.11 ka B.P. in the Erlongwan maar lake [111], as well as in North America, Africa, the Middle East, and India [112]. It might mark the end of the Mid-Holocene and the beginning of the Late Holocene in the central Songnen Plain, Northeast China.
4.3. Differences in Climate Events
In this study, the phytolith indices expressed the H2, H1, YD, 8.2 kyr, and 4.2 kyr events obviously, which synchronized with the oxygen isotope record in the Antarctic EDML ice core [113], the Greenland NGRIP ice core [114,115], and the global CO2 concentration changes [116], showing global characteristics.
The H2 (22,500–21,500 cal aB.P.) and H1 (16,500–15,200 cal aB.P.) events were both severely cold and arid, consistent with the phenomena in the northern hemisphere. In this profile, the temperature’s phytolith index lagged behind humidity drops. This indicated that the cooling event occurred in a context of increasing aridity.
The YD event was one of the most severe disasters since the Last Deglaciation. The abrupt cooling led to significant deterioration of the terrestrial environment, with different exhibitions across various regions [117]. It was expressed as dry in Qinghai Lake [118], Tengger Desert [119], the Loess Plateau [120,121], SE China [122], Hulun Lake [123], Moon Lake [124], some Marr lakes in Changbai Mountain [24,28,108,125], etc. It also showed wet conditions in the Baxie Loess of central China [126], Sifangshan Lake [127], Tuofengling Lake [29], Wudalianchi Lake, and Hani peat [23,128,129]. In this study, the Younger Dryas (YD) event (11,000–10,000 years ago) displayed an abrupt temperature drop in a warming trend, but the humidity changed little (Figure 7 and Figure 8).
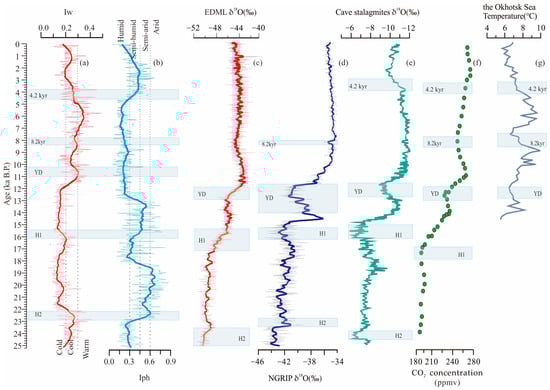
Figure 8.
Comparison of the phytolith index from the studied core and representative curves of Heinrich events from other regions. (a) Changes in the Iw index at Lamasi Lake; (b) changes in the Iph index at Lamasi Lake; (c) δ18O record from Antarctic ice core EDML [113]; (d) δ18O record from Greenland ice core NGRIP [114,115]; (e) δ18O record from Dongge–Hulu–Sanbao cave stalagmites in China [130]; (f) changes in global CO2 concentration range [116]; (g) reconstructed sea temperatures of the Sea of Okhotsk [131]. The fine serrated line in a-d represents the index changes with depth and the thickened line in it represents the index changing trend.
Factors influencing regional humidity changes during YD events have been discussed for many years. Different interpretations have been proposed, including an Arctic ice-shelf collapse, North Atlantic circulation changes, heat absorption by the ice sheet, weakened East Asian summer winds [132,133], southern attacks of Siberian–Mongolian cold and high pressure, etc. [134]. There are also different opinions on the above two kinds of humidity changes in Northeast China. Hong asserted that the increased humidity in Hani was caused by the northward movement of the subtropical high [23], while Chen suggested that the strengthening of the Okhotsk high pressure increased moisture availability in Northeast China [135]. Zhang assumed that the weak East Asia Summer Monsoon (EASM) and the strong Northeast Monsoon (NEM) (controlled by the Okhotsk High) were the main water sources in NE China during the period of 16–12 cal ka BP [136]. Some other scholars have also proposed that the wetter conditions during the YD were a response to the Okhostsk High [108,128,129].
The Okhotsk High does control precipitation in Northeast China. When it interacts with the West Pacific Subtropical High, “double trough and single ridge” circulation forms and causes excessive precipitation in Northeast China [137]. Before the YD event, the global sea level had expanded and shortened water vapor transport from the Pacific to East Asia [135,138,139]. When the abrupt YD appeared, the surface temperature of the Okhotsk Sea declined, and sea ice expanded (Figure 8g), which strengthened the Okhotsk High and transported more moisture to the Far East and Northeast China [131,140]. Therefore, it was wetter in Sifangshan Tianchi [127], Tuofengling Lake [29], and Wudalianchi Lake [129] during the YD event. But this studied profile is located in the lowest central Songnen Plain. The surrounding Lesser Khingan Mountain and Changbai Mountain obstruct the moisture input. The arrived water vapor significantly lessened after crossing the Stanovoy Range and the Lesser Khingan Mountains. Compared with Sifangshan Lake, Tuofengling Lake, and Wudalianchi Lake, the relatively less severe humidity change in this profile might be affected by the combined influence of the Okhotsk High and the topography around central Northeast China.
5. Conclusions
- In the central plain of Northeast China, the paleoclimate process indicated by phytoliths in the past 25,000 years was mixed coniferous–broadleaf forest in a semi-humid cool climate (25,165–22,180 cal aB.P.); cold and arid steppe (22,180–18,080 cal aB.P.); semi-humid and semi-arid steppe (18,080–11,380); semi-humid cool grassland (11,380–7790 cal aB.P.); humid, warm forest–steppe (7790–4300 cal aB.P.); and semi-arid and cool meadow–steppe (4300 cal aB.P. to the present).
- Rapid climate oscillations, including the Heinrich2 (H2), the Heinrich1 (H1), the Younger Dryas (YD), the 8.2 kyr event, and the 4.2 kyr event, were captured synchronously by the phytoliths from lacustrine sediments in the central Northeast China.
- During the YD period, the less severe humidity change in this profile might have been affected by the combined influence of the Okhotsk High and the topography around central Northeast China.
Author Contributions
Y.L.: writing—original draft, software, methodology, investigation, formal analysis, and conceptualization; X.Z.: writing—review and editing, supervision, project administration, investigation, funding acquisition, and conceptualization; J.W.: writing—review and editing and conceptualization; S.F.: writing—review and editing, supervision, funding acquisition, and conceptualization; Y.H.: writing—review and editing and sample collection; J.L.: writing—review and editing and sample collection. All authors have read and agreed to the published version of the manuscript.
Funding
This research was funded by the National Natural Science Foundation of China (grant number 40702027).
Data Availability Statement
The datasets generated and analyzed during the current study are available from the corresponding author upon reasonable request.
Acknowledgments
We would like to express our gratitude to the anonymous reviewers for their helpful comments, which helped us improve the manuscript significantly.
Conflicts of Interest
The authors declare that they have no known competing financial interests or personal relationships that could have appeared to influence the work reported in this paper.
References
- Ren, G.Y.; Jiang, D.B.; Yan, Q. Characteristics, drivers and feedbacks of palaeo-climatic variations and the implications for modern climate change research. Quat. Sci. 2021, 41, 824–841. [Google Scholar] [CrossRef]
- Yang, S.L.; Dong, X.X.; Xiao, J.L. The East Asian Monsoon since the Last Glacial Maximum: Evidence from geological records in northern China. Sci. China Earth Sci. 2019, 62, 1181–1192. [Google Scholar] [CrossRef]
- Wu, H.N.; Zhang, C.X.; Zhao, H.K.; Zhang, L.L.; Zhao, L. Vegetation succession and its response to climate changes since the Last Glacial Maximum on the Loess Plateau of Central Gansu, Northwest China. Chin. J. Ecol. 2020, 39, 2488–2500. [Google Scholar] [CrossRef]
- Jiang, D.B.; Tian, Z.P. Last Glacial Maximum and mid-Holocene water vapor transport over East Asia: A modeling study. Quat. Sci. 2017, 37, 999–1008. [Google Scholar] [CrossRef]
- Kuang, X.Y.; Han, Y.C.; Wang, Z.Y. Dynamic downscaling simulation of millennial climate in China since the Last Glacial Maximum—Climate comparison of three typical periods. Quat. Sci. 2021, 41, 842–855. [Google Scholar] [CrossRef]
- Gobbo, C.D.; Gobbo, C.D.; Colucci, R.R.; Colucci, R.R.; Monegato, G.; Žebre, M.; Giorgi, F. Atmosphere–cryosphere interactions during the last phase of the Last Glacial Maximum (21 ka) in the European Alps. Clim. Past 2023, 19, 1805–1823. [Google Scholar] [CrossRef]
- Wu, H.B.; Li, Q.; Yu, Y.Y.; Sun, A.Z.; Lin, Y.T.; Jiang, W.Q.; Luo, Y.L. Quantitative climatic reconstruction of the Last Glacial Maximum in China. Sci. China Earth Sci. 2019, 62, 1269–1278. [Google Scholar] [CrossRef]
- Li, X.Q.; Zhao, C.; Zhou, X.Y. Vegetation pattern of Northeast China during the special periods since the Last Glacial Maximum. China Earth Sci. 2019, 62, 1224–1240. [Google Scholar] [CrossRef]
- Zhang, R.; Li, Q.; Yong, X.Y.; Yu, M.Q. Quantitative reconstruction of palaeovegetation history in Northeast China and its response to climate change since the Last Glacial Maximum. Quat. Sci. 2024, 44, 805–822. [Google Scholar] [CrossRef]
- Qiu, S.W.; Jiang, P.; Li, F.H.; Xia, Y.M.; Wang, M.H.; Qang, P.F. A preliminary study on the evolution of the natural environment since the Late Glacial in Northeastern China. Acta Geogr. Sin. 1981, 36, 315–327. [Google Scholar] [CrossRef]
- Zhang, X.S.; Zhou, G.S.; Gao, Q.; Yang, D.A.; Ni, J.; Wang, Q.; Tang, H.P. Northeast China transect (NECT) for global change studies. Earth Sci. Front. 1997, 4, 145–152. [Google Scholar]
- Cheng, J.M.; Jing, G.H.; Wei, L.; Jing, Z.B. Long-term grazing exclusion effects on vegetation characteristics, soil properties and bacterial communities in the semi-arid grasslands of China. Ecol. Eng. 2016, 97, 170–178. [Google Scholar] [CrossRef]
- Li, B.; Huang, F.; Qin, L.J.; Qi, H.; Sun, N. Spatio-Temporal Variations of Carbon Use Efficiency in Natural Terrestrial Ecosystems and the Relationship with Climatic Factors in the Songnen Plain, China. Remote Sens. 2019, 11, 2513. [Google Scholar] [CrossRef]
- Li, C.J.; Fu, B.J.; Wang, S.; Stringer, L.C.; Wang, Y.P.; Li, Z.D.; Liu, Y.X.; Zhou, W.X. Drivers and impacts of changes in China’s drylands. Nat. Rev. Earth Environ. 2021, 2, 858–873. [Google Scholar] [CrossRef]
- Gui, Z.F.; Xue, B.; Yao, S.C.; Wei, W.J. Responses of lakes in the Songnen Plain to climate change. J. Lake Sci. 2010, 22, 852–861. [Google Scholar] [CrossRef]
- Yin, Z.Q.; Qin, X.G. The Yushu loess deposition in eastern Songnen Basin since the last glacial period and its environmental significance. Geol. China 2010, 37, 212–222. [Google Scholar] [CrossRef]
- Zheng, Y.H.; Pancost, R.D.; Naafs, B.D.A.; Li, Q.Y.; Liu, Z.; Yang, H. Transition from a warm and dry to a cold and wet climate in NE China across the Holocene. Earth Planet. Sci. Lett. 2018, 493, 36–46. [Google Scholar] [CrossRef]
- Zhang, X.R.; Ping, S.F.; Jiao, J.Y.; Liu, E.H. Characteristics of Magnetic Susceptibility, Grain Size and Chromaticity of Modern Sediments in the Southern Margin of Songnen Plain and Their Palaeoclimate Environment Significance. J. Jilin Univ. 2020, 50, 465–479. [Google Scholar] [CrossRef]
- Song, Y.H.; Liu, K.; Dai, H.M.; Xu, J.; Zhang, Z.H.; Liang, S. Palynological assemblages of typical black soil profile in the eastern Songliao Plain and their age and its implication for palaeoclimatic. Geol. Bull. China 2022, 41, 1528–1538. [Google Scholar] [CrossRef]
- Wang, P.F.; Xia, Y.M. Preliminary research of vegetational succession on the Song-nen Plain since Late Pleistocene. Bull. Bot. Res. 1988, 8, 87–96. [Google Scholar]
- Qiu, S.W.; Li, Q.S.; Xia, Y.M. Palaeosols of sandy lands and environmental changes in the western plain of northeast China during Holocene. Quat. Sci. 1992, 12, 224–232. [Google Scholar]
- Yuan, S.M.; Sun, X.J. The vegetational and environmental history at the west foot of Changbai Mountain, Northeast China during the last 10,000 years. Bull. Bot. 1990, 32, 558–568. [Google Scholar] [CrossRef]
- Hong, B.; Hong, Y.T.; Lin, Q.H.; Shibata, Y.; Uchida, M.; Zhu, Y.X.; Leng, X.T.; Wang, Y.; Cai, C.C. Anti-phase oscillation of Asian monsoons during the Younger Dryas period: Evidence from peat cellulose δ13C of Hani, Northeast China. Palaeogeogr. Palaeoclimatol. Palaeoecol. 2010, 297, 214–222. [Google Scholar] [CrossRef]
- You, H.; Liu, J. High-resolution climate evolution derived from the sediment records of Erlongwan Maar Lake since 14 ka BP. Chin. Sci. Bull. 2012, 57, 3610–3616. [Google Scholar] [CrossRef]
- Wu, J.; Liu, Q. Charcoal-recorded climate changes from Moon Lake in Late Glacial. Chin. J. Geol. 2013, 48, 860–869. [Google Scholar] [CrossRef]
- Meng, P.; Wang, Y.L.; Wang, Z.X.; Wang, G.; Wang, Y.X. Compound-specific Carbon Isotopic Characteristics of n-alkanes in Xianghai Lake Sediments of Northeast China and Their Palaeoenvironmental Implications. J. Earth Sci. Environ. 2014, 36, 110–120. [Google Scholar] [CrossRef]
- Mingram, J.; Stebich, M.; Schettler, G.; Hu, Y.Q.; Rioual, P.; Nowaczyk, N.; Dulski, P.; You, H.T.; Opitz, S.; Liu, Q.; et al. Millennial-scale East Asian monsoon variability of the last glacial deduced from annually laminated sediments from Lake Sihailongwan, N.E. China. Quat. Sci. Rev. 2018, 201, 57–76. [Google Scholar] [CrossRef]
- Sun, Q.; Chu, G.Q.; Xie, M.M.; Ling, Y.; Su, Y.L.; Zhu, Q.Z.; Shan, Y.L.; Liu, J.Q. Long-chain alkenone-inferred temperatures from the last deglaciation to the early Holocene recorded by annually laminated sediments of the maar lake Sihailongwan, northeastern China. Holocene 2018, 28, 1173–1180. [Google Scholar] [CrossRef]
- Sun, W.W.; Zhang, E.L.; Liu, E.F.; You, Y.; Li, J.J.; Ni, Z.Y.; Meng, X.Q.; Zhang, W.F.; Chen, R. Hydroclimate changes since the last glacial maximum from sedimentary biomarkers in a crater lake in the Great Khinggan Mountains, Northeast China. Quat. Sci. Rev. 2023, 312, 108175. [Google Scholar] [CrossRef]
- Lü, H.Y.; Liu, T.S.; Wu, N.Q.; Han, J.M.; Guo, Z.T. Phytolith record of vegetation succession in the southern Loess Plateau since Late Pleistocene. Quat. Sci. 1999, 19, 336–349. [Google Scholar]
- Lü, H.Y.; Jia, J.W.; Wang, W.M.; Liao, G.B. On the meaning of phytolith and its classification in Gramineae. Acta Micropalaeontologica Sin. 2002, 19, 389–396. [Google Scholar] [CrossRef]
- Lü, H.Y.; Liu, D.S.; Guo, Z.T. Geology of the Loess Plateau, the status of research on palaeovegetation during the historical period. Chin. Sci. Bull. 2003, 48, 2–7. [Google Scholar] [CrossRef]
- Hart, T.C. Issues and directions in phytolith analysis. J. Archaeol. Sci. 2016, 68, 24–31. [Google Scholar] [CrossRef]
- Wu, N.Q.; Lü, H.Y.; Nie, G.Z.; Wang, Y.J.; Meng, Y.; Guo, G.A. The study of phytoliths in C3 and C4 grasses and its palaeoecological significance. Quat. Sci. 1992, 12, 241–251+289–290. [Google Scholar]
- Piperno, D.R.; Becker, P. Vegetational History of a Site in the Central Amazon Basin Derived from Phytolith and Charcoal Records from Natural Soils. Quat. Res. 1996, 45, 202–209. [Google Scholar] [CrossRef]
- Alexandre, A.; Meunier, J.D.; Lézine, A.M.; Vincens, A.; Schwartz, D. Phytoliths: Indicators of grassland dynamics during the late Holocene in intertropical Africa. Palaeogeogr. Palaeoclimatol. Palaeoecol. 1997, 136, 213–229. [Google Scholar] [CrossRef]
- Strömberg, C.A.E.; McInerney, F.A. The Neogene transition from C3 to C4 grasslands in North America: Assemblage analysis of fossil phytoliths. Palaeobiology 2011, 37, 50–71. [Google Scholar] [CrossRef]
- Blinnikov, M.m.s.e.; Busacca, A.; Whitlock, C. Reconstruction of the late Pleistocene grassland of the Columbia basin, Washington, USA, based on phytolith records in loess. Palaeogeogr. Palaeoclimatol. Palaeoecol. 2002, 177, 77–101. [Google Scholar] [CrossRef]
- Zhang, X.R.; Hu, K.; Fang, S.; Wang, D.P. Phytolith Distribution in the Surface Peat Deposit of Northeast China. J. Jilin Univ. 2007, 37, 895–900. [Google Scholar] [CrossRef]
- Lu, H.Y.; Wu, N.Q.; Liu, K.B.; Jiang, H.; Liu, T.S. Phytoliths as quantitative indicators for the reconstruction of past environmental conditions in China II: Palaeoenvironmental reconstruction in the Loess Plateau. Quat. Sci. Rev. 2007, 26, 759–772. [Google Scholar] [CrossRef]
- Gao, G.Z.; Jie, D.M.; Wang, Y.; Liu, L.D.; Liu, H.Y.; Li, D.H.; Li, N.N.; Shi, J.C.; Leng, C.C. Do soil phytoliths accurately represent plant communities in a temperate region? A case study of Northeast China. Veg. Hist. Archaeobot. 2018, 27, 753–765. [Google Scholar] [CrossRef]
- Wang, H.L.; Lu, H.Y.; Zhang, H.Y.; Yi, S.W.; Gu, Y.; Liang, C.H. Grass habitat analysis and phytolith-based quantitative reconstruction of Asian monsoon climate change in the sand-loess transitional zone, northern China. Quat. Res. 2019, 92, 519–529. [Google Scholar] [CrossRef]
- Du, Y.; Zhang, X.R.; Ping, S.F.; Jiao, J.Y.; Ma, C.M. Climate Background of Peat Swamp Evolution Recorded by Phytolith over Past 2 ka in Northern Mountainous Area in Dunhua. J. Jilin Univ. 2020, 50, 170–184. [Google Scholar] [CrossRef]
- Liu, L.D.; Jie, D.M.; Liu, H.Y.; Gao, G.Z.; Li, D.H.; Li, N.N. Representativeness of soil phytoliths for plant communities in the forest and grassland regions of Northeast China. Quat. Sci. 2020, 40, 1285–1300. [Google Scholar] [CrossRef]
- Rehman, I.U.; Qader, W.; Dar, R.A.; Rashid, I.; Shah, R.A. Phytolith based palaeoecological reconstruction from a loess-palaeosol sequence in the Kashmir Himalaya, India. Catena 2024, 245, 108318. [Google Scholar] [CrossRef]
- Lu, H.Y.; Wu, N.Q.; Liu, D.S.; Han, J.M.; Qin, X.G.; Sun, X.J.; Wang, Y.J. Seasonal climatic variation recorded by phytolith assemblages from the Baoji loess sequence in central China over the last 150 000 a. Sci. China Earth Sci. 1996, 39, 629–639. [Google Scholar] [CrossRef]
- Zhang, X.R.; Hu, K.; Fang, S.; Wang, D.P. Construction and application of phytolith-climate transfer function in peat surface deposits of Northeast China. Acta Sedimentol. Sin. 2008, 26, 676–682. [Google Scholar]
- Gao, G.Z.; Jie, D.M.; Li, D.H.; Li, N.N.; Liu, L.D.; Liu, H.Y.; Shi, J.C.; Leng, C.C.; Wang, J.Y.; Liu, B.J.; et al. Reliability of phytoliths for reconstructing vegetation dynamics in northern temperate forest regions: A case study in northeast China. Quat. Sci. Rev. 2018, 201, 1–12. [Google Scholar] [CrossRef]
- Zhang, X.R.; Hu, K.; Wang, D.P.; Jie, D.M. Discussion on research and application. World Geol. 2004, 23, 112–117. [Google Scholar] [CrossRef]
- Piperno, D.R. Phytoliths: A Comprehensive Guide for Archaeologist and Paleoecologists; AltaMira Press: New York, NY, USA, 2006. [Google Scholar]
- Liu, G.M. Atlas of the Physical Geography of China; SinoMaps Press: Beijing, China, 2010; pp. 41–45. [Google Scholar]
- Li, J.D.; Yang, Y.F. Temporal-Spatial Variations and Databases on Plant Communities in Songnen Plain of China; Science Press: Beijing, China, 2011; pp. 6–295. [Google Scholar]
- Wang, P.X.; Jian, Z.M. Searching high-resolution palaeoenvironmental records: A review. Quat. Sci. 1999, 1, 1–17. [Google Scholar]
- He, Y.X. Lake palaeoclimate, palaeoenvironmental reconstruction, and biomarkers. Bull. Mineral. Petrol. Geochem. 2020, 39, 878–880. [Google Scholar] [CrossRef]
- Ahmad, S.M. IGBP-Pages Open Science Meeting. National Geophysical Research Institute Hyderabad. J. Geol. Soc. India 1998, 52, 363. [Google Scholar] [CrossRef]
- Knezevic, S.Z.; Streibig, J.C.; Ritz, C. Utilizing R Software Package for Dose-Response Studies: The Concept and Data Analysis. Weed Technol. 2007, 21, 840–848. [Google Scholar] [CrossRef]
- Ramsey, C.B. Bayesian Analysis of Radiocarbon Dates. Radiocarbon 2009, 51, 337–360. [Google Scholar] [CrossRef]
- Ramsey, C.B. Dealing with Outliers and Offsets in Radiocarbon Dating. Radiocarbon 2009, 51, 1023–1045. [Google Scholar] [CrossRef]
- Blaauw, M.; Christen, J.A. Flexible palaeoclimate age-depth models using an autoregressive gamma process. Bayesian Anal. 2011, 6, 457–474. [Google Scholar] [CrossRef]
- Caracuta, V.; Fiorentino, G.; Turchiano, M.; Volpe, G. Dating Historical Contexts: Issues, Plant Material, and Methods to Date the Late Roman Site of Faragola, Apulia (SE Italy). Radiocarbon 2014, 56, 679–690. [Google Scholar] [CrossRef] [PubMed]
- Heilongjiang Geology and Mineral Bureau. Geological Monographs of the Ministry of Geology and Minerals of the People’s Republic of China 1 Regional Geology No. 33 Regional Geology of Heilongjiang Province; Geology Press: Beijing, China, 1993; pp. 233–253. [Google Scholar]
- Lentfer, C.J.; Boyd, W.E. A Comparison of Three Methods for the Extraction of Phytoliths from Sediments. J. Archaeol. Sci. 1998, 25, 1159–1183. [Google Scholar] [CrossRef]
- Zhao, Z. Experiments for Improving Phytolith Extraction from Soils. J. Archaeol. Sci. 1998, 25, 587–598. [Google Scholar] [CrossRef]
- Jenkins, E. Phytolith taphonomy: A comparison of dry ashing and acid extraction on the breakdown of conjoined phytoliths formed in Triticum durum. J. Archaeol. Sci. 2009, 36, 2402–2407. [Google Scholar] [CrossRef]
- Madella, M.; Alexandre, A.; Ball, T. International Code for Phytolith Nomenclature 1.0. Ann. Bot. 2005, 96, 253–260. [Google Scholar] [CrossRef]
- International Committee for Phytolith Taxonomy (ICPT). International Code for Phytolith Nomenclature (ICPN) 2.0. Ann. Bot. 2019, 124, 189–199. [Google Scholar] [CrossRef] [PubMed]
- Wang, Y.J.; Lü, H.Y. Phytolith Study and Its Application; China Ocean Press: Beijing, China, 1993; pp. 50–110. [Google Scholar]
- Strömberg, C.A.E. Methodological concerns for analysis of phytolith assemblages: Does count size matter? Quat. Int. 2009, 193, 124–140. [Google Scholar] [CrossRef]
- Delhon, C.; Alexandre, A.; Berger, J.F.; Thiébault, S.t.; Brochier, J.L.é.; Meunier, J.D. Phytolith assemblages as a promising tool for reconstructing Mediterranean Holocene vegetation. Quat. Res. 2003, 59, 48–60. [Google Scholar] [CrossRef]
- Wang, W.M.; Liu, J.L.; Zhou, X.D. Study on phytolith climate index of Homo erectus cave sediments in Nanjing. Chin. Sci. Bull. 2003, 48, 1205–1208. [Google Scholar] [CrossRef]
- Barboni, D.; Bremond, L.; Bonnefille, R. Comparative study of modern phytolith assemblages from inter-tropical Africa. Palaeogeogr. Palaeoclimatol. Palaeoecol. 2007, 246, 454–470. [Google Scholar] [CrossRef]
- Grimm, E.C. CONISS: A FORTRAN 77 program for stratigraphically constrained cluster analysis by the method of incremental sum of squares. Comput. Geosci. 1987, 13, 13–35. [Google Scholar] [CrossRef]
- Bai, Y.; Dai, L.; Yeok, F.S. Vegetation indication of phytolith assemblages of topsoil on tropical mountains: A sample from Jerai Hill, Malaysia. Quat. Sci. 2020, 40, 1301–1311. [Google Scholar] [CrossRef]
- Li, R.C.; Fan, J.; Gao, C.H. Advances in modern phytolith research. Adv. Earth Sci. 2013, 28, 1287–1295. [Google Scholar] [CrossRef]
- Gu, Y.S.; Ji, Y.B.; Liu, H.Y.; Mi, Y.C.; Wang, H.L.; Li, R.C. An introduction to the research and application of phytolith morphometrics. Quat. Sci. 2019, 39, 12–23. [Google Scholar] [CrossRef]
- Liu, H.Y.; Gu, Y.S.; Tang, Q.Q.; Cheng, D.D.; Gui, F.K. Phytolith records of modern plant communities and surface soils on the Qingbang Island, Zhejiang Province, East China and its environmental significances. Acta Micropalaeontologica Sin. 2017, 34, 77–83. [Google Scholar] [CrossRef]
- Ter Braak, C.J.F.; Prentice, I.C. A Theory of Gradient Analysis. Adv. Ecol. Res. 2004, 34, 235–282. [Google Scholar] [CrossRef]
- Wang, Y.; Shen, X.; Jiang, M.; Lu, X. Vegetation Change and Its Response to Climate Change between 2000 and 2016 in Marshes of the Songnen Plain, Northeast China. Sustainability 2020, 12, 3569. [Google Scholar] [CrossRef]
- Niu, H.H.; Marquer, L.; Sack, D.; Gao, G.Z.; Wang, J.Y.; Meng, M.; Jie, D.M. Middle to late Holocene plant cover variation in relation to climate, fire, and human activity in the Songnen grasslands of northeastern China. Front. Plant Sci. 2023, 13, 1071273. [Google Scholar] [CrossRef] [PubMed]
- Diester, H.L.; Schrader, H.J.; Thiede, J. Sedimentological and palaeoclimatological investigation of two sediment cores off Cape Barbas, North-West Africa. Pangaea 1973, 16, 19. [Google Scholar] [CrossRef]
- Twiss, P.C. Grass-opal phytoliths as climatic indicators of the Great Plains Pleistocene; Kansas Geological Survey: Lawrence, KS, USA, 1987; pp. 179–188. [Google Scholar]
- Thorn, V.C. Phytolith evidence for C4-dominated grassland since the early Holocene at Long Pocket, northeast Queensland, Australia. Quat. Res. 2004, 61, 168–180. [Google Scholar] [CrossRef]
- Liu, L.D.; Jie, D.M.; Liu, H.Y.; Gao, G.Z.; Li, D.H.; Li, N.N. Preservation of common soil phytoliths in the northern temperate region: A case study from northeast China. Boreas 2020, 49, 751–768. [Google Scholar] [CrossRef]
- Bird, M.I.; Taylor, D.; Hunt, C. Environments of insular Southeast Asia during the Last Glacial Period: A savanna corridor in Sundaland? Quat. Sci. Res. 2005, 24, 2228–2242. [Google Scholar] [CrossRef]
- Ma, X.Y.; Wei, Z.F.; Wang, Y.L.; Wang, G.; Gong, J.C.; Zhang, T.; He, W.; Yu, X.L. C3/C4 vegetation evolution recorded by lake sediments in the Huola basin, Northeast China since the Last Glacial Maximum. Quat. Sci. 2018, 38, 1193–1202. [Google Scholar] [CrossRef]
- Stebich, M.; Mingram, J.; Han, J.; Liu, J. Late Pleistocene spread of (cool-)temperate forests in Northeast China and climate changes synchronous with the North Atlantic region. Glob. Planet Chang. 2009, 65, 56–70. [Google Scholar] [CrossRef]
- Wang, Q.; Zhao, K.; Wang, Y.J.; Chen, J.; Liang, Y.J.; Cui, Y.F.; Shao, Q.F.; Zhai, X.M.; Zhang, Z.Q.; Kong, X.G.; et al. Orbital- and millennial-scale hydroclimate changes in central China during the last glacial period. Quat. Sci. Res. 2024, 337, 108802. [Google Scholar] [CrossRef]
- Demezhko, D.Y.; Ryvkin, D.G.; Outkin, V.I.; Duchkov, A.D.; Balobaev, V.T. Spatial Distribution of Pleistocene/holocene Warming Amplitudes in Northern Eurasia Inferred from Geothermal Data. Clim. Past 2007, 3, 559–568. [Google Scholar] [CrossRef]
- Sergio, B.; Federico, L.A.; Marcos, C.; Daniel, T.; Adrián, G. A Pleistocene Freshwater Ichthyofaunal Assemblage From Central Argentina: What Kind of Fishes Lived in the Pampean Lagoons Before the Extinction of the Megafauna? PLoS ONE 2020, 15, e0235196. [Google Scholar] [CrossRef]
- Wang, Y.X.; Kai, N.; He, Q.H.; Jie, D.M.; Guan, Q.Y. Holocene paleotemperature reconstruction based on phytolith records of lacustrine sediments in the Badain Jaran Desert, northwestern China. Front. Earth Sci. 2022, 10, 998061. [Google Scholar] [CrossRef]
- Zhang, W.C.; Wu, H.B.; Cheng, J.; Geng, J.Y.; Li, Q.; Sun, Q.; Lu, H.Y.; Guo, Z.T. Holocene seasonal temperature evolution and spatial variability over the Northern Hemisphere landmass. Nat. Commun. 2022, 13, 53341. [Google Scholar] [CrossRef] [PubMed]
- Guo, C.; Ma, Y.Z.; Li, J.F. Mid- To Late Holocene Moisture Evolution In China And Surroundings: Spatial Patterns And Possible Mechanisms. Quat. Sci. 2022, 42, 1058–1077. [Google Scholar] [CrossRef]
- Wanner, H.; Beer, J.; Bütikofer, J.; Crowley, T.J.; Cubasch, U.; Flückiger, J.; Goosse, H.; Grosjean, M.; Joos, F.; Kaplan, J.O.; et al. Mid- to Late Holocene climate change: An overview. Quat. Sci. Rev. 2008, 27, 1791–1828. [Google Scholar] [CrossRef]
- Herzschuh, U.; Böhmer, T.; Chevalier, M.; Hébert, R.; Dallmeyer, A.; Li, C.Z.; Cao, X.Y.; Peyron, O.; Nazarova, L.; Novenko, E.Y.; et al. Regional pollen-based Holocene temperature and precipitation patterns depart from the Northern Hemisphere mean trends. Clim. Past 2023, 19, 1481–1506. [Google Scholar] [CrossRef]
- Pu, Q.Y. Evolution of natural environment in China since the Last Glacial Period and its position in the global change. Quat. Sci. 1991, 11, 245–259. [Google Scholar]
- Qin, B.Q.; Harrison, S.P.; Yu, G.; Tarasov, P.E.; Damnati, B. The geological evidence of the global moisture condition changes since the last glacial maximum: The construction of global lake status data base & the synthesis in the large spatio-temporal scale. J. Lake Sci. 1997, 9, 203–210. [Google Scholar] [CrossRef][Green Version]
- Zhang, S.R.; Xiao, J.L.; Xu, Q.H. Regional precipitation variations during Heinrich events and Dansgaard-Oeschger cycles in the northern margin of the East Asian summer monsoon region. Quat.Sci. Rev. 2022, 278, 107380. [Google Scholar] [CrossRef]
- Ziemen, F.A.; Kapsch, M.L.; Klockmann, M.; Mikolajewicz, U. Heinrich events show two-stage climate response in transient glacial simulations. Clim. Past 2019, 15, 153–168. [Google Scholar] [CrossRef]
- Dong, X.Y.; Cheng, H.; Kathayat, G.; Zhang, F.; Li, H.Y.; Zhang, H.W.; Zhao, J.Y.; Ning, Y.F.; Li, X.L.; Cheng, X.; et al. The termination period of Heinrich 2 Event recorded by stalagmite in Indian monsoon domain. Quat. Sci. 2019, 39, 878–893. [Google Scholar] [CrossRef]
- Shao, K.H.; Lu, H.Y.; Chen, J.Y.; Gu, X.J.; Chu, B.W.; Wu, J.; Yi, S.W. East Asian monsoon precipitation variations over the past 80 ka revealed by carbonate and dolomite content in loess deposit at Zhengzhou(Central China) and forcing mechanism. Qua. Sci. 2020, 40, 1622–1630. [Google Scholar] [CrossRef]
- Dong, X.Y.; Kathayat, G.; Rasmussen, S.O.; Svensson, A.; Severinghaus, J.P.; Li, H.Y.; Sinha, A.; Xu, Y.; Zhang, H.W.; Shi, Z.G.; et al. Coupled atmosphere-ice-ocean dynamics during Heinrich Stadial 2. Nat. Commun. 2022, 13, 5867. [Google Scholar] [CrossRef] [PubMed]
- Porter, S.C.; An, Z.S. Correlation between climate events in the North Atlantic and China during the last glaciation. Nature 1995, 375, 305–308. [Google Scholar] [CrossRef]
- Zhang, S.R.; Xiao, J.L.; Wen, R.H.; Fan, W.J.; Huang, Y.; Li, M.Y.; Xu, Q.H. The character and impact of the Heinrich event 1 in the middle-high latitude of East Asia: Pollen records from the Hulun Lake. Quat. Sci. 2019, 39, 905–915. [Google Scholar] [CrossRef]
- Zhao, Y.T.; An, C.B.; Zhao, J.J.; Li, Y.; Duan, F.T.; Miao, Y.F. Vegetation and climate history in the arid inland area during the H1: Multi-proxy data of the Balikun Lake. Quat. Sci. 2019, 39, 916–926. [Google Scholar] [CrossRef]
- Yi, S.Y.; Sheng, M.; Li, Z.Y.; Wang, X.S. Centennial-resolution East Asian winter monsoon variations recorded by loess deposits in the eastern Hexi Corridor over the last 110 ka. Quat. Sci. 2022, 42, 1517–1528. [Google Scholar] [CrossRef]
- Yang, S.L.; Ding, Z.L. Spatial changes in grain size of loess deposits in the Chinese Loess Plateau and implications for palaeoenvironment. Quat. Sci. 2017, 37, 934–944. [Google Scholar] [CrossRef]
- Wu, J.; Liu, Q.; Mao, L.M.; Zhu, Z.Y.; Wang, L.; Chu, G.Q.; Liu, J.Q. Characteristics of the Younger Drays event in the Great Khingan Mountains area. Quat. Sci. 2019, 39, 985–993. [Google Scholar] [CrossRef]
- Sun, Q.; Xie, M.M.; Lin, Y.; Shan, Y.B.; Zhu, Q.Z.; Xu, D.K.; Su, Y.L.; Rioual, P.; Chu, G.Q. An n-alkane and carbon isotope record during the last deglaciation from annually laminated sediment in Lake Xiaolongwan, northeastern China. J. Paleolimnol. 2016, 56, 189–203. [Google Scholar] [CrossRef]
- Liu, J.L. Vegetational and climatic changes at Gushantun Bog in Jinlin, NE China since 13 000 Y.BP. Acta Palaeontol. Sin. 1989, 28, 495–511. [Google Scholar] [CrossRef]
- Liu, D.S. Loess, Quaternary Geology, and Global Change Part II; Science Press: Xi’an, China, 1990; pp. 108–115. [Google Scholar]
- Liu, Y.Y.; Liu, J.Q.; Han, J.T. Pollen Record, and Climate Changing Since12.0 ka B.P. in Erlongwan Maar Lake Jilin Province. J. Jilin Univ. 2009, 39, 93–98. [Google Scholar] [CrossRef]
- Cai, W.J.; Santoso, A.; Collins, M.; Dewitte, B.; Karamperidou, C.; Kug, J.S.; Lengaigne, M.; McPhaden, M.J.; Stuecker, M.F.; Taschetto, A.S.; et al. Changing El Niño–Southern Oscillation in a warming climate. Nat. Rev. Earth Environ. 2021, 2, 628–644. [Google Scholar] [CrossRef]
- Ruth, U.; Barnola, J.M.; Beer, J.; Bigler, M.; Blunier, T.; Castellano, E.; Fischer, H.; Fundel, F.; Huybrechts, P.; Kaufmann, P.; et al. “EDML1”: A chronology for the EPICA deep ice core from Dronning Maud Land, Antarctica, over the last 150 000 years. Clim. Past 2007, 3, 475–484. [Google Scholar] [CrossRef]
- North Greenland Ice Core Project members. High-resolution record of Northern Hemisphere climate extending into the last interglacial period. Nature 2004, 431, 147–151. [Google Scholar] [CrossRef] [PubMed]
- Svensson, A.; Andersen, K.; Bigler, M.; Clausen, H.B.; Dahl-Jensen, D.; Davies, S.M.; Johnsen, S.J.; Muscheler, R.; Parrenin, F.; Rasmussen, S.O.; et al. A 60 000 year Greenland stratigraphic ice core chronology. Clim. Past 2008, 4, 47–57. [Google Scholar] [CrossRef]
- Marcott, S.A.; Bauska, T.K.; Buizert, C.; Steig, E.J.; Rosen, J.L.; Cuffey, K.M.; Fudge, T.J.; Severinghaus, J.P.; Ahn, J.; Kalk, M.L.; et al. Centennial-scale changes in the global carbon cycle during the last deglaciation. Nature 2014, 514, 616–619. [Google Scholar] [CrossRef] [PubMed]
- Broecker, W.S.; Denton, G.H.; Edwards, R.L.; Cheng, H.; Alley, R.B.; Putnam, A.E. Putting the Younger Dryas cold event into context. Quat. Sci. Rev. 2010, 29, 1078–1081. [Google Scholar] [CrossRef]
- Hu, M.J.; Li, S.; Gao, S.Y.; Zhang, D.S. Evolution Process of Land Desertification around Qinghai Lake since 32 ka BP Reflected by Sediment Grain-size Features. J. Desert Res. 2012, 32, 1240–1247. [Google Scholar]
- Li, Q.; Pan, B.T.; Gao, H.S.; Xu, S.J. Desert Evolution and Climate Change of Southern Margin of Tengger Desert since Last Glacial Maximum. J. Desert Res. 2006, 26, 875–879. [Google Scholar]
- Wang, T.; Long, Y.L.; Liu, X.X.; Sun, Y.B. Sedimentary environment evolutions in the Weihe Basin since Last Glacial Maximum. Quat. Sci. 2019, 39, 579–588. [Google Scholar] [CrossRef]
- Liang, X.; Yang, P.G.; Yao, J.; Zhang, P.; Zhang, J.H.; Sun, P.F.; Ao, H. Environmental magnetic record of East Asian summer monsoon variability on the Chinese Loess Plateau since 16 ka BP. Acta Geogr. Sin. 2021, 76, 539–549. [Google Scholar] [CrossRef]
- Wang, X.S.; Chu, G.Q.; Sheng, M.; Zhang, S.Q.; Li, J.H.; Chen, Y.; Tang, L.; Su, Y.L.; Pei, J.L.; Yang, Z.Y. Millennial-scale Asian summer monsoon variations in South China since the last deglaciation. Earth Planet. Sci. Lett. 2016, 451, 22–30. [Google Scholar] [CrossRef]
- Wang, S.M. Records of the Younger Dryas event in sediments of Zhainuoer Lake in Inner Mongolia. Chin. Sci. Bull. 1994, 39, 348–351. [Google Scholar] [CrossRef]
- Wu, J.; Liu, Q.; Chu, G.Q.; Wang, L.; Liu, J.Q. Vegetation history and climate change recorded by stomata evidence during the late glacial in the Great Khingan Mountain Region, Northeastern China. Chin. Sci. Bull. 2016, 61, 3940–3945. [Google Scholar] [CrossRef]
- Parplies, J.; Lucke, A.; Vos, H.; Mingram, J.; Stebich, M.; Radtke, U.; Han, J.T.; Schleser, G.H. Late glacial environment and climate development in northeastern China derived from geochemical and isotopic investigations of the varved sediment record from Lake Sihailongwan (Jilin Province). J. Paleolimnol. 2008, 40, 471–487. [Google Scholar] [CrossRef]
- An, Z.S.; Porte, S.C.; Zhou, W.J.; Lu, Y.C.; Donahue, D.J.; Head, M.J.; Wu, X.H.; Ren, J.Z.; Zheng, H.B. Episode of Strengthened Summer Monsoon Climate of Younger Dryas Age on the Loess Plateau of Central China. Quat. Res. 1993, 39, 45–54. [Google Scholar] [CrossRef]
- Liu, J.L.; Liu, Q.; Chu, G.Q.; Wu, J.; Liu, J.Q. Sediment record at Lake Sifangshan in the central northern part of the Great Xing’an Range, Northeast China since 15.4ka B.P. Quat. Sci. 2015, 35, 901–912. [Google Scholar] [CrossRef]
- Zhou, W.J.; Zheng, Y.H.; Meyers, P.A.; Jull, A.J.T.; Xie, S.C. Postglacial climate-change record in biomarker lipid compositions of the Hani peat sequence, Northeastern China. Earth Planet. Sci. Lett. 2010, 294, 37–46. [Google Scholar] [CrossRef]
- Liu, X.Y.; Zhou, X.; Zhan, T.; Zhou, X.Y.; Wu, H.B.; Jiang, S.W.; Tu, L.Y.; Oyebanji, D.; Shen, Y.N. Pollen evidence for a wet Younger Dryas in northern NE China. Catena 2023, 220, 106667. [Google Scholar] [CrossRef]
- Cheng, H.; Edwards, R.L.; Sinha, A.; Spötl, C.; Yi, L.; Chen, S.T.; Kelly, M.; Kathayat, G.; Li, X.L.; Wang, X.F.; et al. The Asian monsoon over the past 640,000 years and ice age terminations. Nature 2016, 534, 640–646. [Google Scholar] [CrossRef]
- Max, L.; Riethdorf, J.R.; Tiedemann, R.; Smirnova, M.; Lembke-Jene, L.; Fahl, K.; Nrnberg, D.; Matul, A.; Mollenhauer, G. Sea surface temperature variability and sea-ice extent in the subarctic northwest Pacific during the past 15,000 years. Palaeoceanogr. Palaeoclimatol. 2012, 27, PA3213–PA3232. [Google Scholar] [CrossRef]
- Maher, B.A. Palaeoclimatic records of the loess/palaeosol sequences of the Chinese Loess Plateau. Quat. Sci. Rev. 2016, 154, 23–84. [Google Scholar] [CrossRef]
- An, Z.S. The history and variability of the East Asian palaeomonsoon climate. Quat. Sci. Rev. 2000, 19, 171–187. [Google Scholar] [CrossRef]
- Liu, J.Q.; Ni, Y.Y.; Chu, G.Q. Main palaeoclimatic events in the Quaternary. Quat. Sci. 2001, 21, 239–248. [Google Scholar] [CrossRef]
- Chen, D.; Gao, Y.; Sun, J.Q.; Wang, H.J.; Ma, J.H. Interdecadal Variation and Causes of Drought in Northeast China in Recent Decades. J. Geophys. Res.-Atmos. 2020, 125, e2019JD032069. [Google Scholar] [CrossRef]
- Zhang, M.M.; Bu, Z.J.; Wang, S.Z.; Jiang, M. Moisture changes in Northeast China since the last deglaciation: Spatiotemporal out-of-phase patterns and possible forcing mechanisms. Earth Sci. Rev. 2020, 201, 102984. [Google Scholar] [CrossRef]
- National Climate Center. China Climate Impact Assessment; China Meteorological Press: Beijing, China, 2022; pp. 32–34. [Google Scholar]
- Chu, G.Q.; Sun, Q.; Xie, M.M.; Lin, Y.; Shang, W.Y.; Zhu, Q.Z.; Shan, Y.B.; Xu, D.K.; Rioual, P.; Wang, L.; et al. Holocene cyclic climatic variations and the role of the Pacific Ocean as recorded in varved sediments from northeastern China. Quat. Sci. Rev. 2014, 102, 85–95. [Google Scholar] [CrossRef]
- Zhou, X.; Zhan, T.; Tan, N.; Tu, L.Y.; Smol, J.P.; Jiang, S.; Zeng, F.; Liu, X.; Li, X.; Liu, G.; et al. Inconsistent patterns of Holocene rainfall changes at the East Asian monsoon margin compared to the core monsoon region. Quat. Sci. Rev. 2023, 301, 107952. [Google Scholar] [CrossRef]
- Gorbarenko, S.A.; Artemova, A.V.; Goldberg, E.L.; Vasilenko, Y.P. The response of the Okhotsk Sea environment to the orbital-millennium global climate changes during the Last Glacial Maximum, deglaciation, and Holocene. Glob. Planet. Change 2014, 116, 76–90. [Google Scholar] [CrossRef]
Disclaimer/Publisher’s Note: The statements, opinions and data contained in all publications are solely those of the individual author(s) and contributor(s) and not of MDPI and/or the editor(s). MDPI and/or the editor(s) disclaim responsibility for any injury to people or property resulting from any ideas, methods, instructions or products referred to in the content. |
© 2025 by the authors. Licensee MDPI, Basel, Switzerland. This article is an open access article distributed under the terms and conditions of the Creative Commons Attribution (CC BY) license (https://creativecommons.org/licenses/by/4.0/).