Article

Fire Severity Outperforms Remote Sensing Indices in Exploring Post-Fire Vegetation Recovery Dynamics in Complex Plateau Mountainous Regions

1
College of Big Data and Intelligent Engineering, Southwest Forestry University, Kunming 650224, China
2
Yunnan Seismological Bureau, Kunming 650224, China
3
Key Laboratory of State Forestry and Grass Administration on Forest Ecology Big Data, Southwest Forestry University, Kunming 650224, China
4
College of Biodiversity Conservation, Southwest Forestry University, Kunming 650224, China
*
Author to whom correspondence should be addressed.
These authors contributed equally to this work.
Forests 2025, 16(2), 263; https://doi.org/10.3390/f16020263
Submission received: 30 December 2024 / Revised: 27 January 2025 / Accepted: 30 January 2025 / Published: 1 February 2025
(This article belongs to the Special Issue Image Processing for Forest Characterization)

Abstract

:
Understanding post-fire vegetation recovery dynamics is crucial for damage assessment and recovery planning, yet spatiotemporal patterns in complex plateau environments remain poorly understood. This study addresses this gap by focusing on Yunnan Province, a mountainous plateau region with high fire incidence. We developed an innovative approach combining differenced Normalized Burn Ratio (dNBR) and visual interpretation on Google Earth Engine (GEE) to generate high-quality training samples from Landsat 5 TM/7 ETM+/8 OLI imagery. Four supervised machine learning algorithms were evaluated, with Random Forest (RF) demonstrating superior accuracy (OA = 0.90) for fire severity classification compared to Support Vector Machine (SVM) OA of 0.88, Classification and Regression Tree(CART) OA o f0.85, and Naive Bayes(NB) OA of 0.78. Using RF, we generated annual fire severity maps alongside the Land Surface Water Index (LSWI), Normalized Difference Vegetation Index (NDVI), and Normalized Burn Ratio (NBR) from 2005 to 2020. Key findings include the following: (1) fire severity classification outperformed traditional remote sensing indices in characterizing vegetation recovery; (2) distinct recovery trajectories emerged across severity levels, with moderate areas recovering in 7 years, severe areas transitioning within 2 years, and low severity areas peaking at 2 years post-fire; (3) southern mountainous regions exhibited 1–2 years faster recovery than northern areas. These insights advance understanding of post-fire ecosystem dynamics in complex terrains and support more effective recovery strategies.

1. Introduction

Forests play an important role in biodiversity assessment and climate regulation, as these ecosystems support about 80% of the world’s terrestrial biodiversity [1]. They are also recognized as one of the largest carbon sinks globally [2]. Nevertheless, the rate of forest destruction has escalated dramatically in recent decades, primarily driven by climate change, intensified agricultural activities, and increased incidence of wildfires. Since the early 20th century, the global forest area has been reduced by approximately 50% [3]. Yunnan Province is a typical plateau mountain area with high terrain, large undulations, and complex topography. It is rich in animal and plant resources and is a gene bank for species in the world. It has many national nature reserves based on forestry. Central Yunnan is a high-risk area for forest fires in Yunnan Province and is also the main affected area from 2005 to 2014 alone, 1248 fires broke out in the area [4,5].
Forest fire is a key factor influencing the structure and development of the forest ecosystem. On one hand, it will cause serious damage to the vegetation ecology, disrupting the energy and material cycle in the forest ecosystem. On the other hand, forest fires of a certain frequency and severity play an important role in maintaining forest ecological balance and biodiversity [6]. Quantitative analysis of forest fire severity can help people not only understand the changes in vegetation ecosystems after forest fire disturbance but also explain the reasons for the formation of vegetation landscape heterogeneity and guide the handling of combustible materials, which is of great significance for wild forest fire damage assessment and vegetation restoration and reconstruction [7,8,9].
Early studies on forest fire severity and post-fire vegetation recovery primarily relied on on-site field surveys. Although these methods provide valuable insights, they were labor-intensive, time-consuming, and inefficient, particularly in complex mountainous regions. To overcome these limitations, researchers adopted remote sensing indices to analyze forest fire severity and vegetation recovery [10,11], such as Normalized Burn Ratio (NBR), difference Normalized Burn Ratio (dNBR), Burn Area Index (BAR), Normalized Difference Vegetation Index (NDVI), and Land Surface Water Index (LSWI) [12,13,14]. Among these, NBR and dNBR are widely recognized for their accuracy (exceeding 90%) in detecting fire locations and assessing fire severity [15,16,17]. Forest fires reduce chlorophyll content and canopy moisture, exposing underlying bare soil, which decreases near-infrared (NIR) reflectance while increasing mid-infrared (MIR) reflectance [18,19].
Meanwhile, NDVI and LSWI are extensively applied in vegetation monitoring, land cover analysis, and crop identification [20]. For instance, LSWI and NDVI were used to develop an improved peak point detection method for extracting crop planting severity [21], vegetation indices generated from satellite images were used to monitor grassland fire recovery, and LSWI demonstrated a strong response to forest fire events, making it a valuable tool for both fire detection and post-fire recovery analysis [22].
The dNBR exhibits strong capability in extracting fire-impacted regions within Yunnan Province [4,23]. Although index-based methods are widely applied, they present certain limitations. Specifically, dNBR relies on pre- and post-fire image comparisons, necessitating precise fire timing information, which limits its effectiveness for long-term continuous change detection. Furthermore, topographic shading can attenuate spectral signals in steep slope areas, potentially leading to underestimation of burned areas and omission of fire-affected regions when using index-based approaches [24].
Over recent years, ML applications alongside existing fire-burned products to analyze forest fire severity and post-fire vegetation recovery have become a prominent research trend [25,26]. Compared to manual surveys and traditional index-based methods, ML offers advantages in handling spatiotemporal data and demonstrates superior performance in multi-feature classification in complex environmental mountain regions [27]. For instance, ML was employed to identify fire-prone areas in northeastern India [28], predict forest fires in protected areas [29], enhance fine-grained classification in complex remote sensing scenarios [30], and analyze historical fire data and generate predictive factors for modeling fire probabilities in Lower Silesia Province, Poland [31].
Despite these advancements, Machine learning (ML) algorithms have demonstrated improved accuracy in fire detection and burned area identification. However, the applicability of their parameters in southern highland and mountainous regions requires further investigation. Moreover, while existing studies on post-fire vegetation recovery primarily focus on local climate, vegetation type, and topography, limited research has been conducted on the long-term dynamics of fire severity changes and their relationship with vegetation recovery processes [32].
Google Earth Engine (GEE) is a remote sensing big data platform and widely recognized for its robust capabilities in data quantification and parallel computing. It has been extensively applied to monitor land resources, vegetation, forests, hydrology, and wildfires [33]. For instance, a hierarchical training random vegetation classifier was devised based on GEE and remote sensing indices to map a 30 m resolution global annual burned areas [34], and dynamics and driving forces of aboveground biomass were analyzed in Inner Mongolia grassland over the past 23 years [35].
This study employs Landsat TM/ETM+/OLI datasets on GEE to investigate wq_2006_ba in Anning County, China. The research objectives are (1) to rapidly and accurately generate abundant forest fire severity classification samples for a long time span based on dNBR and visual interpretation; (2) to evaluate the strengths and limitations of four ML algorithms of RF, CART, SVM, and NB in classifying forest fire severity in plateau mountainous regions, and explore the parameters of a high-precision machine learning algorithm suitable for the highlands of the southern plateau; and (3) to explore the long-term characteristics of the four fire severity zones (severe, moderate, low, and unburned) post-fire and their links to vegetation recovery. The findings will enhance our understanding of post-fire ecosystem dynamics in complex terrains and provide valuable insights for forest management and restoration strategies in mountainous regions. This study contributes to the development of more effective monitoring and assessment tools for fire-affected ecosystems, particularly in biodiversity-rich plateau regions.

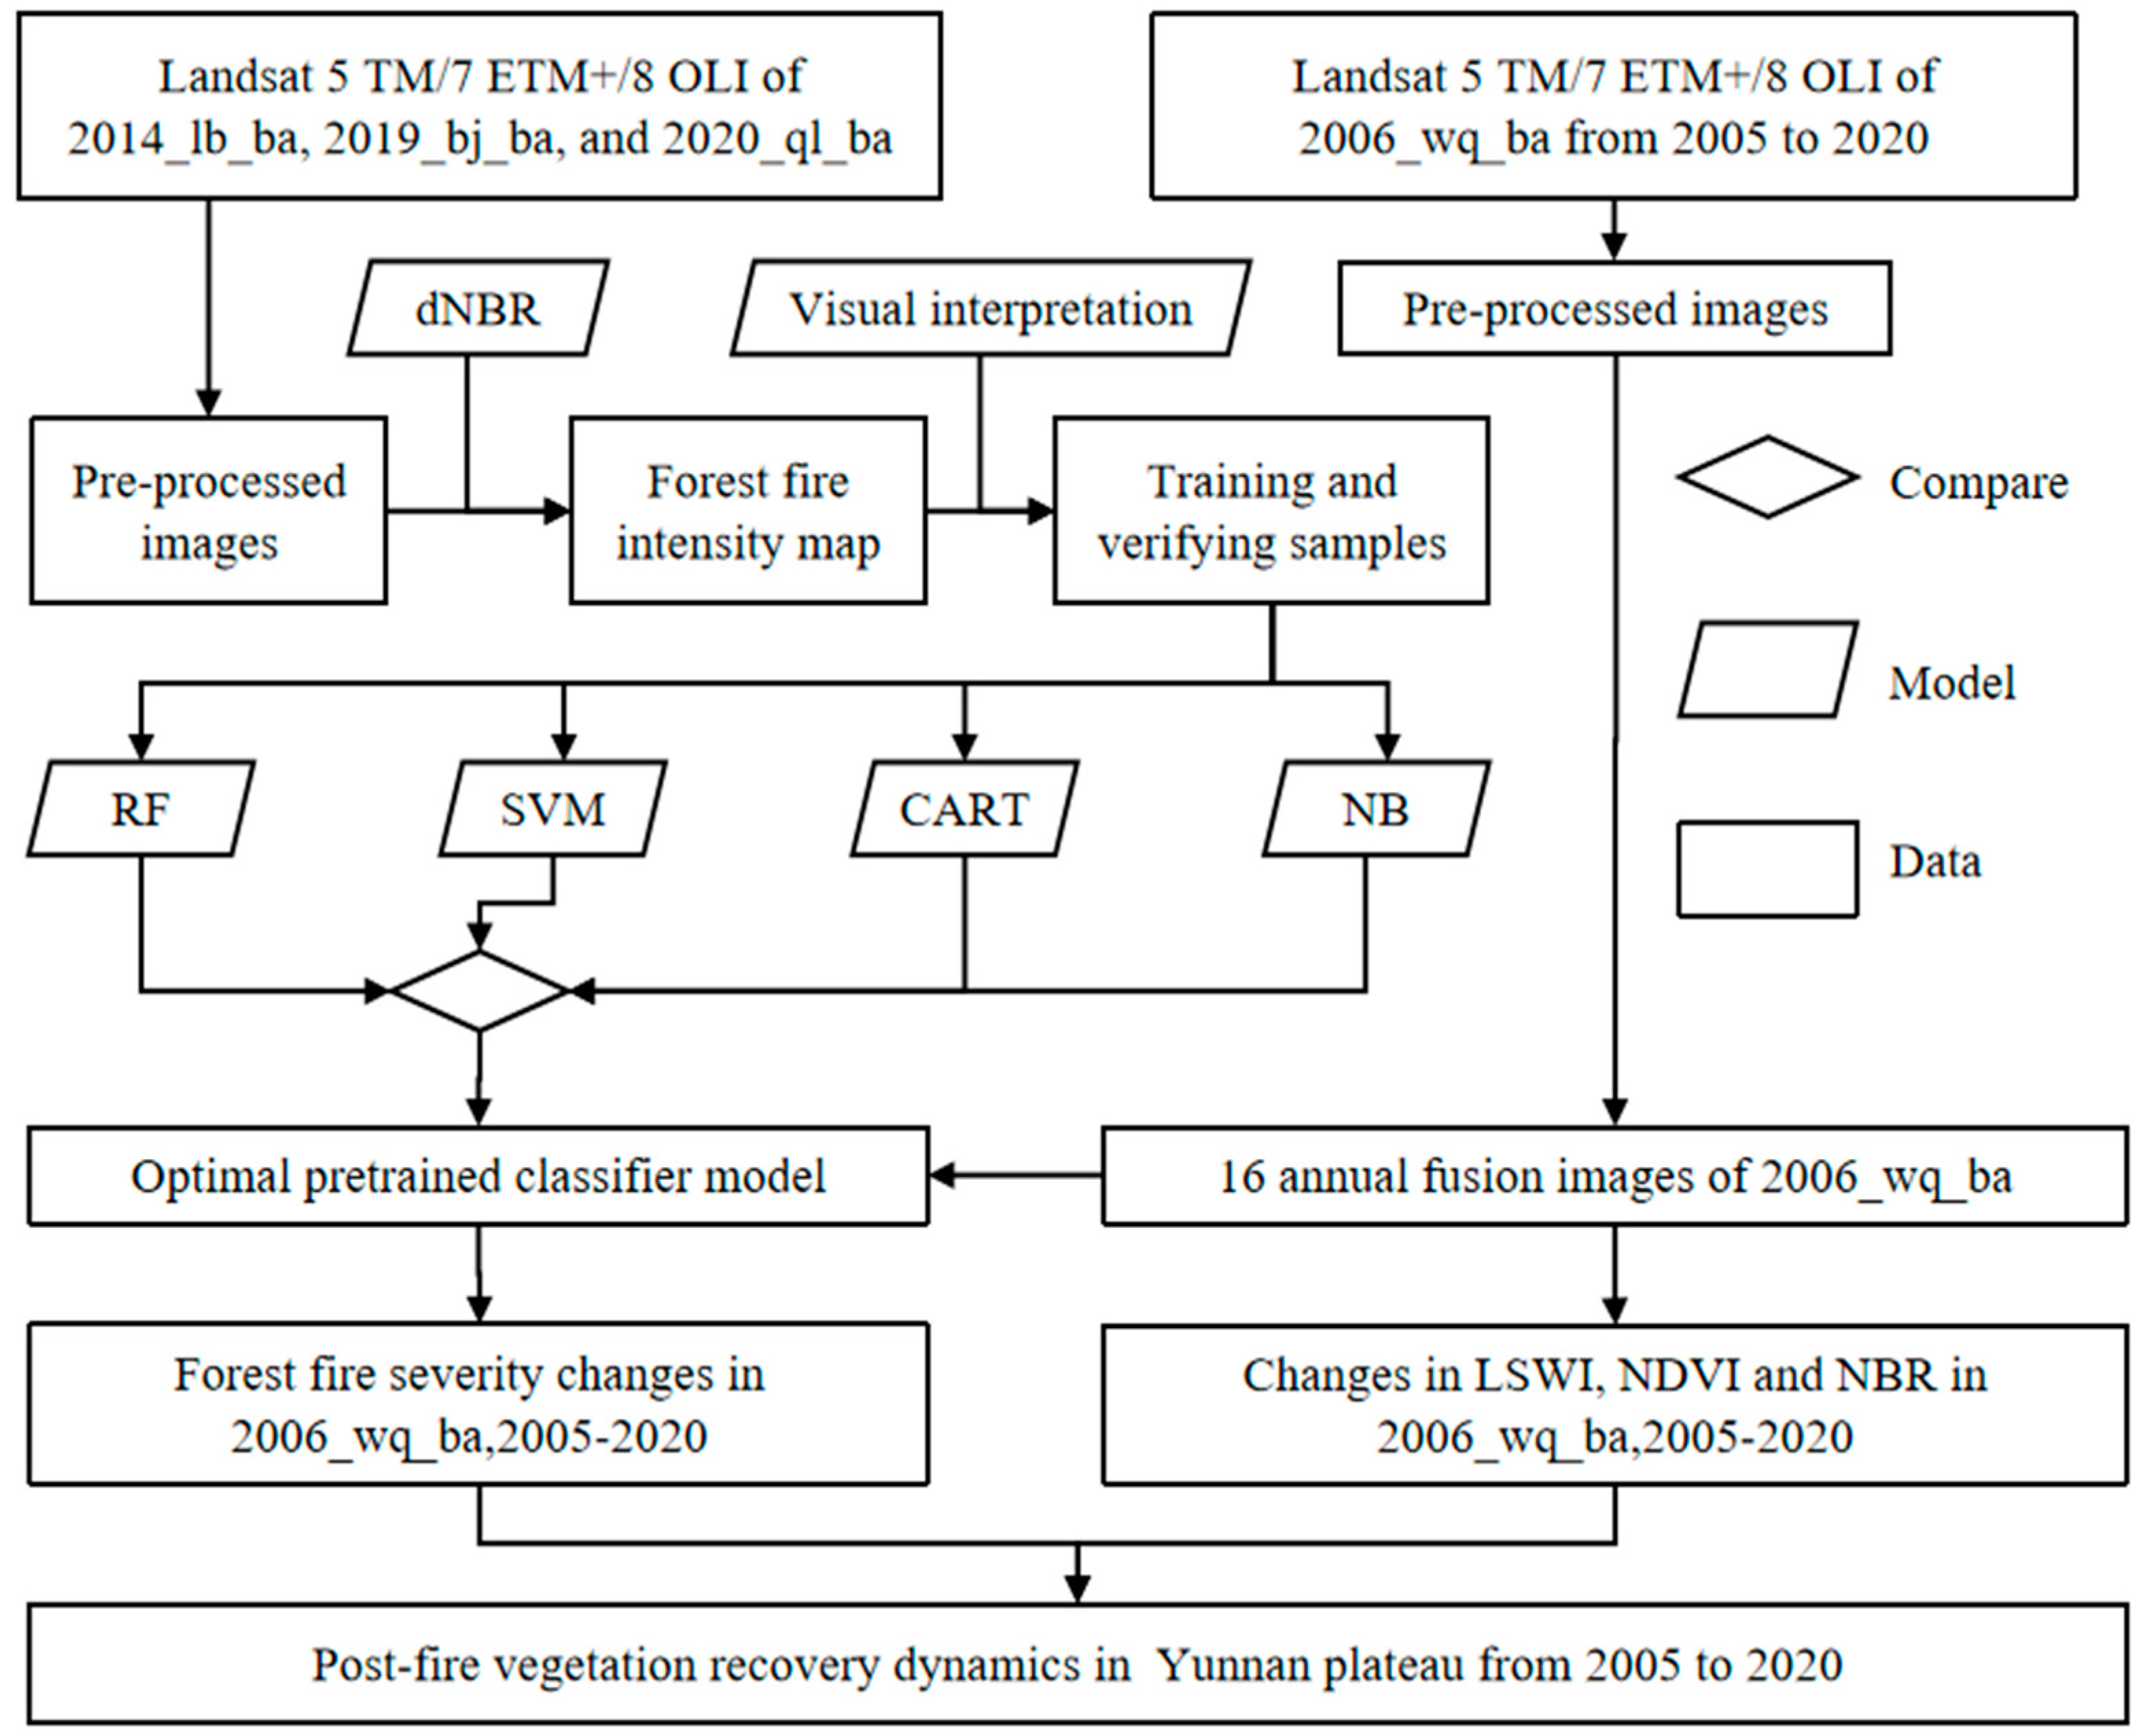
2. Materials and Methods
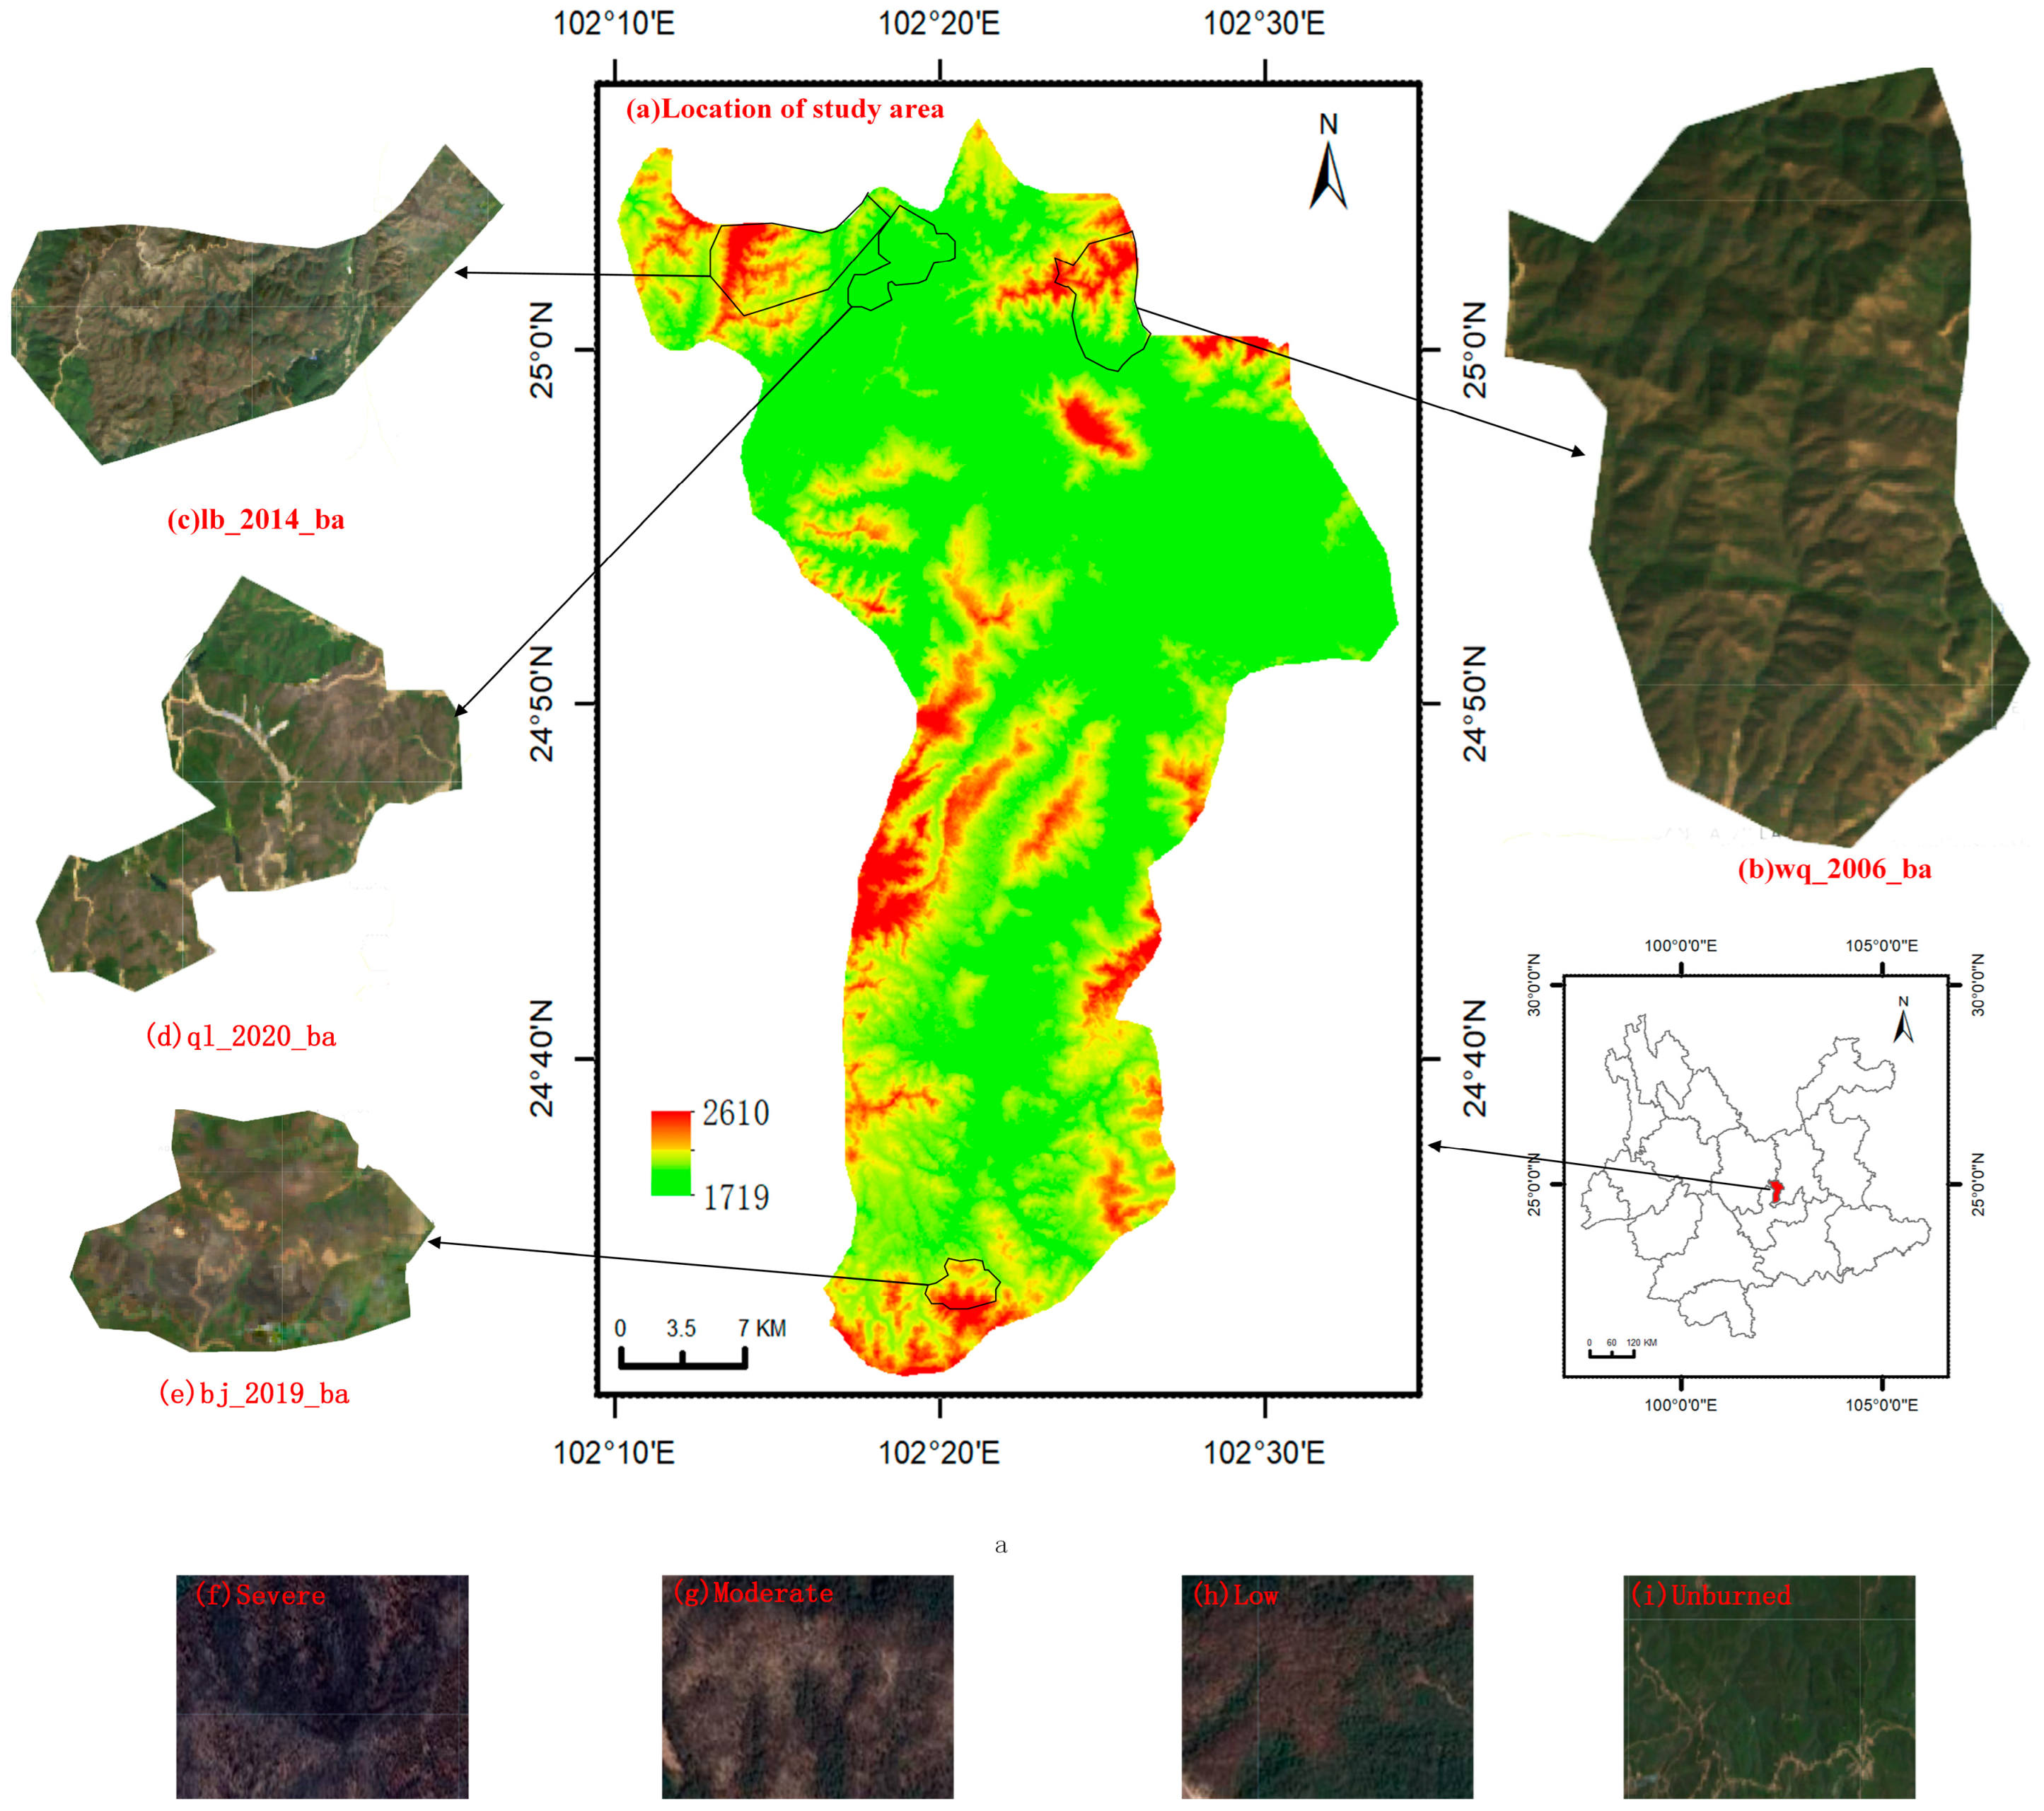
2.1. Study Area

The study area is situated in the central region of Yunnan Province, China (102°10′–102°37′ E, 24°31′–25°06′ N). This is a typical highland area with an average altitude of 1800 m. It has a total area of 1301 km2 and a permanent population of 500,000 as of 2023; (Figure 1) [36]. The terrain features higher elevations in the southeastern region and lower elevations in the northwest, characteristic of a subtropical low-latitude highland monsoon climate. Seasonal temperature variations are relatively moderate, with distinct wet and dry seasons. The annual average temperature ranges between 14 °C and 17 °C, with a cumulative active temperature of 4566.4 °C for temperatures above 10 °C. Annual sunshine hours average 2054 h, while annual evaporation reaches 1856.4 mm [37]. Annual precipitation averages approximately 900.7 mm, with the rainy season concentrated between May and September. Summer and autumn experience heavy rainfall, whereas spring and winter are comparatively drier than other seasons. The vegetation fire prevention period lasts for 6–7 months, during which small fires are both frequent and challenging to manage. This area is a hotspot for forest fires and a major disaster zone in Yunnan Province [4].
The specific research area of wq_2006_ba is located in the northwest of Anning City, Yunnan Province. It lies at an elevation of 1880–2500 m, with a relative elevation difference of 620 m and an average slope of 25 degrees. Anning City exhibits a high forest coverage rate of 53%, predominantly composed of flammable coniferous species such as Yunnan pine (Pinus yunnanensis Franch), Yunnan cypress (Cupressus duclouxiana Hickel), Chinese pine (Pinus tabuliformis Carrière), and Huashan pine (Pinus armandii Franch) [36]. The region’s diverse climate and vegetation types contribute to complex fire behavior patterns. Forest fires predominantly occur during March and April, with high-incidence areas concentrated at elevations between 1000 and 3000 m [5].Vegetation coverage exceeds 60%, and the fuel load is over 10 kg/m2 [38]. For model training and sample data generation, three additional large, burned areas with varying distributions in Anning City were selected: the 2014 Lubiao burned area (lb_2014_ba), the 2019 Bajie burned area (bj_2019_ba), and the 2020 Qinglong burned area (ql_2020_ba).

2.2. Remote Sensing Data

The Landsat data utilized in this study were obtained from GEE, where they had undergone both geometric and radiometric corrections [39]. Previous research has demonstrated that satellite products with spatial resolutions greater than 100 m fail to provide sufficient spatial detail for precise assessments. In contrast, satellite imagery with a spatial resolution of 30 m can achieve an accuracy exceeding 90% [40]. Therefore, Landsat series satellite remote sensing data are well-suited for the assessment of forest fire severity and the dynamic monitoring of vegetation restoration [41]. This study adopted the data fusion method proposed by Roy et al. to integrate the Landsat 5 TM, 7 ETM+, and 8 OLI datasets from 2005 to 2020, which has been proven to have good application results in the Yunnan region (Formula (1)) [4,42,43].
O L I = T M E T M + s l o p e + i n t e r c e p t
where OLI refers to the Landsat 8 OLI imagery, TM to the Landsat 5 TM imagery, ETM+ to the Landsat 7 ETM+ imagery, slope to the conversion coefficients of three Landsat imagery, intercept is scaled by a factor of 10,000 to match the USGS Land Satellite Surface Reflectance data.
The cloud was removed by utilizing the C Function to generate corresponding quality assessment band bit mask information for preserving remote sensing images with cloud cover less than 50% [39,44]. To address the issues of band loss in Landsat 7 ETM+ data, the study adopts the morphological mean filtering method available in GEE. This method filters and fills each band in the images before applying masks, thereby producing reconstructed images suitable for analysis. The technical workflow of this research is depicted in Figure 2.

2.3. Indices Generation

NBR (Formula (2)) and dNBR (Formula (3)) are widely utilized remote sensing indices for identifying burned areas and classifying forest fire severity [45,46]. NBR is primarily employed for fire detection, while dNBR is extensively used for assessing fire severity.
Chao Wu et al. conducted experiments using dNBR in the fire-affected area survey in Yunnan Province. The results showed that dNBR is suitable for use in this study area [4]. Lihan et al. studied the fire effect extraction for different dNBR thresholds in the Yunnan region [23]. To enhance spectral feature representation, this study incorporates the NBR index as an additional band alongside the six existing Landsat bands (blue, green, red, near-infrared, shortwave infrared 1, and shortwave infrared 2) for feature extraction.
N B R = ( N I R S W I R 2 ) / ( N I R + S W I R 2 )
where NIR and SWIR2 represent the near-infrared band and shortwave infrared band, respectively.
d N B R = N B R p r e f i r e N B R p o s t f i r e
where N B R p r e f i r e and N B R p o s t f i r e represent the NBR values before and after the fire, respectively.

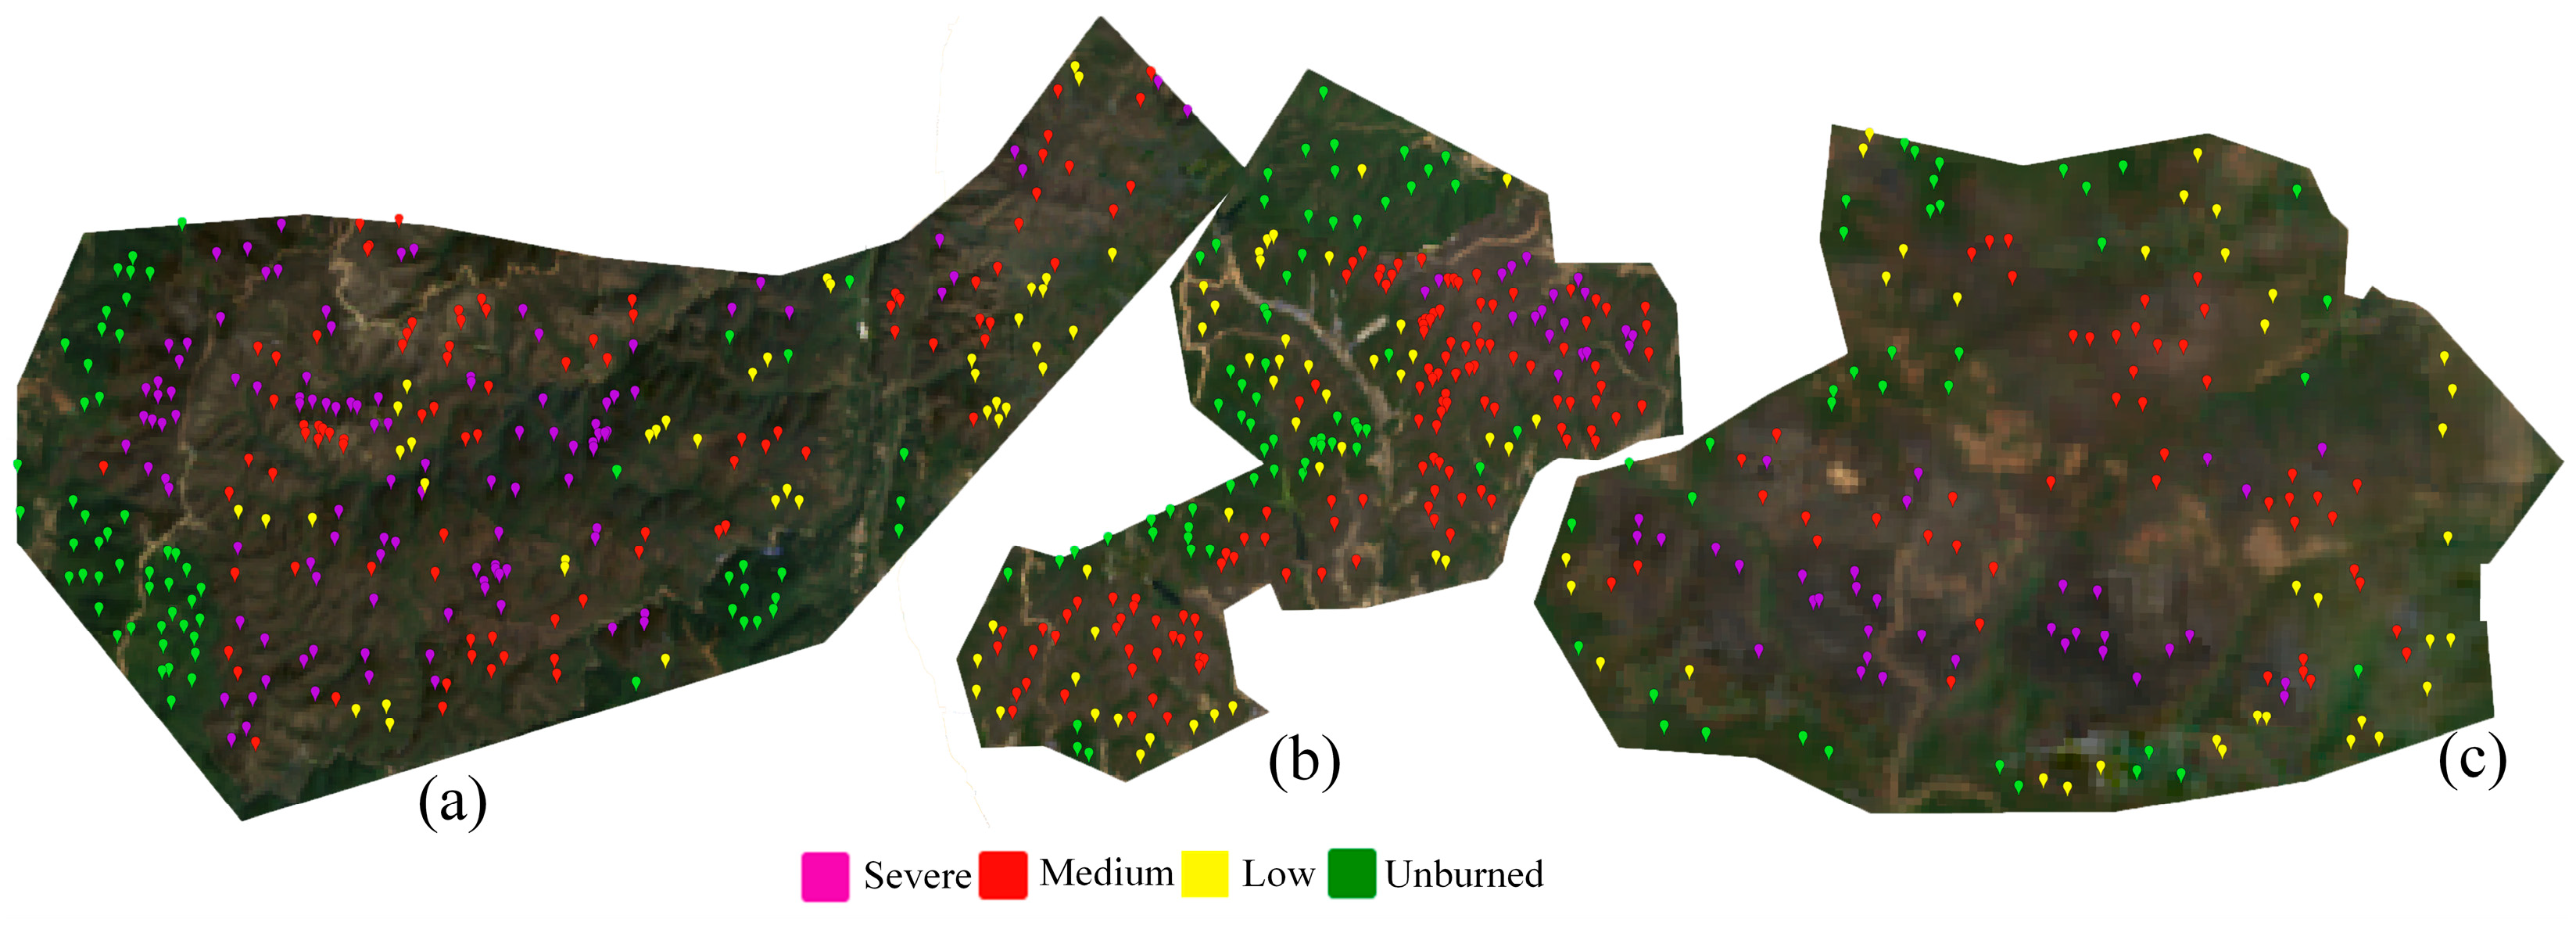
2.4. Forest Fire Severity Classification Samples Generation

The study used dNBR to represent the severity of forest fires. The higher the dNBR values are, the more intense the forest fire becomes and the larger the quantity of the fire is. The threshold division of dNBR is based on the United Nations standards for disaster reduction and emergency response [4]. The dNBR thresholds are categorized as follows: unburned areas [0.10 to −0.10), low burned areas [0.10–0.27), moderately burned fires [0.27–0.44), and severely burned areas [0.44–1). By calculating the dNBR values for the three burned areas, forest fire severity maps (lb_2014_ba, bj_2019_ba, and ql_2020_ba) were generated for each area, as illustrated in Figure 3.
Combining the forest fire severity map, we determined a total of 710 sample points in the three burned areas based on Landsat satellite images and manual visual feature identification and analysis (Figure 4) and were categorized by different fire severity severities. More specifically, 165 points were classified as severe, 262 were classified as moderate, 119 were classified as low, and 164 were classified as unburned. The dataset was then divided into two subsets; that is, 80% of the samples were allocated for model training, while the remaining 20% were reserved for validating the accuracy of the classification results.

2.5. Evaluation of ML Methods for Forest Fire Severity Classification

RF is an ensemble learning method introduced by Leo Breiman and Adele Cutler in 2001 [47]. The RF classifier involves five parameters: the number of classifier trees ntree; the number of variables per split (VariablesPerSplit), which is set to the square root of the number of variables; the resampling ratio (BagFraction), set to 0.5; the maximum number of leaf nodes (MaxNodes), which is unlimited, and the random seed parameter (seed), with a value of 0 indicating that different data will be extracted in each iteration. The remaining parameter set at its default, while the ntree is set to the following values: 1–35, 38–42, 48–51, 100, 101, 150, 200, 300, and 500. The alterations in OA (Overall Accuracy) and Kappa (Kappa Coefficient) were calculated and observed.
CART classifier is defined by two parameters: the maximum number of leaf nodes (nmaxleaf) and the minimum number of training samples (nsample). Set nsample to 1–45, 50, 75, 100, 200 in sequence.
The SVM classifier employed in this study comprises a total of five parameters, namely KernelType, which is set to Linear, thereby indicating the utilisation of the linear mode. The value of ‘Svm_Type’ has been set to ‘C_SVM’, which indicates that the C_SVM type of support vector machine is being utilized. The value of Shrinking is set to ‘true’ by default, indicating the use of contraction probing. The remaining parameters are left unchanged, and the COST value is selected as the experimental parameter. Experiments are conducted with values of 1–41, 50, 75, 90, 100, 120, 150, 200, 300, and 50. The experiments were conducted in sequence.
NB is a classification method based on Bayes’ theory, with the assumption of conditional independence between features [48]. The NB classifier has only one experimental parameter λ, which represents the probability of unobserved classes not seen during training to 0. The values of λ are set to 0.000001, 0.00001, 0.0001, 0.001, 0.01, and 0.1 in sequence.

2.6. Analysis Method of Post-Fire Vegetation Recovery

LSWI (Formula (4)) and NDVI (Formula (5)) indices are widely utilized to assess vegetation growth and monitor crop drought conditions [20,49]. By calculating the normalized ratio of near-infrared and shortwave infrared bands, these indices effectively capture the changes in surface vegetation and water content [50]. NBR is an effective spectral index to evaluate vegetation fire severity [51]. This study adopted NDVI, LSWI, and NBR as indices for evaluating post-fire vegetation recovery.
L S W I = ( N I R S W I R 1 ) / ( N I R + S W I R 1 )
where NIR and SWIR1 represent the reflectance of near-infrared and short-wave infrared 1, respectively.
N D V I = ( N I R R E D ) / ( N I R + R E D )
where NIR and RED represent the reflectance of near-infrared and red infrared, respectively.

3. Results

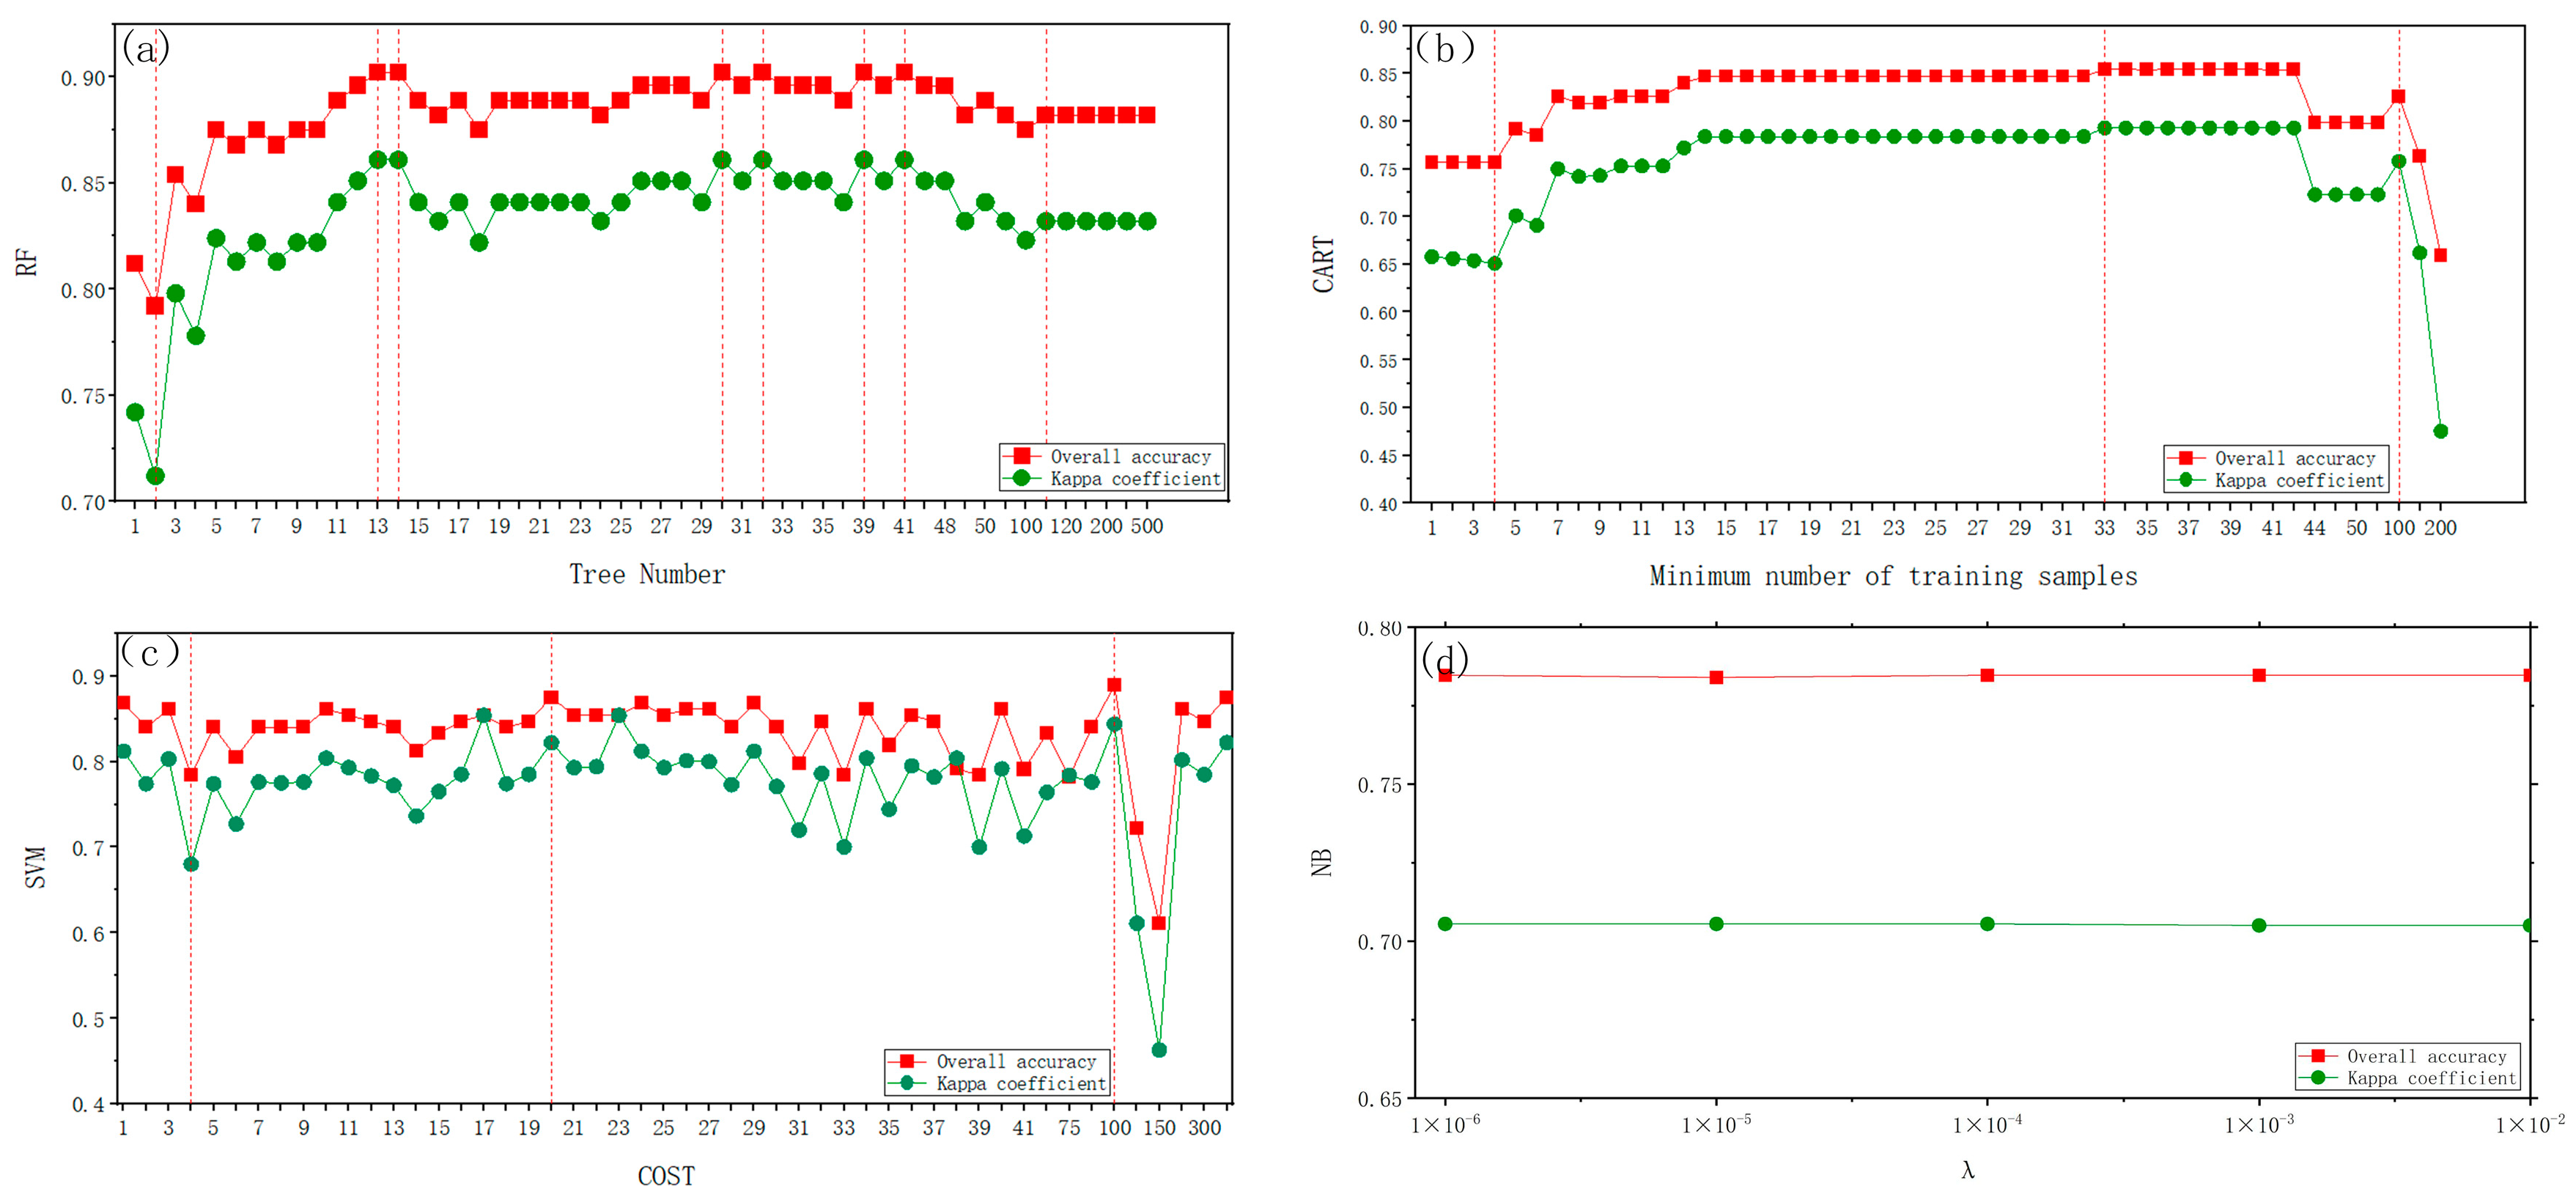
3.1. Classification Accuracy of Four ML Methods

Figure 5 shows the experimental summary classification results of RF, CART, SVM, and NB.
For RF algorithms, when ntree is less than 5, the number of trees is inversely proportional to the precision. When the ntree is within the range of 5–100, the OA and Kappa coefficients attain values between 0.8 and 0.9. When ntree is set to a value between 13 and 30, 32, 39, or 41, OA reaches its maximum value of 0.9. When the ntree was set to a value greater than 100, the OA and Kappa values exhibited a decline but remained within a stable range, not less than 0.8. These findings suggest that modifying the ntree value in RF can yield multiple optimal solutions, with RF demonstrating high classification accuracy.
For CART algorithms, when nsample is 4 and 7, OA has experienced a sudden increase phenomenon; when nsample is 33, accuracy reaches a peak, OA is 0.85, and then the temperature is kept stable. When the nsample is 45, there is a small decrease, and a large drop occurs when nsample is 150 or 200. Compared with RF, the OA of CART changes more obviously when the nsample is small and large, while the change is not obvious when the nsample is middle.
For SVM algorithms, when the COST value is below 100, variations in the COST parameter do not significantly affect OA or show a discernible trend. The highest accuracy, 0.875, was observed at a COST value of 20. However, at a COST value of 150, OA declined sharply before increasing again when the COST value reached 200.
For NB algorithms, changing the value of λ does not affect OA and Kappa.
The OAs of four ML algorithms were ranked from the highest to the lowest as follows: RF (0.90) > SVM (0.88) > CART (0.85) > NB (0.78). Based on these findings, it is recommended to select the parameter set that achieves the highest OA value as the best configuration. For RF, the optimal ntree is 13; for CART, the optimal nsample is 33; for SVM, the optimal COST value is 20; and for NB, the optimal λ value is 0.000001. Following this, the forest fire severity in the sampling areas should be classified separately, with the pixel-level analysis used to compute the classified area.

3.2. Fire Severity Changes in the Post-Fire Vegetation Recovery in wq_2006_ba from 2005 to 2020

A total of 16 maps of forest fire severity were extracted by RF based on the annual average synthetic Landsat images from 2005 to 2020 in the area of wq_2006_ba. The changes in four different burned areas (severe, moderate, low, and unburned) were analyzed using pixel analysis (Figure 6).
In 2006, compared to the previous year, the unburned areas exhibited a significant decrease following the fire, shrinking by 10 km2. Conversely, the moderate burned areas increased by 3 km2, while the low burned areas grew by 7 km2. Notably, both moderately and slightly burned areas showed substantial expansion, particularly the slightly burned areas, whereas the severely burned areas expanded by less than 1 km2. This discrepancy may be attributed to the averaging of pixel values in the annual remote sensing images, which likely resulted in a less pronounced increase in the severely burned areas within a given year. In the year following the fire (2007), both severely and moderately burned areas reached their maximum extent, with the moderately burned areas covering 6 km2. This increase can be explained by the transformation of some slightly burned areas into moderately and severely burned areas. By the second year after the fire (2008), the areas affected by severely and moderately burned areas began to decrease.
The extent of the severely burned areas notably declined, appearing to stabilize, indicating that this area demonstrated the most rapid recovery among the four fire severity areas. Meanwhile, the moderately burned areas exhibited a slowing decline, alongside a reduction in fire severity. During this period, the slightly burned areas saw a resurgence, reaching a maximum of 12 km2, largely as a result of the recovery of previously severely and moderately burned areas. Simultaneously, the unburned areas began to expand, reflecting the accelerated recovery of vegetation. In the third year following the fire (2009), the slightly burned areas contracted by 1 km2 compared to the previous year, while the unburned areas increased by 2 km2.
Some continual changes occurred in severely, moderately, and slightly burned and unburned areas after the fires between 2005 and 2020. By the fourth year (2010), the unburned areas decreased by 1 km2, while the slightly and moderately burned areas remained unchanged, and the severely burned areas increased by 1 km2. It may have been caused by a second small fire. By the fifth year (2011), the unburned areas deviated from the stable growth trend observed in the previous three years, showing a pattern of continued growth. Furthermore, the balance between the severely, moderately, and slightly burned areas reversed the trend seen earlier, with severely and moderately burned areas returning to their post-fire conditions, while the slightly burned areas began to decrease significantly. By the sixth year (2012), the unburned areas showed a reinforced growth rate as vegetation entered a phase of rapid recovery. The moderately burned areas returned to their post-fire levels, while the slightly burned areas began a steep decline, breaking the stable trend observed over the previous three years. This shift indicates that the recovery from severely to moderately burned areas occurred more slowly than the transition from slightly burned areas back to vegetated areas. By the seventh year (2013), the severely burned areas were reduced to zero km2 for the first time. The moderately burned areas had largely recovered to their post-fire levels, surpassing the recovery of slightly burned areas. The unburned areas continued their rapid expansion, suggesting that the impact of the fire in this region had largely been mitigated. By the eighth year (2014), both the unburned and slightly burned areas had recovered to their post-fire levels. The unburned areas experienced significant growth between the fifth and eighth years after the fire, followed by a slower growth rate between the eighth and eleventh years. This growth pattern contrasted with the trend observed in the slightly burned areas, where a strong negative correlation was identified between the changes in unburned and slightly burned areas. By the ninth year (2015), both the moderately and slightly burned areas continued to decline. The moderately burned areas reached zero km2 for the first time, while the unburned areas increased by 2 km2. This suggests that vegetation has entered a stage of growth and improvement. By the eleventh year (2017), the unburned areas peaked at 20 km2, while the low burned areas decreased to 1 km2. By the twelfth year (2018), the unburned areas maintained a stable maximum of 20 km2, while the slightly burned areas remained at 2 km2. This indicates that a small portion of the slightly burned areas could not be fully restored, possibly due to misidentification factors such as wasteland. At this stage, vegetation growth had reached its peak, entering a stable status in recovery.

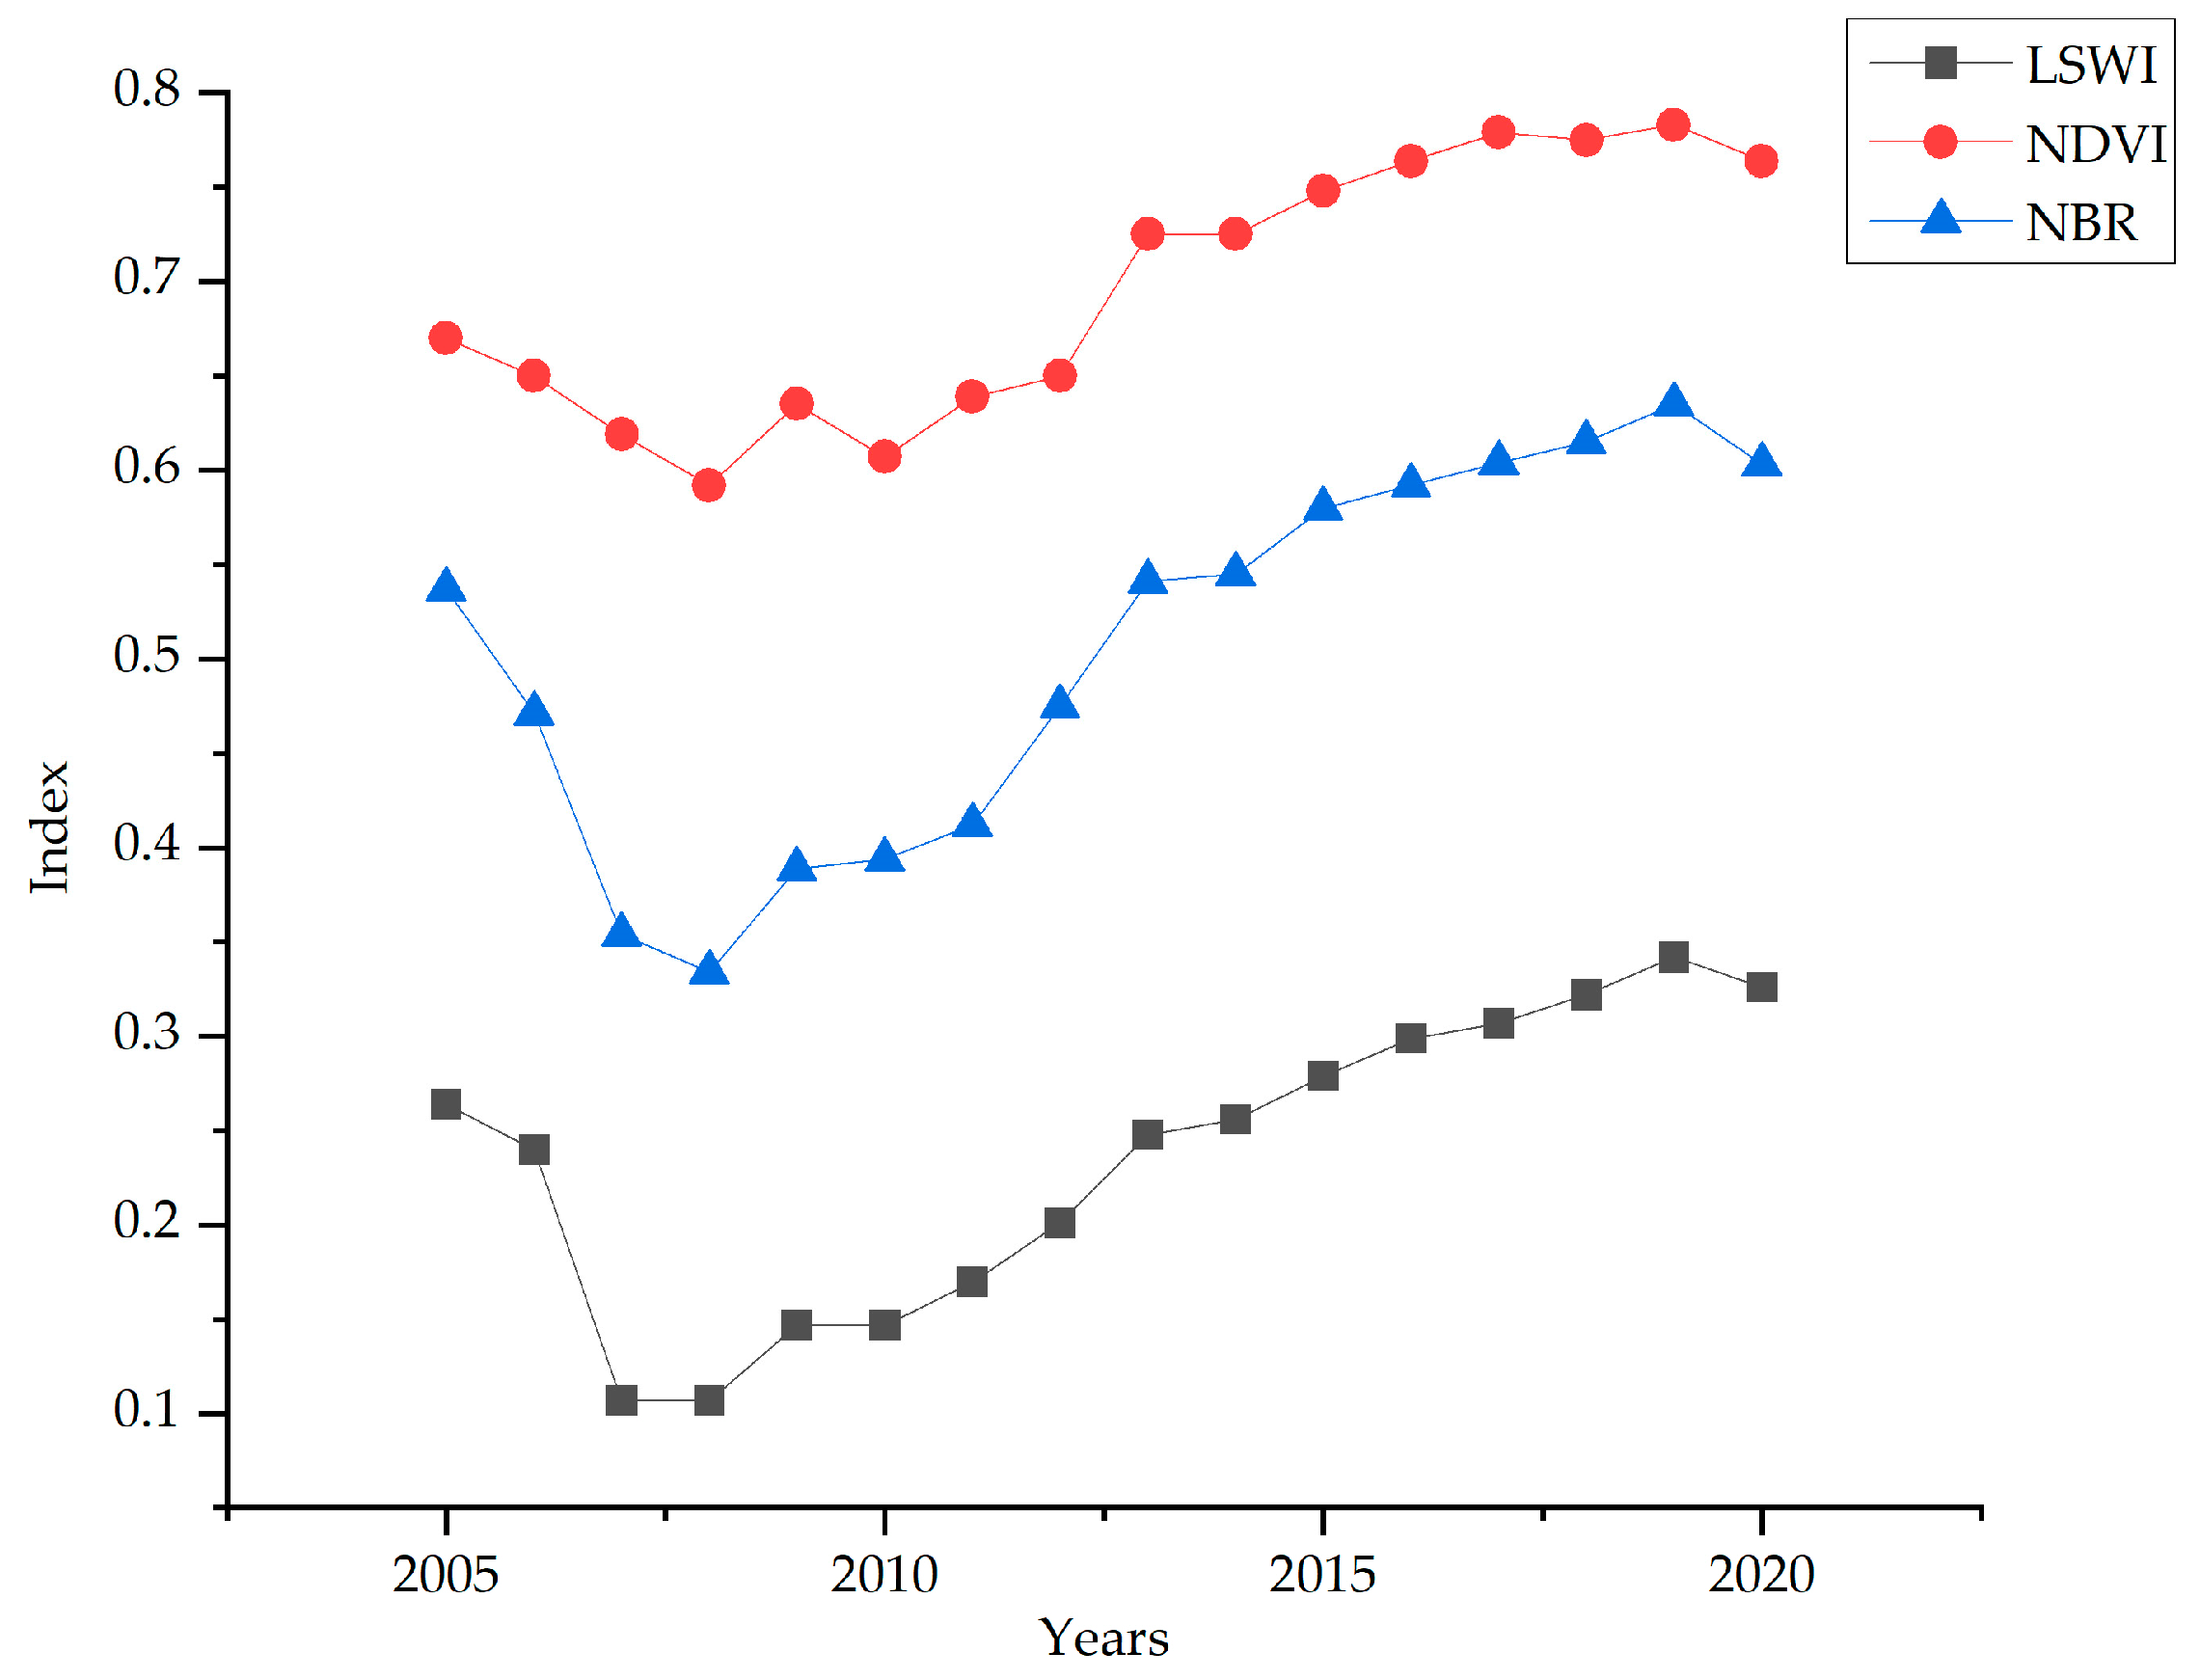
3.3. Indexes Changes in the Post-Fire Vegetation Recovery in wq_2006_ba from 2005 to 2020

To supplement the explanation of post-forest vegetation recovery in wq_2006_ba, this study utilized NDVI, LSWI, and NBR to calculate the annual mean index from 2006 to 2020 (Figure 7). From 2000 to 2020, LSWI, NDVI, and NBR in wq_2006_ba demonstrated consistent patterns of change after the fires. By the first year following the fire (2007), all three indices experienced significant declines, with the regions affected by severe and moderate fires reaching their peak in severity and the LSWI index reaching its minimum value. By the second year (2008), the NDVI and NBR indices dropped further to their lowest levels, while the LSWI index remained stable. By the third year after the fire (2009), all three indices began a marked upward trend, signifying the onset of accelerated vegetation recovery. This recovery coincided with a reduction in the extent of slightly burned areas. By the fourth year (2010), the three indices reached a stable state, reflecting equilibrium where the rate of transition from severely and moderately burned areas to slightly burned areas matched the vegetation recovery rate. Between the fifth and seventh years after the fire (2011–2013), the NDVI and LSWI indices displayed rapid growth, indicative of substantial vegetation recovery. During this period, severely burned areas returned to their pre-fire levels, moderately burned areas gradually declined, and slightly burned areas experienced a sharp decrease. By the eighth year (2014), the growth rate of all three indices slowed, and the affected burned areas had recovered to pre-fire levels, signaling the onset of a vegetation re-growth phase. By the ninth year (2015), the growth rates of the indices accelerated again, with the vegetation area increasing by 3 km2, suggesting that previously burned areas were transforming into vegetated zones. This upward trajectory persisted into the tenth year (2016). From 2016 to 2019, the indices displayed sustained growth; however, no further increases were observed in the subsequent two years, suggesting that the expansion of vegetation into formerly unburned areas had reached its limitation. By the thirteenth year, the NDVI, LSWI, and NBR indices peaked and subsequently stabilized, indicating that vegetation recovery in unburned areas had reached a saturation point.

3.4. Fire Severity Is Better in Reflection of the Post-Fire Vegetation Recovery than Indexes in Central Yunnan

The integration of RF classification-derived forest fire severity data reveals that both remote sensing indices and fire severity metrics effectively capture post-fire vegetation recovery dynamics. However, fire severity provides more precise insights into internal changes within burned areas and the vegetation recovery process. While unburned areas exhibit consistent patterns with the three indices, the classification results offer a more intuitive visualization of vegetation change states and their spatiotemporal distribution. The analysis of unburned area dynamics serves as a reliable indicator for assessing post-fire vegetation recovery.
Notably, by the 11th post-fire year (2018), the unburned area plateaued, while the three indices continued to increase, suggesting that vegetation coverage had reached its maximum extent and entered a phase of qualitative improvement. Slightly fire-burned areas began to decline after peaking in the second post-fire year, coinciding with increases in all three indices, marking the onset of ecosystem recovery. These areas maintained stability between 3 and 5 years post-fire, corresponding to gradual index increases and steady declines in moderate–severe areas. A significant reduction in low-severity areas occurred between 6 and 9 years post-fire, accompanied by substantial index growth, indicating accelerated vegetation recovery.
Severe and moderate fire areas peaked immediately post-fire when index values were minimal. Moderate fire areas recovered to pre-fire conditions by the seventh year, though unburned areas and vegetation indices remained below baseline levels, with residual low-severity impacts persisting. Severity fire areas achieved recovery by the second post-fire year. These findings demonstrate a sequential recovery pattern: low fire areas lag behind moderate fire areas, which in turn recover more slowly than severe fire areas.

4. Discussion

4.1. Integrated dNBR and Visual Interpretation Is Capable of Accurately and Quickly Collecting Abundant Classification Samples

At present, forest fire severity samples for ML classification algorithms are manually interpreted from remote sensing imagery or rely on existing fire datasets, such as Global Burned Area 2000 (1 km) [34], MCD14ML [52] (1000 m), and MCD45A1 [53] (500 m). The former is a labor-intensive and time–cost method, requires field investigations to verify, and is difficult to cover a wide range of wildfire areas. The latter is adapted to a large space–time scale, but the resolution and accuracy are relatively low (>100 m).
dNBR has become a powerful tool for assessing burned severity [54], which has been shown to produce a reasonable mapping of the spatial variation in severity within a single fire across a range of vegetation communities [55,56]. This study demonstrated that dNBR is an efficient index that can quickly and accurately detect different forest fire sample areas (OA ≥ 90%) from fine-resolution images (≤30 m). Within these accurate burned areas, abundant training and verifying samples can be quickly and accurately collected in flexible spatiotemporal scales. It has the advantages of saving time, reducing labor, adapting large scales, and high accuracy compared to traditional field investigations or manual interpretation based on remote sensing imagery. This method can be used to quickly obtain abundant training and verifying samples, especially for a large region.

4.2. RF Exhibits Excellent Performance in Precisely Mapping the Severity of Forest Fires Within Plateau Regions Characterized by a Complex Mountainous Environment

The classification accuracy of four commonly used ML algorithms (RF, SVM, CART, and NB) for extracting forest fire severity in the Anning mountainous regions of central Yunnan is ranked as follows: RF (0.90) > SVM (0.89) > CART (0.85) > NB (0.70). All four algorithms are supervised ML methods, and their classification accuracy is influenced by factors such as sample quality, model parameters, and environmental conditions. In this study, RF obtained the highest classification accuracy among others; the possible reason is that RF is insensitive to multi-collinearity and robustness when handling noisy data and datasets with missing values. Additionally, RF can effectively predict outcomes using thousands of explanatory variables and maintain a balanced classification error rate even when the class distribution is highly imbalanced [57]. However, this study’s parameter exploration for the ML algorithms was not exhaustive. Instead, only parameters with the most prominent features were selected for experimentation. Future work will focus on comprehensive parameter optimization across various ML algorithms to identify more effective parameter combinations and further enhance classification performance.

4.3. Dynamic Characteristics of Post-Fire Changes in Different Forest Fire Severity Zones

The experimental results demonstrate that the post-fire recovery period is contingent upon the severity of forest fires. The areas with severe fire damage occupy the smallest portion, and their transformation time is the shortest. In general, it transforms into moderate or severe burn zones within two years after the fire. The moderately burned area peaks in the second year, then gradually decreases and returns to pre-burn levels by the eighth year. The slightly burned area remains stable for 3–5 years after the fire, at which point the transition from severe and moderate to slight and from slight to unburned reaches equilibrium. In the sixth year, the area of slight burn severity began to decrease rapidly, corresponding to increased vegetation recovery, while the unburned area increased significantly. Concurrently, the NDVI and LSWI indices indicate that vegetation growth commenced an increase from the fifth year following the fire, while the area of unburned areas remained stable at this time. The possible reason is the transformation of some low areas. The recovery period that vegetation recovers to pre-fire level in this study area is about eight years, while in the north, it is nine years. This discrepancy may be attributed to the favorable water and heat conditions, which facilitate accelerated vegetation recovery [58].

4.4. Limitations and Uncertainties

4.4.1. Limitations

While integrating dNBR and visual interpretation can efficiently and accurately collect abundant classification samples, this approach also has limitations. For instance, manual visual interpretation is required to ensure sample accuracy, which is time-consuming in areas with a high number of samples. Although RF demonstrates superior applicability and accuracy in detecting complex and dynamic mountain fires in highland regions, misclassifications due to unique geographical features and shadows cast by similar mountains must be considered. Additionally, these methods exhibit a temporal lag, relying on post-fire analysis, which limits their ability to prevent fires at an early stage. Human activities, such as deforestation or re-ignition of fires, can also impact vegetation recovery processes.

4.4.2. Uncertainties

The vegetation environment exhibits a high degree of complexity, compounded by variations in fire protection conditions and soil characteristics. Additionally, fire susceptibility varies significantly across forest species (e.g., coniferous, deciduous, mixed) and forest types. Future research will integrate feature data such as forest land type, fire severity, textures, and elevation to enhance classification accuracy. This approach may help mitigate misclassification and errors caused by mountain shadows and soil heterogeneity. Furthermore, analyzing fire occurrence probabilities and variations in post-fire vegetation recovery across different forest types could offer insights into tree species that are better suited for fire prevention, post-fire restoration, and ecological reconstruction.

5. Conclusions

This study developed a method by integrating NBR and visual interpretation to quickly and accurately collect abundant different forest fire severity classification samples from forest fire scopes where forest fires occurring year is known (2014_lb_ba, 2019_bj_ba and 2020_ql_ba) based on Landsat series imagery. Based on these samples, 16 maps of forest fire severity were generated by the RF machine learning algorithm in the scope of 2006_wq_ba from 2005 to 2020 based on Landsat 5 TM/ETM+/8 OLI images. The post-fire vegetation recovery dynamics were analyzed and compared using indicators of NDVI, EVI, and dNBR. The findings demonstrated that (1) the dNBR index enables the rapid and accurate generation of abundant training samples for forest fire severity classification within a broad scope. (2) Severely burned areas were observed to transition into moderately or slightly burned areas within the second year after the fire. (3) Vegetation of moderately burned areas recovered to pre-fire levels about seven years, as well as severely burned areas. In contrast, slightly burned areas remained stable between the third and the fifth years. This study highlights that quantitative analyses of forest fire severity offer more precise insights into vegetation recovery saturation than vegetation indices alone, and the restoration of vegetation in the southern mountainous areas is one to two years shorter than that in the north. The results provide valuable theoretical support for designing fire vegetation restoration plans.
Future work is anticipated to enhance classification accuracy by integrating factors such as mountain shading, slope, and natural environmental changes. Additionally, model training will be employed to elucidate the correlation between post-fire severity and vegetation recovery across diverse forest types and regions, thereby providing more intuitive and timely forest management strategies.

Author Contributions

Conceptualization: P.L., W.K. and W.Z.; methodology: P.L. and W.K.; software: P.L. and W.K.; validation: Q.W. and L.W.; formal analysis: W.Z., P.L. and W.K.; investigation: Z.D., W.Z. and W.K.; data curations: W.Z., P.L. and W.K; writing—original draft: P.L. and W.K; writing-review and editing: W.Z., W.K., P.L. and Q.W.; visualization: P.L., W.K. and W.Z. All authors have read and agreed to the published version of the manuscript.

Funding

This research was supported by funding from the National Natural Science Foundation of China (Grant No. 32260391), the Yunnan International Joint Laboratory of Natural Rubber Intelligent Monitoring and Digital Applications (202403AP140001), and Yunnan Fundamental Research Projects (Grant Nos. 202301BD070001-160, 2018FG001-059), as well as the Xingdian Talent Program Industrial Innovation Talent Special Project.

Data Availability Statement

Data can be obtained from GEE.

Conflicts of Interest

The authors declare no conflicts of interest.

References

  1. Toivonen, J.; Kangas, A.; Maltamo, M.; Kukkonen, M.; Packalen, P. Assessing biodiversity using forest structure indicators based on airborne laser scanning data. For. Ecol. Manag. 2023, 546, 121376. [Google Scholar] [CrossRef]
  2. Xu, X.; Li, Y.; Li, S.; Fan, H. Post-fire forest recovery trajectory characterized by a modified LandTrendr recovery detection method: A case study of Pinus yunnanensis forests. Agric. For. Meteorol. 2024, 354, 110084. [Google Scholar] [CrossRef]
  3. Carta, F.; Zidda, C.; Putzu, M.; Loru, D.; Anedda, M.; Giusto, D. Advancements in Forest Fire Prevention: A Comprehensive Survey. Sensors 2023, 23, 6635. [Google Scholar] [CrossRef]
  4. Wu, C.; Xu, W.H.; Xiao, W.C.; Wang, Q.H.; Yuan, H.; Dong, J.; Huang, S.D.; Xiong, Y. Dynamic change of recovery rate of typical burned land in central Yunnan and its influencing factors. Resour. Sci. 2021, 43, 2465–2474. [Google Scholar]
  5. He, Y.; Xu, H.; Chen, J. Temporal and spatial distribution characteristics of forest fires in Yunnan Province. J. Cent. South Univ. For. Technol. 2017, 37, 36–41. [Google Scholar] [CrossRef]
  6. Neary, D.G.; Klopatek, C.C.; DeBano, L.F.; Ffolliott, P.F. Fire effects on belowground sustainability: A review and synthesis. For. Ecol. Manag. 1999, 122, 51–71. [Google Scholar] [CrossRef]
  7. Ruiz, J.A.M.; Lazaro, J.R.G.; Cano, I.D.; Leal, P.H. Burned Area Mapping in the North American Boreal Forest Using Terra-MODIS LTDR (2001–2011): A Comparison with the MCD45A1, MCD64A1 and BA GEOLAND-2 Products. Remote Sens. 2014, 2014, 815–840. [Google Scholar] [CrossRef]
  8. Bond, J.G.P.W.J. On the Three Major Recycling Pathways in Terrestrial Ecosystems. Trends Ecol. Evol. 2020, 35, 767–775. [Google Scholar]
  9. Qiu, J.; Wang, H.; Shen, W.; Zhang, Y.; Li, M. Quantifying Forest Fire and Post-Fire Vegetation Recovery in the Daxin’anling Area of Northeastern China Using Landsat Time-Series Data and Machine Learning. Remote Sens. 2021, 13, 792. [Google Scholar] [CrossRef]
  10. Llorens, R.; Sobrino, J.A.; Fernández, C.; Fernández-Alonso, J.M.; Vega, J.A. A methodology to estimate forest fires burned areas and burn severity degrees using Sentinel-2 data. Application to the October 2017 fires in the Iberian Peninsula. Int. J. Appl. Earth Obs. Geoinf. 2021, 95, 102243. [Google Scholar] [CrossRef]
  11. Sun, F.; Qin, X.; Liu, C.; Li, X. Potential analysis of typical vegetation index for identifying burned areas. Remote Sens. Land Resour. 2019, 31, 204–211. [Google Scholar]
  12. Leisenheimer, L.; Wellmann, T.; Jänicke, C.; Haase, D. Monitoring drought impacts on street trees using remote sensing—Disentangling temporal and species-specific response patterns with Sentinel-2 imagery. Ecol. Inform. 2024, 82, 102659. [Google Scholar] [CrossRef]
  13. Lal, M.; Jatisankar, B.; Rubel, S.; Ismail, M.; Trong, N.T.; Cesare, L.G.F.; Tran, A.D. Estimation of agricultural burned affected area using NDVI and dNBR satellite-based empirical models. J. Environ. Manag. 2023, 343, 118226. [Google Scholar]
  14. Zhang, K.; Zhu, C.; Li, J.; Shi, K.; Zhang, X. Reconstruction of dense time series high spatial resolution NDVI data using a spatiotemporal optimal weighted combination estimation model based on Sentinel-2 and MODIS. Ecol. Inform. 2024, 82, 102725. [Google Scholar] [CrossRef]
  15. Rozario, P.F.; Madurapperuma, B.D.; Wang, Y. Remote sensing approach to detect burn severity risk zones in Palo Verde National Park, Costa Rica. Remote Sens. 2018, 10, 1427. [Google Scholar] [CrossRef]
  16. Giddey, B.L.; Baard, J.A.; Kraaij, T. Verification of the differenced Normalised Burn Ratio (dNBR) as an index of fire severity in Afrotemperate Forest. South Afr. J. Bot. 2022, 146, 348–353. [Google Scholar] [CrossRef]
  17. Chaudhary, S.K.; Pandey, A.C.; Parida, B.R. Forest Fire Characterization Using Landsat-8 Satellite Data in Dalma Wildlife Sanctuary. Remote Sens. Earth Syst. Sci. 2022, 5, 11–16. [Google Scholar] [CrossRef]
  18. Chen, D.; Loboda, T.V.; Hall, J.V. A systematic evaluation of influence of image selection process on remote sensing-based burn severity indices in North American boreal forest and tundra ecosystems. ISPRS J. Photogramm. Remote Sens. 2020, 159, 63–77. [Google Scholar] [CrossRef]
  19. Wagtendonk, J.W.v.; Root, R.R.; Key, C.H. Comparison of AVIRIS and Landsat ETM+ detection capabilities for burn severity. Remote Sens. Environ. 2003, 92, 397–408. [Google Scholar] [CrossRef]
  20. Kou, W.; Liang, C.; Wei, L.; Hernandez, A.; Yang, X. Phenology-Based Method for Mapping Tropical Evergreen Forests by Integrating of MODIS and Landsat Imagery. Forests 2017, 8, 34. [Google Scholar] [CrossRef]
  21. Guo, Y.; Xia, H.; Pan, L.; Zhao, X.; Li, R.; Bian, X.; Wang, R.; Yu, C. Development of a New Phenology Algorithm for Fine Mapping of Cropping Intensity in Complex Planting Areas Using Sentinel-2 and Google Earth Engine. ISPRS Int. J. Geo-Inf. 2021, 10, 587. [Google Scholar] [CrossRef]
  22. Steiner, J.L.; Wetter, J.; Robertson, S.; Teet, S.; Wang, J.; Wu, X.; Zhou, Y.; Brown, D.; Xiao, X. Grassland wildfires in the Southern Great Plains: Monitoring ecological impacts and recovery. Remote Sens. 2020, 12, 619. [Google Scholar] [CrossRef]
  23. Han, L.; Bi, H.; Wang, Q.; Gao, L. The influence of image selection and threshold on dNBR extraction of fire-scarred land. Remote Sens. Inf. 2023, 38, 47–55. [Google Scholar] [CrossRef]
  24. Xu, H.; Chen, J.; He, G.; Lin, Z.; Bai, Y.; Ren, M.; Zhang, H.; Yin, H.; Liu, F. Immediate assessment of forest fire using a novel vegetation index and machine learning based on multi-platform, high temporal resolution remote sensing images. Int. J. Appl. Earth Obs. Geoinf. 2024, 134, 104210. [Google Scholar] [CrossRef]
  25. Guria, R.; Mishra, M.; Silva, R.M.d.; Mishra, M.; Santos, C.A.G. Predicting forest fire probability in Similipal Biosphere Reserve (India) using Sentinel-2 MSI data and machine learning. Remote Sens. Appl. Soc. Environ. 2024, 36, 101311. [Google Scholar] [CrossRef]
  26. Tahri, M.; Badr, S.; Mohammadi, Z.; Kašpar, J.; Berčák, R.; Holuša, J.; Surový, P.; Marušák, R.; Yousfi, N. New forest fire assessment model based on artificial neural network and analytic hierarchy process or fuzzy-analytic hierarchy process methodology for fire vulnerability map. Eng. Appl. Artif. Intell. 2024, 138, 109399. [Google Scholar] [CrossRef]
  27. Dastour, H.; Hassan, Q.K. A multidimensional machine learning framework for LST reconstruction and climate variable analysis in forest fire occurrence. Ecol. Inform. 2024, 83, 102849. [Google Scholar] [CrossRef]
  28. Sarkar, M.S.; Majhi, B.K.; Pathak, B.; Biswas, T.; Mahapatra, S.; Kumar, D.; Bhatt, I.D.; Kuniyal, J.C.; Nautiyal, S. Ensembling machine learning models to identify forest fire-susceptible zones in Northeast India. Ecol. Inform. 2024, 81, 102598. [Google Scholar] [CrossRef]
  29. Singha, C.; Swain, K.C.; Moghimi, A.; Foroughnia, F.; Swain, S.K. Integrating geospatial, remote sensing, and machine learning for climate-induced forest fire susceptibility mapping in Similipal Tiger Reserve, India. For. Ecol. Manag. 2024, 555, 121729. [Google Scholar] [CrossRef]
  30. Hong, D.; Gao, L.; Yokoya, N.; Yao, J.; Chanussot, J.; Du, Q.; Zhang, B. More diverse means better: Multimodal deep learning meets remote-sensing imagery classification. IEEE Trans. Geosci. Remote Sens. 2020, 59, 4340–4354. [Google Scholar] [CrossRef]
  31. Milanović, S.; Kaczmarowski, J.; Ciesielski, M.; Trailović, Z.; Mielcarek, M.; Szczygieł, R.; Kwiatkowski, M.; Bałazy, R.; Zasada, M.; Milanović, S.D. Modeling and mapping of forest fire occurrence in the Lower Silesian Voivodeship of Poland based on Machine Learning methods. Forests 2023, 14, 46. [Google Scholar] [CrossRef]
  32. Llopis, M.P.; Vastaranta, M.; Saarinen, N.; Olabarria, J.R.G.; Gonzalo, J.G.; Yudego, B.M. Post-fire vegetation dynamics and location as main drivers of fire recurrence in Mediterranean forests. For. Ecol. Manag. 2024, 568, 122126. [Google Scholar] [CrossRef]
  33. Tingting, H.; Jiwang, G.; Wu, X.; Suchen, X.; Hang, C. A novel method for identification of disturbance from surface coal mining using all available Landsat data in the GEE platform. ISPRS J. Photogramm. Remote Sens. 2023, 205, 17–33. [Google Scholar]
  34. Long, T.; Zhang, Z.; He, G.; Jiao, W.; Tang, C.; Wu, B.; Zhang, X.; Wang, G.; Yin, R. 30 m Resolution Global Annual Burned Area Mapping Based on Landsat Images and Google Earth Engine. Remote Sens. 2019, 11, 489. [Google Scholar] [CrossRef]
  35. Yang, D.; Yang, Z.; Wen, Q.; Ma, L.; Guo, J.; Chen, A.; Zhang, M.; Xing, X.; Yuan, Y.; Lan, X.; et al. Dynamic monitoring of aboveground biomass in inner Mongolia grasslands over the past 23 Years using GEE and analysis of its driving forces. J. Environ. Manag. 2024, 354, 120415. [Google Scholar] [CrossRef]
  36. Liang, R.; Jiao, B.; Tian, P.; Yang, F. Analysis on two prediction methods of forest fire in Anning City. For. Constr. 2021, 20–25. [Google Scholar]
  37. Wang, Q.; Xiao, H.; Xu, S.; Li, S.; Lin, S. Study on the burning property of shrubbery in the burned land of the “March 29” major forest fire in Anning, central Yunnan Province. J. Saf. Environ. 2016, 16, 138–141. [Google Scholar] [CrossRef]
  38. Duan, Y.; Zhou, R.; Zhou, Z. Fire area assessment of Anning “3.29” in Yunnan based on CBERS remote sensing data. Study Geogr. Environ. Yunnan 2009, 21, 89–92+83+112. [Google Scholar]
  39. Yin, X.; Kou, W.; Yun, T.; Gu, X.; Lai, H.; Chen, Y.; Wu, Z.; Chen, B. Tropical Forest Disturbance Monitoring Based on Multi-Source Time Series Satellite Images and the LandTrendr Algorithm. Forests 2022, 13, 2038. [Google Scholar] [CrossRef]
  40. Wu, J.; Sun, L.; Rui, P.; Feng, R.; Yu, W.; Zhang, Y. Research progress and prospect of remote sensing extraction of burned land information. Disaster Sci. 2020, 35, 151–156. [Google Scholar]
  41. Liu, Y. Forest Fire Identification and Post Fire Vegetation Restoration Assessment Based on Gee. Master’s Thesis, Beijing Forestry University, Beijing, China, 2020. [Google Scholar]
  42. Roy, D.P.; Kovalskyy, V.; Zhang, H.; Vermote, E.F.; Yan, L.; Kumar, S.; Egorov, A. Characterization of Landsat-7 to Landsat-8 reflective wavelength and normalized difference vegetation index continuity. Remote Sens. Environ. 2016, 185, 57–70. [Google Scholar] [CrossRef] [PubMed]
  43. Xiao, W. Research on Remote Sensing Monitoring of Cultivated Land Changes in Yunnan Province Based on GEE in the Past 10 Years. Master’s Thesis, Yunnan Normal University, Kunming, China, 2020. [Google Scholar]
  44. Quintero, N.; Viedma, O.; Urbieta, I.R.; Moreno, J.M. Assessing Landscape Fire Hazard by Multitemporal Automatic Classification of Landsat Time Series Using the Google Earth Engine in West-Central Spain. Forests 2019, 10, 518. [Google Scholar] [CrossRef]
  45. Delcourt, C.J.; Combee, A.; Izbicki, B.; Mack, M.C.; Maximov, T.; Petrov, R.; Rogers, B.M.; Scholten, R.C.; Shestakova, T.A.; van Wees, D. Evaluating the differenced normalized burn ratio for assessing fire severity using Sentinel-2 imagery in Northeast Siberian Larch Forests. Remote Sens. 2021, 13, 2311. [Google Scholar] [CrossRef]
  46. Wang, A. NDVI Time Series Reconstruction and Spatio-Temporal Dynamic Analysis of Forest Recovery After Fire. Master’s Thesis, Harbin Normal University, Harbin, China, 2018. [Google Scholar]
  47. Breiman, L. Random forests. Mach. Learn. 2001, 45, 5–32. [Google Scholar] [CrossRef]
  48. Oman. Research and Application of Naive Bayes Classification Algorithm. Master’s Thesis, Dalian University of Technology, Dalian, China, 2014.
  49. Hamunyela, E.; Brandt, P.; Shirima, D.; Do, H.T.T.; Herold, M.; Roman-Cuesta, R.M. Space-time detection of deforestation, forest degradation and regeneration in montane forests of Eastern Tanzania. Int. J. Appl. Earth Obs. Geoinf. 2020, 88, 102063. [Google Scholar] [CrossRef]
  50. Al-Shalabi, E.; Sepehrnoori, K.; Delshad, M. Numerical simulation of the LSWI effect on hydrocarbon recovery from carbonate rocks. Pet. Sci. Technol. 2015, 33, 595–603. [Google Scholar] [CrossRef]
  51. Prasetyo, Y.; Sukmono, A.; Aziz, K.W.; Prakosta Santu Aji, B.J. Rice Productivity Prediction Model Design Based On Linear Regression of Spectral Value Using NDVI and LSWI Combination On Landsat-8 Imagery. IOP Conf. Ser. Earth Environ. Sci. 2018, 165, 012002. [Google Scholar] [CrossRef]
  52. Iban, M.C.; Aksu, O. SHAP-Driven Explainable Artificial Intelligence Framework for Wildfire Susceptibility Mapping Using MODIS Active Fire Pixels: An In-Depth Interpretation of Contributing Factors in Izmir, Türkiye. Remote Sens. 2024, 16, 2842. [Google Scholar] [CrossRef]
  53. Giglio, L.; Boschetti, L.; Roy, D.P.; Humber, M.L.; Justice, C.O. The Collection 6 MODIS burned area mapping algorithm and product. Remote Sens. Environ. 2018, 217, 72–85. [Google Scholar] [CrossRef] [PubMed]
  54. Gale, M.G.; Cary, G.J.; Yebra, M.; Leavesley, A.J.; Van Dijk, A.I. Comparison of contrasting optical and LiDAR fire severity remote sensing methods in a heterogeneous forested landscape in south-eastern Australia. Int. J. Remote Sens. 2022, 43, 2538–2559. [Google Scholar] [CrossRef]
  55. Miller, J.D.; Thode, A.E. Quantifying burn severity in a heterogeneous landscape with a relative version of the delta Normalized Burn Ratio (dNBR). Remote Sens. Environ. 2006, 109, 66–80. [Google Scholar] [CrossRef]
  56. Soverel, N.O.; Perrakis, D.D.B.; Coops, N.C. Estimating burn severity from Landsat dNBR and RdNBR indices across western Canada. Remote Sens. Environ. 2010, 114, 1896–1909. [Google Scholar] [CrossRef]
  57. Lei, Z. Research on Random Forest and Its Application in Remote Sensing Image Processing. Master’s Thesis, Shanghai Jiao Tong University, Shanghai, China, 2012. [Google Scholar]
  58. Shi, L.; Dech, J.P.; Liu, H.; Zhao, P.; Bayin, D.; Zhou, M. Post-fire vegetation recovery at forest sites is affected by permafrost degradation in the Da Xing’an Mountains of northern China. J. Veg. Sci. 2019, 30, 940–949. [Google Scholar] [CrossRef]
Figure 1. The study area location and the sampling areas.
Forests 16 00263 g001
Figure 2. Technical workflow.
Forests 16 00263 g002
Figure 3. Burned area forest fire severity maps of (a) lb_2014_ba, (b) ql_2020_ba, and (c) bj_2019_ba (https://earthengine.google.com/, accessed on 10 November 2024).
Forests 16 00263 g003
Figure 4. Classification samples generation area. (a) lb_2014_ba, (b) ql_2020_ba, and (c) bj_2019_ba. (https://earthengine.google.com/, accessed on 10 November 2024).
Forests 16 00263 g004
Figure 5. Four ML classification accuracies: (a), (b), (c), and (d) are RF, CART, SVM, and NB, respectively.
Forests 16 00263 g005
Figure 6. The classification results and area statistics of the burned area from 2006 to 2021 in wq_2006_ba, (ap) are the classification results of forest fire intensities, and (q) are their statistical results (https://earthengine.google.com/, accessed on 10 November 2024).
Forests 16 00263 g006
Figure 7. The changes in post-fire vegetation recovery in NDVI, LSWI, and NBR from 2005 to 2020 in wq_2006_ba.
Forests 16 00263 g007
Disclaimer/Publisher’s Note: The statements, opinions and data contained in all publications are solely those of the individual author(s) and contributor(s) and not of MDPI and/or the editor(s). MDPI and/or the editor(s) disclaim responsibility for any injury to people or property resulting from any ideas, methods, instructions or products referred to in the content.

