Article

Extracting Individual Tree Positions in Closed-Canopy Stands Using a Multi-Source Local Maxima Method

by
Guozhen Lai
1,2,
Meng Cao
3,
Chengchuan Zhou
2,
Liting Liu
2,
Xun Zhong
2,
Zhiwen Guo
2 and
Xunzhi Ouyang
1,*
1
College of Forestry, Jiangxi Agricultural University, Nanchang 330045, China
2
Jiangxi Academy of Forestry, Nanchang 330032, China
3
Jiangxi Forestry Resources Monitoring Center, Nanchang 330045, China
*
Author to whom correspondence should be addressed.
Forests 2025, 16(2), 262; https://doi.org/10.3390/f16020262
Submission received: 2 January 2025 / Revised: 28 January 2025 / Accepted: 30 January 2025 / Published: 1 February 2025

Abstract

:
The accurate extraction of individual tree positions is key to forest structure quantification, and Unmanned Aerial Vehicle (UAV) visible light data have become the primary data source for extracting individual tree locations. Compared to deep learning methods, classical detection methods require lower computational resources and have stronger interpretability and applicability. However, in closed-canopy forests, challenges such as crown overlap and uneven light distribution hinder extraction accuracy. To address this, the study improves the existing Revised Local Maxima (RLM) method and proposes a Multi-Source Local Maxima (MSLM) method, based on UAV visible light data, which integrates Canopy Height Models (CHMs) and Digital Orthophoto Mosaics (DOMs). Both the MSLM and RLM methods were used to extract individual tree positions from three different types of closed-canopy stands, and the extraction results of the two methods were compared. The results show that the MSLM method outperforms the RLM in terms of Accuracy Rate (85.59%), Overall Accuracy (99.09%), and F1 score (85.21%), with stable performance across different forest stand types. This demonstrates that the MSLM method can effectively overcome the challenges posed by closed-canopy stands, significantly improving extraction precision. These findings provide a cost-effective and efficient approach for forest resource monitoring and offer valuable insights for forest structure optimization and management.

1. Introduction

The quantification of forest structure has emerged as a prominent focus in modern forest management research, with the accurate acquisition of individual tree positions serving as a critical component [1,2]. Accurate individual tree position monitoring plays a crucial role in quantifying forest structure; uncovering the relationships between forest structure, tree competition, and the spatial diversity of tree species; and facilitating the development of targeted strategies for optimizing forest structure [3,4]. Due to the complexity of forest environments and terrain, traditional field measurements face challenges such as large workloads, high costs, low efficiency, and poor timeliness, making them unsuitable for modern precision forestry requirements [5]. In contrast to traditional field measurements, satellite remote sensing allows for the collection of broader spatial data in a shorter time frame, improving fieldwork efficiency. However, it is constrained by issues such as low resolution, long revisit cycles, and cloud cover affecting clarity [6]. In recent years, the parallel development of Unmanned Aerial Vehicle (UAV) technology, sensors, and computer vision has facilitated the application of low-altitude UAV remote sensing in forestry resource monitoring [7]. Although airborne Light Detection and Ranging (LiDAR) data from UAVs provide high accuracy, their widespread use is limited by high costs and technical complexity [8]. In comparison, UAV visible light remote sensing data offer advantages such as simplicity in processing and low acquisition costs, making it the primary data source for individual tree position extraction [9].
The key to accurately extracting individual tree positions lies in the precise identification of tree crown apices [10]. Currently, mainstream approaches encompass deep learning and classical detection methods, each excelling in different scenarios. Deep learning methods leverage multi-source data to extract key features and accurately locate tree crown apices, but they require significant computational resources and extensive, high-quality training samples, with their accuracy being highly dependent on sample quality [11,12,13]. In contrast, classical detection methods require fewer computational resources, do not rely on large datasets, and offer better interpretability and broader applicability [14]. Widely used classical detection methods include the local maxima method [15], marker-controlled watershed segmentation method [16], template matching method [17], region-growing method [18], and edge detection method [19]. Classical detection methods excel in simple scenarios, such as orchards, urban street trees, and artificial young forests, where trees are sparsely distributed, have clear contours, and lack crown overlaps [20,21,22,23]. However, in closed-canopy stands with canopy closure exceeding 0.7, challenges such as crown overlap and uneven lighting significantly hinder existing classical detection methods, highlighting the need for further refinement [24,25,26].
The local maxima method is one of the most commonly used classical detection methods, with its core challenge being the identification of the pixel with the highest value within a localized image area. Traditional local maxima methods employ a moving window to search for local maxima; however, when the window size is too small, misclassification is likely to occur, whereas an overly large window may result in omissions. The window size thus requires repeated trial and error, making parameter selection a persistent difficulty [27]. The Revised Local Maxima (RLM) method proposed by Xu et al. [24] replaces the moving window approach with the identification of local maxima along feature curves. This allows users to visually inspect and set parameters, optimizing the parameterization process. However, this method utilizes only single-band data, which leads to significant commission and omission errors when processing complex closed-canopy stands. Extensive research has demonstrated that using a single type of remote sensing data for individual tree detection yields limited performance. Combining RGB imagery with additional spectral or structural information has proven effective in addressing errors caused by overlapping tree crowns, shadows, and background noise [28]. For example, Qin et al. [29] used a combination of UAV LiDAR, hyperspectral, and ultra-high-resolution RGB data to detect individual trees in subtropical broadleaf forests. This approach achieved an accuracy improvement of 10.2% to 19.0% compared to using single-source data alone. Similarly, Chen et al. [10] integrated spectral imagery with LiDAR data for individual tree detection in mixed needleleaf and broadleaf forests. They reported an accuracy of 96% when combining the two data sources, as opposed to 83% when using only LiDAR data. These results highlight the potential of multi-source data to significantly enhance the accuracy of individual tree position extraction.
Canopy Height Models (CHMs) and Digital Orthophoto Mosaics (DOMs) are commonly used data sources for individual tree position extraction through the local maxima method. These datasets can be derived from UAV visible light imagery using photogrammetric processing techniques, such as Structure from Motion (SfM) and Multi-View Stereo (MVS) [30]. Zhang et al. [31] generated CHM and DOM data from UAV visible light imagery and combined these datasets to extract individual tree positions in six different urban green spaces, achieving an overall extraction accuracy of 95.3%. They emphasized that CHM provides vertical structural information on trees, while DOM captures clearer crown textures and morphological features. By integrating these two data sources, the complementary strengths of different data types can be utilized to enhance the accuracy of individual tree position extraction. While this study achieved promising results, its scope was limited to urban green spaces and relied on deep learning methods. Currently, there is no research on employing the local maxima method combined with CHM and DOM for individual tree position extraction in mountainous closed-canopy forests.
Therefore, based on the hypothesis that integrating CHM and DOM can effectively improve the accuracy of individual tree position extraction in closed-canopy forests, this study improves the existing RLM method and proposes a Multi-Source Local Maxima (MSLM) method that integrates CHM and DOM. Three different types of mountainous closed-canopy forests were selected as study areas. UAV visible light imagery from these regions was used to generate CHMs and DOMs. Both the MSLM and RLM methods were employed for individual tree position extraction, and the resulting extractions were evaluated and compared against measured data. This study aims to validate the aforementioned hypothesis and address the limitations of the existing local maxima method in individual tree position extraction in mountainous closed-canopy forests. Additionally, it seeks to provide a low-cost and efficient technical approach to forest resource monitoring based on UAV visible light imagery, offering scientific support for the optimization and adjustment of forest structure.

2. Materials and Methods

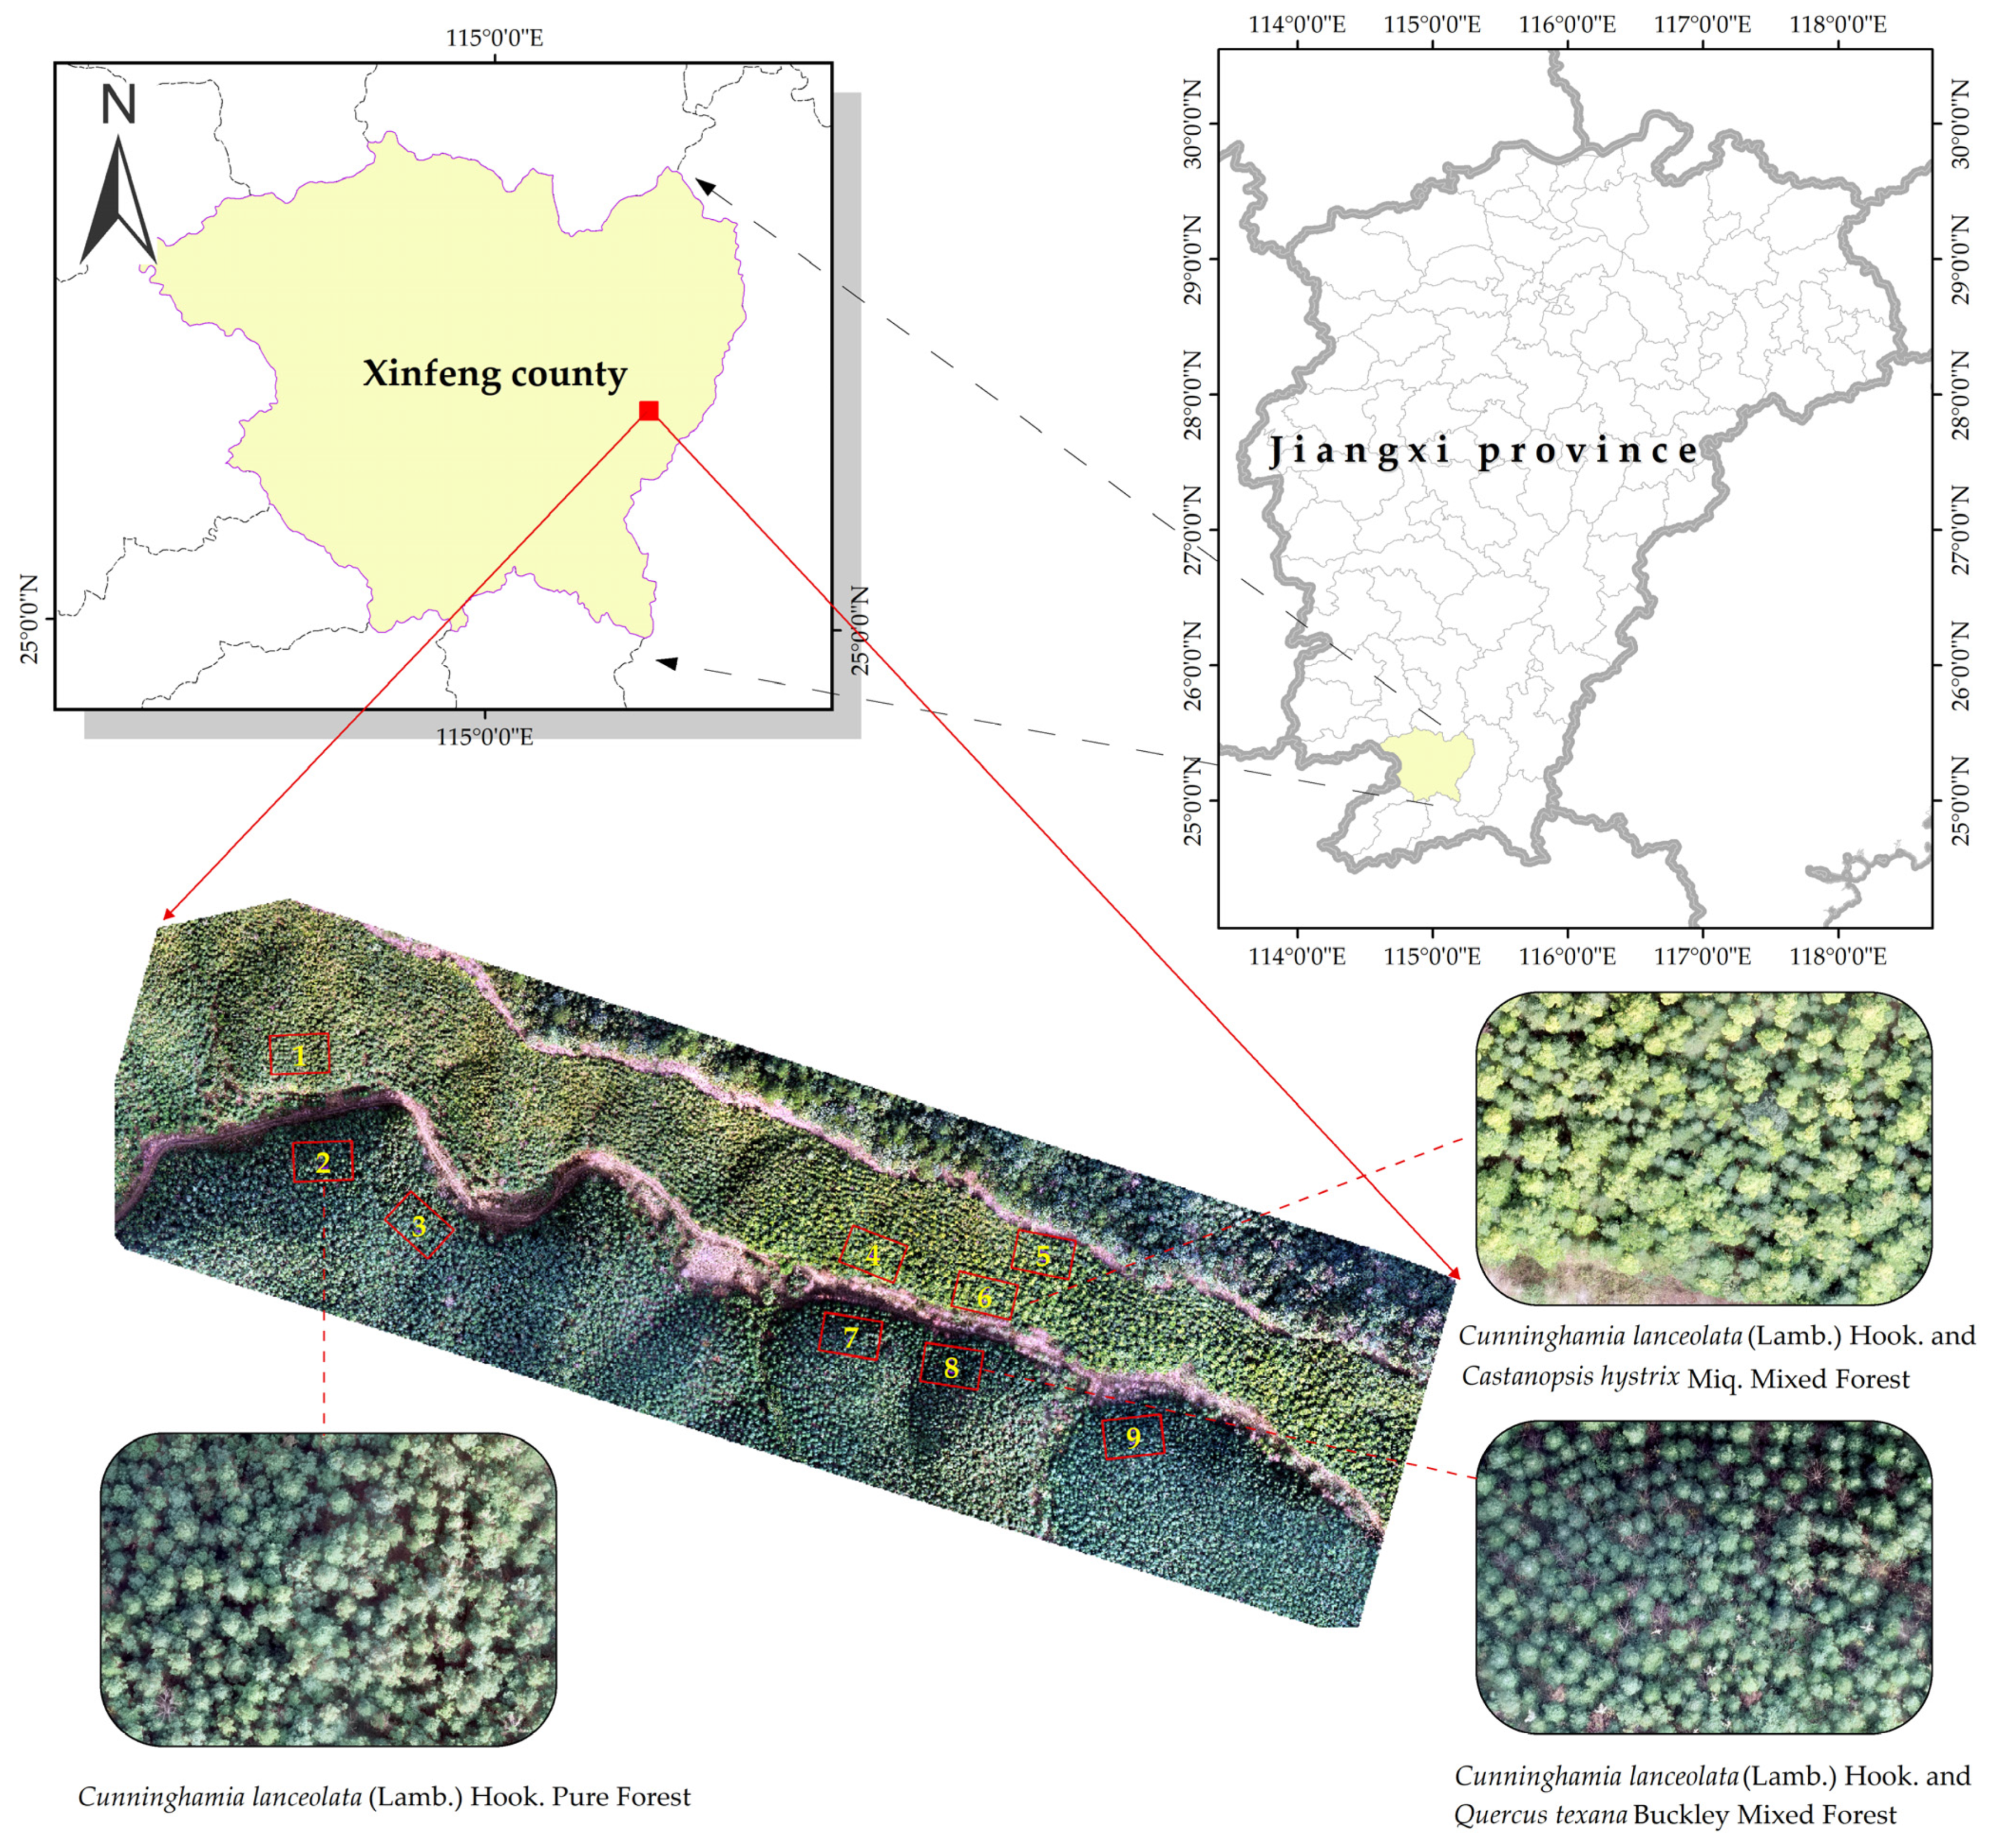
2.1. Overview of the Study Area

The study area is located in the Jinpen Mountain Forest Farm, Xinfeng County, Ganzhou City, Jiangxi Province, at 114°34′–114°19′ E, and 25°20′–25°23′ N. The forest farm covers a total area of 105.47 km2, with elevations ranging from 300 to 500 m and the highest peak reaching 970 m. The terrain is characterized by higher elevations in the south, sloping downward to the north, with an average gradient of 26–35° [32]. The distribution of the study area and sites locations is shown in Figure 1.

2.2. Study Data

2.2.1. Sample Plot Survey Data

The plot survey was conducted in January 2024 at the Dagongqiao Work Area of the Jinpen Mountain Forest Farm. The study selected three types of plantations: Cunninghamia lanceolata (Lamb.) Hook. Pure Forest (CLPF), Cunninghamia lanceolata and Castanopsis hystrix Miq. Mixed Forest (CL-CHMF), and Cunninghamia lanceolata and Quercus texana Buckley Mixed Forest (CL-QTMF). Three rectangular plots of 20 m × 30 m were set up for each type, totaling nine plots. The plots had an average diameter at breast height (DBH) of 12.1 cm, an average tree height of 8.7 m, a canopy closure greater than 0.8, a stand age of 12 years, and were planted using a contour interval method. The coordinates of each tree with a DBH greater than 5 cm were recorded using the Huace T9 RTK inertial navigation system (Huace Navigation Technology Ltd., Shanghai, China), with a total of 1215 trees measured. The basic characteristics of the sample plots are presented in Table 1.

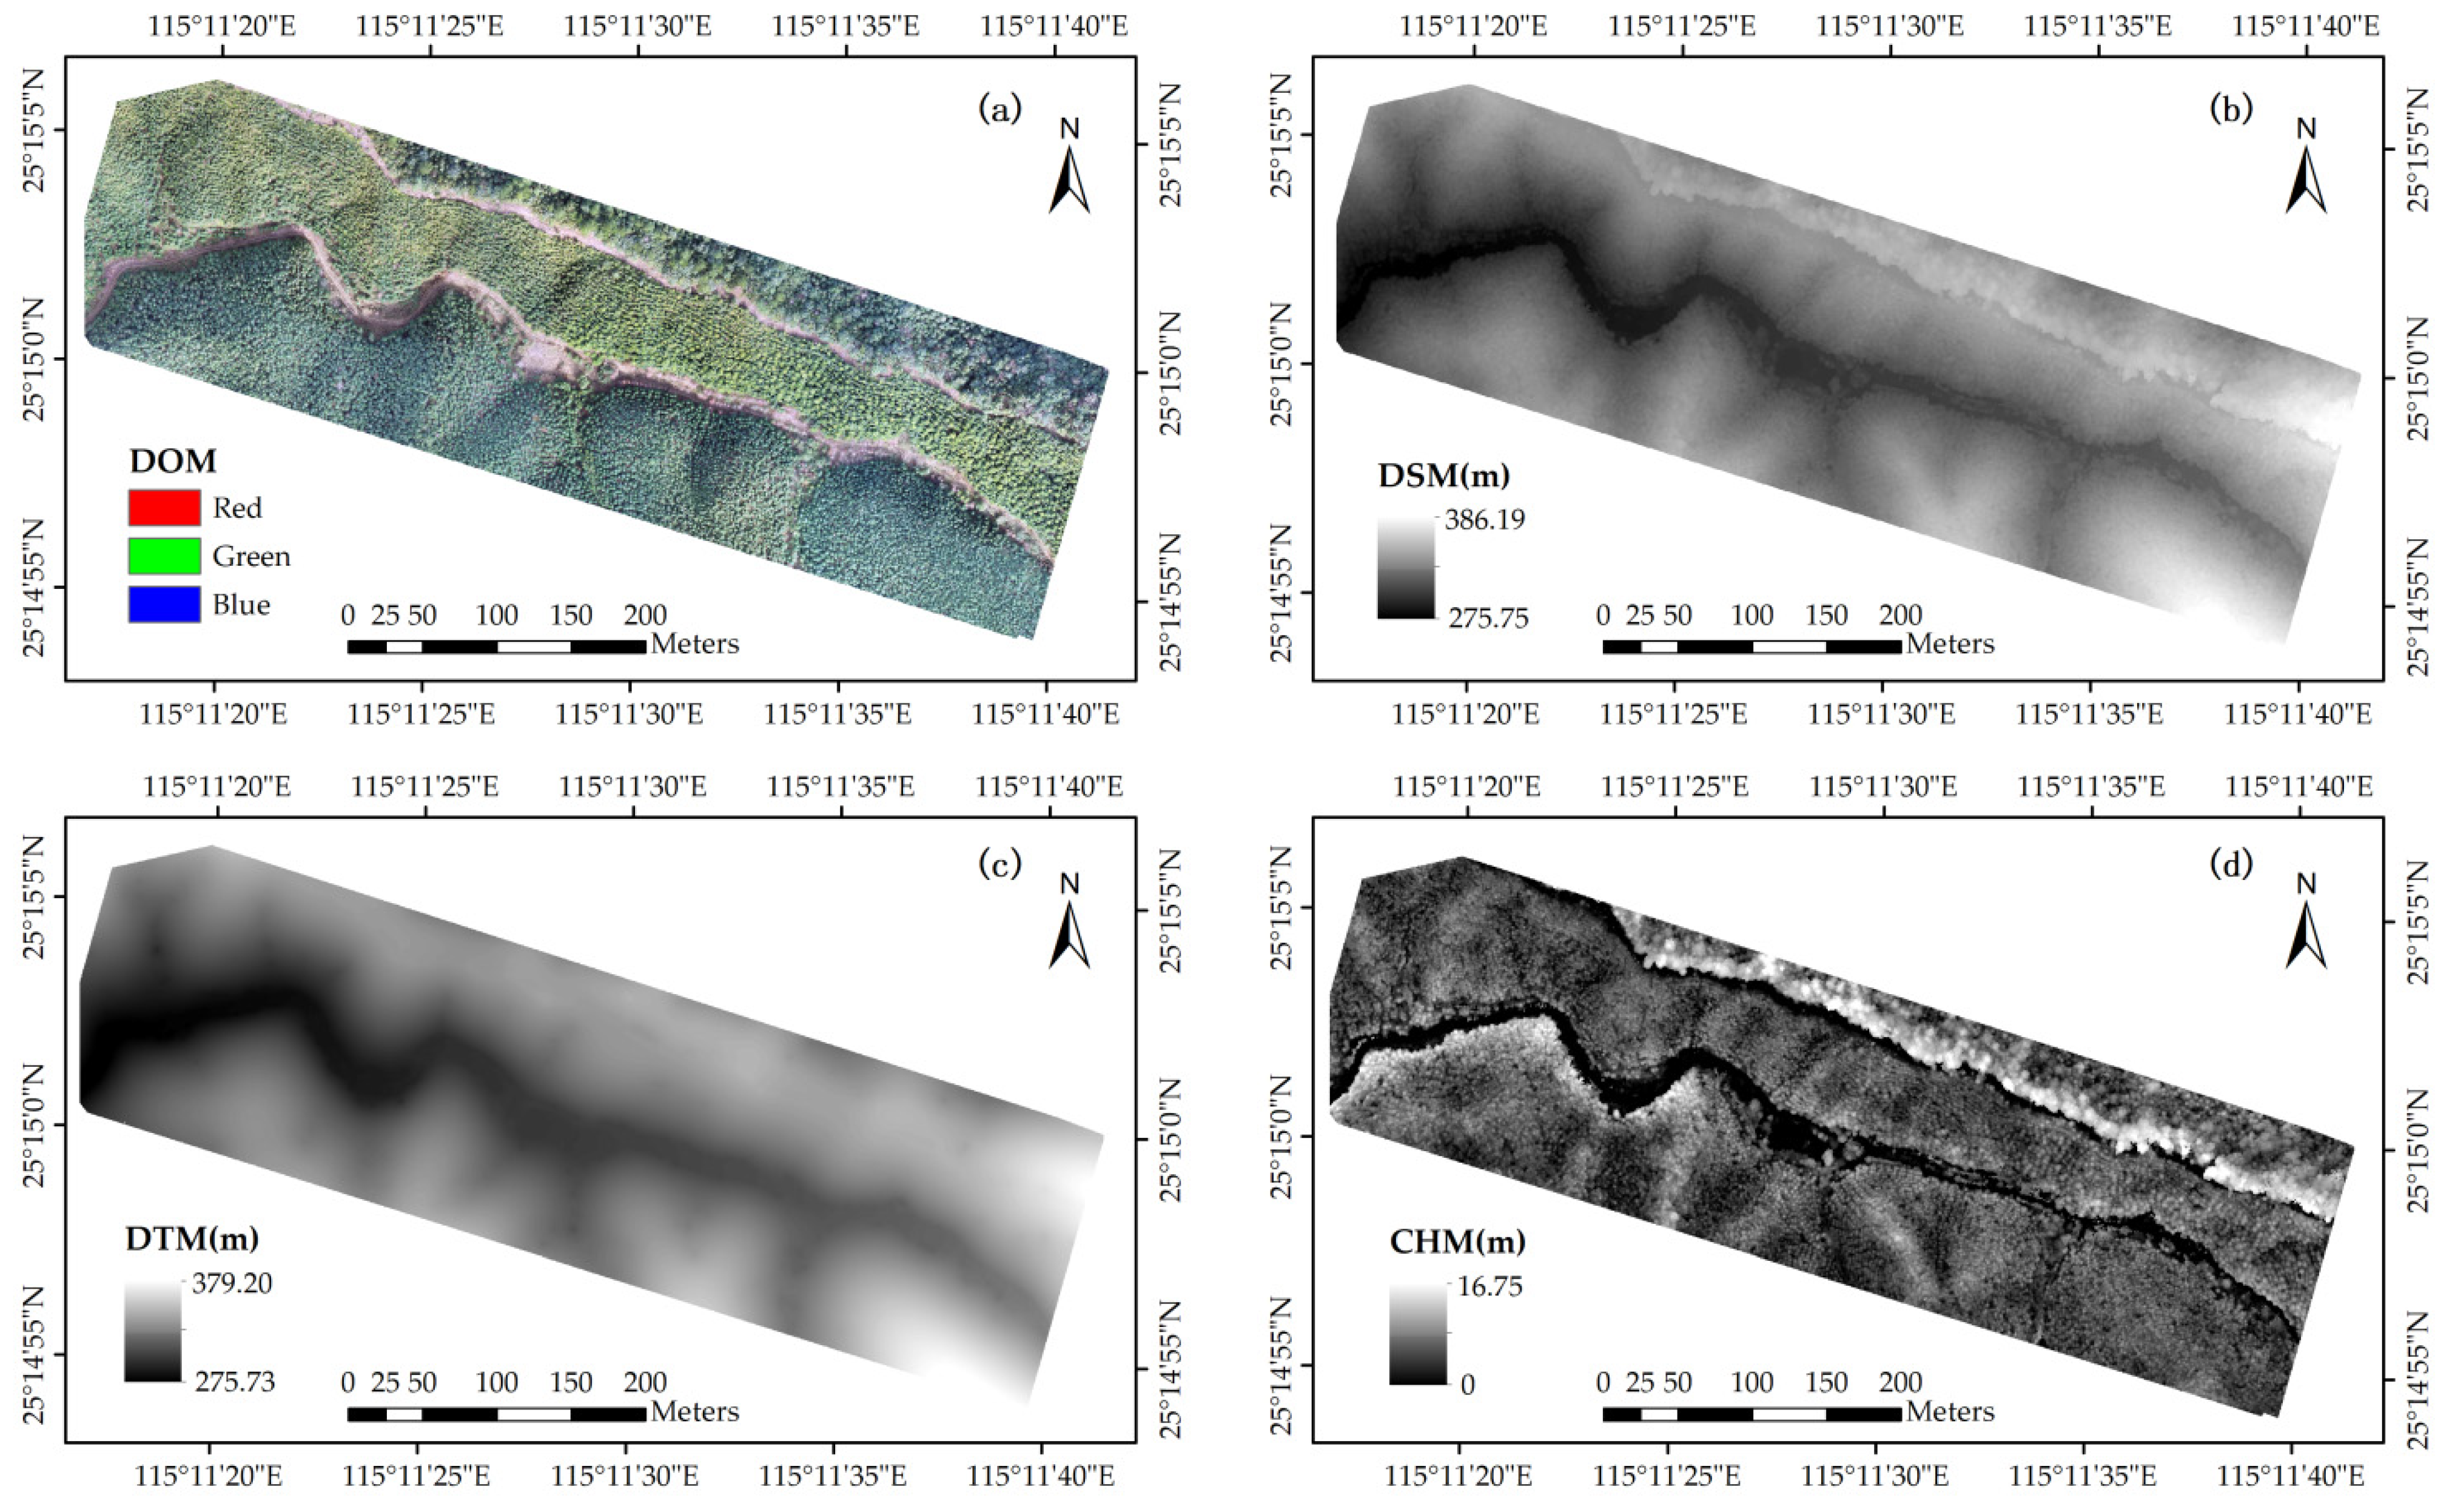
2.2.2. UAV Image Data

The image data for this study were collected using the DJI Phantom 4 RTK quadcopter UAV (DJI Technology Co., Ltd., Shenzhen, China). The UAV was equipped with a 1-inch FC6310R camera sensor (DJI Technology Co., Ltd., Shenzhen, China) capable of capturing 20-megapixel images with an 8.8 mm focal length and an f/5.6 autofocus aperture, supporting the red, green, and blue (RGB) spectral channels. The UAV was also outfitted with an onboard D-RTK system, which provided centimeter-level high-precision positioning for enhanced surveying accuracy.
The flight operation was completed on 14 January 2024, under clear weather conditions. A Digital Surface Model (DSM) terrain-following flight method was employed during data collection. The initial flight was conducted at an altitude of 200 m to capture the preliminary DSM of the study area. Subsequently, the terrain-following flight altitude was set to 50 m, with a front overlap rate of 80% and a side overlap rate of 70%. To acquire more detailed terrain information, the image acquisition range covered both the base and the summit of slopes, ensuring the inclusion of more ground points to generate a more comprehensive 3D model. A total of 770 images were captured and preprocessed using Pix4Dmapper (v4.4.12), an image processing software from Pix4D. The image processing workflow included the following steps [33]:
  • Image Preprocessing: Aerial images were initially screened to exclude those with color distortion, focus failure, or improper exposure. This step ensured consistency in brightness, saturation, and hue across the dataset, ensuring high-quality subsequent data processing.
  • Feature Point Extraction and Matching: The software automatically extracted relevant image and camera parameter information. Ground Control Points were added to aid feature matching and tracking.
  • Aerial Triangulation: Multi-view image bundle adjustment and aerial triangulation were performed. These steps extracted and matched image feature points, generating a sparse 3D point cloud.
  • Dense Point Cloud Generation: Based on the sparse point cloud, a dense 3D point cloud was produced using multi-view stereo matching algorithms.
  • DSM and DOM Generation: The dense point cloud was rasterized to generate a DSM with a resolution of 2.3 cm per pixel. Each pixel in the DSM represented the elevation of ground features, including structures and vegetation. The original images were geometrically and radiometrically corrected to produce a DOM with the same resolution of 2.3 cm per pixel. The pixel values in the DOM reflected the spectral reflectance characteristics of the corresponding ground features, typically in RGB colors.

2.2.3. Canopy Height Model

This study employs a point cloud filtering method based on the DOM to enhance the accuracy of ground point extraction and thereby derive individual tree heights in closed-canopy stands. After the spatial alignment of imagery and point cloud data, image features are extracted using the color and texture information from the DOM, which enables point cloud classification. To mitigate misclassification caused by tree crown shadows, the DSM is used to screen potential ground points. Once all potential ground points are identified, inner and outer buffers with a width of 1.0 m are created along each ground boundary. By comparing the elevation differences between the inner and outer buffers, erroneous ground points located on the forest canopy are excluded. The classified point cloud was subjected to noise reduction and manual adjustments. Ultimately, the filtered ground points were utilized, and the Kriging interpolation method was employed to generate a Digital Terrain Model (DTM). Each pixel value in the DTM represents the elevation of the bare ground at that location, excluding the heights of vegetation and buildings.
The CHM can be obtained by subtracting the DTM from the DSM. Each pixel value in the CHM represents the relative height of the vegetation canopy, which is the elevation difference between the DSM and DTM. The resolution of the canopy height model is 11.7 cm/pixel. The generated DOM, DSM, DTM, and CHM data are shown in Figure 2.

2.3. Study Methods

2.3.1. Multi-Source Local Maxima Method

Traditional local maxima methods are typically applied based on CHM and DOM data sources. For CHM-based local maxima methods, the approach utilizes the characteristic that the elevation values at tree crown apices are usually higher than those of the surrounding areas. This allows for identifying the pixel with the maximum elevation value within the tree crown to locate the tree crown apex position [34]. On the other hand, DOM-based local maxima methods rely on the property that the light intensity received at tree crown apices is generally greater than that at the crown edges, with higher light intensity corresponding to higher grayscale values. Thus, the tree crown apex can be identified by locating the pixel with the maximum grayscale value within the crown [35].
In this study, the existing RLM method was improved, and a Multi-Source Local Maxima (MSLM) method that combines CHMs and DOMs was proposed to enhance the accuracy of individual tree position extraction. A flowchart illustrating the MSLM method is provided in Figure 3. The specific steps are as follows.
  • Data Preprocessing
Since the CHM is generated by subtracting DTM from DSM, filtering and interpolation processes are required for point cloud data during DTM generation, resulting in the CHM and DOM having different spatial resolutions [31]. Therefore, before fusing these two images, the CHM image must be resampled to ensure that its pixel size and dimensions align with those of the DOM image, thereby guaranteeing spatial consistency in the final results. Additionally, the DOM data must be converted into grayscale images (Gray). The conversion formula is as follows [36]:
Gray = 0.2989 × R + 0.5870 × G + 0.1140 × B,
where R, G and B represent the red, green, and blue color channels of the DOM image, respectively.
2.
Identification of Potential Tree Crown Apices
This step follows the same procedure as the RLM algorithm. First, the custom parameters CLmin and CLmax are defined. Next, at a fixed sampling interval (CLmin), local maxima points (LMc) along the feature curve are identified for each column of the image. Subsequently, the local maxima values (LMr) along rows are identified for each LMc. Among these LMr, the one closest to LMc and within a distance of CLmax is selected as the initial seed point. The crown width estimation (CW) for the initial seed point is then calculated, where CW should be greater than or equal to CLmin and less than or equal to CLmax. Finally, K-means clustering and a distance threshold (half of the crown width estimation) are applied to determine the potential tree crown apices.
3.
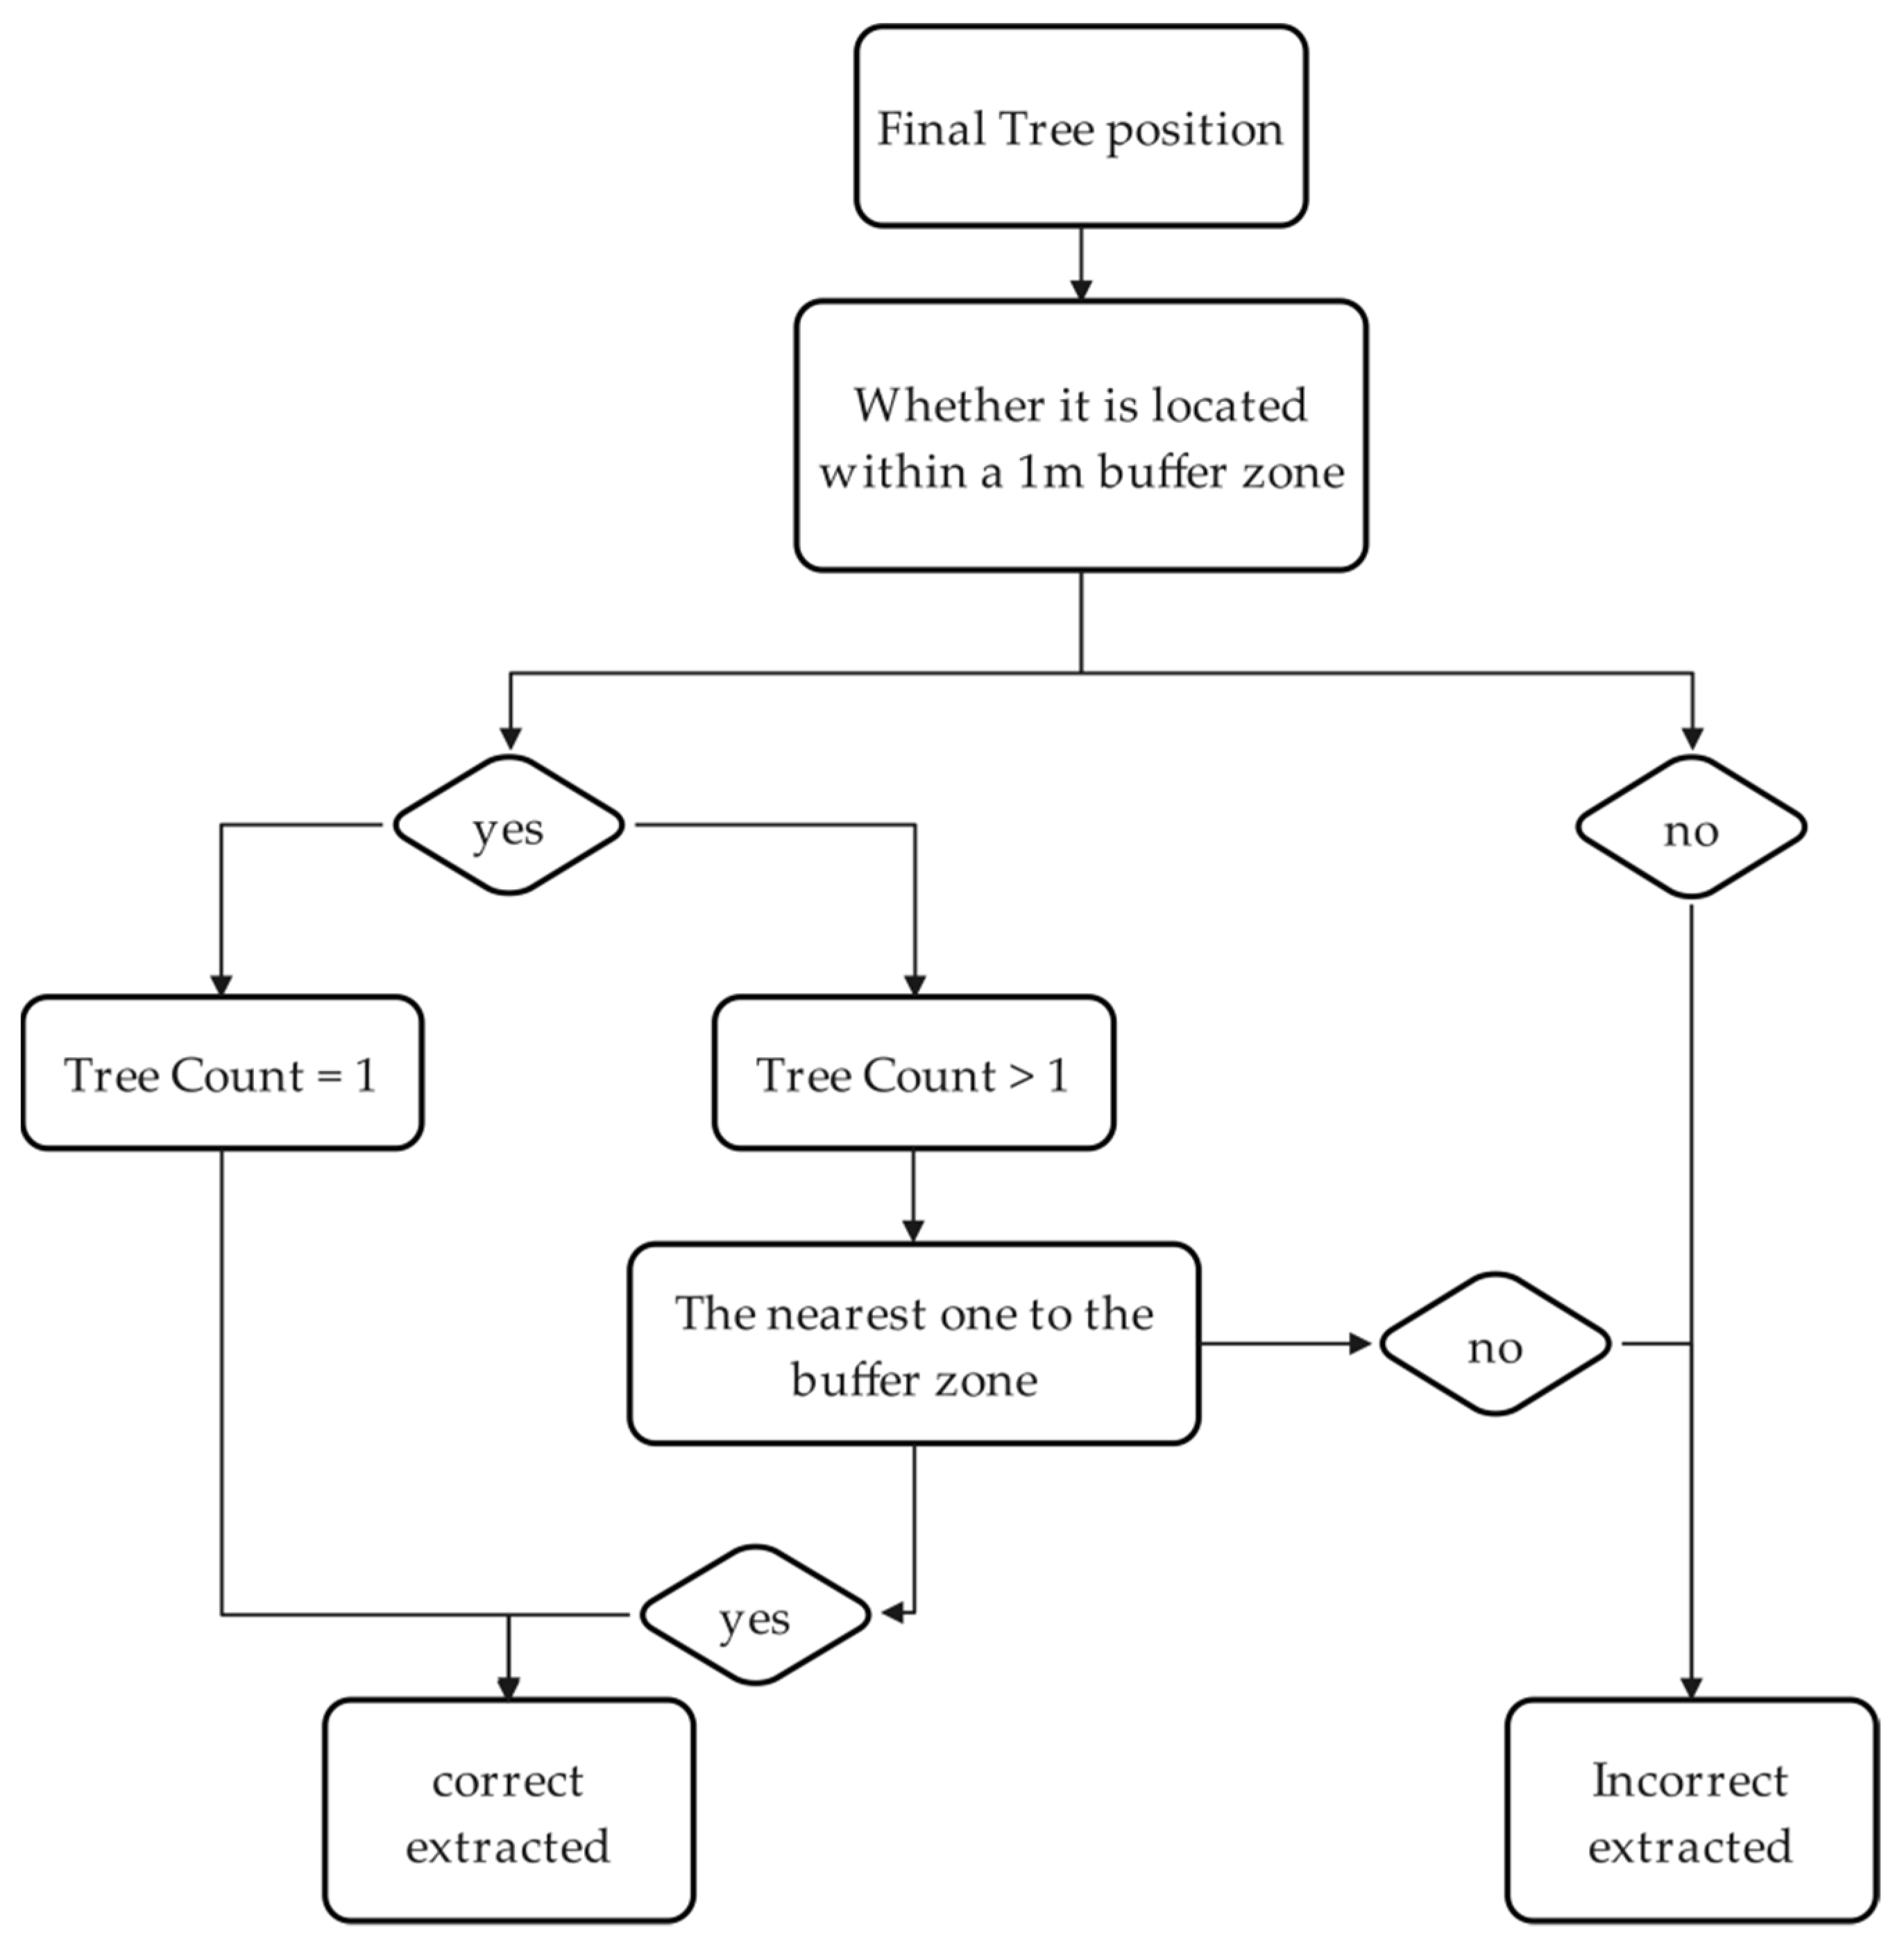
Determination of Final Tree Positions
First, the Otsu method is applied to calculate the grayscale image’s Otsu threshold (Totsu) [37]. Next, Pc and Pg are overlaid onto the grayscale image. The grayscale values at the locations of Pc and Pg are then extracted, and vertices with grayscale values lower than Totsu are removed to eliminate erroneous apices located outside the tree canopy layer [38]. Finally, Pg is iterated to determine whether Pc exists within the crown width range; if it does, Pg is deleted, and if not, it is retained. The remaining tree crown apices are regarded as the final individual tree position.
The above steps were implemented using Python 3.8. To validate the performance of the MSLM method, a comparison was made with the RLM method using only the CHM data source, evaluating the precision differences in tree crown apex extraction within complex environments.

2.3.2. Individual Tree Position Extraction Accuracy Evaluation

This study analyzed the accuracy of position extraction at the individual tree scale. A circular buffer with a radius of 1 m was established, centered at the measured tree position. The extraction was deemed correct if there was precisely one extracted tree position located within the buffer zone. If no extracted tree position was present, the extraction was considered an omission. If two or more extracted tree positions were present, the nearest one was considered correct, while the others were classified as incorrect. The flow of judgment for extracted individual tree positions is shown in Figure 4.
The accuracy of the extraction results was evaluated using five metrics: Accuracy Rate (AR), Commission Error (CE), Omission Error (OE), Overall Accuracy (OA), and F1 score (F1_c). The formulas for these metrics are as follows [31]:
AR = Nt/Nr × 100%,
CE = Nu/Nr × 100%,
OE = No/Nr × 100%,
OA = (1 − |Ne − Nr|/Nr) × 100%,
F1_c = 2 × Nt/(Nr + Ne) × 100%,
where Nr represents the number of trees measured in the field survey, Ne represents the total number of extracted trees, Nt represents the number of correctly extracted trees, Nu represents the number of incorrectly extracted trees, and No represents the number of omission extracted trees.

3. Results

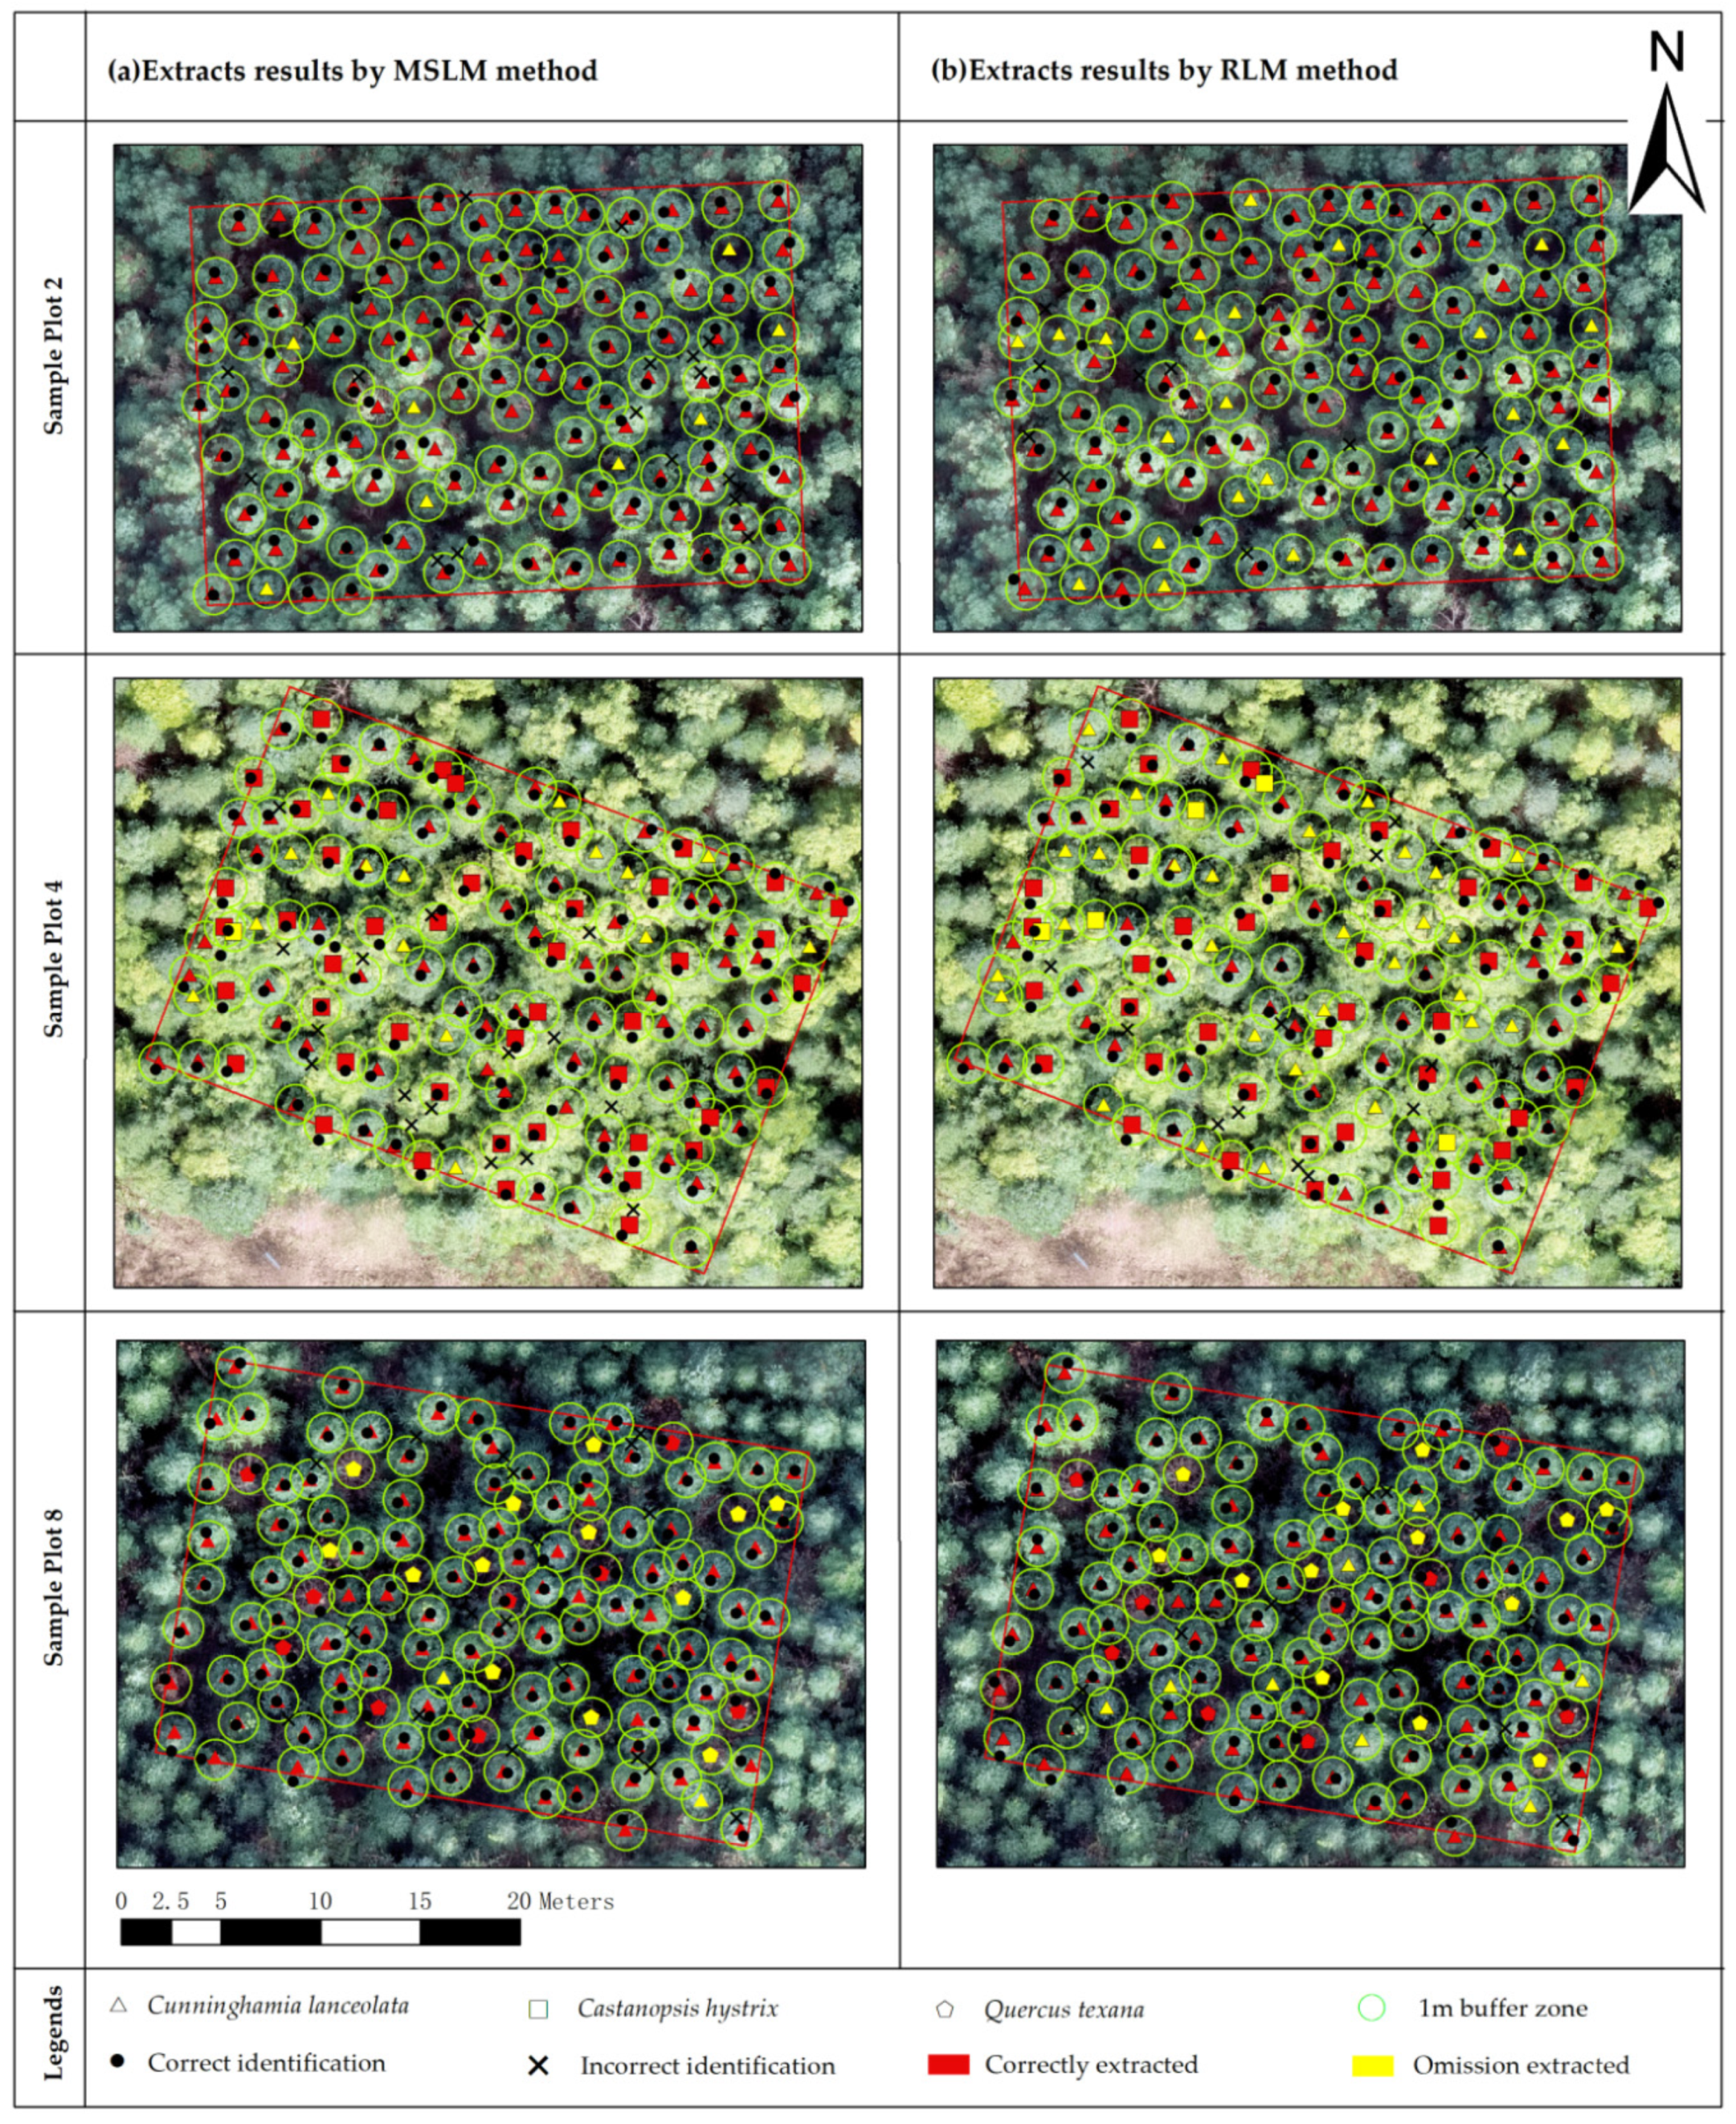
3.1. Individual Tree Position Extraction Results

This study performed individual tree position extraction on nine sample plots using the MSLM method and compared the results with those obtained using the RLM method, which relies solely on the CHM. The extraction results from both methods were overlaid onto the DOM for ease of comparison. Examples of the extraction results for selected sample plots are shown in Figure 5. In the figure, triangles represent the actual positions of Cunninghamia lanceolata, squares represent Castanopsis hystrix, and pentagons represent Quercus texana. Red indicates that the tree was correctly extracted, while yellow indicates that the tree was omission extracted, black dots represent correct identification by the method, black crosses represent incorrect identification by the method, and green circles denote a 1m buffer zone. Both the MSLM and RLM methods exhibited varying degrees of commission and omission errors. However, the MSLM method demonstrated a higher number of correct extractions and relatively fewer omissions. The MSLM method effectively avoided commission errors along the forest canopy perimeter but still showed frequent errors at tree crown edges.
The performance of these methods varied across different forest types. In CLPF, commission errors were primarily concentrated along the edges of Cunninghamia lanceolata tree crowns, while omission errors mainly occurred in areas where tree crowns overlapped. In CL-CHMF, commission errors were most often associated with the large crowns of Castanopsis hystrix, while omission errors were more frequently observed in the smaller crowns of Cunninghamia lanceolata. In CL-QTMF, commission errors were predominantly located at the edges of Cunninghamia lanceolata crowns, whereas omission errors primarily occurred on Quercus texana crowns.
To more comprehensively evaluate the effectiveness of the two methods, the extraction results of both methods were statistically analyzed from four aspects: total number of extracted trees, correctly extracted trees, incorrectly extracted trees, and omission extracted trees, and a significance test was conducted. The statistical results are shown in Table 2, and there are significant differences in the extraction results of different extraction methods (p < 0.05). The total number of individual tree positions extracted using the MSLM method was much closer to the measured count, with only 11 additional trees compared to the value of the measured survey. In contrast, the RLM method underestimated the number of trees, extracting 190 fewer trees than the measured value. This suggests that the MSLM method has a clear advantage in terms of total extraction accuracy. The number of correctly extracted tree positions using the MSLM method was also significantly higher than that of the RLM method, with the MSLM method outperforming the RLM method by 136 trees overall. Additionally, the MSLM method showed superior performance across all sample plots. For example, in Plot 5, the MSLM method correctly extracted 120 trees, whereas the RLM method only extracted 82 trees, resulting in a difference of 38 trees. However, the MSLM method showed some shortcomings in terms of commission errors. The total number of commission errors for the MSLM method was consistently higher than that of the RLM method, with the MSLM method producing 66 more commission errors in total.

3.2. Individual Tree Position Extraction Accuracy

To comprehensively evaluate the performance of the MSLM method, five accuracy metrics—AR, CE, OE, OA, and F1_c—were employed to compare the extraction results of the MSLM and RLM methods. The results are shown in Table 3. As indicated in the table, the MSLM method generally outperforms the RLM method across all evaluation metrics. The overall AR of the MSLM method was 85.59%, significantly higher than the 74.98% achieved by the RLM method. In terms of OE, the MSLM method had a lower value of 14.40%, compared to 25.02% for the RLM method. While the MSLM method’s CE was 15.31%, higher than the 9.38% observed for the RLM method, this difference did not significantly impact the overall extraction accuracy and effectiveness. The overall OA of the MSLM method was 99.09%, exceeding the RLM method’s 84.36%, and the F1 score for the MSLM method was 85.21%, which was also higher than the RLM method’s score of 81.34%.

3.3. Impact of Forest Type on Extraction Accuracy

Figure 6 shows that the MSLM method performs relatively consistently across different forest types. Although there were some fluctuations in CE, the overall performance of the MSLM method was superior to that of the RLM method. The CE for the CLPF and CL-QTMF were 18.39% and 16.22%, respectively, while the CE for the CL-CHMF was lower, at only 11.61%. In contrast, the performance of the RLM method showed greater variability, especially in the CL-CHMF, where AR and OA were significantly lower compared to the other forest types. The AR and OA for the CLPF and CL-QTMF were both above 80% and 90%, respectively, while those for the CL-CHMF were only 64.45% and 71.09%, respectively. This indicates that compared to the RLM method, the MSLM method achieves higher precision and reliability in handling the complex environments of different forest types.

4. Discussion

4.1. Parameter Settings of the MSLM Method

The parameter settings for the MSLM method are largely consistent with the RLM method, with the key parameters being CLmin and CLmax. These two parameters are determined through visual inspection of the crown size and represent the minimum and maximum crown widths in the sample area, respectively. These parameters significantly influence the accuracy and computational efficiency of the algorithm, with CLmin being particularly crucial. It determines the search step size for local maxima and helps prevent the generation of excess potential crown top points within the same tree crown, while also reducing the occurrence of missing crown top points caused by crown overlap. CLmax ensures that the crown width value is not overestimated, and the crown width value is used to eliminate anomalous crown top points that are too close to one another [24].
Additionally, the MSLM method introduces a new threshold, Totsu, which is automatically determined by maximizing the inter-class variance. This threshold helps differentiate between the crown layer and the background, thereby eliminating false points located outside the crown layer. The results show that the Totsu threshold can, to some extent, prevent the detection of false peaks in the non-canopy area, thus reducing the false detection rate. This conclusion is also supported by the study of Yu et al. [39], which suggests that optimizing the threshold can effectively reduce the false detection rate.

4.2. Performance Advantages of the MSLM Method

This study used both the MSLM and RLM methods to extract individual tree positions from three different types of closed-canopy stands. The results demonstrate that the MSLM method outperforms the RLM method in terms of accuracy, omission error, overall precision, and F1 score. This indicates that, compared to the RLM method, the MSLM method is more accurate in extracting individual tree positions, reducing omission errors, and minimizing the bias between false extractions and omissions, resulting in outcomes that more closely align with the actual distribution of trees. The MSLM method thus offers superior balance and robustness. The excellent performance of MSLM in closed-canopy stands further supports the advantages of the multi-source data fusion strategy. By integrating CHM and DOM data, MRLM significantly enhances the algorithm’s ability to analyze complex backgrounds, exhibiting greater stability and adaptability [40]. CHM provides three-dimensional structural information about tree crown height, while DOM offers rich spectral and textural features. The combination of the two allows the MSLM method to more precisely determine individual tree positions in complex forest environments. Relevant studies also support this view. For instance, Xie et al. [41] pointed out that the integration of RGB imagery and CHM data significantly improves the accuracy of individual tree detection, especially in complex environments where a single data source cannot meet the requirements.
The MSLM method achieved an overall F1 score of 85.21% in closed-canopy stands, fully demonstrating its capability to extract individual tree positions in complex forest environments. Currently, deep learning methods are commonly used for individual tree position extraction in challenging conditions. For example, Beloiu et al. [42] employed the Faster R-CNN model with RGB imagery for individual tree position extraction in temperate mixed forests, achieving an overall F1 score of 76%, with spruce scoring as high as 86%. Zhang et al. [43] used an improved Mask R-CNN model for individual tree position extraction in broadleaf mixed forests, obtaining overall F1 scores ranging from 80% to 84%. Gan et al. [44] applied the DeepForest and Detectree2 models for individual tree position extraction in alpine temperate deciduous forests, achieving overall F1 scores of 52% and 57%, respectively. In comparison, the MSLM method, as a traditional computer vision algorithm, achieved comparable accuracy to deep learning methods in closed-canopy stands while not relying on large-scale annotated datasets and incurring lower computational costs [45]. Therefore, the MSLM method demonstrates broader applicability, particularly in large-scale forest resource surveys, where it offers greater cost-effectiveness and provides an efficient and low-cost pathway for individual tree detection in forest resource monitoring.

4.3. Limitations of the MSLM Method

Although the MSLM method has demonstrated promising results in extracting individual tree positions across various forest types, certain limitations persist. First, the MSLM method exhibits higher commission errors compared to the RLM method. This may be due to the higher resolution of DOM imagery, which, while improving the representation of tree crown texture details, also introduces additional noise. Consequently, the increased resolution can result in more misidentifications, leading to higher commission errors [46]. Second, this study only selected three types of mountainous closed-canopy forests with different tree species compositions for comparative experiments, without considering the effects of more diverse forest types, canopy densities, and terrain conditions on extraction accuracy. Furthermore, this study did not account for seasonal variations in tree crown morphology, which could affect position extraction accuracy. For instance, in the CL-QTMF, a significant number of omission errors were observed for Quercus texana. This was likely because Quercus texana had entered its leaf-shedding phase during imagery acquisition, making crown tops harder to identify. Similarly, Dietenberger et al. [47] reported that seasonal changes, such as leaf growth or shedding, can significantly impact the accuracy of tree position extraction.
To address these limitations, future research could incorporate more advanced denoising algorithms to suppress noise while preserving critical image details. Such algorithms should focus on achieving a balance between reducing unnecessary artifacts and retaining important features, thereby enhancing the accuracy of the method. Additionally, incorporating a more diverse range of forest types, crown densities, and terrain conditions, along with analyzing seasonal variations in crown morphology through time-series data, could enhance the robustness and applicability of the method. These improvements will help overcome current challenges and further optimize the applicability of the method in complex environments.

5. Conclusions

This study presents an MSLM method that integrates CHM and DOM imagery for the extraction of individual tree positions in closed-canopy stands. When compared to the RLM method, which relies solely on CHM imagery, the results show that the MSLM method achieves a higher overall Accuracy Rate (AR) of 85.59%, an Overall Accuracy (OA) of 99.09%, and an F1 score of 85.21%, outperforming the RLM method. Furthermore, the method demonstrates stable performance across different types of closed-canopy forests, highlighting its superior performance in extracting individual tree positions. The MSLM method achieves high accuracy without requiring large amounts of annotated data, providing a low-cost and efficient technological solution for forest resource monitoring. It also offers valuable insights for optimizing and adjusting forest structures, supporting better forest management and conservation efforts.

Author Contributions

This study was carried out with collaboration among all authors. G.L. and L.L. were responsible for the overall study design; G.L., Z.G. and X.Z. conducted the field investigation; G.L. and C.Z. performed the results analysis; M.C. was responsible for data visualization; G.L. and X.O. wrote the paper. All authors have read and agreed to the published version of the manuscript.

Funding

This research was funded by the Young Talent Development Program (2023521203) and the Applied Basic Research Program (2023511201) of the Jiangxi Academy of Forestry.

Data Availability Statement

The data presented in this study are available on request from the corresponding author.

Conflicts of Interest

The authors declare no conflicts of interest.

References

  1. Hui, G.; Zhang, G.; Zhao, Z.; Yang, A. Methods of Forest Structure Research: A Review. Curr. For. Rep. 2019, 5, 142–154. [Google Scholar] [CrossRef]
  2. Atkins, J.W.; Bhatt, P.; Carrasco, L.; Francis, E.; Garabedian, J.E.; Hakkenberg, C.R.; Hardiman, B.S.; Jung, J.; Koirala, A.; LaRue, E.A.; et al. Integrating Forest Structural Diversity Measurement into Ecological Research. Ecosphere 2023, 14, e4633. [Google Scholar] [CrossRef]
  3. Yang, M.; Mou, Y.; Liu, S.; Meng, Y.; Liu, Z.; Li, P.; Xiang, W.; Zhou, X.; Peng, C. Detecting and Mapping Tree Crowns Based on Convolutional Neural Network and Google Earth Images. Int. J. Appl. Earth Obs. Geoinf. 2022, 108, 102764. [Google Scholar] [CrossRef]
  4. Keefe, R.F.; Zimbelman, E.G.; Picchi, G. Use of Individual Tree and Product Level Data to Improve Operational Forestry. Curr. For. Rep. 2022, 8, 148–165. [Google Scholar] [CrossRef]
  5. Dainelli, R.; Toscano, P.; Di Gennaro, S.F.; Matese, A. Recent Advances in Unmanned Aerial Vehicle Forest Remote Sensing—A Systematic Review. Part I: A General Framework. Forests 2021, 12, 327. [Google Scholar] [CrossRef]
  6. Yun, L.; Zhang, X.; Zheng, Y.; Wang, D.; Hua, L. Enhance the Accuracy of Landslide Detection in UAV Images Using an Improved Mask R-CNN Model: A Case Study of Sanming, China. Sensors 2023, 23, 4287. [Google Scholar] [CrossRef]
  7. Guimarães, N.; Pádua, L.; Marques, P.; Silva, N.; Peres, E.; Sousa, J.J. Forestry Remote Sensing from Unmanned Aerial Vehicles: A Review Focusing on the Data, Processing and Potentialities. Remote Sens. 2020, 12, 1046. [Google Scholar] [CrossRef]
  8. Ali, A.M.; Abouelghar, M.; Belal, A.A.; Saleh, N.; Yones, M.; Selim, A.I.; Amin, M.E.S.; Elwesemy, A.; Kucher, D.E.; Maginan, S.; et al. Crop Yield Prediction Using Multi Sensors Remote Sensing (Review Article). Egypt. J. Remote Sens. Space Sci. 2022, 25, 711–716. [Google Scholar] [CrossRef]
  9. Zhang, Z.; Zhu, L. A Review on Unmanned Aerial Vehicle Remote Sensing: Platforms, Sensors, Data Processing Methods, and Applications. Drones 2023, 7, 398. [Google Scholar] [CrossRef]
  10. Chen, X.; Wang, R.; Shi, W.; Li, X.; Zhu, X.; Wang, X. An Individual Tree Segmentation Method That Combines LiDAR Data and Spectral Imagery. Forests 2023, 14, 1009. [Google Scholar] [CrossRef]
  11. Steier, J.; Goebel, M.; Iwaszczuk, D. Is Your Training Data Really Ground Truth? A Quality Assessment of Manual Annotation for Individual Tree Crown Delineation. Remote Sens. 2024, 16, 2786. [Google Scholar] [CrossRef]
  12. Yun, T.; Li, J.; Ma, L.; Zhou, J.; Wang, R.; Eichhorn, M.P.; Zhang, H. Status, Advancements and Prospects of Deep Learning Methods Applied in Forest Studies. Int. J. Appl. Earth Obs. Geoinf. 2024, 131, 103938. [Google Scholar] [CrossRef]
  13. Yu, K.; Hao, Z.; Post, C.; Mikhailova, E.; Lin, L.; Zhao, G.; Tian, S.; Liu, J. Comparison of Classical Methods and Mask R-CNN for Automatic Tree Detection and Mapping Using UAV Imagery. Remote Sens. 2022, 14, 295. [Google Scholar] [CrossRef]
  14. Robles-Guerrero, A.; Saucedo-Anaya, T.; Guerrero-Mendez, C.A.; Gómez-Jiménez, S.; Navarro-Solís, D.J. Comparative Study of Machine Learning Models for Bee Colony Acoustic Pattern Classification on Low Computational Resources. Sensors 2023, 23, 460. [Google Scholar] [CrossRef] [PubMed]
  15. Mohan, M.; Silva, C.A.; Klauberg, C.; Jat, P.; Catts, G.; Cardil, A.; Hudak, A.T.; Dia, M. Individual Tree Detection from Unmanned Aerial Vehicle (UAV) Derived Canopy Height Model in an Open Canopy Mixed Conifer Forest. Forests 2017, 8, 340. [Google Scholar] [CrossRef]
  16. Ahmadi, S.A.; Ghorbanian, A.; Golparvar, F.; Mohammadzadeh, A.; Jamali, S. Individual Tree Detection from Unmanned Aerial Vehicle (UAV) Derived Point Cloud Data in a Mixed Broadleaf Forest Using Hierarchical Graph Approach. Eur. J. Remote Sens. 2022, 55, 520–539. [Google Scholar] [CrossRef]
  17. De Sa, N.C.; Castro, P.; Carvalho, S.; Marchante, E.; Lopez-Nunez, F.A.; Marchante, H. Mapping the Flowering of an Invasive Plant Using Unmanned Aerial Vehicles: Is There Potential for Biocontrol Monitoring? Front. Plant Sci. 2018, 9, 293. [Google Scholar] [CrossRef]
  18. Gu, J.; Congalton, R.G. Individual Tree Crown Delineation from UAS Imagery Based on Region Growing by Over-Segments With a Competitive Mechanism. IEEE Trans. Geosci. Remote Sens. 2022, 60, 4402411. [Google Scholar] [CrossRef]
  19. Xia, J.; Wang, Y.; Dong, P.; He, S.; Zhao, F.; Luan, G. Object-Oriented Canopy Gap Extraction from UAV Images Based on Edge Enhancement. Remote Sens. 2022, 14, 4762. [Google Scholar] [CrossRef]
  20. Chehreh, B.; Moutinho, A.; Viegas, C. Latest Trends on Tree Classification and Segmentation Using UAV Data—A Review of Agroforestry Applications. Remote Sens. 2023, 15, 2263. [Google Scholar] [CrossRef]
  21. García-Murillo, D.G.; Caicedo-Acosta, J.; Castellanos-Dominguez, G. Individual Detection of Citrus and Avocado Trees Using Extended Maxima Transform Summation on Digital Surface Models. Remote Sens. 2020, 12, 1633. [Google Scholar] [CrossRef]
  22. Hao, Z.; Lin, L.; Post, C.J.; Jiang, Y.; Li, M.; Wei, N.; Yu, K.; Liu, J. Assessing Tree Height and Density of a Young Forest Using a Consumer Unmanned Aerial Vehicle (UAV). New For. 2021, 52, 843–862. [Google Scholar] [CrossRef]
  23. Asli, O.-O.; Ok, A.O.; Zeybek, M.; Atesoglu, A. Automated Extraction and Validation of Stone Pine (Pinus pinea L.) Trees from UAV-Based Digital Surface Models. Geo-Spat. Inf. Sci. 2024, 27, 142–162. [Google Scholar] [CrossRef]
  24. Xu, X.; Zhou, Z.; Tang, Y.; Qu, Y. Individual Tree Crown Detection from High Spatial Resolution Imagery Using a Revised Local Maximum Filtering. Remote Sens. Environ. 2021, 258, 112397. [Google Scholar] [CrossRef]
  25. Miraki, M.; Sohrabi, H.; Fatehi, P.; Kneubuehler, M. Individual Tree Crown Delineation from High-Resolution UAV Images in Broadleaf Forest. Ecol. Inform. 2021, 61, 101207. [Google Scholar] [CrossRef]
  26. Chen, S.; Liang, D.; Ying, B.; Zhu, W.; Zhou, G.; Wang, Y. Assessment of an Improved Individual Tree Detection Method Based on Local-Maximum Algorithm from Unmanned Aerial Vehicle RGB Imagery in Overlapping Canopy Mountain Forests. Int. J. Remote Sens. 2021, 42, 106–125. [Google Scholar] [CrossRef]
  27. Azizi, Z.; Miraki, M. Individual Urban Trees Detection Based on Point Clouds Derived from UAV-RGB Imagery and Local Maxima Algorithm, a Case Study of Fateh Garden, Iran. Environ. Dev. Sustain. 2024, 26, 2331–2344. [Google Scholar] [CrossRef]
  28. Zhao, H.; Morgenroth, J.; Pearse, G.; Schindler, J. A Systematic Review of Individual Tree Crown Detection and Delineation with Convolutional Neural Networks (CNN). Curr. For. Rep. 2023, 9, 149–170. [Google Scholar] [CrossRef]
  29. Qin, H.; Zhou, W.; Yao, Y.; Wang, W. Individual Tree Segmentation and Tree Species Classification in Subtropical Broadleaf Forests Using UAV-Based LiDAR, Hyperspectral, and Ultrahigh-Resolution RGB Data. Remote Sens. Environ. 2022, 280, 113143. [Google Scholar] [CrossRef]
  30. Iglhaut, J.; Cabo, C.; Puliti, S.; Piermattei, L.; O’Connor, J.; Rosette, J. Structure from Motion Photogrammetry in Forestry: A Review. Curr. For. Rep. 2019, 5, 155–168. [Google Scholar] [CrossRef]
  31. Zhang, Y.; Wang, M.; Mango, J.; Xin, L.; Meng, C.; Li, X. Individual Tree Detection and Counting Based on High-Resolution Imagery and the Canopy Height Model Data. Geo-Spat. Inf. Sci. 2024, 27, 2162–2178. [Google Scholar] [CrossRef]
  32. Zhao, C.; Wang, J.; Zhou, G.; Yu, L.; Gong, X.; Meng, J. Logging Simulation of Natural Mixed Forest in Jinpen Mountain Based on Optimization of Spatial Structure. J. Southwest For. Univ. 2022, 42, 126–133. [Google Scholar] [CrossRef]
  33. Dong, X.; Zhang, Z.; Yu, R.; Tian, Q.; Zhu, X. Extraction of Information about Individual Trees from High-Spatial-Resolution UAV-Acquired Images of an Orchard. Remote Sens. 2020, 12, 133. [Google Scholar] [CrossRef]
  34. Kuang, W.; Ho, H.W.; Zhou, Y.; Suandi, S.A.; Ismail, F. A Comprehensive Review on Tree Detection Methods Using Point Cloud and Aerial Imagery from Unmanned Aerial Vehicles. Comput. Electron. Agric. 2024, 227, 109476. [Google Scholar] [CrossRef]
  35. Ke, Y.; Quackenbush, L.J. A Review of Methods for Automatic Individual Tree-Crown Detection and Delineation from Passive Remote Sensing. Int. J. Remote Sens. 2011, 32, 4725–4747. [Google Scholar] [CrossRef]
  36. Burdziakowski, P. The Effect of Varying the Light Spectrum of a Scene on the Localisation of Photogrammetric Features. Remote Sens. 2024, 16, 2644. [Google Scholar] [CrossRef]
  37. Otsu, N. A Threshold Selection Method from Gray-Level Histograms. IEEE Trans. Syst. Man Cybern. 1979, 9, 62–66. [Google Scholar] [CrossRef]
  38. Chen, R.; Han, L.; Zhao, Y.; Zhao, Z.; Liu, Z.; Li, R.; Xia, L.; Zhai, Y. Extraction and Monitoring of Vegetation Coverage Based on Uncrewed Aerial Vehicle Visible Image in a Post Gold Mining Area. Front. Ecol. Evol. 2023, 11, 1171358. [Google Scholar] [CrossRef]
  39. Yu, T.; Ni, W.; Zhang, Z.; Liu, Q.; Sun, G. Regional Sampling of Forest Canopy Covers Using UAV Visible Stereoscopic Imagery for Assessment of Satellite-Based Products in Northeast China. J. Remote Sens. 2022, 2022, 9806802. [Google Scholar] [CrossRef]
  40. Pleșoianu, A.-I.; Stupariu, M.-S.; Șandric, I.; Pătru-Stupariu, I.; Drăguț, L. Individual Tree-Crown Detection and Species Classification in Very High-Resolution Remote Sensing Imagery Using a Deep Learning Ensemble Model. Remote Sens. 2020, 12, 2426. [Google Scholar] [CrossRef]
  41. Xie, Y.; Wang, Y.; Sun, Z.; Liang, R.; Ding, Z.; Wang, B.; Huang, S.; Sun, Y. Instance Segmentation and Stand-Scale Forest Mapping Based on UAV Images Derived RGB and CHM. Comput. Electron. Agric. 2024, 220, 108878. [Google Scholar] [CrossRef]
  42. Beloiu, M.; Heinzmann, L.; Rehush, N.; Gessler, A.; Griess, V.C. Individual Tree-Crown Detection and Species Identification in Heterogeneous Forests Using Aerial RGB Imagery and Deep Learning. Remote Sens. 2023, 15, 1463. [Google Scholar] [CrossRef]
  43. Zhang, C.; Zhou, J.; Wang, H.; Tan, T.; Cui, M.; Huang, Z.; Wang, P.; Zhang, L. Multi-Species Individual Tree Segmentation and Identification Based on Improved Mask R-CNN and UAV Imagery in Mixed Forests. Remote Sens. 2022, 14, 874. [Google Scholar] [CrossRef]
  44. Gan, Y.; Wang, Q.; Iio, A. Tree Crown Detection and Delineation in a Temperate Deciduous Forest from UAV RGB Imagery Using Deep Learning Approaches: Effects of Spatial Resolution and Species Characteristics. Remote Sens. 2023, 15, 778. [Google Scholar] [CrossRef]
  45. Sun, Y.; Li, Z.; He, H.; Guo, L.; Zhang, X.; Xin, Q. Counting Trees in a Subtropical Mega City Using the Instance Segmentation Method. Int. J. Appl. Earth Obs. Geoinf. 2022, 106, 102662. [Google Scholar] [CrossRef]
  46. Zhang, D.; Pan, Y.; Zhang, J.; Hu, T.; Zhao, J.; Li, N.; Chen, Q. A Generalized Approach Based on Convolutional Neural Networks for Large Area Cropland Mapping at Very High Resolution. Remote Sens. Environ. 2020, 247, 111912. [Google Scholar] [CrossRef]
  47. Dietenberger, S.; Mueller, M.M.; Bachmann, F.; Nestler, M.; Ziemer, J.; Metz, F.; Heidenreich, M.G.; Koebsch, F.; Hese, S.; Dubois, C.; et al. Tree Stem Detection and Crown Delineation in a Structurally Diverse Deciduous Forest Combining Leaf-On and Leaf-Off UAV-SfM Data. Remote Sens. 2023, 15, 4366. [Google Scholar] [CrossRef]
Figure 1. Study area and sites locations.
Forests 16 00262 g001
Figure 2. Generated data (a) DOM, (b) DSM, (c) DTM, (d) CHM.
Forests 16 00262 g002
Figure 3. Flowchart of the MSLM method.
Forests 16 00262 g003
Figure 4. Flow of judgment for extracted individual tree positions.
Forests 16 00262 g004
Figure 5. Partial sample extracted results by different methods.
Forests 16 00262 g005
Figure 6. Accuracy analysis of different methods and land types.
Forests 16 00262 g006
Table 1. Basic characteristics of sample plots.
Sample PlotTree CountDensity (Trees/ha)TypeMixed RatioSlope DirectionSlope (°)
11372283CLPF1Southeast37
21212016CLPF1Northwest42
31282133CLPF1Northeast40
41282133CL-CHMF6:4South36
51462433CL-CHMF7:3South30
61482466CL-CHMF7:3South40
71412350CL-QTMF8:2North36
81302166CL-QTMF8:2North35
91362266CL-QTMF8:2Northwest37
Table 2. Result of extracted individual tree position.
Sample PlotMeasuredMSLM Method/RLM Method
ExtractedCorrectlyIncorrectlyOmission
1137144/130 *121/113 *23/17 *16/24 *
2121133/112 *113/98 *20/14 *8/23 *
3128132/116 *104/97 *28/19 *24/31 *
4128128/104 *112/90 *16/14 *16/38 *
5146137/90 *120/83 *17/7 *26/63 *
6148139/106 *123/98 *16/8 *25/50 *
7141140/118 *114/110 *26/8 *27/31 *
8130134/121 *115/106 *19/15 *15/24 *
9136139/128 *118/110 *21/18 *18/26 *
All12151226/1025 *1040/905 *186/120 *175/310 *
Note: * indicates a significant difference in the extraction results between the two methods (p < 0.05).
Table 3. Accuracy analysis of extracted individual tree position.
Sample PlotMSLM Method/RLM Method
AROECEOAF1_c
188.32%/82.48%11.68%/17.52%16.79%/12.41%94.89%/94.89%86.12%/84.64%
293.39%/81.82%6.61%/18.18%16.53%/10.74%90.08%/92.56%88.98%/84.98%
381.25%/76.56%18.75%/23.44%21.88%/14.06%96.88%/90.63%80.00%/80.33%
487.50%/71.88%12.50%/28.13%12.50%/9.38%100.00%/81.25%87.50%/79.31%
582.19%/56.16%17.81%/43.84%11.64%/5.48%93.84%/61.64%84.80%/69.49%
683.11%/66.22%16.89%/33.78%10.81%/5.41%93.92%/71.62%85.71%/77.17%
780.85%/78.01%19.15%/21.99%18.44%/5.67%99.29%/83.69%81.14%/84.94%
888.46%/83.85%11.54%/16.15%14.62%/9.23%96.92%/93.08%87.12%/86.85%
986.76%/80.88%13.24%/19.12%15.44%/13.24%97.79%/94.12%85.82%/83.33%
All85.59%/74.98%14.40%/25.02%15.31%/9.38%99.09%/84.36%85.21%/81.34%
Note: Accuracy Rate (AR), Commission Error (CE), Omission Error (OE), Overall Accuracy (OA), and F1 score (F1_c).
Disclaimer/Publisher’s Note: The statements, opinions and data contained in all publications are solely those of the individual author(s) and contributor(s) and not of MDPI and/or the editor(s). MDPI and/or the editor(s) disclaim responsibility for any injury to people or property resulting from any ideas, methods, instructions or products referred to in the content.

