


A Study on the Prediction of Long-Term Carbon Absorption by Applying the Renewal Scenario of Forest in Korea

 , ,
, ,  , and
, and
Abstract
1. Introduction
2. Data and Methods
2.1. Study Area
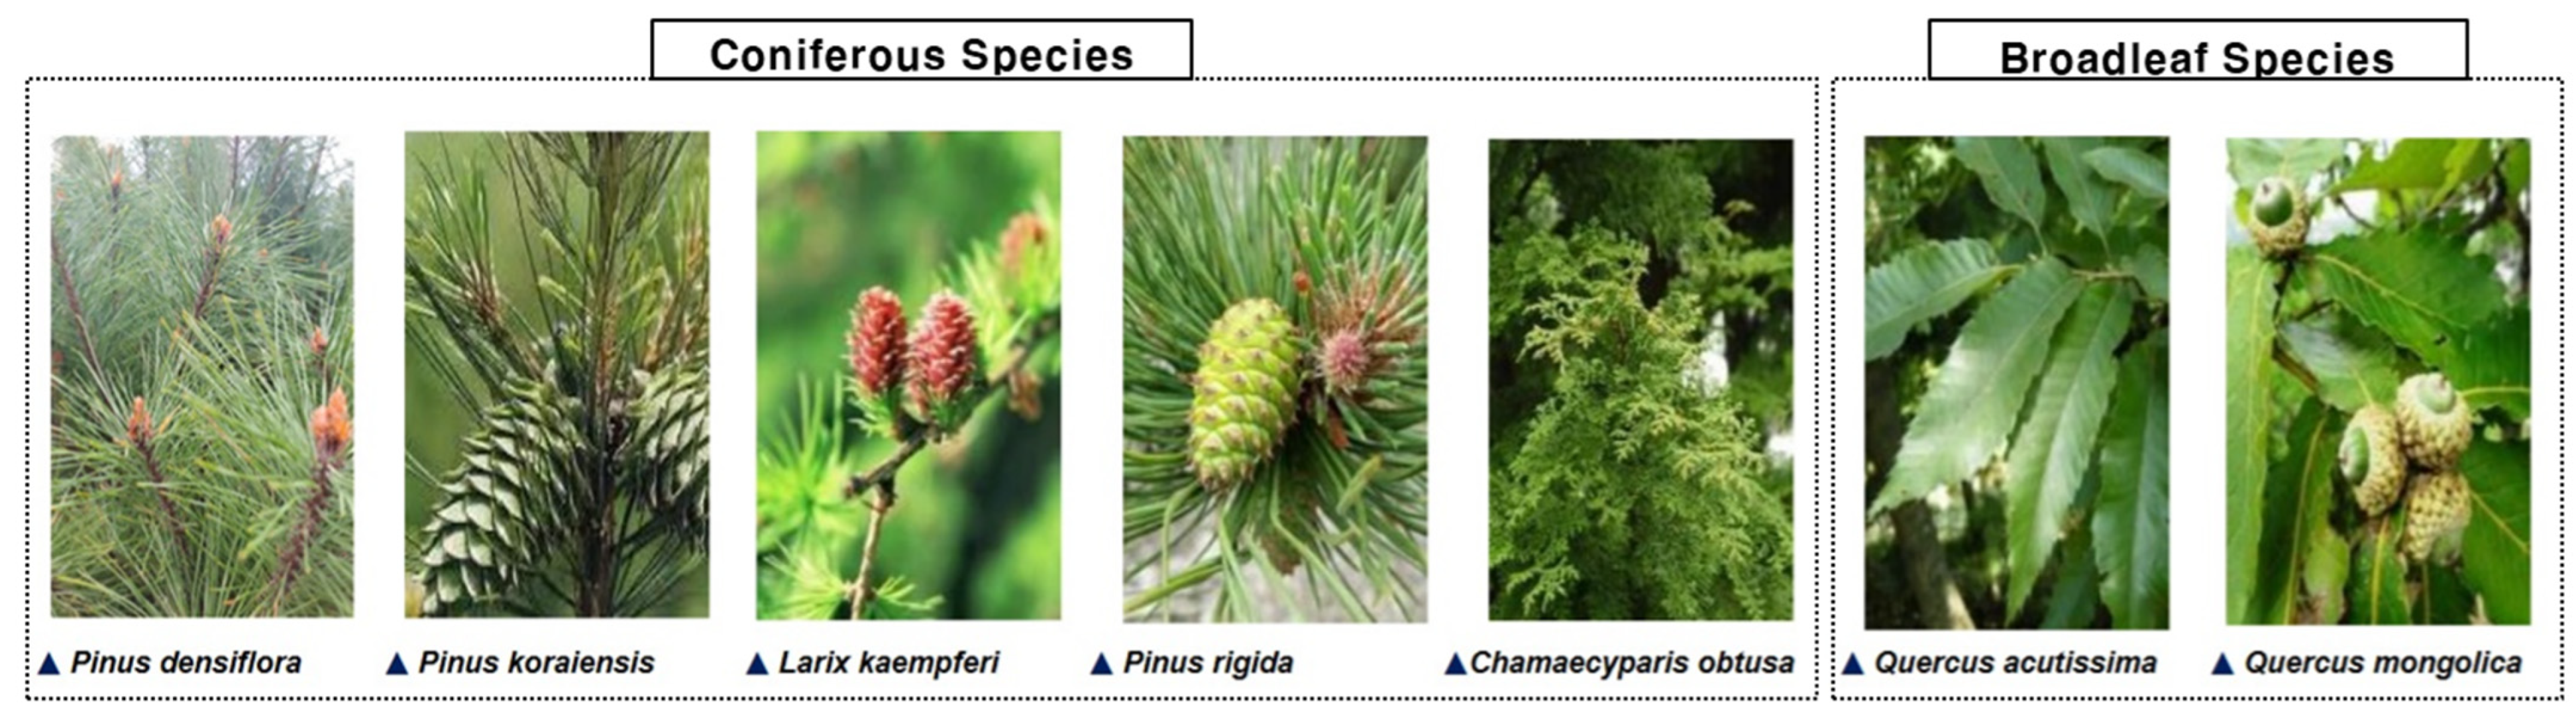
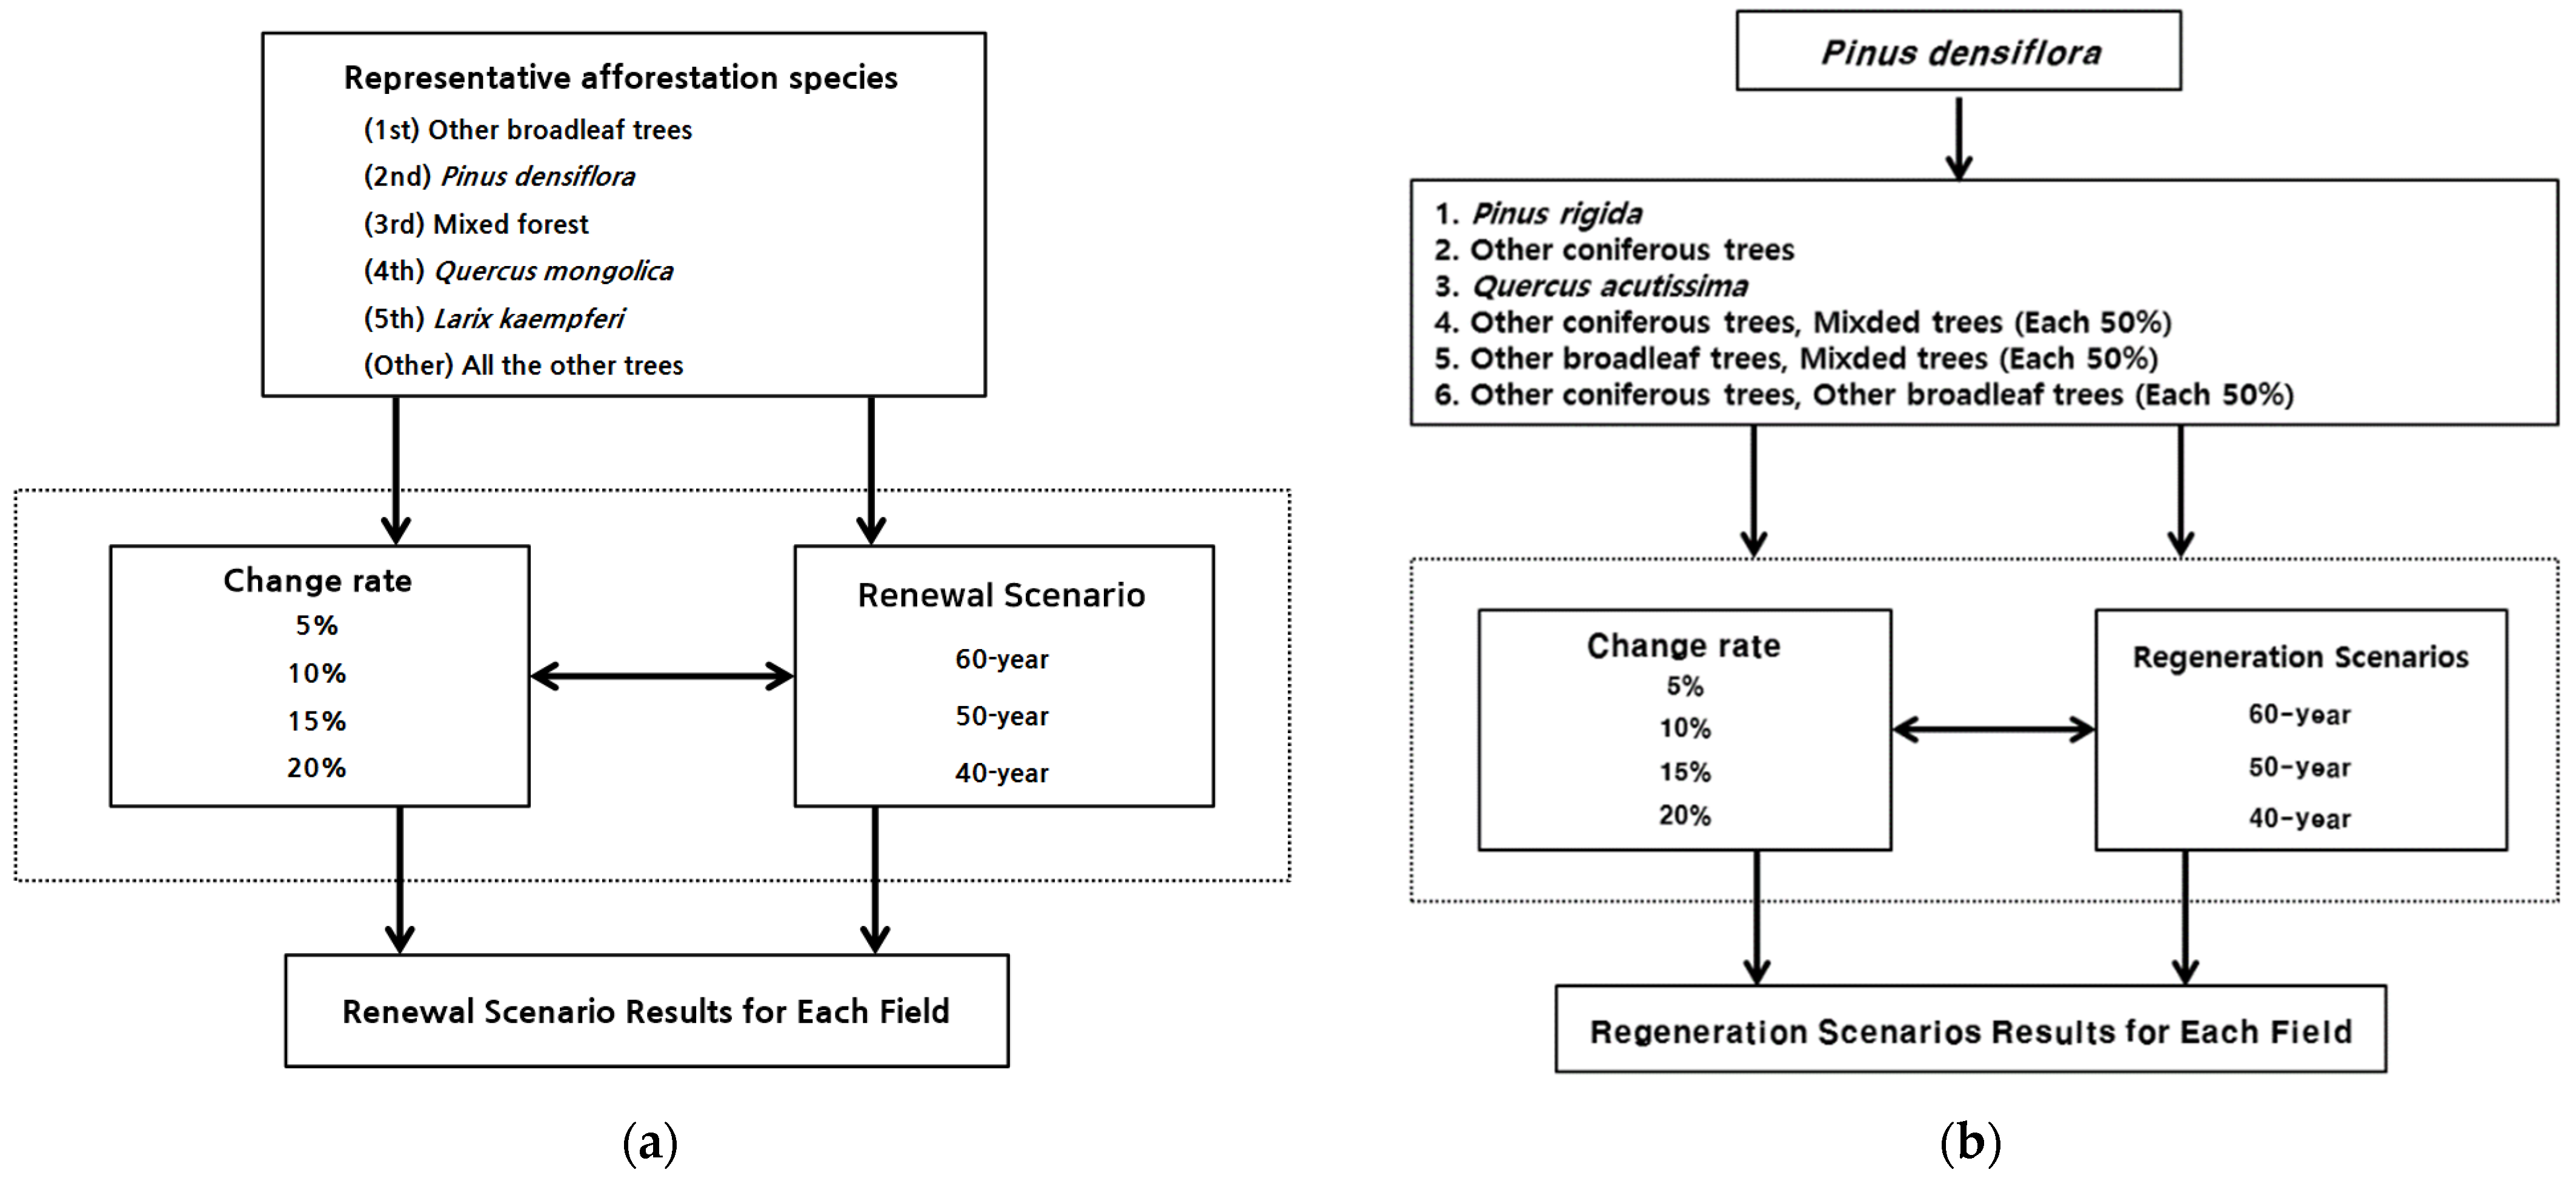
2.2. Selection of Representative Afforestation Species
2.3. Standard Carbon Absorption by Major Forest Species
2.4. Calculation of Forest Afforestation Modification
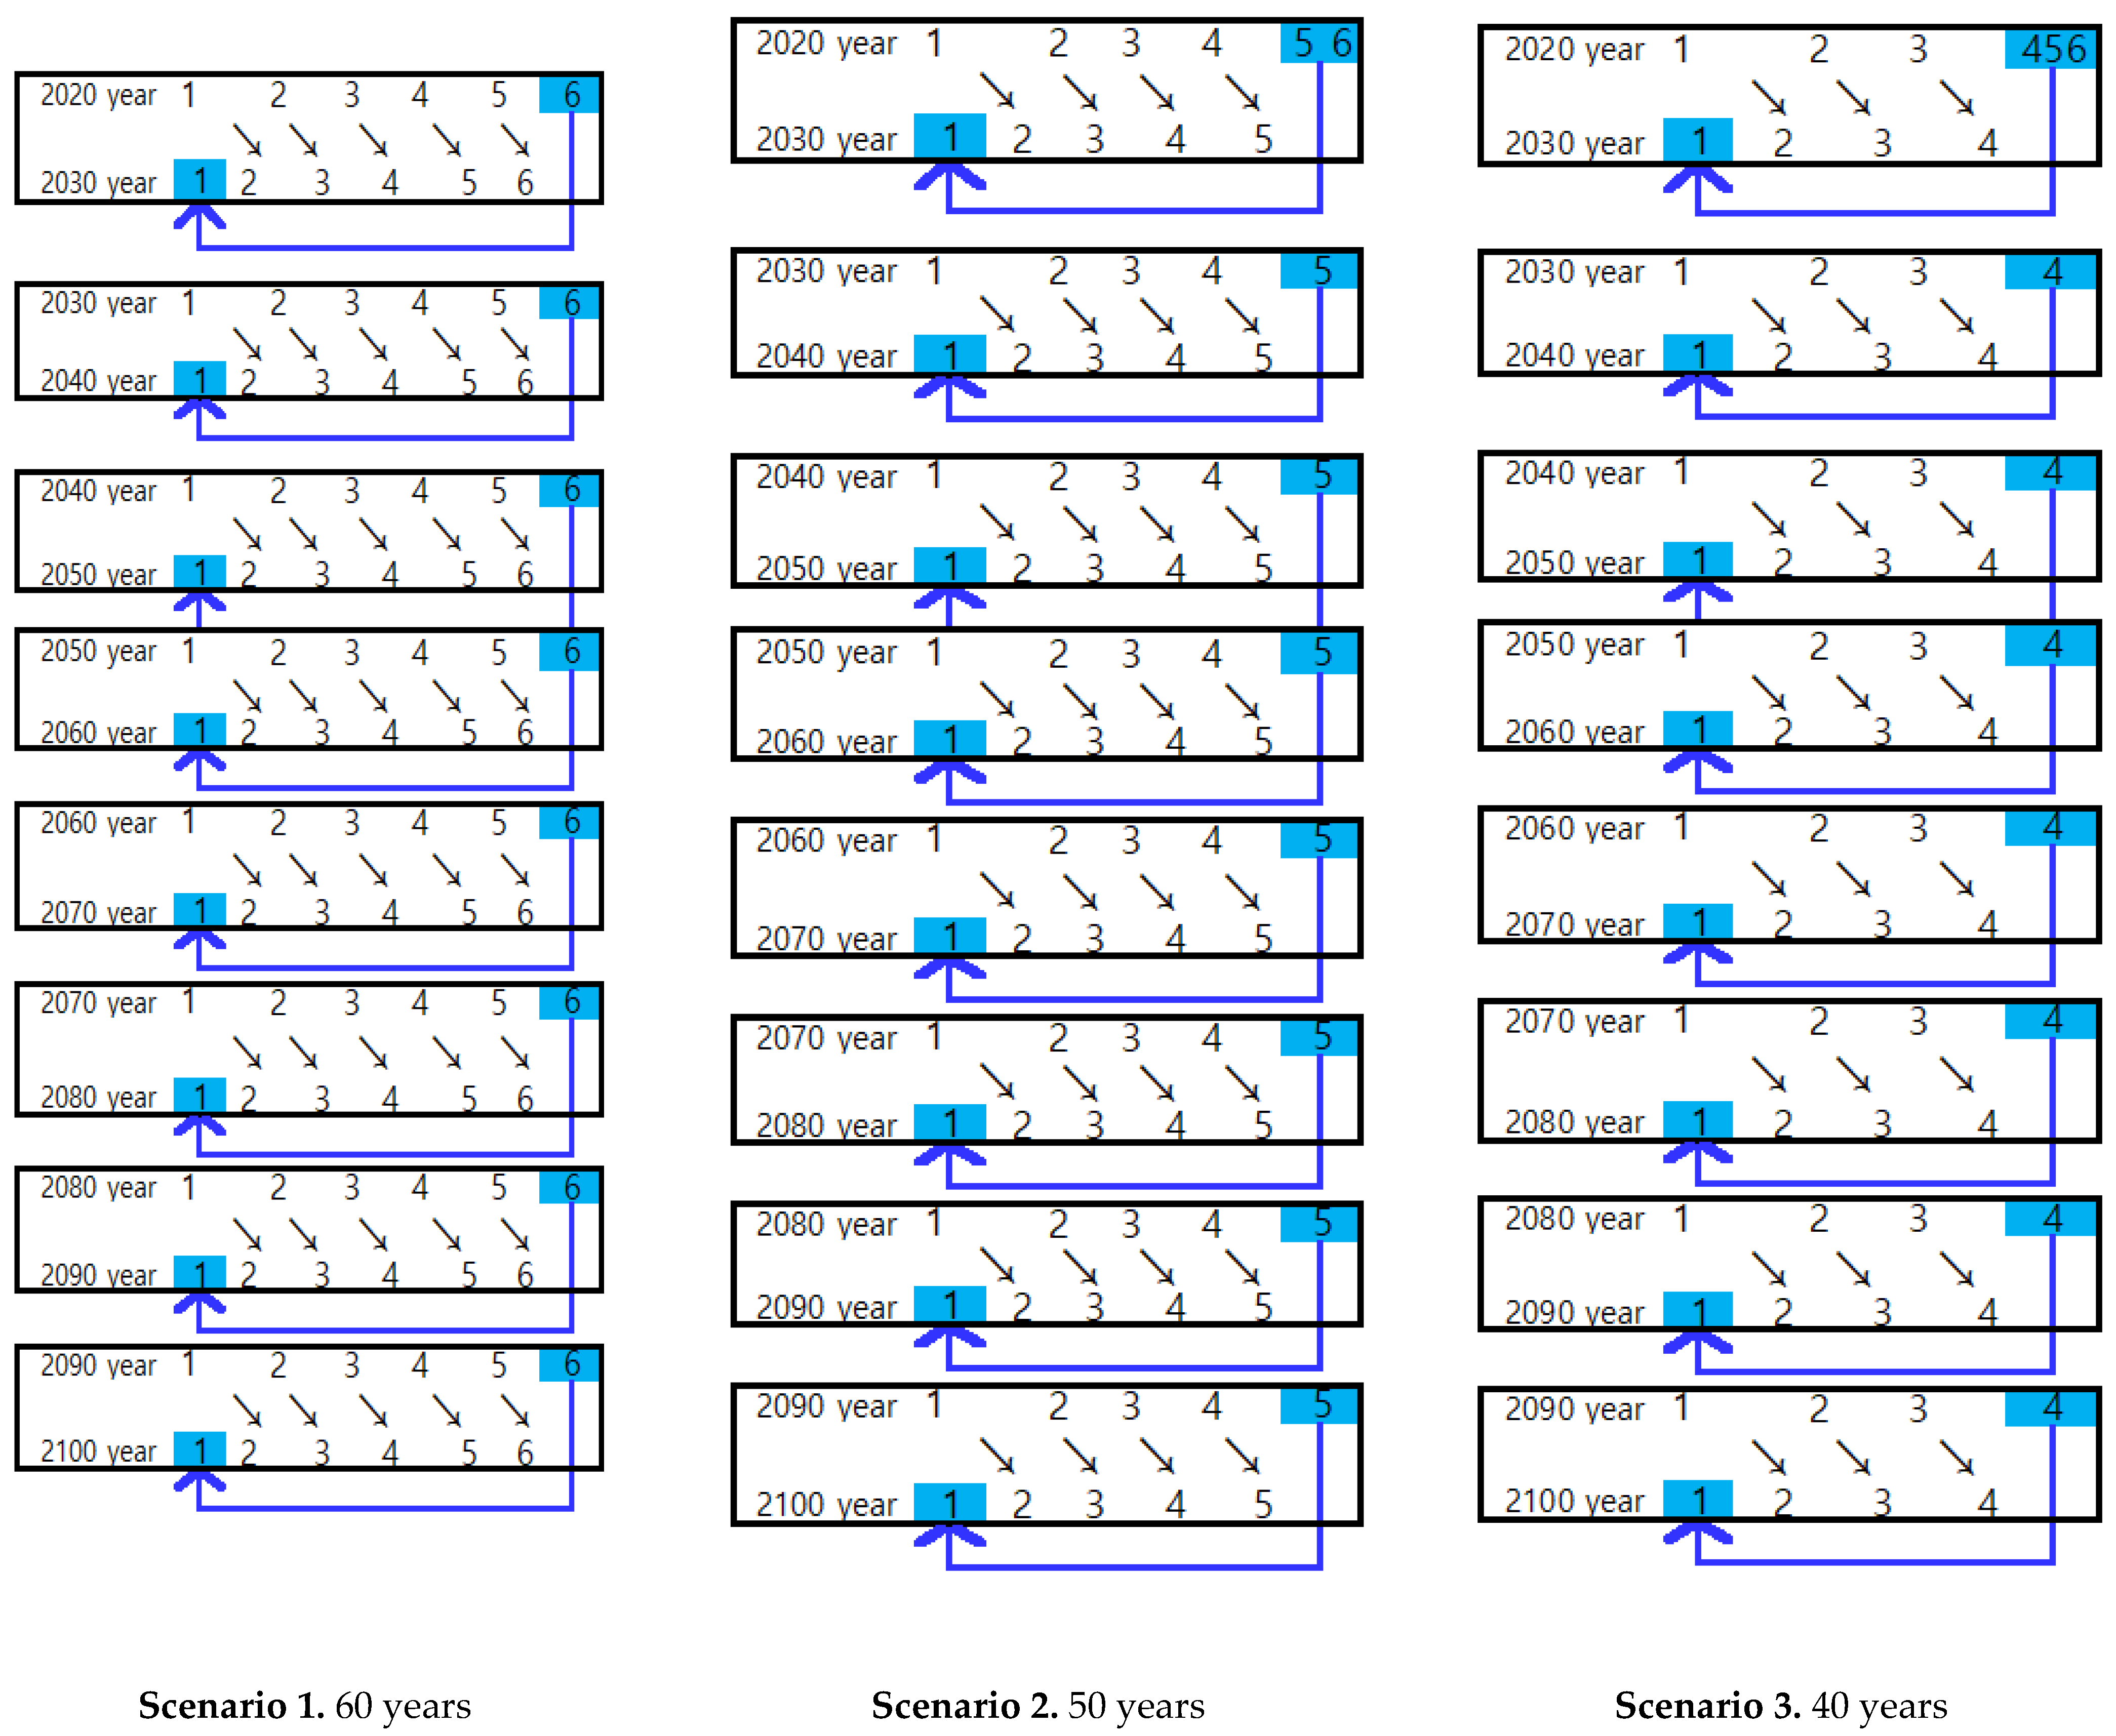
2.5. Setting up Forest Regeneration Scenarios
3. Results and Discussion
4. Conclusions
Author Contributions
Funding
Data Availability Statement
Conflicts of Interest
References
- Jin, L.; Yi, Y.; Xu, J. Forest carbon sequestration and China’s potential: The rise of a nature-based solution for climate change mitigation. China Econ. J. 2020, 13, 200–222. [Google Scholar] [CrossRef]
- Torzhkov, I.O.; Konstantinov, A.V.; Kushnir, E.A. Estimation forecast of the Russian Federation forests carbon balance based on the long-term scenarios of forest complex development. IOP Conf. Ser. Earth Environ. Sci. 2019, 392, 012051. [Google Scholar] [CrossRef]
- vonHedemann, N.; Wurtzebach, Z.; Timberlake, T.J.; Sinkular, E.; Schultz, C.A. Forest policy and management approaches for carbon dioxide removal. R. Soc. 2020, 10, 20200001. [Google Scholar] [CrossRef]
- Han, H.; Kim, Y.H.; Bae, J.S.; Shin, J.H. Analyzing the effects of species conversion projects on CO2 absorption enhancement in poorly stocked forest stands. J. Clim. Change Res. 2020, 11, 197–202. [Google Scholar] [CrossRef]
- KFS (Korea Forest Service). Statistical Yearbook of Forestry; (No. 54); KFS: Daejeon, Republic of Korea, 2024.
- Vanhellemont, M.; Baeten, L.; Verbeeck, H.; Hermy, M.; Verheyen, K. Long-term scenarios of the invasive black cherry in pine-oak foresst: Impact of regeneration success. Acta Oecol. 2011, 37, 203–211. [Google Scholar] [CrossRef]
- Allen, K.; Bellingham, P.J.; Richardson, S.J.; Allen, R.B.; Burrows, L.E.; Carswell, F.E.; Husheer, S.W.; John, M.G.S.; Peltzer, D.A. Long-term exclusion of invasive ungulates alters tree recruitment and functional traits but not total forest carbon. Ecol. Appl. 2023, 33, e2836. [Google Scholar] [CrossRef]
- Richy, E.; Fort, T.; Odriozola, I.; Kohout, P.; Barbi, F.; Martinovic, T.; Tupek, B.; Adamczyk, B.; Lehtonen, A.; Mäkipää, R.; et al. Phosphorus limitation promotes soil carbon storage in a borealforest exposed to long-term nitrogen fertilization. Glob Change Biol. 2024, 30, e17516. [Google Scholar] [CrossRef]
- KFS (Korea Forest Service). Carbon Emission Coefficients and Biomass Relative Growth of Major Korean Tree Species; KFS: Daejeon, Republic of Korea, 2014.
- Lee, S.J.; Yim, J.S.; Kang, J.T.; Kim, R.H.; Son, Y.W.; Park, G.S.; Son, Y.M. Application and development of carbon emissions factors for deciduous species in Republic of Korea—Robinia pseudoacacia, Betula platyphylla, and Liriodendron tulipifera. J. Clim. Change Res. 2017, 8, 393–399. [Google Scholar] [CrossRef]
- Park, M.Y.; Youn, Y.C. A study on conditions for facilitating forest carbon projects for greenhouse gas reduction: A forest management project case with extended rotation age in private forests. J. Korean Soc. For. Sci. 2021, 110, 440–452. [Google Scholar] [CrossRef]
- Woo, H.S.; Park, J.W.; Park, S.K. Investing the value of optimized forest carbon offset projects based on forest management scenarios in South Korea. Korean J. Agric. Sci. 2020, 47, 951–962. [Google Scholar] [CrossRef]
- Ham, B.Y.; Song, C.H.; Park, E.B.; Choi, S.E.; Lee, W.K. Development of forest activity data and forest management rate for national greenhouse gas inventory in the forest sector. J. Clim. Change Res. 2020, 11, 53–63. [Google Scholar] [CrossRef]
- Piao, D.; Lee, W.K.; Zhu, Y.; Kim, M.I.; Song, C.H. Assessment of forest degradation and carbon storage for REDD+ project in North Korea. Korean. J. Environ. Biol. 2016, 34, 1–7. [Google Scholar] [CrossRef]
- Woś, B.; Chodak, M.; Józefowska, A.; Pietrzykowski, M. Influence of tree species on carbon, nitrogen, and phosphorus stocks and stoichiometry under different soil regeneration scenarios on reclaimed and afforested mine and post-fire forest sites. Geoderma 2022, 415, 1009–1015. [Google Scholar] [CrossRef]
- Swiatek, B.; Pietrzykowski, M. Impact of Leaf Litter and Fine Roots in the Pool of Carbon, Nitrogen and Phosphorus Accumulated in Soil in Various Scenarios of Regeneration and Reconstruction of Forest Ecosystems. Forests 2022, 13, 1207. [Google Scholar] [CrossRef]
- Fernández-García, V.; Fulé, P.Z.; Marcos, E.; Calvo, L. The role of fire frequency and severity on the regeneration of Mediterranean serotinous pines under different environmental conditions. For. Ecol. Manag. 2019, 444, 59–68. [Google Scholar] [CrossRef]
- Kemp, K.B.; Higuera, P.E.; Morgan, P.; Abatzoglou, J.T. Climate will increasingly determine post-fire tree regeneration success in low-elevation forests, Northern Rockies, USA. Ecosphere 2019, 10, e02568. [Google Scholar] [CrossRef]
- Pang, X.; Nordström, E.-M.; Böttcher, H.; Trubins, R.; Mörtberg, U. Trade-offs and synergies among ecosystem services under different forest management scenarios—The LEcA tool. Ecosyst. Serv. 2017, 28, 67–79. [Google Scholar] [CrossRef]
- Budiningsih, K.; Nurfatriani, F.; Salminah, M.; Ulya, N.A.; Nurlia, A.; Setiabudi, I.M.; Mendham, D.S. Forest management units’ performance in forest fire management implementation in Central Kalimantan and South Sumatra. Forests 2022, 13, 894. [Google Scholar] [CrossRef]
- Eggers, J.; Holmgren, S.; Nordström, E.-M.; Lämås, T.; Lind, T.; Öhman, K. Balancing different forest values: Evaluation of forest management scenarios in a multi-criteria decision analysis framework. For. Policy Econ. 2019, 103, 55–69. [Google Scholar] [CrossRef]
- Teicha, M.; Giuntaa, A.D.; Hagenmullerb, P.; Peter, B.; Schneebelic, M.; Jenkinsa, M.J. Effects of bark beetle attacks on forest snowpack and avalanche formation Implications for protection forest management. For. Ecol. Manag. 2019, 438, 186–203. [Google Scholar] [CrossRef]
- Pommerening, A.; Maleki, K.; Haufe, J. Tamm Review: Individual-based forest management or Seeing the trees for the forest. For. Ecol. Manag. 2021, 501, 119677. [Google Scholar] [CrossRef]
- Kurz, W.A.; Shaw, C.H.; Boisvenue, C.; Stinson, G.; Metsaranta, J.; Leckie, D.; Dyk, A.; Smyth, C.; Neilson, E.T. Carbon in Canada’s boreal forest—A synthesis. Environ. Rev. 2013, 21, 260–292. [Google Scholar] [CrossRef]
- Miner, R.A.; Abt, R.C.; Bowyer, J.L.; Buford, M.A.; Malmsheimer, R.W.; O’Laughlin, J.; Oneil, E.E.; Sedjo, R.A.; Skog, K.E. Forest Carbon Accounting Considerations in US Bioenergy Policy. J. For. 2014, 112, 591–606. [Google Scholar] [CrossRef]
- Yu, Z.; Liu, S.; Li, H.; Liang, J.; Liu, W.; Piao, S.; Tian, H.; Zhou, G.; Lu, C.; You, W.; et al. Maximizing carbon sequestration potential in Chinese forests through optimal management. Nat. Commun. 2024, 15, 3154. [Google Scholar] [CrossRef]
- Kim, D.Y.; Han, H.; Chung, J.S. Optimal forest management for improving economic and public functions in Mt. Gari leading forest management zone. J. Korean Soc. For. Sci. 2021, 110, 665–677. [Google Scholar] [CrossRef]
- Park, E.B.; Song, C.H.; Ham, B.Y.; Kim, J.W.; Lee, J.Y.; Choi, S.E.; Lee, W.K. Comparison of sampling and wall-to-wall methodologies for reporting the GHG inventory of the LULUCF sector in Korea. J. Clim. Change Res. 2018, 9, 385–398. [Google Scholar] [CrossRef]
- Zheng, X.; Sheng, M.; Zhang, Y.; Gong, Z.; Wang, L. PhytOC sequestration characteristics and phytolith carbon sink potential of karst Masson pine forest in southern China. Sci. Total Environ. 2024, 913, 169688. [Google Scholar] [CrossRef]
- KFS (Korea Forest Service). Standard Carbon Absorption of Major Forest Species (Ver. 1.2). Briefing Materials (November); KFS: Daejeon, Republic of Korea, 2019.
- Agustín, R.-M.; Manuel, J.G.-G.; Hér Manuel, S.-P.; Gregorio, Á.-P.; Wenceslao, S.-G. Forest management with carbon scenarios in the central region of Mexico. iForest Biogeosciences For. 2021, 14, 413–420. [Google Scholar] [CrossRef]
- Zhang, H.; Liu, S.; Yu, J.; Lia, J.; Shangguan, Z.; Deng, L. Thinning increases forest ecosystem carbon stocks. For. Ecol. Manag. 2024, 555, 121702. [Google Scholar] [CrossRef]
- Oteroa, V.; Van De Kerchove, R.V.; Satyanarayana, B.; Martínez-Espinosa, C.; Fisol, M.A.B.; Bin, M.R.; Sulong, I.; Husain, M.L.; Lucasd, R.; Dahdouh-Guebas, F. Managing mangrove forests from the sky: Forest inventory using field data and Unmanned Aerial Vehicle (UAV) imagery in the Matang Mangrove Forest Reserve, peninsular Malaysia. For. Ecol. Manag. 2018, 411, 38–45. [Google Scholar] [CrossRef]
- Ordónez, C.; Duinker, P.N. An analysis of urban forest management plans in Canada: Implications for urban forest management. Landsc. Urban Plan. 2013, 116, 36–47. [Google Scholar] [CrossRef]
- The Intergovernmental Panel on Climate Change (IPCC). Climate Change 2023: Synthesis Report. Contribution of Working Groups I, II and III to the Sixth Assessment Report of the Intergovernmental Panel on Climate Change; The Intergovernmental Panel on Climate Change (IPCC): Geneva, Switzerland, 2023. [Google Scholar] [CrossRef]
- Borrass, L.; Kleinschmit, D.; Winkel, G. The “German model” of integrative multifunctional forest management—Analysing the emergence and political evolution of a forest management concept. For. Policy Econ. 2017, 77, 16–23. [Google Scholar] [CrossRef]
- Worbes, M.; Schongar, J. Measures for sustainable forest management in the tropics: A tree-ring based case study on tree growth and forest dynamics in a Central Amazonian lowland moist forest. PLoS ONE 2018, 33, 95–104. [Google Scholar] [CrossRef] [PubMed]
- Knauf, M.; Köhl, M.; Mues, V.; Olschofsky, K.; Frühwald, A. Modeling the CO2-effects of forest management and wood usage on a regional basis. Carbon Balance Manag. 2015, 10, 13. [Google Scholar] [CrossRef] [PubMed]
- Ministry of Environment. Greenhouse Gas Information Center. National Greenhouse Gas Inventory Report 2018; Ministry of Environment: Sejong, Republic of Korea, 2018.
- Wei1, N.; Xia, J. Robust projections of increasing land carbon storage in boreal and temperate forests under future climate change scenarios. One Earth. 2024, 7, 88–99. [Google Scholar] [CrossRef]
- Nunery, J.S.; Keeton, W.S. Forest carbon storage in the northeastern United States: Net effects of harvesting frequency, post-harvest retention, and wood products. For. Ecol. Manag. 2010, 259, 1363–1375. [Google Scholar] [CrossRef]
- Korea Forestry Promotion Institute. Forest Resource Evaluation in Korea 2006–2012; Korea Forestry Promotion Institute: Seoul, Republic of Korea, 2013. [Google Scholar]


| Year | Afforestation Area (Unit: Thousand ha) | Planting Trees (Unit: Thousand ha) |
|---|---|---|
| 2012 | 20 | 253 |
| 2013 | 22 | 371 |
| 2014 | 23 | 293 |
| 2015 | 23 | 279 |
| 2016 | 24 | 284 |
| 2017 | 24 | 306 |
| 2018 | 23 | 255 |
| 2019 | 23 | 211 |
| 2020 | 23 | 228 |
| 2021 | 20 | 209 |
| Total | 225 | 2689 |
| Type of Tree | 1 | 2 | 3 | 4 | 5 | 6 | Total | |
|---|---|---|---|---|---|---|---|---|
| Coniferous Species | Pinus densiflora | 38,785 | 8925 | 114,057 | 618,950 | 473,289 | 78,308 | 1,332,313 |
| P. koraiensis | 19,413 | 18,778 | 43,871 | 61,627 | 11,186 | 1655 | 156,530 | |
| Larix kaempferi | 7686 | 9581 | 44,372 | 161,752 | 34,992 | 1640 | 260,022 | |
| P. rigida | 1935 | 4342 | 38,003 | 158,094 | 36,105 | 663 | 239,142 | |
| Chamaecyparis obtusa | 19,160 | 10,952 | 12,802 | 8764 | 455 | 160 | 52,293 | |
| Other coniferous trees | 9102 | 9390 | 40,378 | 139,166 | 50,984 | 5701 | 254,721 | |
| Broadleaf Species | Quercus acutissima | 18,163 | 6616 | 17,200 | 51,730 | 10,800 | 690 | 105,199 |
| Q. mongolica | 130 | 2596 | 26,259 | 101,274 | 108,437 | 25,383 | 264,078 | |
| Other broadleaf trees | 85,849 | 91,256 | 402,341 | 1,272,744 | 570,973 | 148,988 | 2,572,151 | |
| Mixed forest (additional explanation) | 12,205 | 6911 | 83,079 | 425,983 | 163,632 | 21,604 | 713,414 | |
| Total | 212,427 | 169,347 | 822,362 | 3,000,083 | 1,460,853 | 284,791 | 5,949,864 | |
| Sortation | Trees Type/the Age of Trees | 10 | 20 | 30 | 40 | 50 | 60 |
|---|---|---|---|---|---|---|---|
| Coniferous trees | Pinus densiflora (average) | 5.5 | 8.5 | 11 | 7.3 | 5 | 3.6 |
| P. koraiensis | 5.4 | 11.8 | 10.8 | 9.1 | 7.6 | 6.5 | |
| Larix kaempferi | 9.1 | 10.5 | 9.5 | 8.5 | 7.9 | 7.5 | |
| P. rigida | 4.5 | 13.9 | 12.4 | 8.7 | 5.8 | 4.1 | |
| Chamaecyparis obtusa | 5.2 | 8.8 | 8.2 | 6.6 | 5.2 | 4.1 | |
| Coniferous trees (average) | 5.94 | 10.70 | 10.38 | 8.04 | 6.30 | 5.16 | |
| Broadleaf trees | Quercus acutissima | 11.2 | 15.9 | 14 | 12.3 | 10.9 | 9.8 |
| Q. mongolica | 8.6 | 15.0 | 9.3 | 8.4 | 7.5 | 6.8 | |
| Broad-leaved trees (average) | 9.9 | 15.45 | 11.65 | 10.35 | 9.2 | 8.3 | |
| Mixed forest (coniferous trees, broad-leaved trees average) | 7.92 | 13.08 | 11.02 | 9.20 | 7.75 | 6.73 | |
| Year | Disaster Prevention | Livelihood Environment | Landscape | Watershed Conservation | Forest Genetic Resources | Total | |||
|---|---|---|---|---|---|---|---|---|---|
| 1st Class Watershed Conservation | 2nd Class Watershed Conservation | 3rd Class Watershed Conservation | Sum | ||||||
| 2016 | 4787 | 11 | 19,116 | 98,841 | 11,890 | 157,561 | 268,292 | 152,366 | 444,572 |
| 2017 | 4890 | 11 | 17,365 | 98,040 | 10,724 | 151,549 | 260,313 | 152,428 | 435,007 |
| 2018 | 4977 | 11 | 16,289 | 94,210 | 8947 | 150,865 | 254,022 | 171,332 | 446,631 |
| 2019 | 4276 | 13 | 16,162 | 90,443 | 8878 | 155,813 | 255,134 | 172,049 | 447,634 |
| 2020 | 3063 | 13 | 16,566 | 87,547 | 10,678 | 159,732 | 257,957 | 172,587 | 450,186 |
| (1) 60-Year Regeneration Scenario | |||||
|---|---|---|---|---|---|
| (Unit: t CO2 ha−1/yr) | |||||
| 2020 | 2030 | 2040 | 2050 | 2060 | Ratio |
| 53,429,019 | 46,821,271 | 45,586,809 | 54,779,621 | 67,577,672 | 100.000 |
| 2070 | 2080 | 2090 | 2100 | Total | |
| 62,756,807 | 53,429,019 | 46,821,271 | 45,586,809 | 428,788,298 | |
| (2) 50-yearregenerationscenario | |||||
| (Unit:t CO2 ha−1/yr) | |||||
| 2020 | 2030 | 2040 | 2050 | 2060 | Ratio |
| 53,429,019 | 49,137,490 | 56,814,606 | 68,624,333 | 63,402,056 | 110.009 |
| 2070 | 2080 | 2090 | 2100 | Total | |
| 53,723,574 | 49,137,490 | 56,814,606 | 68,623,433 | 471,706,607 | |
| (3) 40-yearregenerationscenario | |||||
| (Unit:t CO2 ha−1/yr) | |||||
| 2020 | 2030 | 2040 | 2050 | 2060 | Ratio |
| 53,429,019 | 50,340,123 | 71,902,966 | 67,497,258 | 56,471,753 | 116.107 |
| 2070 | 2080 | 2090 | 2100 | Total | |
| 50,340,123 | 71,902,966 | 67,497,258 | 56,471,753 | 497,853,219 | |
| Change Rate | Tree Species Change Rate | Regeneration Scenarios | Carbon Absorption Result Value |
|---|---|---|---|
| 5% | [1st] Pinus densiflora → Quercus acutissima [2nd] P. densiflora → Other broadleaf trees [3rd] P. densiflora → Other broadleaf trees, mixed forest (each 50%) [4th] P. densiflora → All the other trees [5th] All the other trees → Other broadleaf trees | 40 years (total) | 118.367 117.189 116.637 116.593 116.377 |
| 10% | [1st] P. densiflora → Q. acutissima [2nd] P. densiflora → Other broadleaf trees [3rd] P. densiflora → All the other trees [4th] P. densiflora → Other broadleaf trees, mixed forest (each 50%) [5th] All the other trees → Other broadleaf trees | 40 years (total) | 122.018 119.893 119.009 118.788 118.268 |
| 15% | [1st] P. densiflora → Q. acutissima [2nd] P. densiflora → Other broadleaf trees [3rd] P. densiflora → All the other trees [4th] P. densiflora → Other broadleaf trees, mixed forest (each 50%) [5th] All the other trees → Other broadleaf trees | 40 years (total) | 125.785 122.597 120.939 120.807 120.159 |
| 20% | [1st] P. densiflora → Q. acutissima [2nd] P. densiflora → Other broadleaf trees [3rd] P. densiflora → Other broadleaf trees, mixed forest (each 50%) [4th] P. densiflora → All the other trees [5th] All the other trees → Other broadleaf trees | 40 years (total) | 129.551 125.301 123.090 122.914 122.050 |
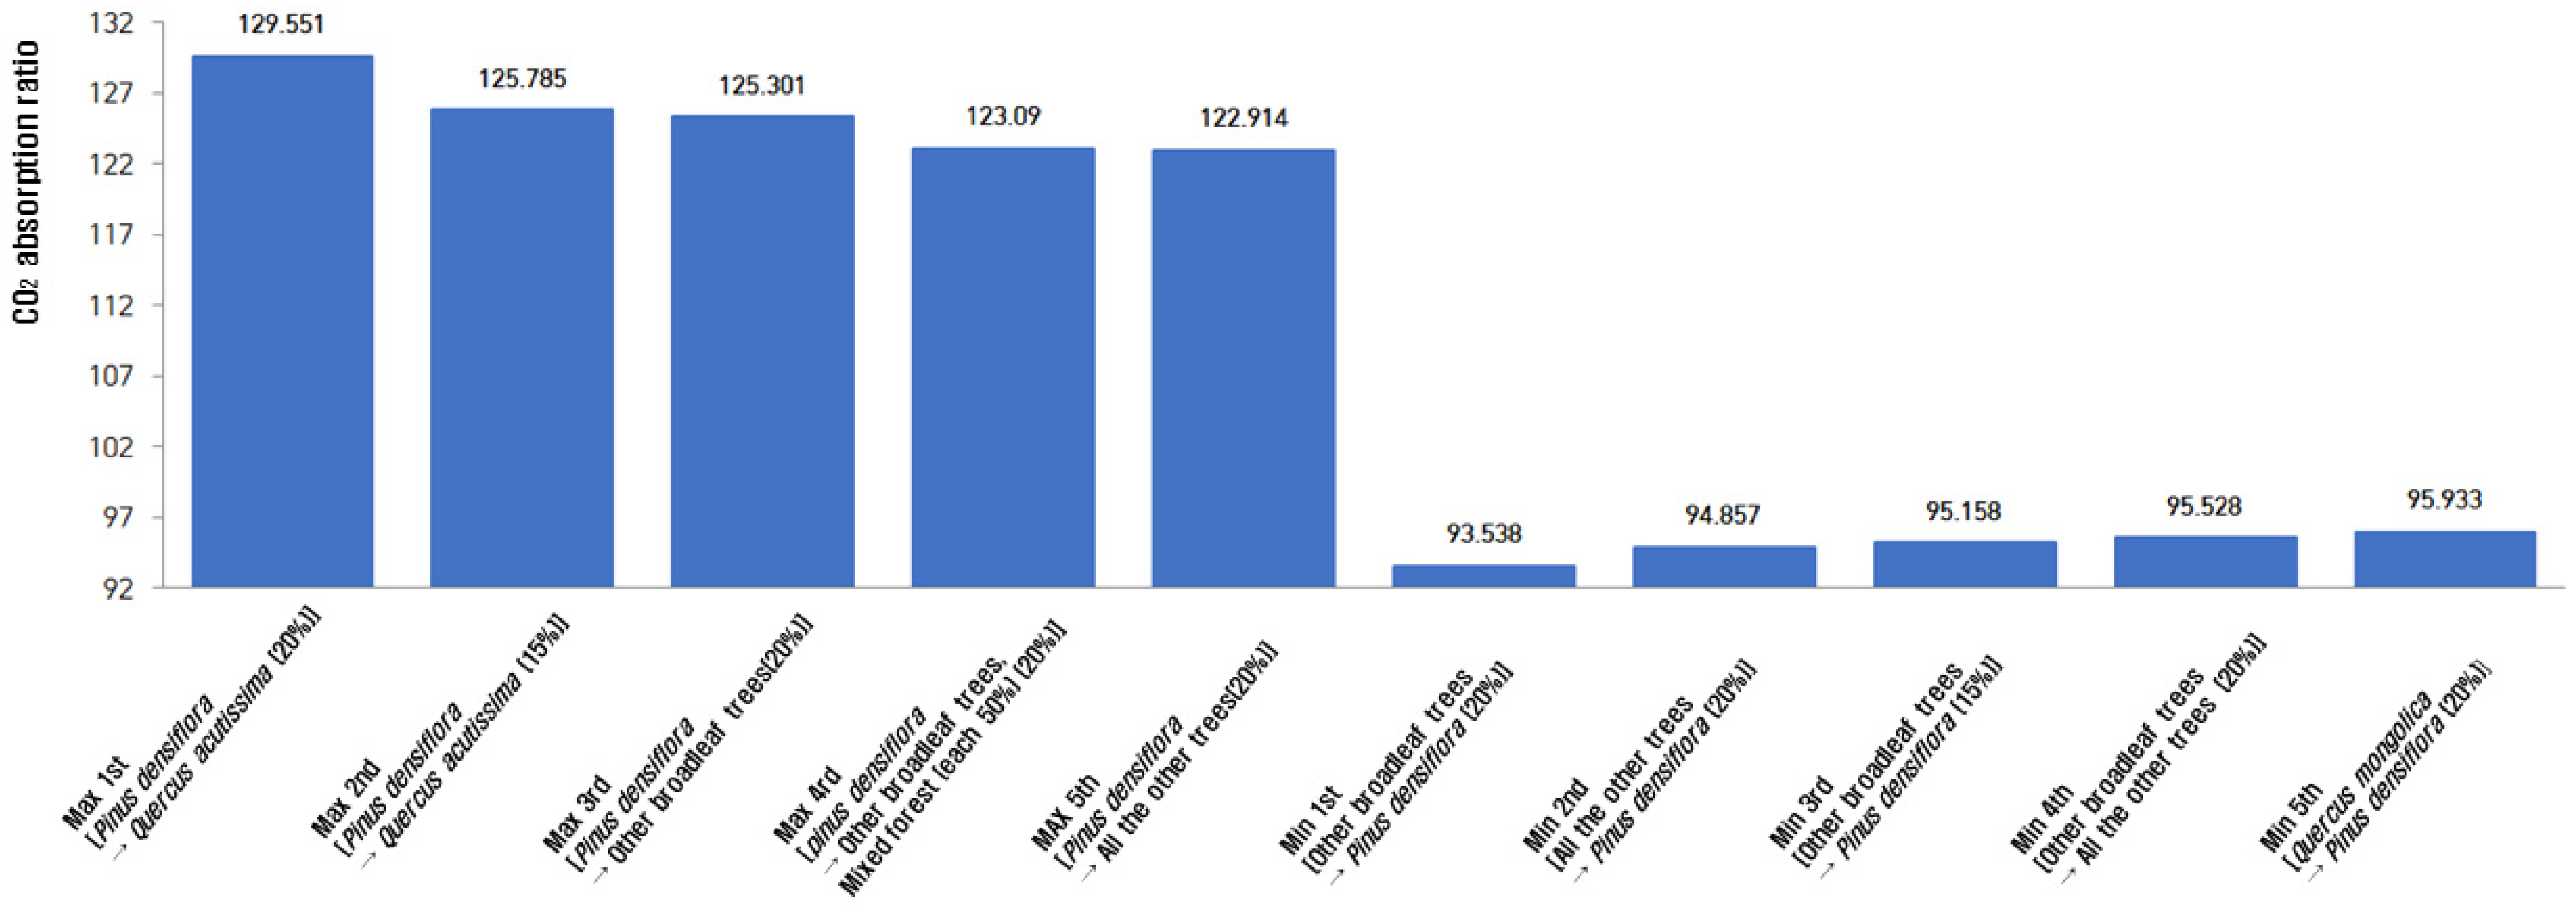
| Overall Ranking | [1st] P. densiflora → Q. acutissima (20%) [2nd] P. densiflora → Q. acutissima (15%) [3rd] P. densiflora → Other broadleaf trees (20%) [4th] P. densiflora → Other broadleaf trees, mixed forest (each 50%) (20%) [5th] P. densiflora → All the other trees (20%) | 40 years (total) | 129.551 125.785 125.301 123.090 122.914 |
| Change Rate | Tree Species Change Rate | Regeneration Scenarios | Carbon Absorption Result Value |
|---|---|---|---|
| 5% | [1st] Other broadleaf trees → Pinus densiflora [2nd] All the other trees → P. densiflora [3rd] Q. acutissima → P. densiflora [4th] Mixed forest → P. densiflora [5th] All the other trees → Other broadleaf trees | 60 years (total) | 98.386 98.714 98.983 99.016 99.028 |
| 10% | [1st] Other broadleaf trees → P. densiflora [2nd] All the other trees → P. densiflora [3rd] Other broadleaf trees → All the other tree [4th] Q. mongolica → P. densiflora [5th] Mixed forest → P. densiflora | 60 years (total) | 96.772 97.428 97.764 97.967 98.033 |
| 15% | [1st] Other broadleaf trees → P. densiflora [2nd] All the other trees → P. densiflora [3rd] Other broadleaf trees → All the other trees [4th] Q. mongolica → P. densiflora [5th] Mixed forest → P. densiflora | 60 years (total) | 95.158 96.143 96.646 96.950 97.049 |
| 20% | [1st] Other broadleaf trees → P. densiflora [2nd] All the other trees → P. densiflora [3rd] Other broadleaf trees → All the other trees [4th] Q. mongolica → P. densiflora [5th] Mixed forest → P. densiflora | 60 years (total) | 93.538 94.857 95.528 95.933 96.065 |
| Overall Ranking | [1st] Other broadleaf trees → P. densiflora (20%) [2nd] All the other trees → P. densiflora (20%) [3rd] Other broadleaf trees → P. densiflora (15%) [4th] Other broadleaf trees → All the other trees (20%) [5th] Q. mongolica → P. densiflora (20%) | 60 years (total) | 93.538 94.857 95.158 95.528 95.933 |
| Sortation | Amount of Carbon | |||
|---|---|---|---|---|
| Total national greenhouse gas emissions in 2018 | (a) 727,600,000 | |||
| Greenhouse gas absorption of the forests in 2018 | (b) 45,600,000 | |||
| [Case 1] Maximum–minimum difference | (c) 17,996,977 | |||
| [Case 2] Maximum–baseline difference | (d) 14,469,918 | |||
| [Case 3] Baseline–minimum difference | (e) −3,164,058 | |||
| Forest section in 2018 (b) + [Case 1] (c) | (f) 63,596,977 | |||
| Forest section in 2018 (b) + [Case 2] (d) | (g) 60,069,918 | |||
| Forest section in 2018 (b) + [Case 3] (e) | (h) 42,435,942 | |||
| Percentage ratio (%) | 6.26 | 8.74 | 8.25 | 5.83 |
| (b)/(a) | (f)/(a) | (g)/(a) | (h)/(a) | |
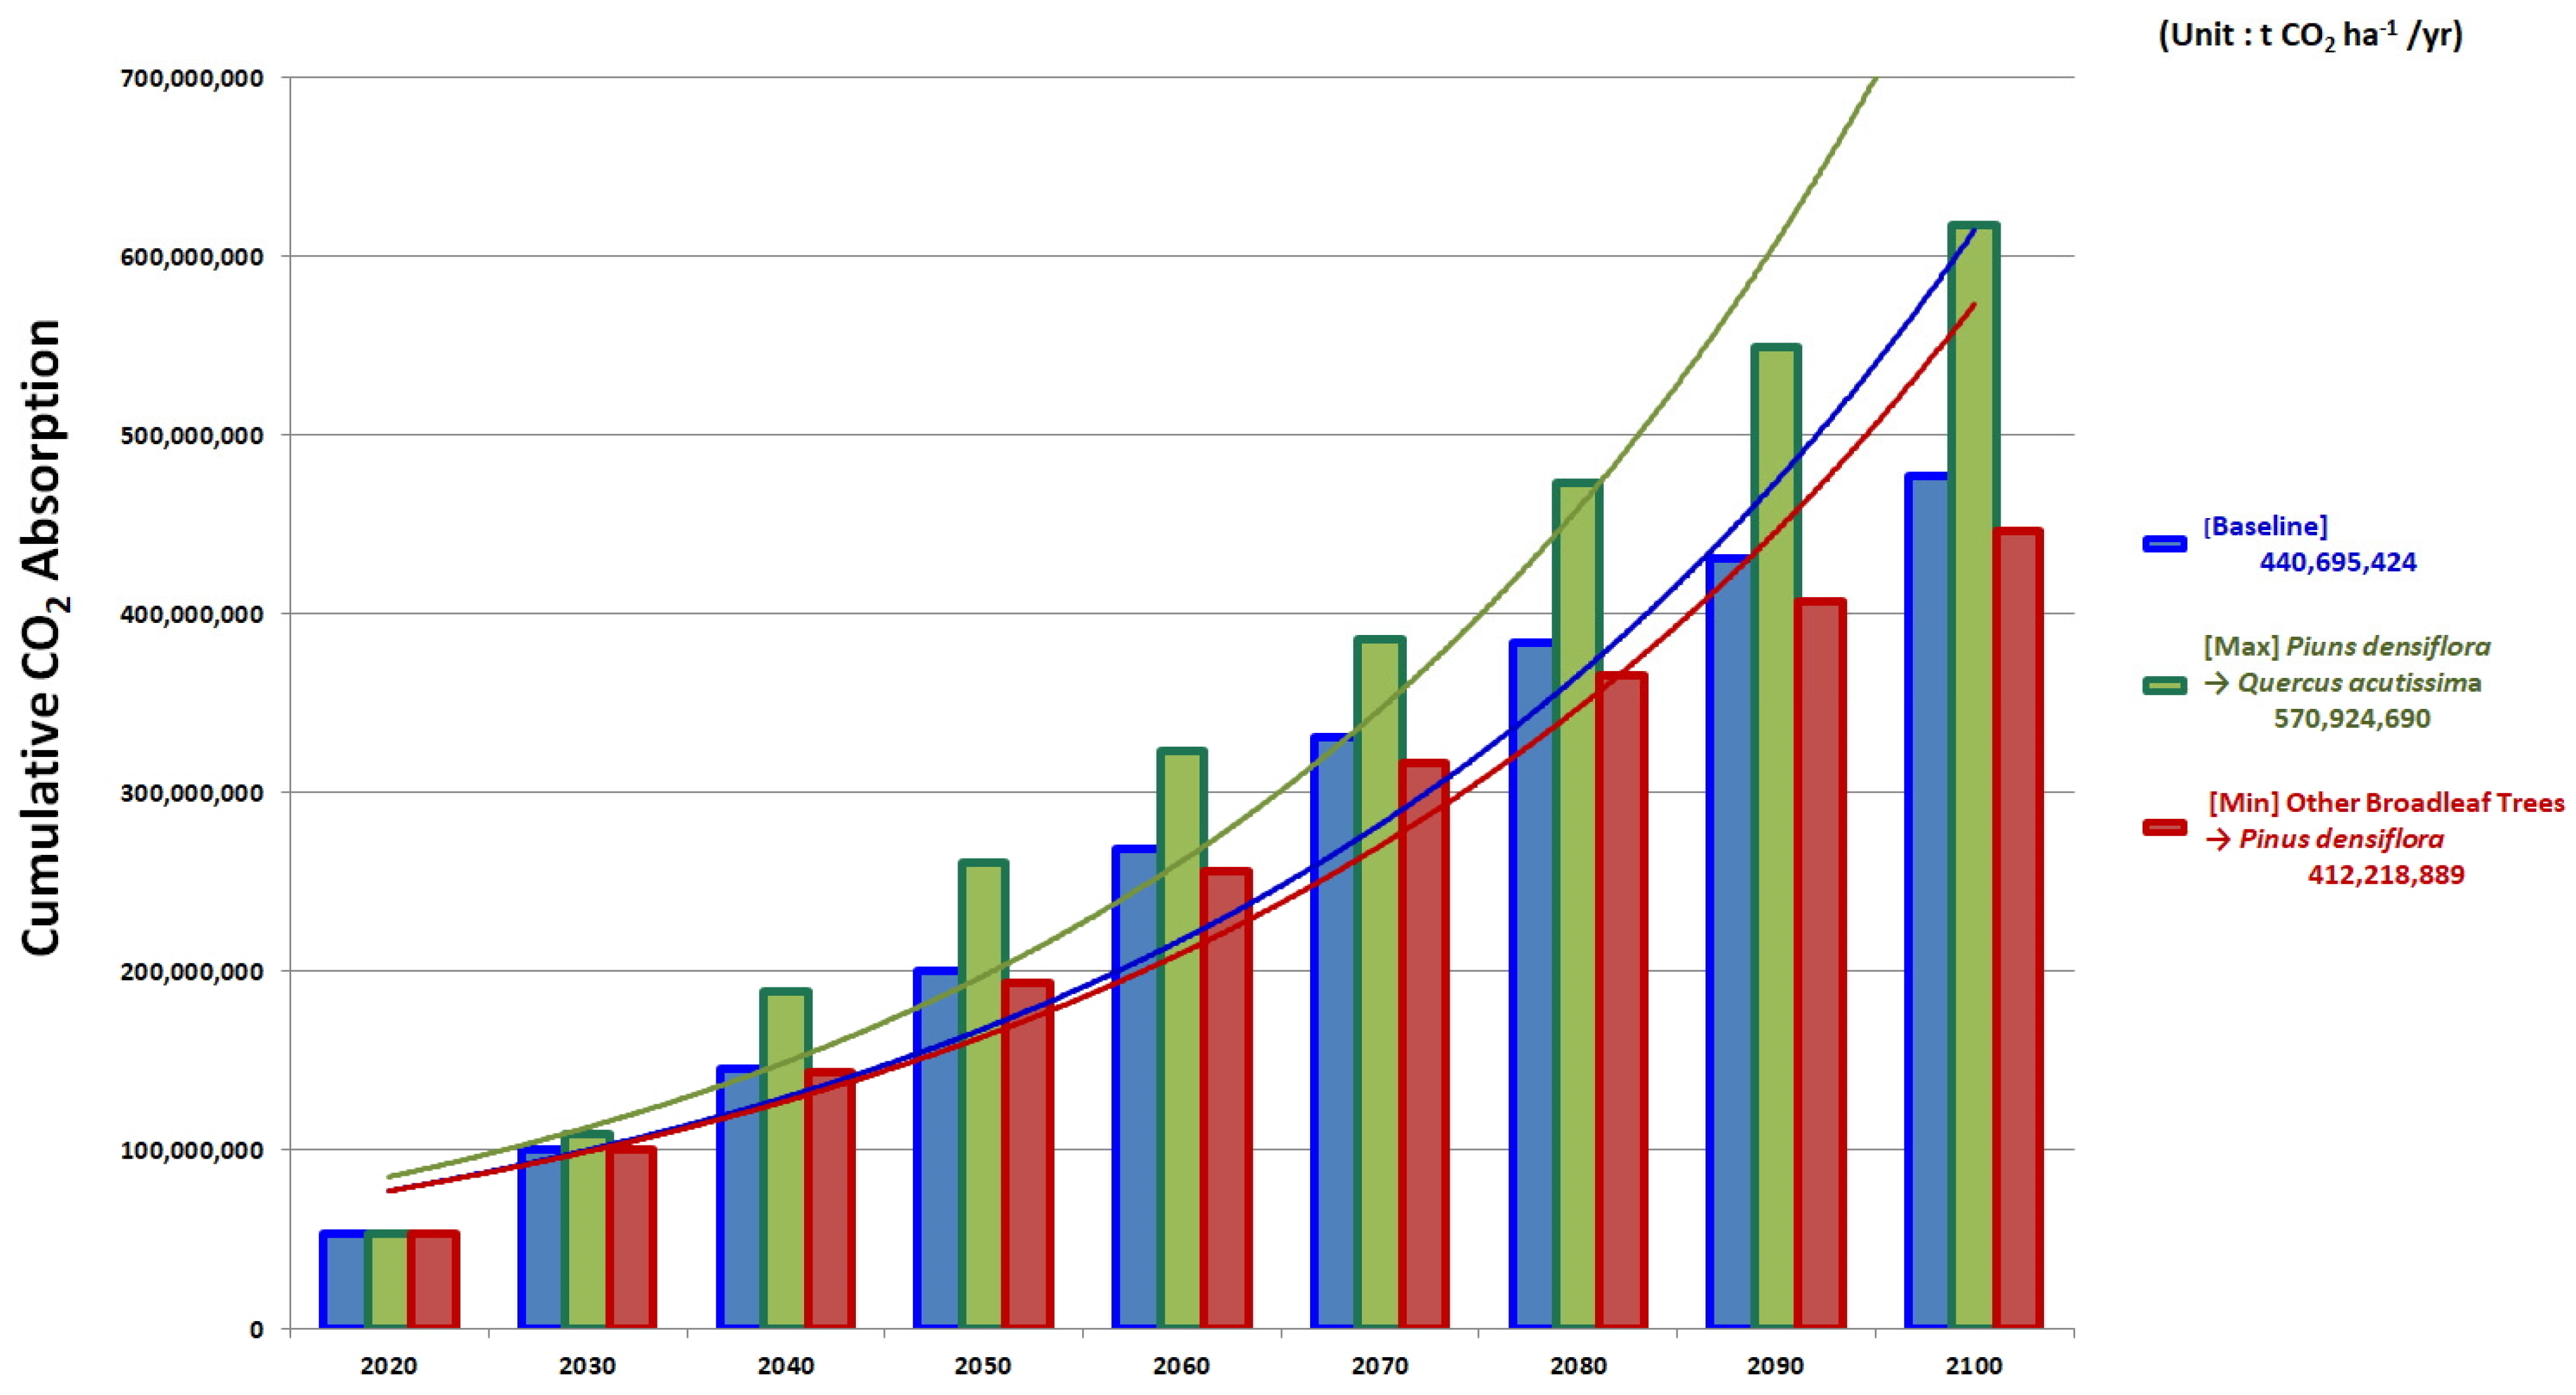
| Sortation | Total (1 January 2020–31 December 2100) | Overall Rate After Exclusion of Forest Reserve (92.43%) | Annual Unit | Ratio |
|---|---|---|---|---|
| Baseline (a) | 476,788,298 | 440,695,424 | 48,966,158 | 100.000 |
| 1st high ranking (b) | 617,683,317 | 570,924,690 | 45,802,100 | 129.551 |
| 1st low ranking (c) | 445,979,551 | 412,218,899 | 63,436,077 | 93.538 |
| Sortation | Overall Rate After Exclusion of Forest Reserve Difference | Annual Unit Difference | Ratio Difference | |
| 1st high ranking (b)–baseline (a) | 130,229,266 | 14,469,918 | 29,55% | |
| Baseline (a)–1st low ranking (c) | 28,476,525 | 3,164,058 | 6.46% | |
| 1st high ranking (b)–1st low ranking (c) | 158,705,791 | 17,633,977 | 36.01% | |
Disclaimer/Publisher’s Note: The statements, opinions and data contained in all publications are solely those of the individual author(s) and contributor(s) and not of MDPI and/or the editor(s). MDPI and/or the editor(s) disclaim responsibility for any injury to people or property resulting from any ideas, methods, instructions or products referred to in the content. |
© 2025 by the authors. Licensee MDPI, Basel, Switzerland. This article is an open access article distributed under the terms and conditions of the Creative Commons Attribution (CC BY) license (https://creativecommons.org/licenses/by/4.0/).
Share and Cite
Kwon, S.; Chang, Y.-S.; Kim, J.; Hwang, Y.W.; Lata, J.-C. A Study on the Prediction of Long-Term Carbon Absorption by Applying the Renewal Scenario of Forest in Korea. Forests 2025, 16, 254. https://doi.org/10.3390/f16020254
Kwon S, Chang Y-S, Kim J, Hwang YW, Lata J-C. A Study on the Prediction of Long-Term Carbon Absorption by Applying the Renewal Scenario of Forest in Korea. Forests. 2025; 16(2):254. https://doi.org/10.3390/f16020254
Chicago/Turabian StyleKwon, Soongil, Yoon-Seong Chang, Junbeum Kim, Yong Woo Hwang, and Jean-Christophe Lata. 2025. "A Study on the Prediction of Long-Term Carbon Absorption by Applying the Renewal Scenario of Forest in Korea" Forests 16, no. 2: 254. https://doi.org/10.3390/f16020254
APA StyleKwon, S., Chang, Y.-S., Kim, J., Hwang, Y. W., & Lata, J.-C. (2025). A Study on the Prediction of Long-Term Carbon Absorption by Applying the Renewal Scenario of Forest in Korea. Forests, 16(2), 254. https://doi.org/10.3390/f16020254