Article

Design of Rubber Tapping Mechanical Test Bench and Optimization of Rubber Tapping Machine Parameters

1
School of Mechanical and Electrical Engineering, Hainan University, Haikou 570228, China
2
School of Mechanical and Electrical Engineering, Hainan Vocational University of Science and Technology, Haikou 571126, China
*
Authors to whom correspondence should be addressed.
Forests 2025, 16(12), 1764; https://doi.org/10.3390/f16121764 (registering DOI)
Submission received: 30 September 2025 / Revised: 3 November 2025 / Accepted: 19 November 2025 / Published: 22 November 2025
(This article belongs to the Section Forest Operations and Engineering)

Abstract

To improve the quality of natural rubber tapping operations and resolve ambiguities in force application during the tapping process, a mechanical testing platform integrating linear and rotary modules was developed. This platform precisely quantifies critical force parameters involved in blade extension, cutting, and retraction. It allows for the controlled adjustment of key process parameters, such as cutting angle, tapping speed, and blade orientation. The study began with single-factor experiments to examine how three individual factors—cutting angle, blade orientation angle, and blade bending angle—affect tapping force and the quality of the cut surface. When the cutting angle ranges from 25° to 30°, the cutting force along the X-axis first increases and then decreases. As the blade’s X-axis orientation increases from 0° to 15°, the cutting force gradually decreases. A decrease in the blade angle increases force fluctuations during wood chip cutting, leading to rougher surfaces and increased chip bending and fragmentation. Researchers employed a three-factor, three-level orthogonal experimental design to further investigate the interactions among multiple parameters. A mathematical model was established to correlate the investigated parameters with the cutting force and its total variance. The model identified the optimal combination of parameters: a cutting angle of 30°, a blade bending angle of 80°, and a blade attitude angle of 10°. Experimental results indicate that this optimal conFigureuration yields a cutting force of 9.44 N and a total variance of 3.87 N2. This conFigureuration contributes to a reduced cutting force, smoother cut surfaces, and continuous wood chip formation. This study offers foundational data for optimising the design of rubber tapping machines and improving overall tapping quality.

1. Introduction

The rubber tree (Hevea brasiliensis) is an important tropical cash crop [1,2]. As a crucial strategic and industrial raw material [3,4], natural rubber plays an irreplaceable role in both the national economy and national defence [5,6,7]. Additionally, it is safely used in the medical field [8]. Currently, natural rubber is primarily harvested through manual tapping [9]. The unique latex-producing characteristics of rubber trees, combined with the extreme sensitivity of the trunk’s laticiferous cortex to damage during tapping operations [10], necessitate that workers begin their tapping as early as 2 a.m. [11]. The tapping process requires highly precise techniques, characterised by high labour intensity [12] and relatively low operational efficiency [13]. Consequently, labour costs remain persistently high, accounting for over 70% of the total production cost of natural rubber across the entire lifecycle [14]. Improving production efficiency and enhancing quality control have therefore become critical priorities for the development of the rubber industry.
Tapping, as a pivotal stage in natural rubber production, directly affects both latex yield and product quality [15]. However, conventional manual tapping methods are both labor-intensive and heavily reliant on operator skills [16]. This approach is susceptible to human error, often leading to inconsistent tapping depth and angle, which negatively impacts rubber tree health and latex production [17].
To address this challenge, researchers have conducted substantial investigations across various approaches ranging from tool ergonomics to semi-mechanized and fully automated solutions. For instance, Walaiporn Pramchoo developed an ergonomic rubber tapping knife designed to improve wrist posture and reduce impact on the wrist during tapping, thereby alleviating symptoms of carpal tunnel syndrome (CTS). Studies have demonstrated its effectiveness in reducing CTS severity [18]. In the realm of mechanized solutions, H. Susanto et al. developed a rubber tapping device at South Aceh Polytechnic with controllable cutting depth (1–1.5 mm), bark removal thickness (1.5–2 mm), and cutting angle (35–60°). This apparatus achieved an average latex yield of 1.83 g per minute under 60° slope conditions while reducing the tapping time per tree to 5–6 s, compared to the conventional duration of 6–8 s [19]. Zhang XR [20] developed a laser-guided, three-axis automatic tapping device. Experimental results demonstrated that optimal tapping performance was achieved when the rubber tree circumference was 583 mm, the cutting angle was 24°, and the tapping depth was 4.96 mm. Wen Xiangyu [21] developed a stationary automatic natural rubber tapping machine. Considering spiral helix angle, blade running speed, and bark consumption as experimental factors, with machine energy consumption and the coefficient of variation in bark consumption as evaluation metrics, the study found that optimal performance was achieved at a helix angle of 25°, a blade speed of 0.6 m/min, and a bark consumption of 0.8 mm. Zhou [22] optimized the cutting trajectory through real-time sensing of the blade’s posture and position during cutting, using blade acceleration measurements to reduce radial vibration and thereby achieve a smoother cut surface. However, the magnitude of force exerted by the blade during rubber tapping was not measured.
Recently, numerous scholars have extensively investigated the mechanics of rubber tapping, leading to a series of significant advancements in the field. Yang H [23] conducted systematic experimental investigations on the operational parameters of an adaptive spiral profiling automatic rubber tapping machine. The study examined the influence of critical parameters on cutting tool performance, establishing mathematical models to characterize cutting thickness and surface uniformity. Through rigorous optimization analysis, the authors determined the optimal parameter combination as follows: cutting speed of 15 s/blade, blade thickness of 0.50 mm, and bending angle of 27.5°. Zhang H et al. [24] employed the discrete element method (DEM), combined with the Hertz-Mindlin model with bonded contact, to establish a DEM of natural rubber tree bark. They applied quadratic Fourier fitting to match the curve with the simulated average shear force values. The results indicated that the average shear force reached a minimum of 84.3 N when the shear angle ranged between 25° and 30°, and the corresponding optimal cutting angle was determined to be 29.3°.
Several research teams have carried out experimental studies to examine the effects of tapping parameters on latex yield, tree health, and the power consumption of tapping machines. For instance, Zeng [25] developed a fixed-type automatic rubber tapping machine and analyzed the forces acting on its tapping blade during both advancement and cutting. Experimental results indicated that the optimal operating parameters were a cutting depth of 8 mm, a bark removal thickness of 1.5 mm, and a cutting line helix angle of 27.5°. Zhang CL et al. [8] investigated the effects of blade helix angle, motor speed, and spring preload on sawing power consumption during mechanized natural rubber tapping. They concluded that optimal tapping quality with minimal power consumption was achieved at a motor speed of 21 r/min, a blade angle of 25°, and a spring preload of 20 N.
In summary, although notable progress has been made in the study of rubber tapping mechanics, numerous unresolved challenges remain. In particular, in the design of experimental platforms, there is still a lack of a comprehensive apparatus capable of simulating the entire tapping process while simultaneously monitoring mechanical properties in real time. This limitation not only restricts the in-depth development of theoretical research on rubber tapping mechanics but also constrains the practical application of mechanized tapping technology. Therefore, this study aims to design a novel mechanical experimental platform for rubber tapping. The platform is intended to investigate the patterns of mechanical property changes during tapping and to explore their impact on Wood chip shape. Ultimately, it seeks to provide theoretical support and technical guidance for achieving efficient and precise mechanized rubber tapping. To address the above issues, this study designs and constructs a novel experimental platform for rubber-tapping mechanics to systematically investigate how different tapping parameters affect cut-surface quality, using cutting force and surface flatness as evaluation metrics. The findings provide a theoretical foundation and engineering pathways for efficient and precise mechanized rubber tapping.

2. Materials and Methods

2.1. Overall Structure and Working Principle

The mechanical test bench for rubber tapping devices is built around a dedicated frame and primarily comprises the following components, as shown in Figure 1: a tapping actuator, force sensor, energy chain, linear module, rotary module, horizontal specimen holder, rubber tree stump, and tailstock center. The force sensor is mounted at the lower end of the tapping actuator. The tool base is installed on the slide rail, and the slide rail, along with the pneumatic cylinder solenoid valve, is mounted on the base plate and connected to the linear module. The rubber tree stump is secured to the horizontal specimen holder; the stump is clamped and fixed by the base plate’s central support and tailstock center, while the holder is connected to the rotary module. Additionally, the control cables are routed through the energy chain to move in synchronization with the displacement of the blade base. The key parameters of the entire machine are shown in Table 1.
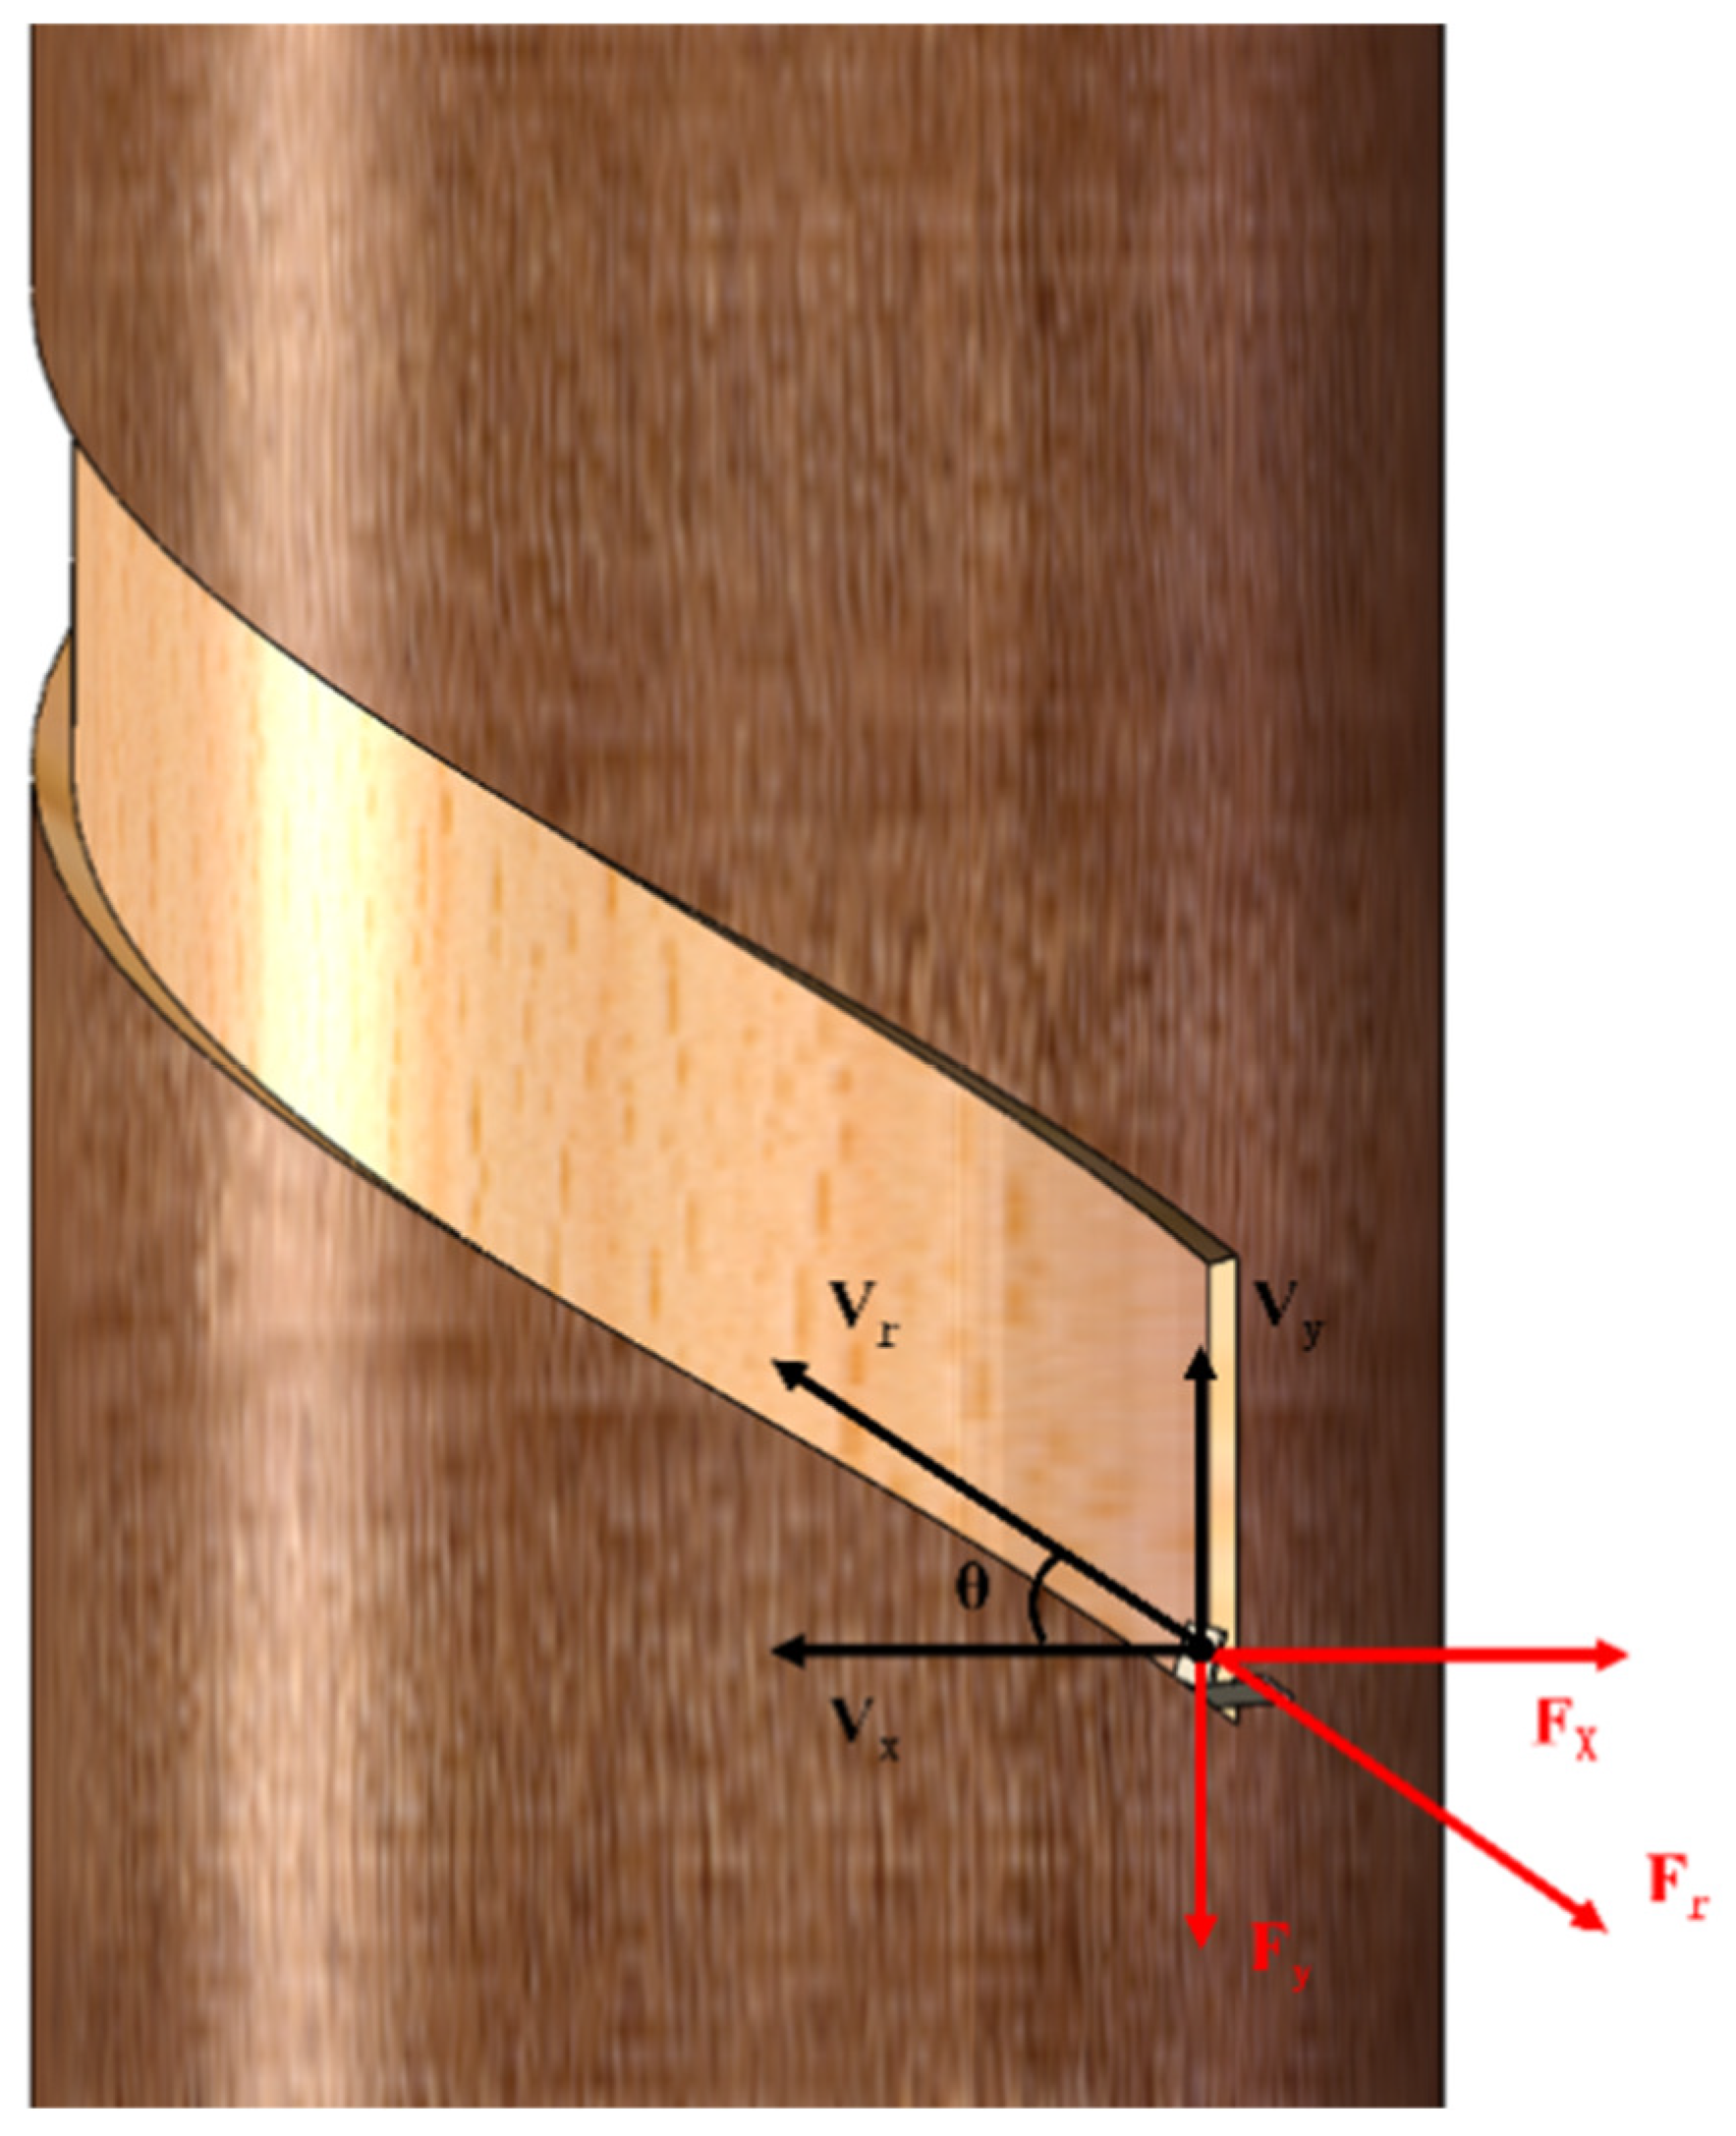
The designed rubber tapping device test bench primarily serves to evaluate the dynamic characteristics of tapping operations. First, the rubber tree specimen is secured onto the plum blossom-shaped pegs of the horizontal circular platform, ensuring that the driven shaft at its upper end aligns with the center of the lower wheel disc. When the measurement begins (as shown in Figure 2), the solenoid valve actuates the cylinder to extend. The compressed spring exerts elastic force on the blade holder, propelling it outward. Once the cylinder reaches its limit position, the stop plate connected to it presses against the blade holder, forcing it to its maximum extension and completing the blade deployment process. Simultaneously, the linear module drives the cutting-head base plate upward, while the rotary module initiates clockwise rotation of the rubber tree stump. Based on the preset tapping speed and the angle between the tapping curve and the horizontal plane, the speed of the linear module (Vy) and the rotational linear speed of the rotary module (Vx) are calculated. Corresponding mechanical sensors continuously record variations in tapping force during the process. Once the test is completed, the solenoid valve actuates the cylinder to retract; the stop plate connected to the cylinder then compresses the blade base, causing it to retract and completing the blade withdrawal process.

2.2. Design of Key Components

2.2.1. End Effector Design for Rubber Tapping Machines

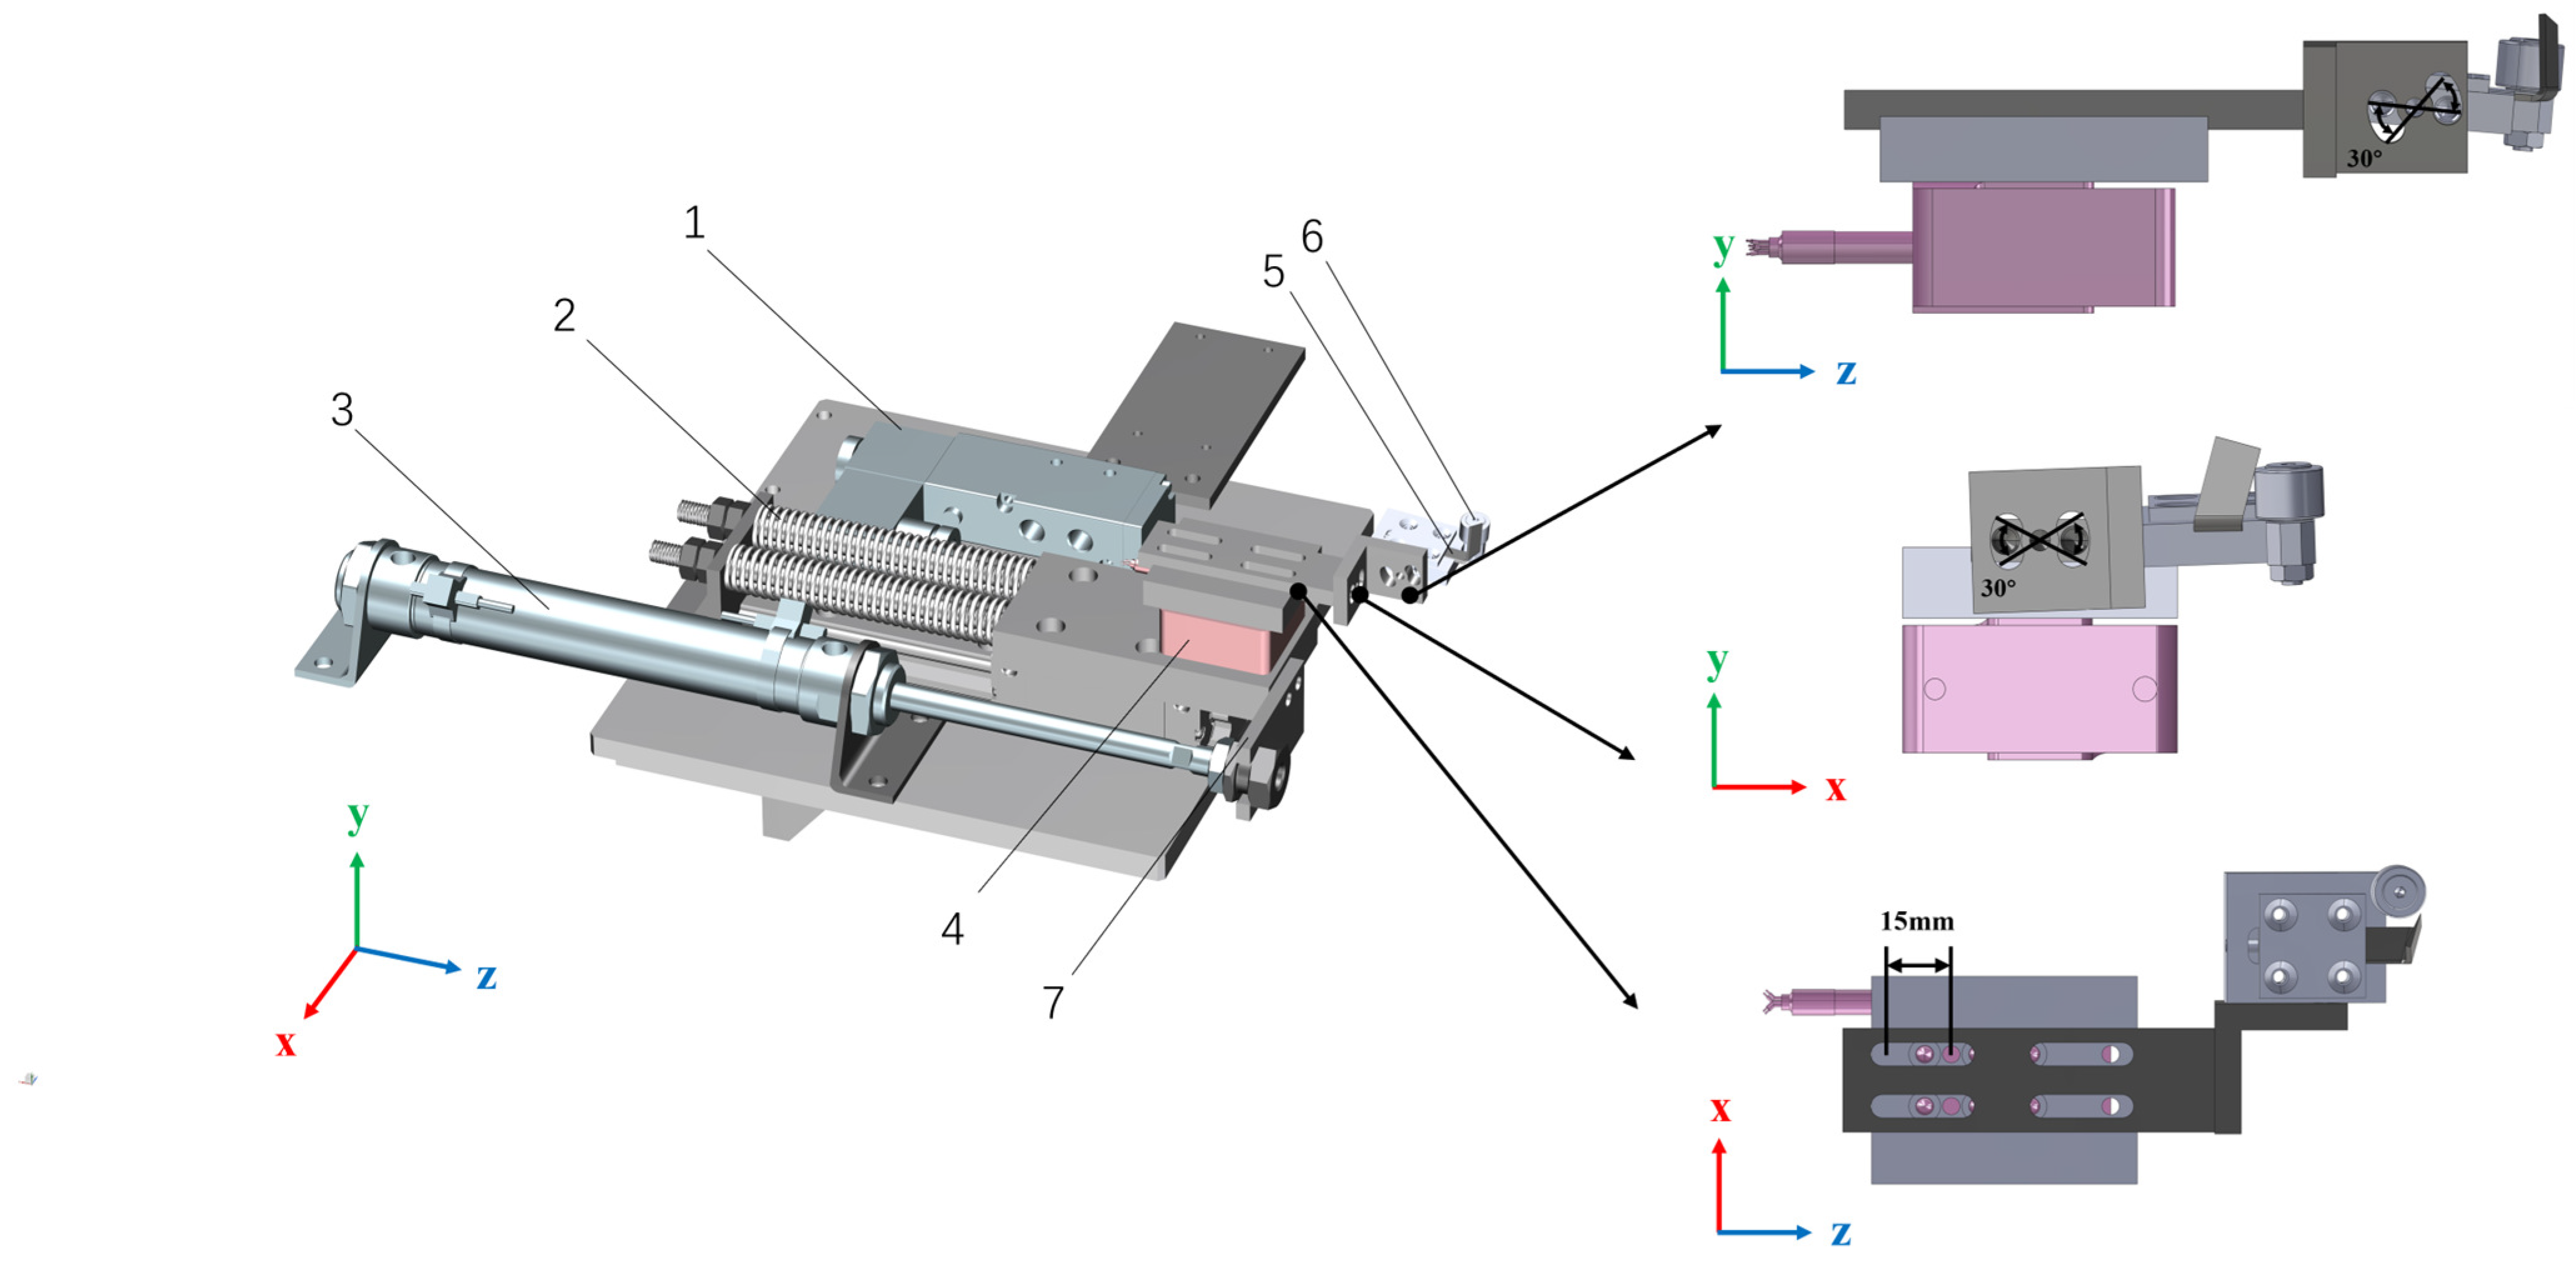
A profiling rubber tapping end-effector was designed, which is capable of measuring the forces exerted during the tapping process. As shown in Figure 3, the effector primarily consists of a solenoid valve, profiling device, air cylinder, force sensor, blade, and profiling roller. A small roller located at the front of the blade is used for profiling and is connected to two angle-adjustment plates. The entire assembly is mounted on a telescopic base plate. The lower end of the base plate is attached to a force sensor and mounted on a sliding block. The rear end of the sliding block is connected to a threaded guide rod, which passes through a spring. The threaded end of the guide rod allows adjustment of the nut position, thereby modifying the effective length of the guide rod. The guide rod slides smoothly within a baffle, which is fixed to the base. The front end of the air cylinder secures the baffle through a floating joint, thereby limiting the displacement of the sliding block.
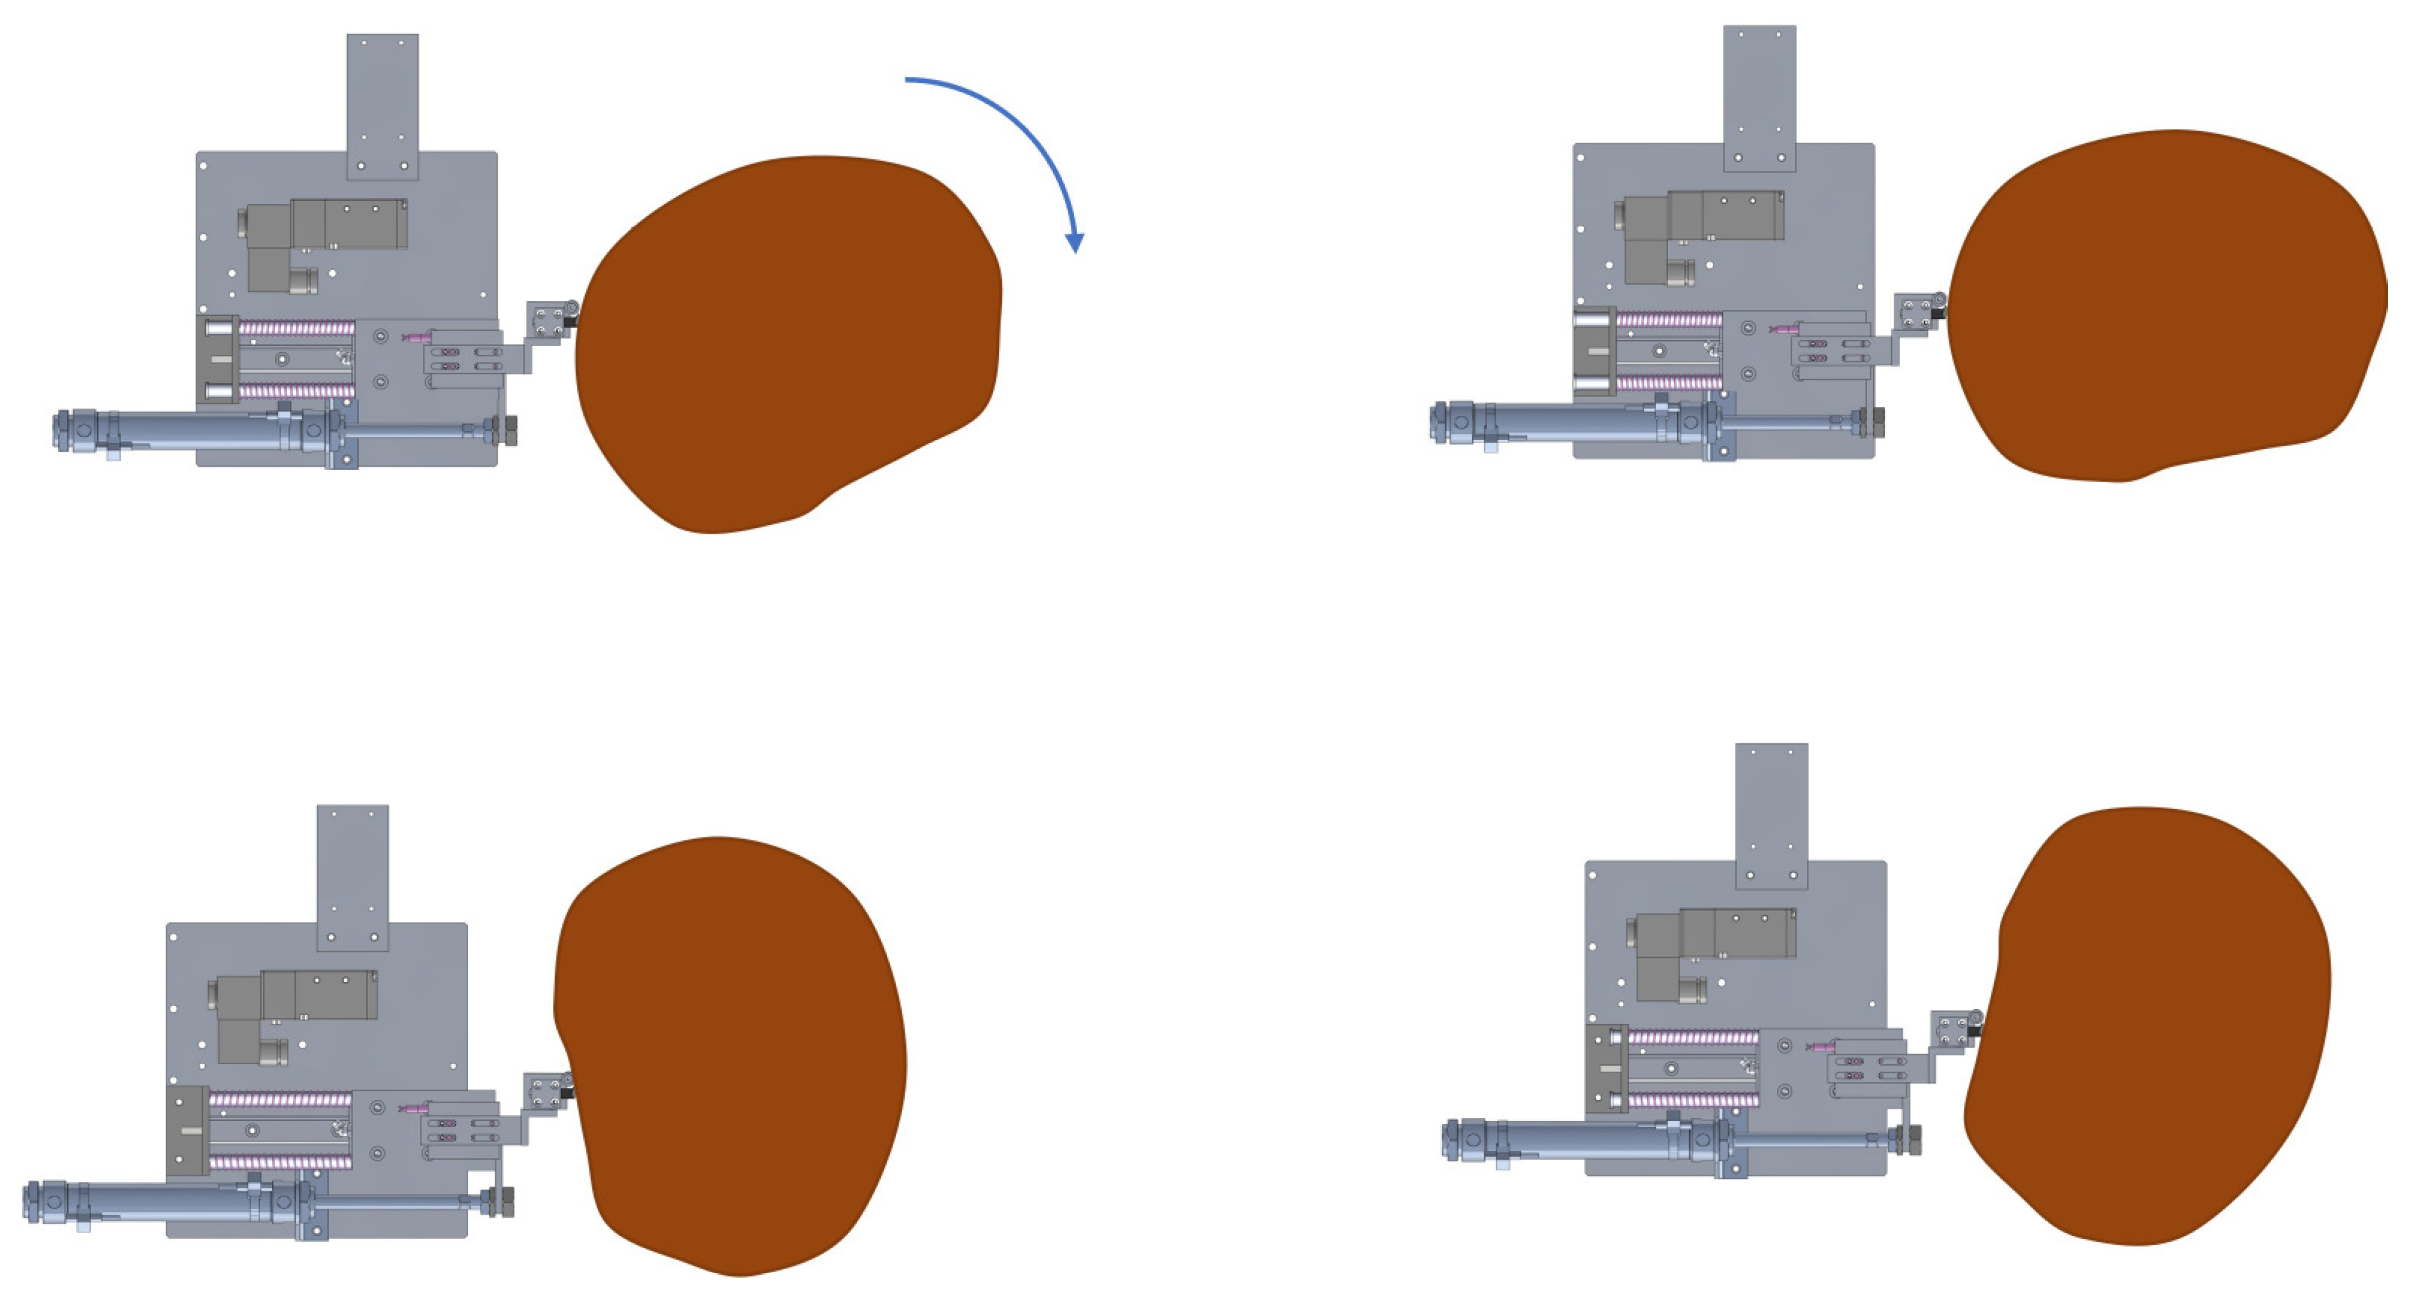
As shown in Figure 4, the specific working process is described as follows: When the air cylinder is not supplied with air, the piston rod remains at its shortest position. The pressure exerted by the baffle on the sliding block equals the restoring force exerted by the spring, and the sliding block remains stationary at the leftmost end. When the air cylinder is supplied with air, the piston rod pushes the baffle, the pressure exerted by the baffle on the sliding block decreases, and the compressed spring applies an elastic force to the sliding block, causing it to move to the right. When the piston rod reaches its maximum stroke, the pressure exerted by the baffle on the sliding block equals the force exerted by the spring, the sliding block remains stationary at the rightmost end, and the blade reaches its limit position. When the blade cuts into the rubber tree bark and encounters an uneven surface, the contour-following effect is realized through the compression of the spring.
The blade extension and retraction functions are achieved using an MA25X100SCA stainless steel miniature cylinder, which is manufactured by Airtac Corporation in Taiwan, China. Two angle adjustment plates were designed at the connection between the tool holder and the sensor connecting wire, and two slotted holes (with a swing angle of 35° for the swing travel slot) were arranged on the adjustment plates to adjust the pitch angle and fore-and-aft tilt angle of the tool. A straight hole was designed on the sensor to adjust the travel of the blade in the Z-direction (with a displacement travel slot of 15 mm).

2.2.2. Design of the Control System

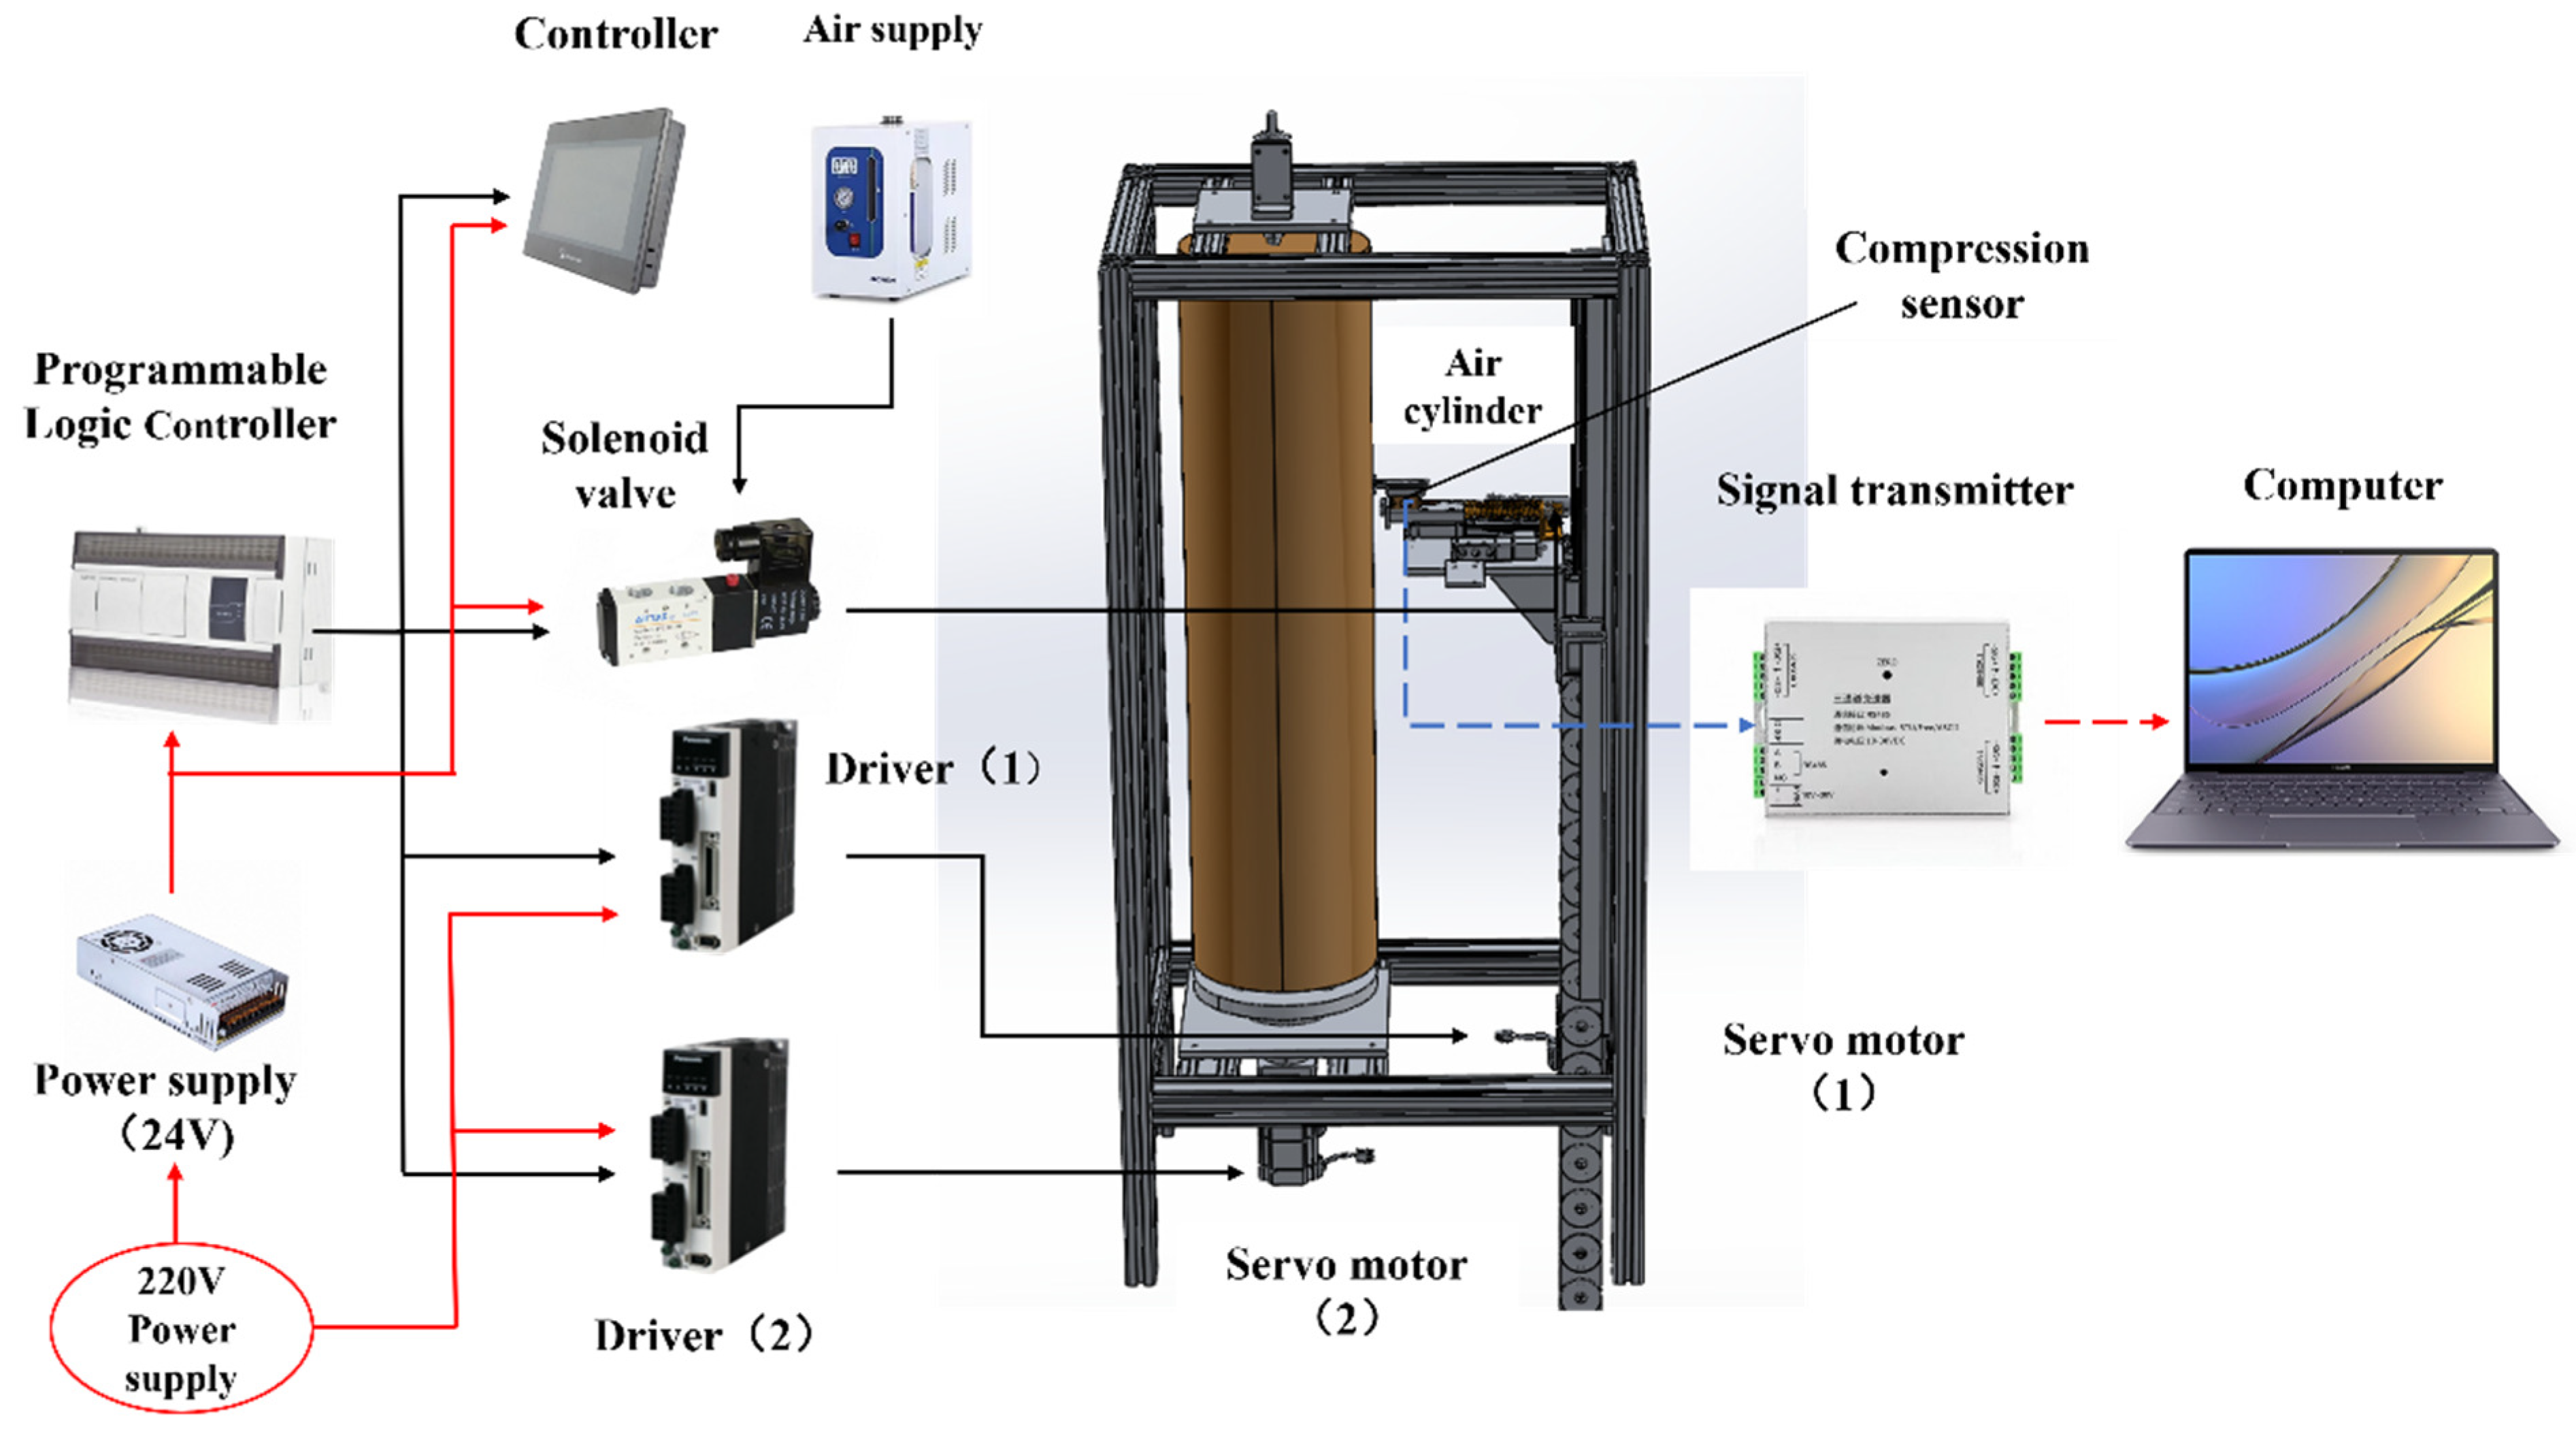
For the designed mechanical test bench of the rubber tapping device, the extension and retraction of the air cylinder are controlled by the on-off state of the solenoid valve, which in turn controls the forward and backward displacement of the tapping blade to realize blade extension and retraction. Meanwhile, servo motor drive system 1 is adopted to control the lifting displacement of the blade, and servo motor drive system 2 is used to control the rotation of the rubber tree. By setting the movement time and speed of the two motors, the resultant displacement of rubber tapping can be precisely controlled. The test signal from the force sensor is transmitted to the computer through a signal transmitter. The hardware composition of the overall control and test system is shown in Figure 5.
Using servo motors manufactured by Panasonic Corporation of Kadoma, Japan, models MSMF042L1V2M and MSMF082L1V2M, with a maximum pulse response frequency and a rated torque of up to 3.2 N·m. These motors feature servo closed-loop characteristics, as well as overcurrent and overvoltage protection functions. They are compatible with the PG90-L2-19-70-90-M6 reducer manufactured by Dalian Zhongli Precision Machinery Group in China, which can improve motion accuracy and stability while reducing the load impact directly borne by the motors. The pneumatic circuit is controlled using an MA25X100SCA cylinder manufactured by AirTac (Taiwan, China) and a 4V21006B 2-position 5-port solenoid valve, operating within a pressure range of 0.15 to 0.8 Mpa. Meanwhile, a magnetic switch is utilized to detect the in-position status of the air cylinder so as to feed back the on-off state of the solenoid valve.
Proximity switches are installed to determine the initial reference positions of both the linear and rotary modules. After each tapping cut, the blade automatically returns to its initial position. Before the next cut, the blade moves downward by a preset distance to satisfy the conditions for repeated experiments. Use the T301A force sensor and SBT908D transmitter, both of which are produced by the Subatuo Company in Guangzhou, China, to measure the force applied during the rubber tapping process, is employed to measure the force exerted during the rubber tapping process. The sensor’s built-in software is used for data acquisition, enabling 16-bit, 8-channel synchronous sampling at a rate of 10 Hz. Prior to testing, the sensor must be calibrated using standard weights.

2.3. Single-Factor Mechanical Tests

2.3.1. Test Objects

The experiment was conducted at the natural rubber base of Hainan University from June to July 2025, using the “Tropical Research 7-33-97” variety cultivated in the forest area of the university’s Danzhou Campus. Sample preparation followed strict selection criteria: fresh rubber trees of approximately 10 years of age with an average tree Circumference of 70 cm were selected. The bark thickness of all selected samples measured 7 ± 2 mm. At the time of testing, the moisture content of the rubber tree trunks on the test platform ranged between 45% and 55%.

2.3.2. Test Plan

This study employed a structured single-factor experimental design to systematically evaluate the effects of cutting angle, blade attitude angle, and blade bending angle on rubber tapping force. To ensure statistical robustness while accounting for natural biological variability, each factor level was tested with ten replicates following a balanced design: two independent cuts were performed on each of five different tree trunks. The independence of technical replicates on the same trunk was ensured by spatially separating incision sites by ≥50 cm and positioning them on diametrically opposite sides. All tests were conducted on fresh bark surfaces while avoiding areas of raised bark. Force data were acquired at 0.1 s throughout the 10 s cutting cycle via an automated data acquisition system, yielding 100 discrete data points per test that characterized the complete cutting process. Results from all repeated trials were aver-aged to ensure representative and reliable force measurements.
This experiment comprised three single-factor trials to investigate the effects of cutting angle, blade orientation angle, and blade bending angle on the cutting force during rubber tapping. Each test group was repeated ten times, while areas of raised bark were avoided. The results of the repeated trials were averaged. Prior to testing, a tapping line was manually opened. The testing process was automated and connected to a data logger with a sampling frequency of 10 Hz. Each tapping cycle lasted 10 s, during which the corresponding force signals were continuously collected and recorded.
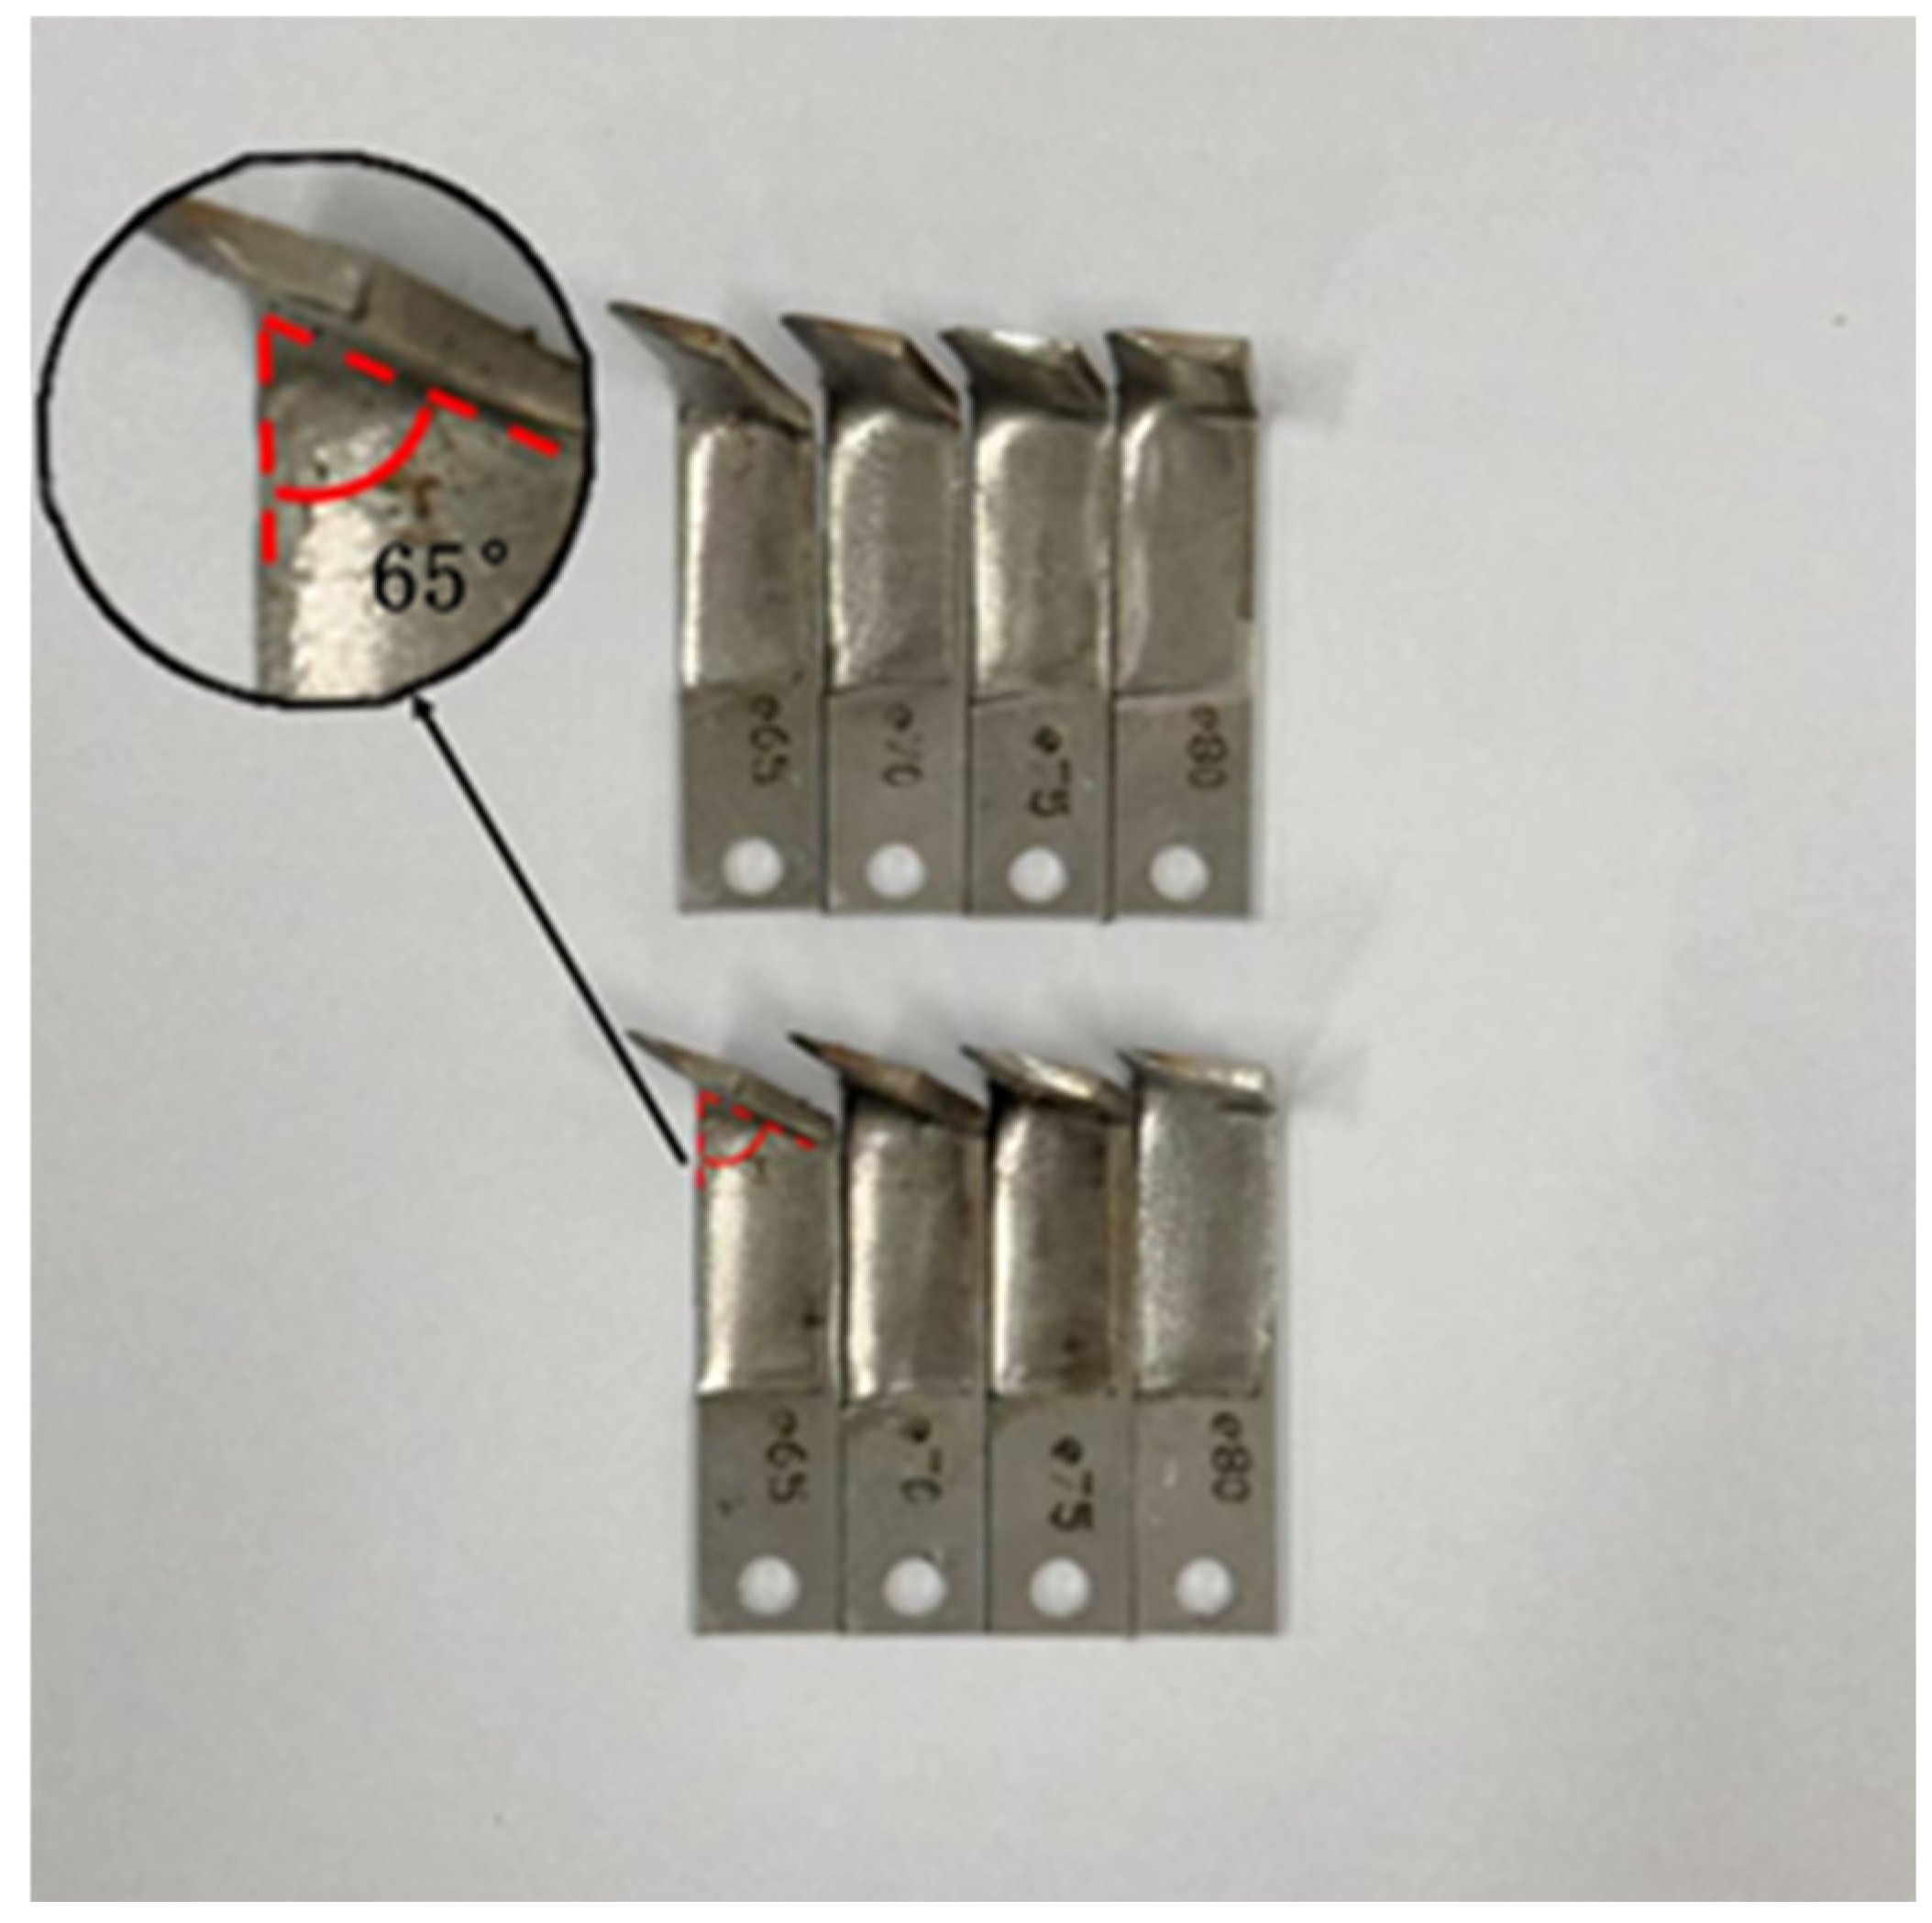
To prevent bark chips from remaining on the cut surface—which could lead to latex leakage and reduced yield—the tapping tool was designed with a blade angle that directs the cut bark chips outward. Based on previous literature [26], the bending angle of rubber tapping knives typically falls within the range of 65–80°. As shown in Figure 6, to ensure manufacturing feasibility while maintaining experimental precision, this study adopted 5° intervals within this conventional range, ultimately selecting four cutting blade bending angles (65°, 70°, 75°, and 80°) for investigation.
According to the Rubber Tree Tapping Technical Regulations (NY/T 1088-2006) [26], the tapping speed was set at 1.1 m/min, with a specified bark removal depth of 1.1–1.8 mm. In this single-factor experiment, the bark removal depth was set to 1.2 mm and the cutting angle to 26°. Throughout the test, the blade base was maintained parallel to the cutting surface.
The cutting angle is a core parameter affecting the mechanical properties during the cutting process, directly determining the cutting force, power consumption, and equipment stability. The Rubber Tree Tapping Technical Regulations (NY/T 1088-2006) [26] has designated a 30° cutting angle as a global standard, noting that this angle balances the latex flow rate and bark healing speed: on one hand, it ensures sufficient damage to the latex vessels. Susanto H found that the rubber tree bark in Indonesia is relatively thick (the sand bark layer accounts for more than 80%), and a 60° cutting angle can accelerate the flow of latex in the tapping groove, preventing the latex vessels from closing due to slow flow rates in arid environments [21]. For local rubber varieties, the average latex yield is the highest when the cutting angle is 60°. When exploring the relationship between the rubber cutting angle and tapping force, according to the Technical Regulations for Rubber Tree Tapping (NY/T 1088-2006), the optimal cutting angle is recognized to be between 25 and 30°. Therefore, three groups of angles (25–26°, 27–28°, and 29–30°) were selected for the single-factor experiment in this study. The resultant speed during tapping was set to 1.1 m/min, and the bark consumption was set to 1.2 mm. In the experiment, as shown in Figure 7, the cutting angle was adjusted by varying Vx and Vy.
Figure 7. Kinematic Scheme For Setting The Cutting Angle.
Forests 16 01764 g007
v x = v cos θ
v y = v sin θ
v x = ω r
v: Actual cutting speed
v x : Component velocity in the x-direction
v y : Component velocity in the y-direction
ω: Angular velocity of motor rotation
r: Radius of the rubber tree in the experiment
θ : Cutting Angle
When investigating the influence of blade posture on the magnitude of cutting force, according to the provisions in Technical Regulations for Rubber Tree Tapping (NY/T 1088-2006) [26], the cutting blade attitude angle must have an outward tilt angle. If the tilt angle is inward, water will accumulate in the tapping line during rain, leading to diseases in rubber trees. In this experiment, the force on the blade was tested at outward tilt angles of 0°, 5°, and 10° around the X-axis, as shown in Figure 8.

2.4. Orthogonal Experiment

Experimental Scheme

To investigate the relationships between the stress condition of rubber tree bark, the degree of stress variation during the cutting process, and the associated parameters, parameter ranges were established based on the results from the single-factor tests in Section 4. The factors and their corresponding levels are presented in Table 2. A three-factor experimental design employing five distinct levels was implemented using the Central Composite Design method. Each test group was repeated five times, and the results were averaged. A three-factor, three-level experimental design was implemented using the Central Composite Design method. Each test group was repeated five times, and the results were averaged. Data analysis was performed using Design Expert 11.0 software developed by Stat-Ease, Inc.
In this study, the degree of force variation during cutting excludes the blade-extension and blade-retraction phases and considers only the steady cutting interval. For each trial, the cutting force was sampled for 10 s at 10 Hz. We define flatness as the sample variance of these 100 force samples, computed with the unbiased estimator; its unit is N2. To reduce random error, each parameter setting was repeated five times, and the reported flatness is the arithmetic mean of the five variance values. A larger flatness indicates stronger low-frequency force fluctuation and typically corresponds to smaller, more fragmented chips, whereas a smaller flatness indicates a smoother cut and more continuous chips.
V = σ 2 = 1 N i = 1 N x i μ 2
N: The total number of data points.
x i : The i-th data point in the dataset.
μ: The average of the dataset, which is the sum of all data points divided by N.

3. Experimental Results

3.1. Results of Single-Factor Mechanical Tests

3.1.1. Experimental Results of Single-Factor Test on Cutting Blade Bending Angle Key Adjustment & Explanation

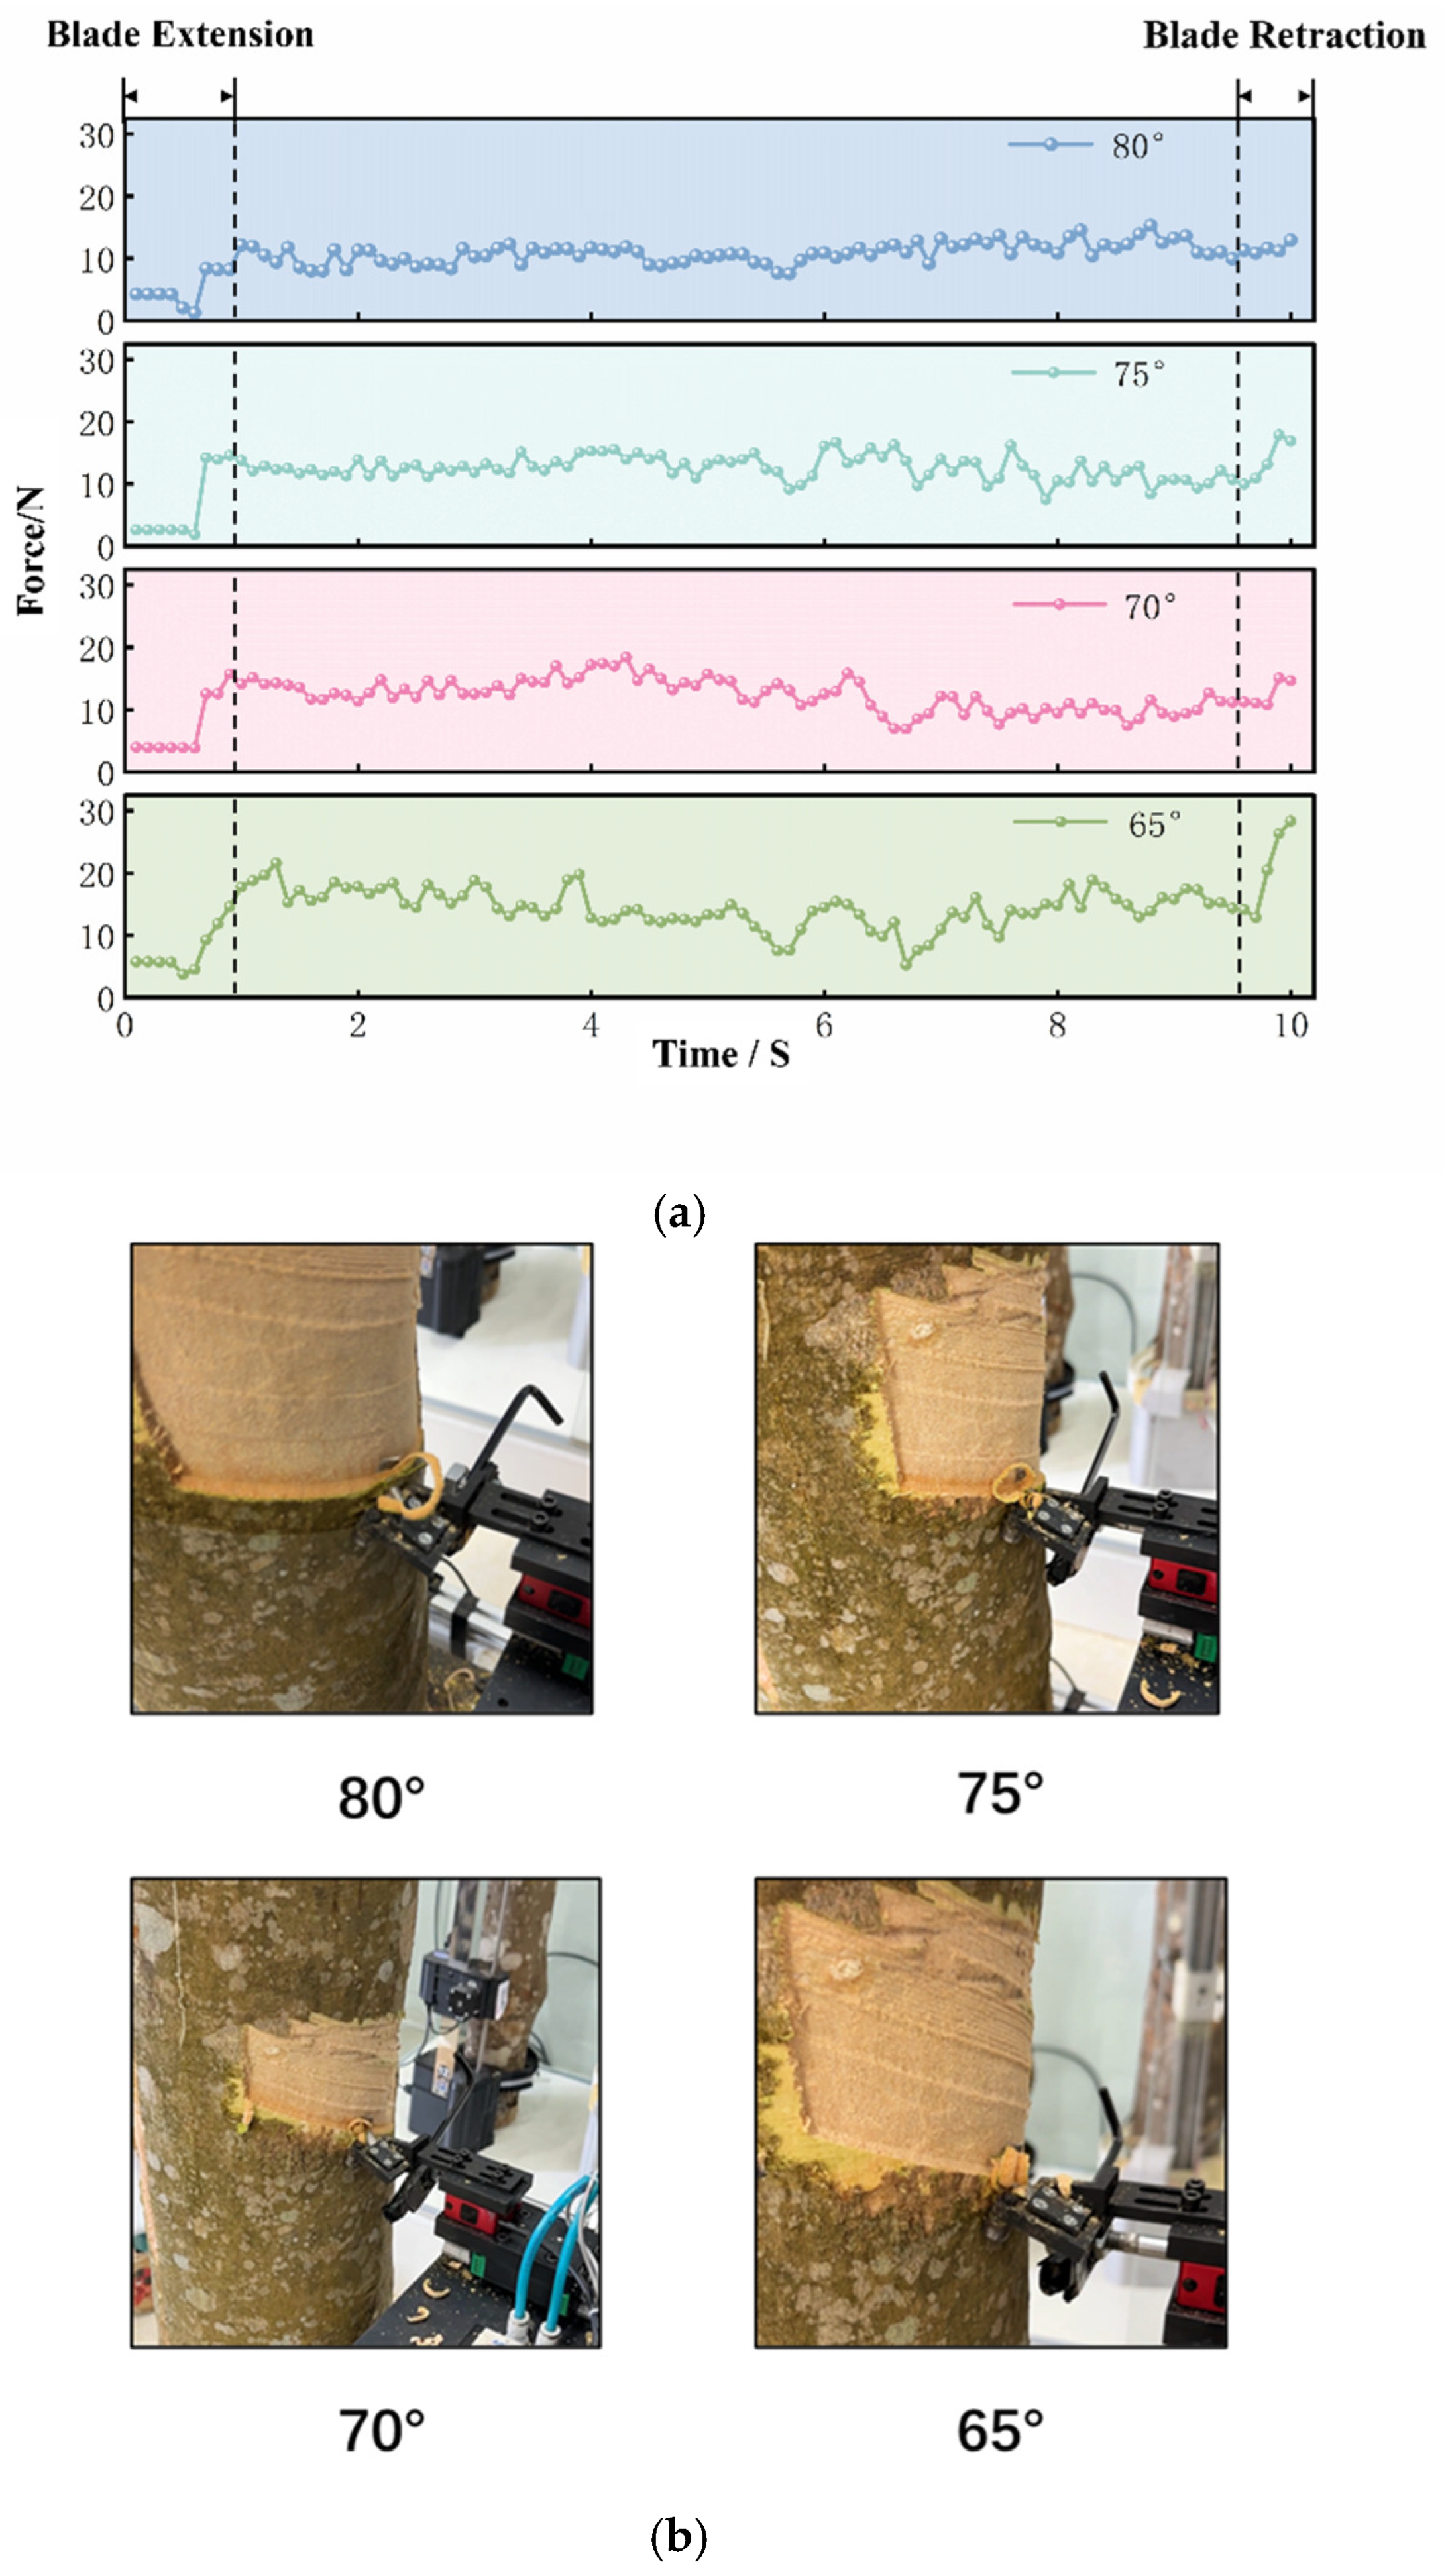
As shown in Figure 9a, the diagram illustrates the force analysis of the blade in the X-direction and the curling behavior of wood chips during cutting at various blade bending angles. The entire rubber tapping process is divided into three stages: blade extension, cutting, and blade retraction.
Figure 9 analyzes the correlation between the cutting blade’s bending angle and the cutting performance, detailing the force patterns in the X-direction and the corresponding wood chip morphology. The entire process comprises blade extension, cutting, and retraction stages, with the cutting stage being the primary focus. Analysis of the four angles reveals a clear trend: as the angle decreases from 80° to 65°, cutting stability deteriorates systematically.
The blade with an 80° bending angle demonstrated optimal performance. It produced minimal wood chip curling as shown in Figure 9b, with the most stable force fluctuation ranging from 7.53 N to 18.32 N, resulting in smooth, continuous chips. At 75°, chip curling increased, but force fluctuation remained relatively small at 7.49 N to 16.7 N, maintaining chip continuity. Performance declined notably at 70°, with greater curling, more significant force fluctuations from 6.9 N to 16.7 N, and increased chip breakage. The poorest performance was at 65°, which exhibited the most severe chip curling and fragmentation, coupled with the widest force range from 5.26 N to 21.6 N, indicating intense blade instability.
This analysis establishes that larger bending angles of 75° to 80° ensure stable cutting and superior chip formation, while smaller angles of 65° to 70° induce progressive instability.

3.1.2. Experimental Results of Single-Factor Test on Cutting Angle

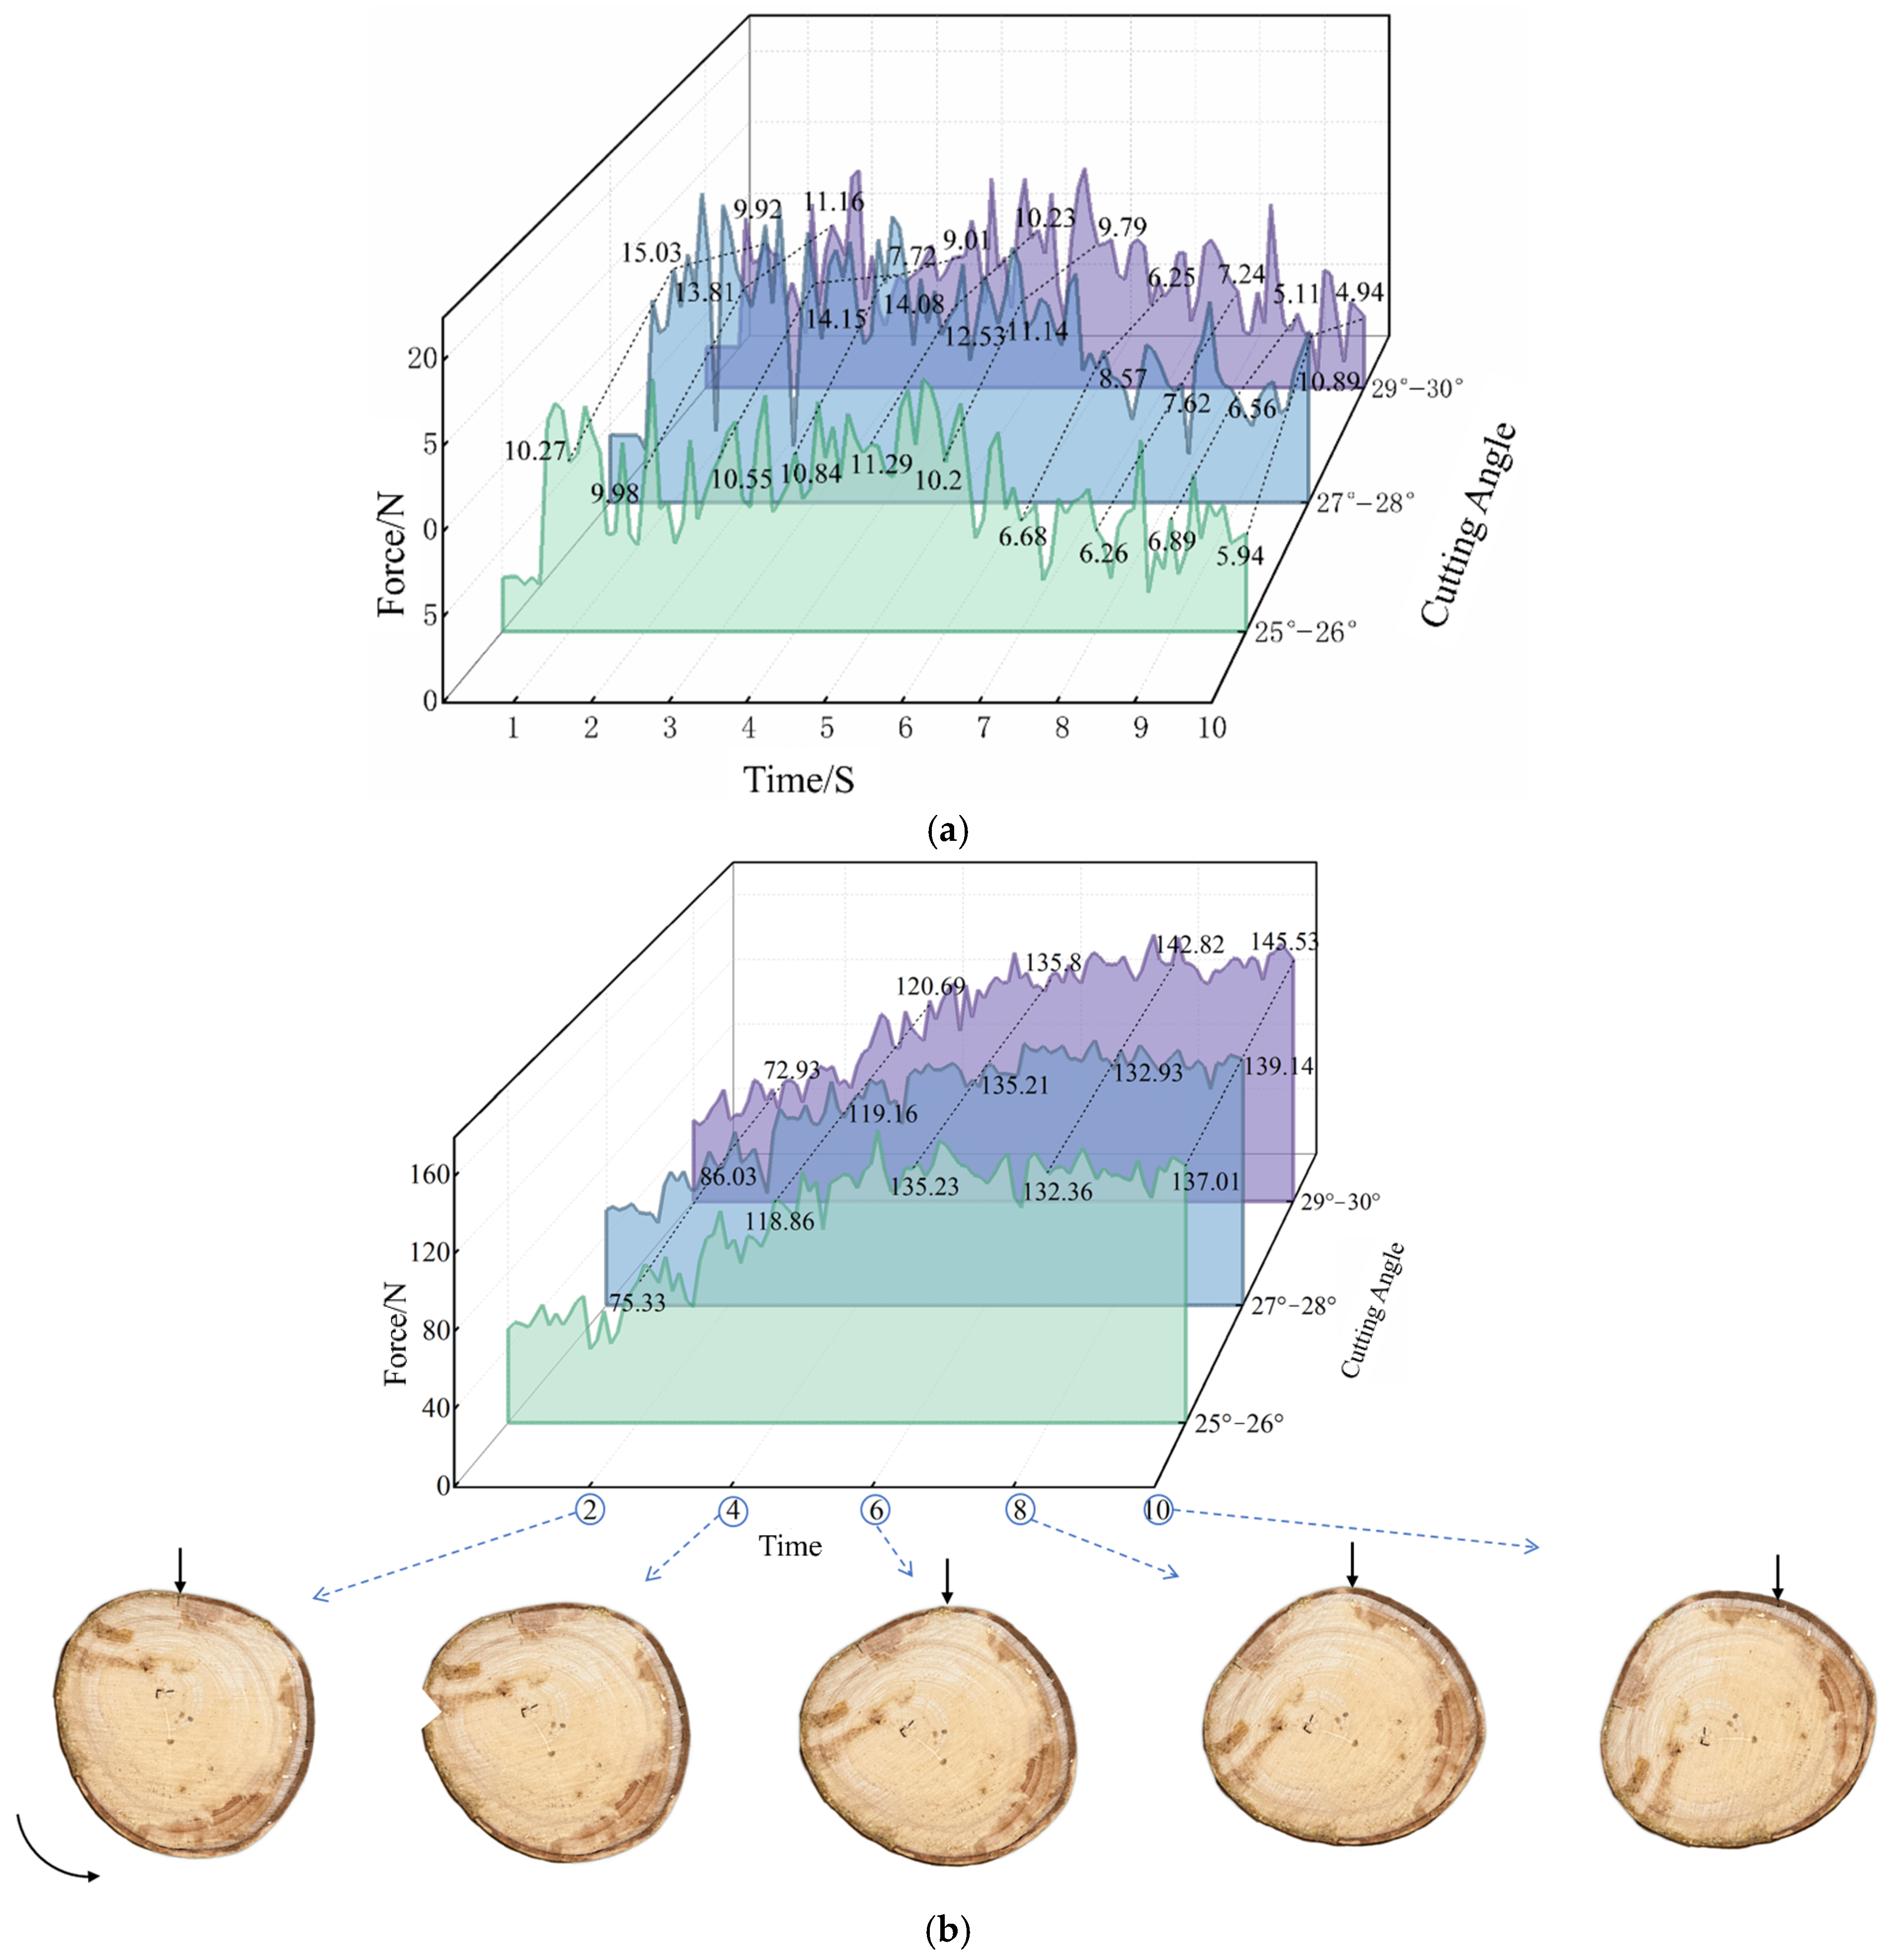
As shown in Figure 10a, this is the force analysis diagram of the blade in the X-direction under different cutting angles. As indicated in the diagram, the force on the blade shows a trend of first increasing and then decreasing with the increase in the cutting angle, and reaches the maximum when the cutting angle is between 27–28°.
When the cutting angle is in the range of 25–26°, the maximum force acting on the blade in the X-direction during the cutting process is 15.31 N; when the cutting angle is between 27° and 28°, the maximum force on the blade in the X-direction during cutting is 19.92 N; when the cutting angle is in the range of 28–29°, the maximum force on the blade in the X-direction is 15.04 N.
As shown in Figure 10b, the force in the Z-direction gradually increases over time. The figure illustrates the state of the rubber tree selected for this experiment after being cut by the blade at different time points. During the time interval from 0 to 10 S, when the blade moves over the convex part of the rubber tree, the profiling device begins to operate: the spring is compressed, the blade moves along the Z-axis, and the force in the Z-direction increases progressively.

3.1.3. Experimental Results of Single-Factor Test on Cutting Blade Attitude Angle

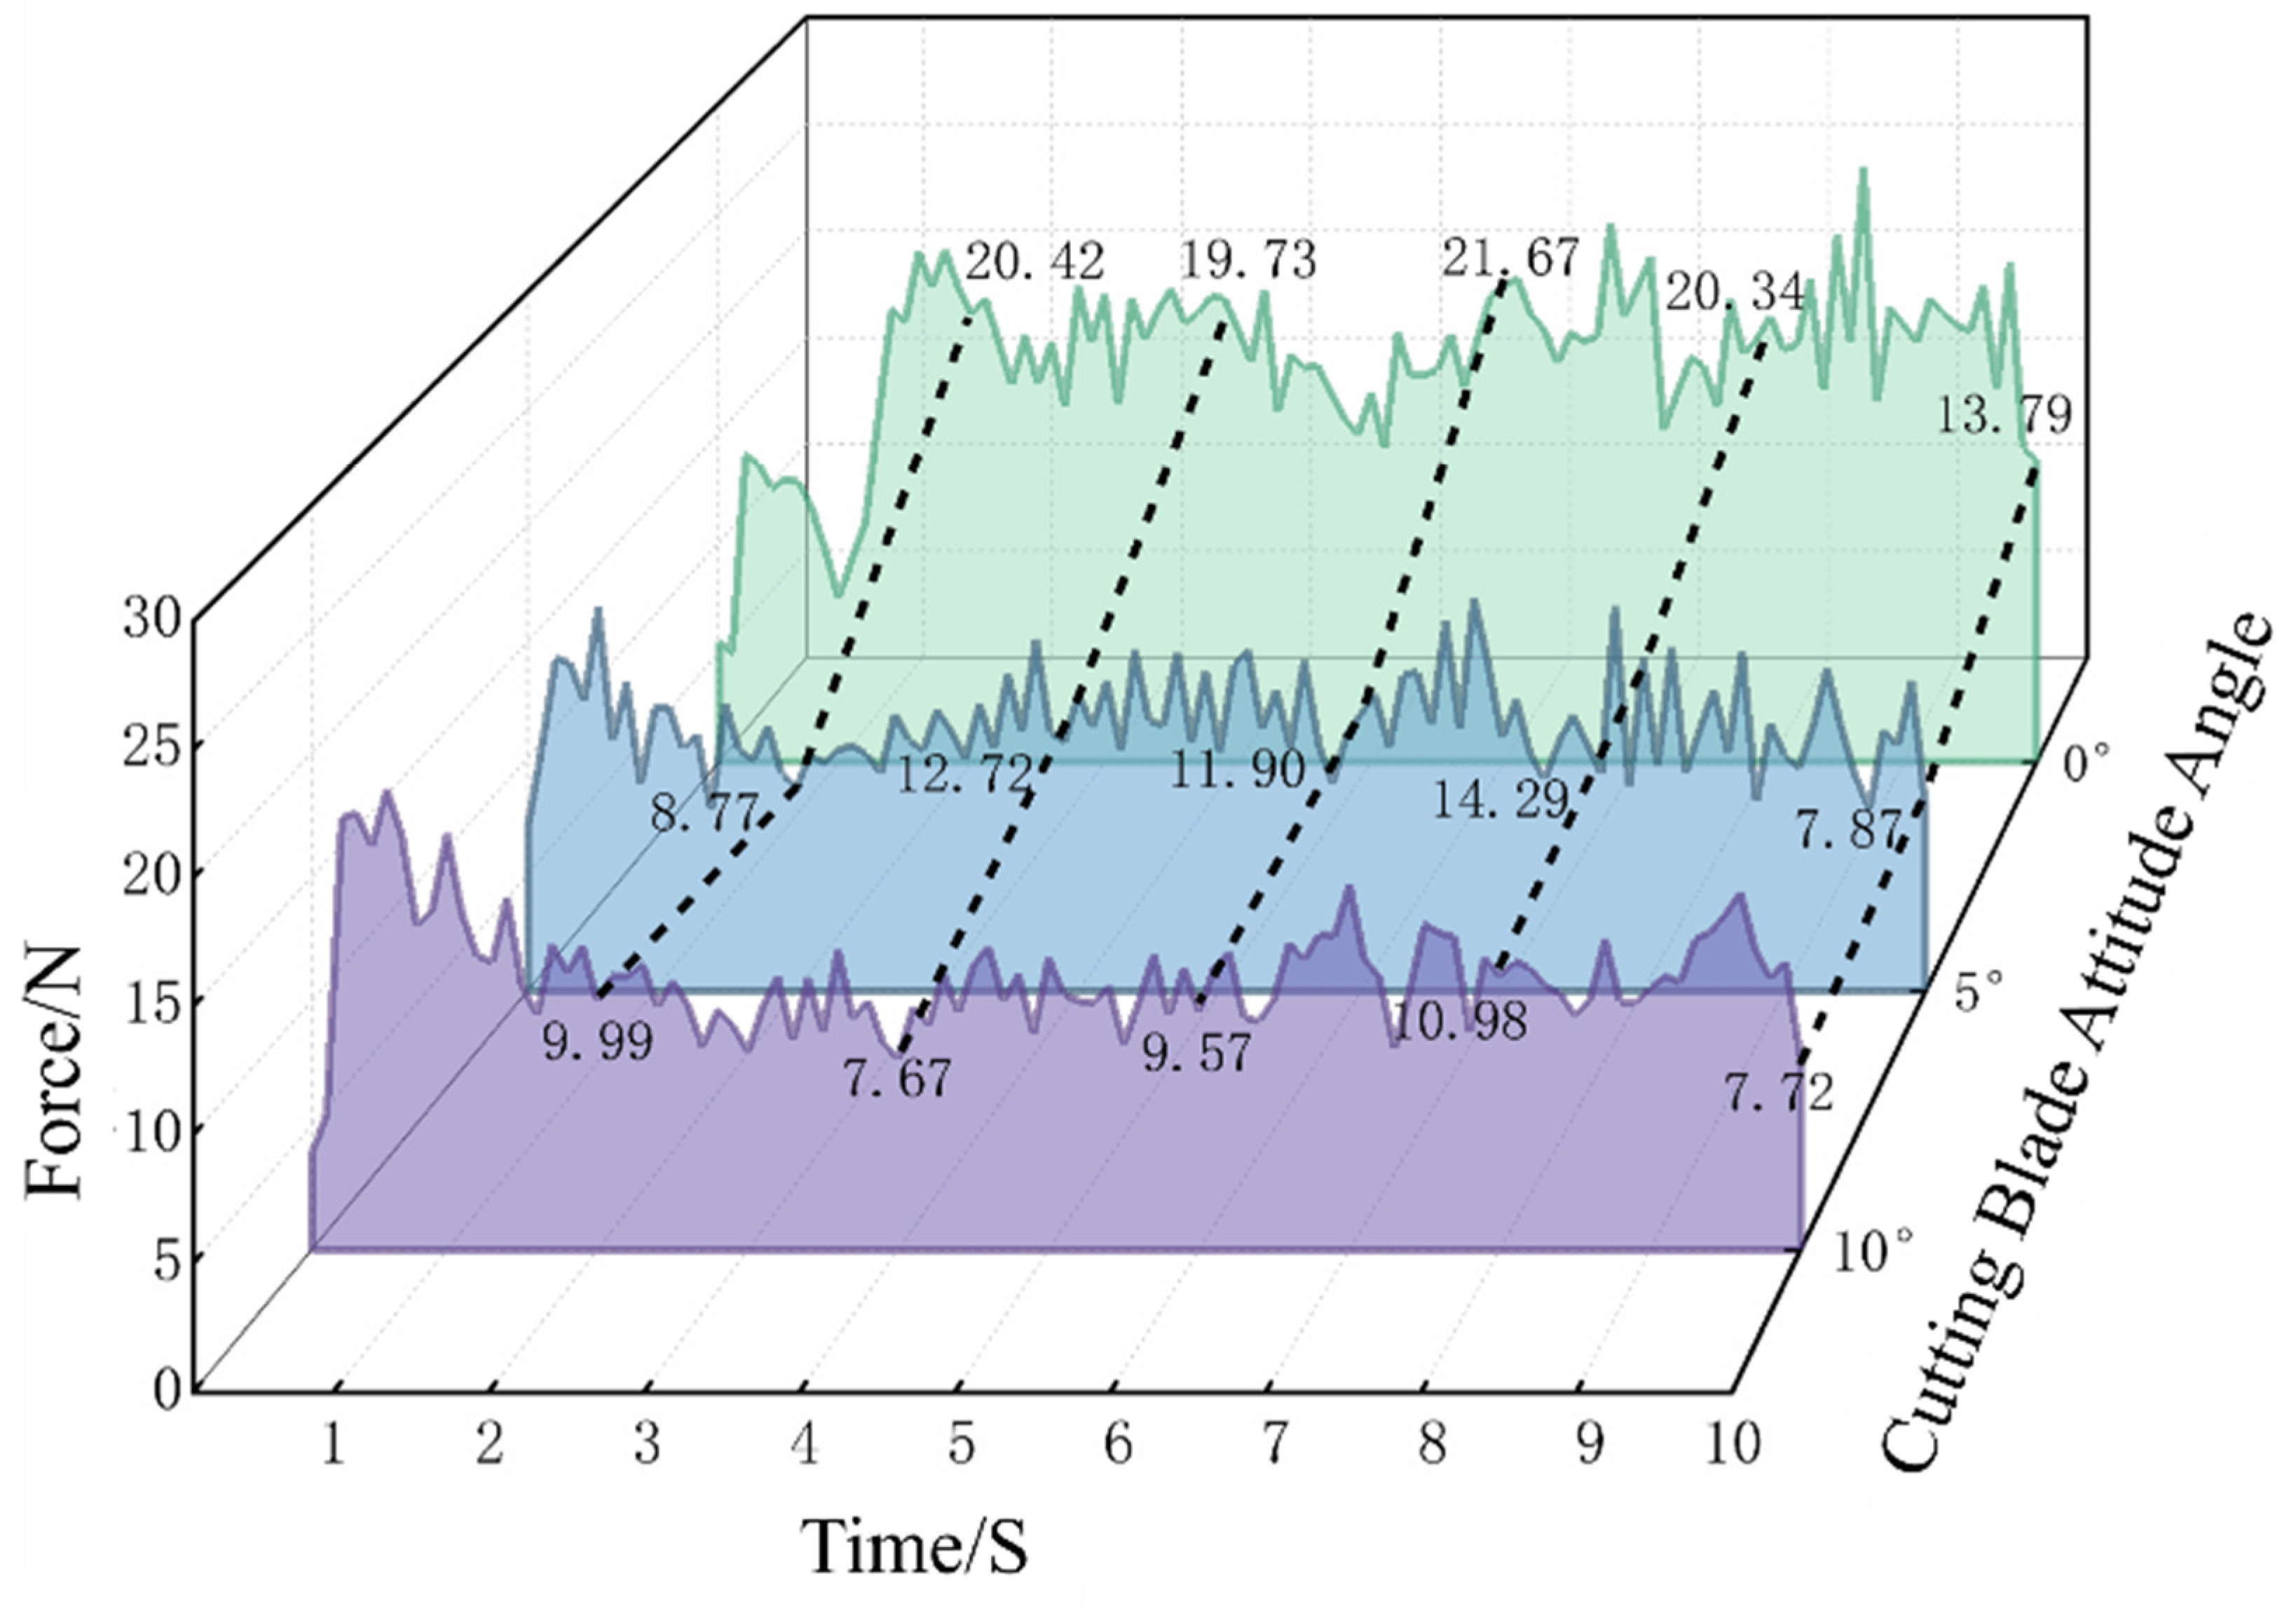
As shown in Figure 11, this is the force condition of the blade in the X-direction under different poses. As indicated in the figure, the force on the blade decreases as the Cutting Blade Attitude Angle increases.
When the angle between the blade and the vertical plane of the rubber tree is 0°, the cutting force of the blade in the X-axis direction is the largest, and the cutting force fluctuates significantly during cutting, accompanied by a severe blade jumping phenomenon, which results in an uneven cutting surface. When the angle between the blade and the vertical plane of the rubber tree is 7°, the cutting force is significantly smaller than that at 0°, the force fluctuation during cutting is also gentler, and the cutting surface is relatively flat. When the angle between the blade and the vertical plane of the rubber tree is 10°, the cutting force in the X-axis direction is the smallest, and the force fluctuation is also the smallest.
Due to the large variation in cutting force during the rubber tapping process, which does not conform to a normal distribution, the Kruskal-Wallis H test was performed using SPSS 26 software developed by IBM Corporation in the United States. The test result shows that p < 0.0001, indicating that the Cutting Blade Attitude Angle has an extremely significant impact on the force of the blade in the X-direction. When the Cutting Blade Attitude Angle is 0°, the force range of the blade in the X-direction during cutting is 7.49 N–27.14 N. When the Cutting Blade Attitude Angle is 5°, the force range of the blade in the X-direction during cutting is 7.75 N–16.89 N. When the Cutting Blade Attitude Angle is 10°, the force range of the blade in the X-direction during cutting is 7.67 N–18.54 N. The post hoc LSD tests for the Cutting Blade Attitude Angle (0°, 5°, and 10°) revealed statistically significant differences between all pairs. Specifically, extremely significant differences (p < 0.001) were found between 0° and 5° and between 0° and 10°. A significant difference was also identified between 5° and 10° (p < 0.047).

3.2. Result Analysis

3.2.1. Analysis of Experimental Results

As shown in Table 3 and Table 4, the results of the provided Analysis of Variance indicate that the model established based on the influencing factors of cutting force and flatness is overall significant (p1 < 0.0001, p2 = 0.0050), which means the model can well explain the impact of factors on the response variables. The lack-of-fit test for residuals is not significant, indicating that the model has a good fit and no systematic deviation occurs.
For the cutting force, among all factors, the Cutting Blade Attitude Angle (C) has the most significant impact on the response variable, with the largest sum of squares, indicating that this factor is the dominant one. Both the Cutting Angle (A) and Cutting Blade Bending Angle (B) also have significant impacts, but their degrees of influence are smaller compared to the Cutting Blade Attitude Angle.
The interaction terms AB and AC are both significant, which means there are synergistic effects between Cutting Angle and Blade Angle, as well as between Cutting Angle and Cutting Blade Attitude Angle. However, the interaction term BC is not significant. The terms A2 and B2 are significant, indicating that Cutting Angle and Blade Angle have obvious nonlinear effects on the response variable, and their variation trends may exhibit parabolic characteristics; the term C2 is not significant, suggesting that the impact of the Cutting Blade Attitude Angle is closer to a linear relationship.
In summary, the key factors affecting the cutting force in this experiment are, in order, the Cutting Blade Attitude Angle, the Cutting Angle, and the Cutting Blade Bending Angle. Furthermore, the interaction effects between the Cutting Angle and the Cutting Blade Bending Angle, as well as between the Cutting Angle and the Cutting Blade Attitude Angle, cannot be ignored.
For flatness, at the main effect level, only the Cutting Angle (A) has a significant impact on flatness, while the individual effects of the Cutting Blade Bending Angle (B) (blade angle) and Cutting Blade Attitude Angle (C) are not significant. The interaction effect of BC is extremely significant, which means that the effect of B on flatness is highly dependent on the value of C, and vice versa. The interaction effect of AB also reaches a significant level, indicating that the two need to be optimized synergistically. The interaction effect of AC is relatively weak and close to significant. Both C2 and B2 are highly significant, which indicates that there exists a specific parameter combination of B and C that optimizes flatness. The effect of A2 is not significant.
The quadratic regression models for cutting force and flatness, with insignificant terms removed, are as follows:
F = 21.08 + 1.78A + 1.24B − 4.24C − 1.42AB − 2.00AC − 2.54A2 − 2.96B2
V = 4.43 − 0.6697A + 0.8087AB − 1.33BC + 0.9848B2 + 1.17C2

3.2.2. Analysis of Model Interaction Terms

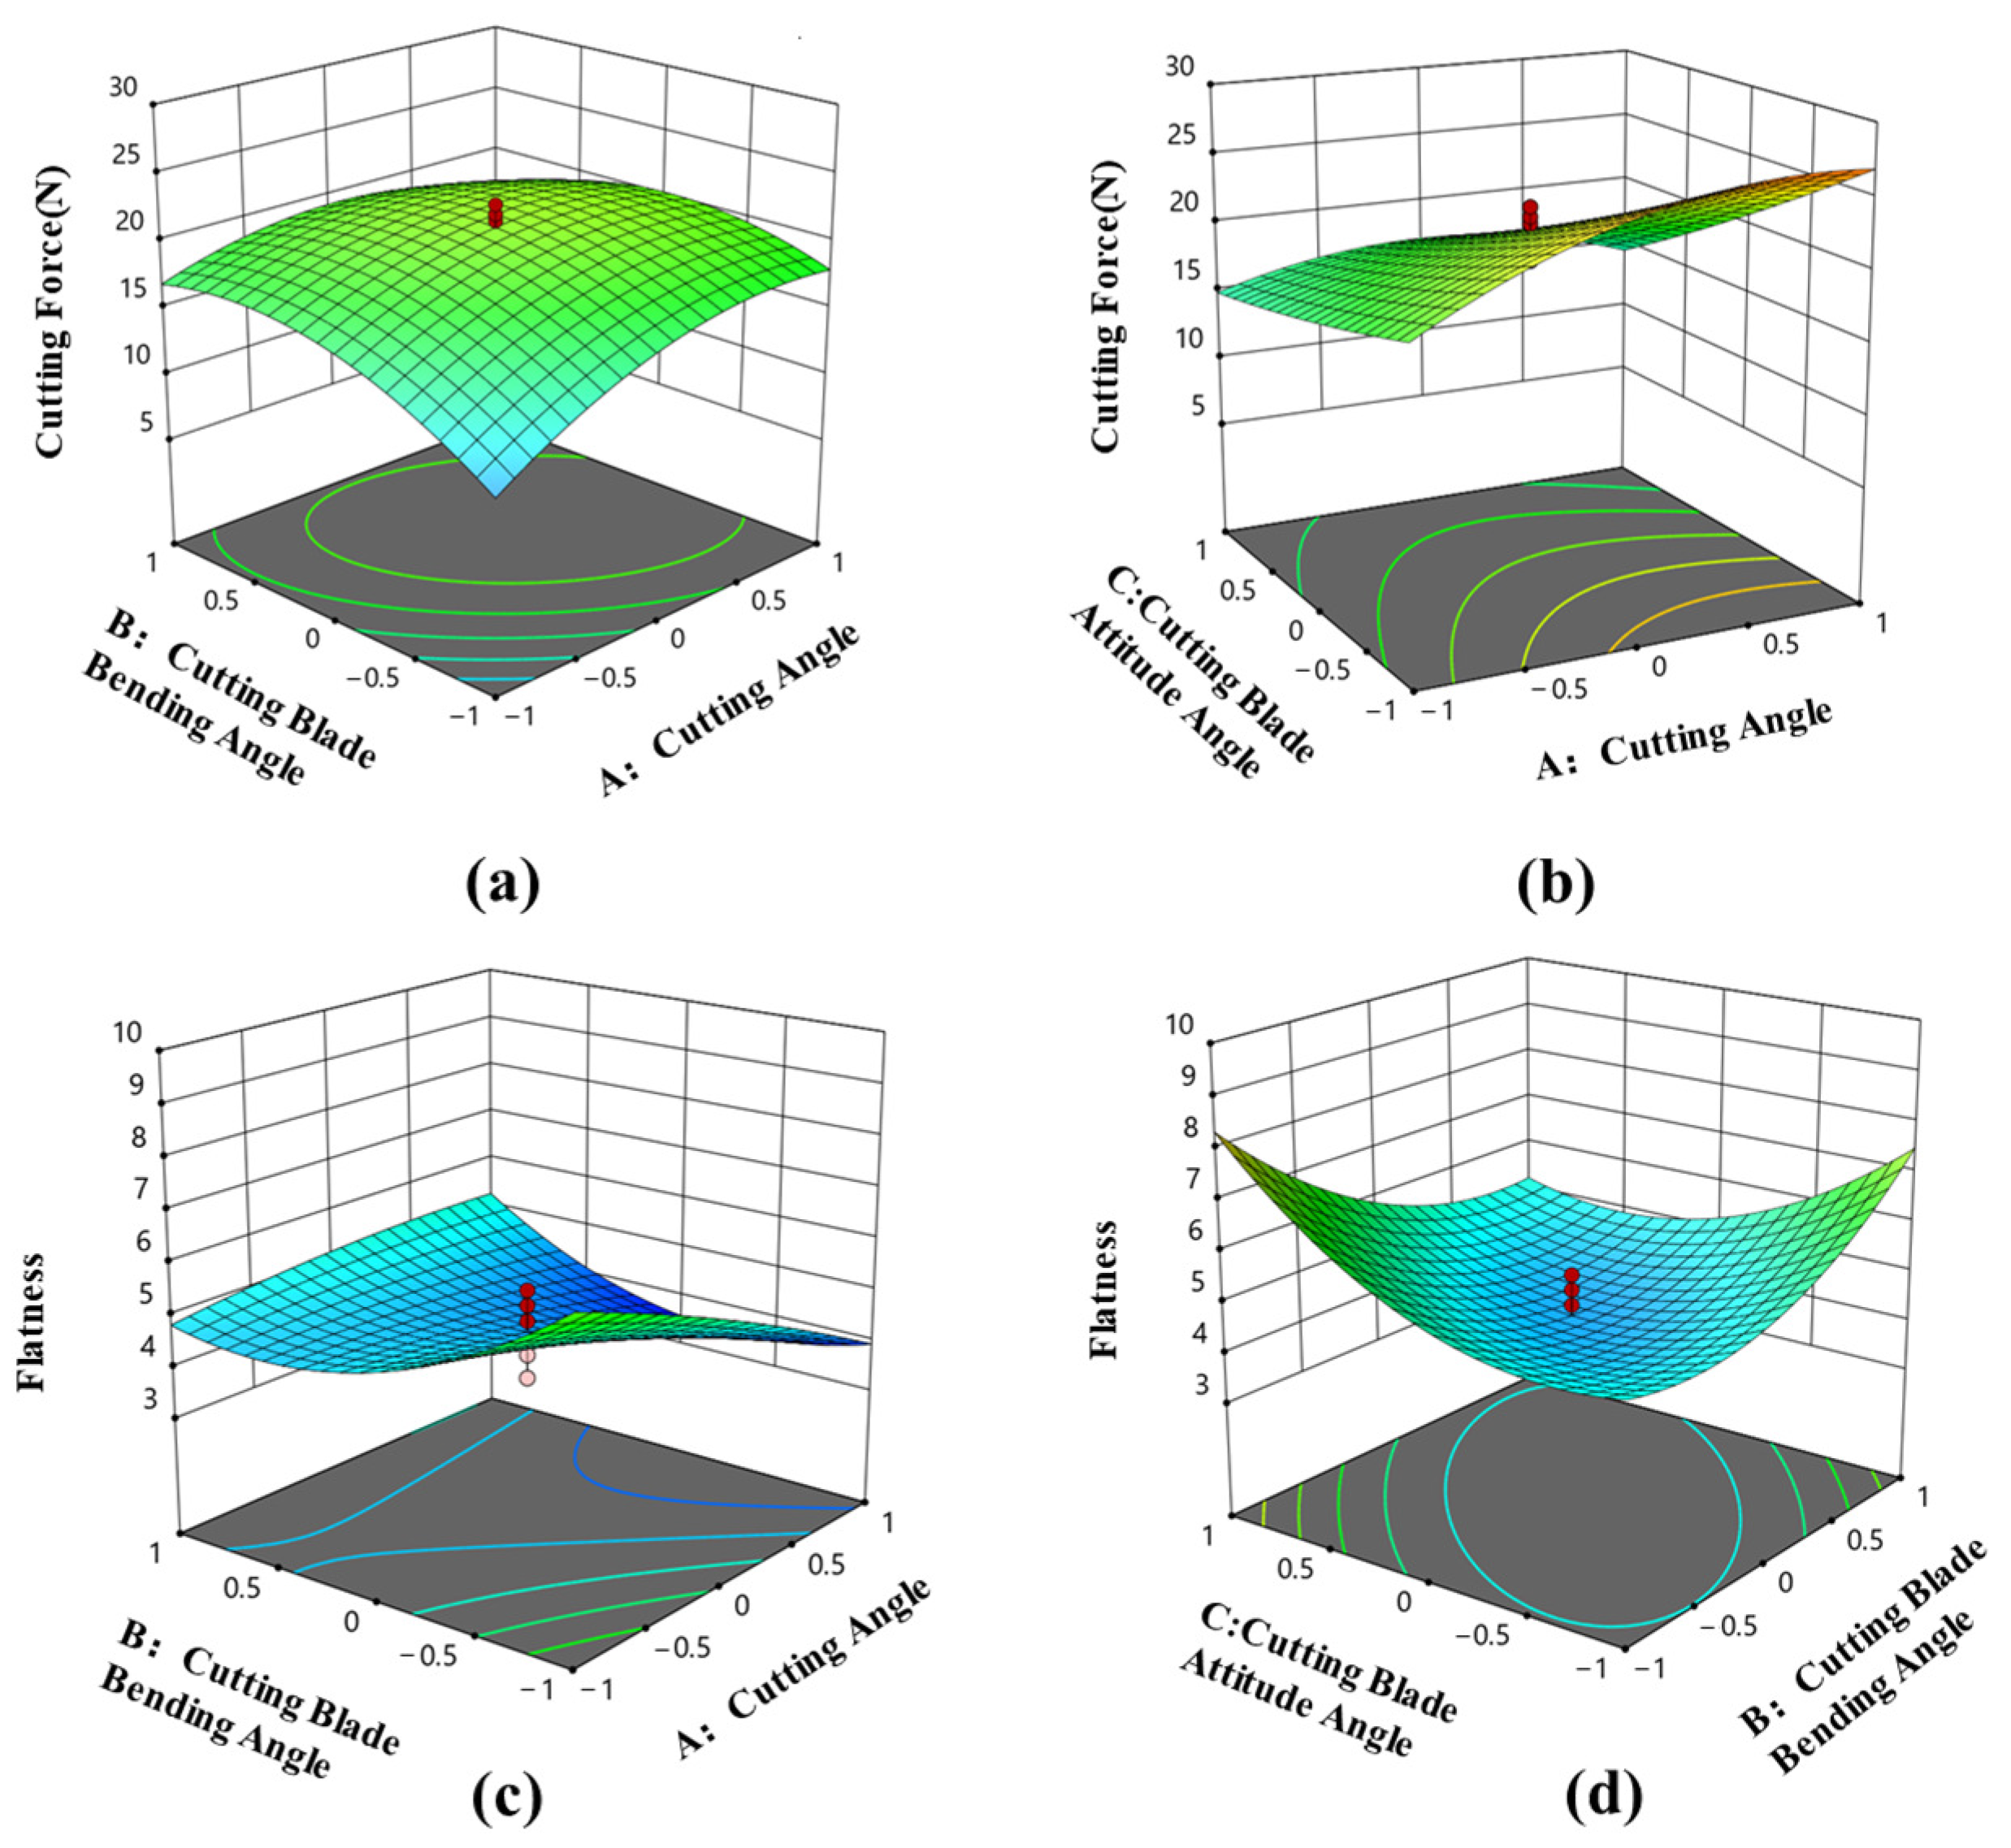
Based on the quadratic regression model, response surface plots were generated. The shape of the response surface indicates the relationship between the interaction intensity of these factors and the cutting force as well as the flatness.
As can be seen from the response surface plot in Figure 12a, the cutting force decreases with the increase in the Cutting Angle and the Cutting Blade Bending Angle, and the plot also shows the interaction effect of the Cutting Angle (A) and the Cutting Blade Bending Angle (B) on the cutting force. The contour lines of the response surface are elliptical, indicating a significant interaction between the Cutting Angle and the Cutting Blade Bending Angle. The surface shows an obvious convex shape, which verifies that the quadratic terms of both the Cutting Angle and the Cutting Blade Bending Angle are significant. The cutting force reaches its maximum value when both the Cutting Angle and the Cutting Blade Bending Angle are at the low level (−1), which means that a smaller Cutting Angle and Cutting Blade Bending Angle will increase the cutting force. The coefficient of the AB interaction term is negative, indicating that increasing both the Cutting Angle and the Cutting Blade Bending Angle simultaneously will synergistically reduce the cutting force. The trend of the response surface shows that the impact of the Cutting Angle on the cutting force is greater than that of the Cutting Blade Bending Angle.
As can be seen from the response surface plot in Figure 12b, the cutting force decreases as the Cutting Angle and Cutting Blade Attitude Angle increase, and the plot also shows the interaction effect of the Cutting Angle (A) and Cutting Blade Attitude Angle (C) on the cutting force. The response surface has a twisted shape, and its contour plot exhibits a hyperbolic pattern—this is a typical characteristic of the existence of a significant interaction effect. This indicates that the degree of impact of the Cutting Angle on the cutting force is affected by the value of the Cutting Blade Attitude Angle. When the Cutting Angle and Cutting Blade Attitude Angle change simultaneously toward the high level (+1) or low level (−1), a synergistic effect is produced, leading to a further decrease in the cutting force. The trend of the response surface shows that the Cutting Blade Attitude Angle is the most critical parameter for controlling the cutting force, and its impact intensity is far greater than that of the Cutting Angle and Cutting Blade Bending Angle.
As can be seen from the response surface plot in Figure 12c, the flatness decreases as the value of the Cutting Angle (A) increases, while it first decreases and then increases as the Cutting Blade Bending Angle (B, bending angle) changes. The plot also shows the interaction effect of the Cutting Angle (A) and the Cutting Blade Bending Angle (B) on flatness. When the Cutting Angle and the Cutting Blade Bending Angle are both at a high level or both at a low level, they act synergistically to jointly increase the flatness value. The lowest flatness occurs in the region where the Cutting Angle is at a high level and the Cutting Blade Bending Angle is at a medium-to-low level. The trend of the response surface indicates that the impact of the Cutting Angle on flatness is much greater than that of the Cutting Blade Bending Angle. The trend of the response surface indicates that the impact of the Cutting Angle on flatness is greater than that of the Cutting Blade Bending Angle.
As can be seen from the response surface plot in Figure 12d, the flatness illustrates the interaction effect of the Cutting Blade Bending Angle and the Cutting Blade Attitude Angle on flatness. The independent effects of the Cutting Blade Bending Angle and the Cutting Blade Attitude Angle on flatness are not significant; however, there is a significant antagonistic effect between them. This response surface exhibits a typical saddle shape. When the levels of the Cutting Blade Bending Angle and the Cutting Blade Attitude Angle increase or decrease simultaneously, the flatness value will decrease. Therefore, in the process of optimizing flatness, the Cutting Blade Bending Angle and the Cutting Blade Attitude Angle must be regarded as a coupled system for synergistic regulation, rather than adjusted independently.

3.2.3. Comparative Analysis of Rubber Tapping Chip Morphology Under Optimal Tapping Parameters

To improve rubber tapping quality—reducing the cutting force while enhancing flatness—Design-Expert software was used to optimize the regression equations of experimental factors and performance indicators. The optimal parameters are as follows: a cutting angle of 30°, a cutting blade bending angle of 80°, and a cutting blade attitude angle of 10°. Corresponding to these parameters, the cutting force is 10.94 N and the flatness is 5.39.
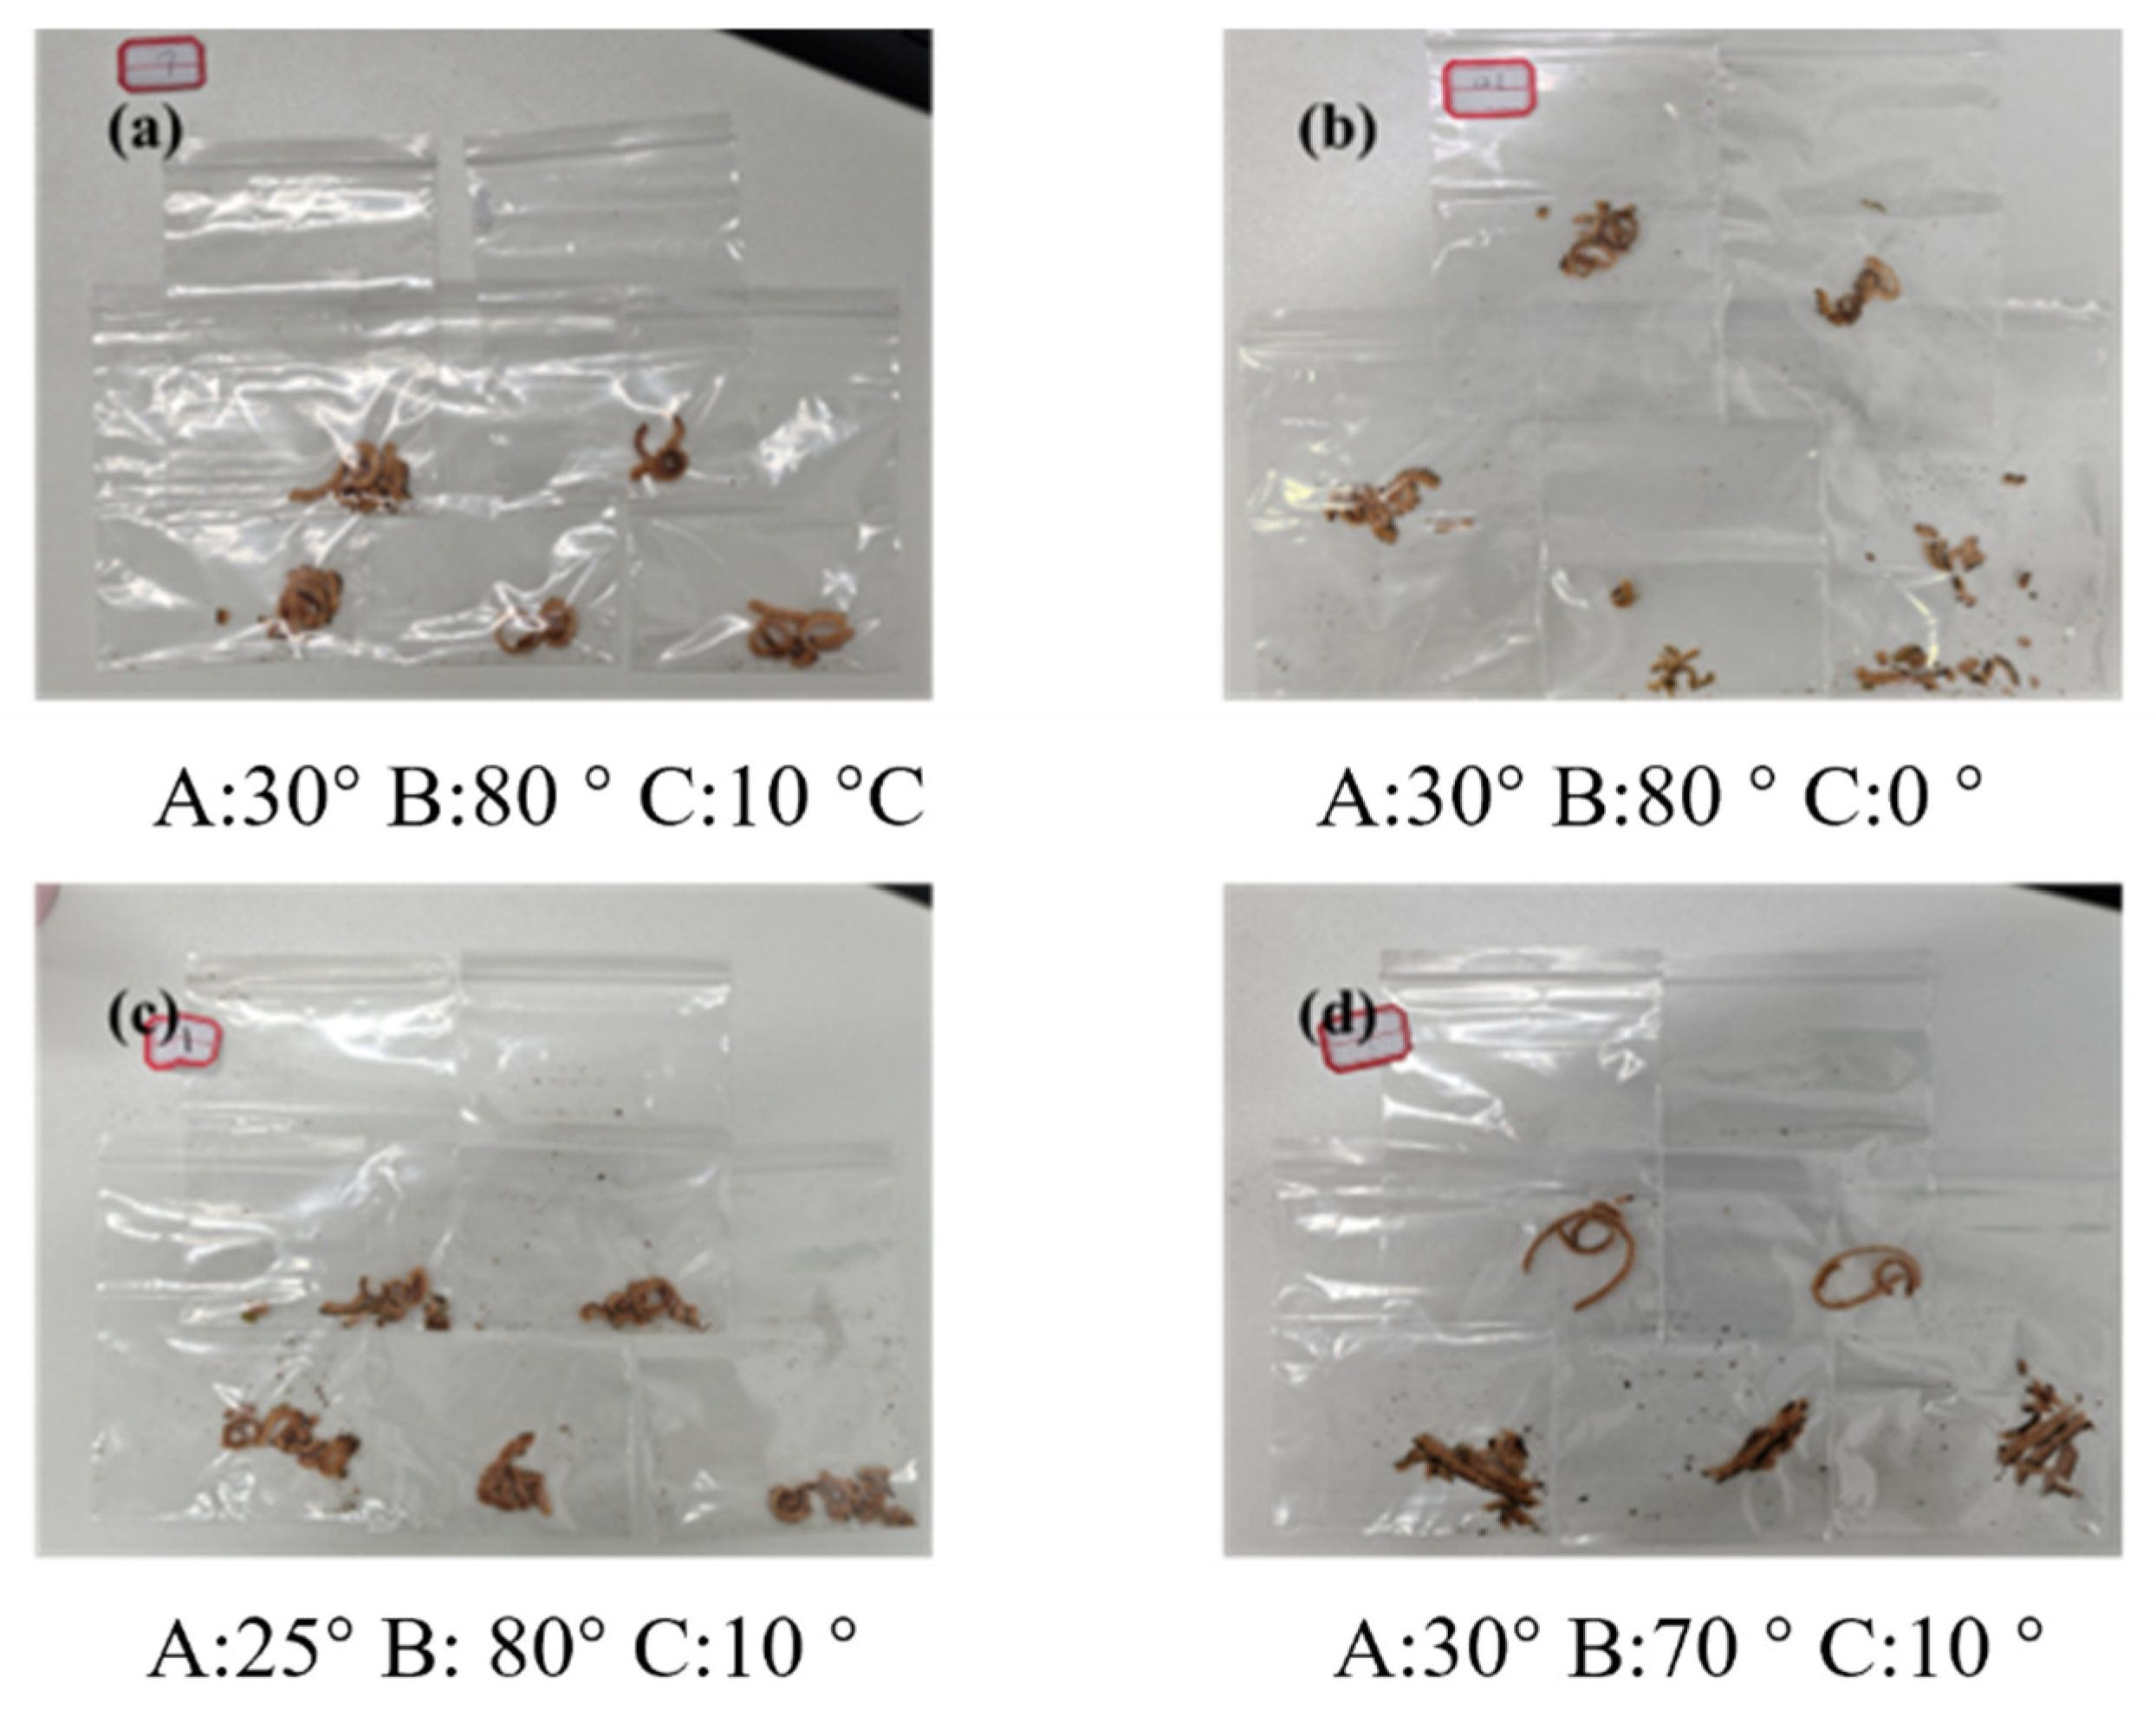
Figure 13a shows the rubber tapping effect under the optimal parameters: the tapping chips are continuous without fine broken chips, and the cutting trajectory is smooth. This highly matches the performance indicators of “low tapping force and high flatness” under these parameters, verifying the effectiveness of the optimal parameter combination. Figure 13b presents the comparison results when only deviating from the optimal attitude angle: it is observed that the tapping chips from all five cutting groups under this parameter are fine and fragmented with poor continuity, accompanied by a significant increase in tapping force. This indicates that the deviation of the attitude angle disrupts the dynamic contact balance between the blade and the bark, leading to intensified fluctuations in cutting load. Figure 13c shows the test results when only reducing the cutting angle (below the optimal value of 30°): compared with Figure 13a, the frequency of chip breakage increases significantly. This reflects that when the cutting angle is insufficient, the shearing effect of the blade on the bark weakens while the squeezing effect strengthens, thereby reducing cutting stability. Figure 13d displays the comparison effect when only adjusting the bending angle: although the tapping force is slightly lower than that in Figure 13a and the chips are in a straight strip shape, obvious fragmentation still exists. This suggests that the bending angle has independent effects on the regulation of tapping force and chip morphology—adjusting the bending angle can optimize the tapping force to a certain extent, but cannot independently improve the continuity of tapping chips.
The above comparison results show that only when the cutting angle, bending angle, and attitude angle are simultaneously in the optimal combination (30°, 80°, 10°) can the ideal rubber tapping requirements of “continuous chips, low tapping force, and high flatness” be met simultaneously. Any deviation of a single parameter from its optimal value will cause varying degrees of deterioration in tapping performance, which further confirms the necessity of multi-objective optimization for rubber tapping parameter optimization.

4. Conclusions

(1) In this experiment, a force sensor was used as the detection tool, and a rubber tapping mechanical test bench was designed, which is composed of a linear module and a rotating module working in coordination. This test bench has the functions of blade feeding, profile-following cutting, blade retracting, adjusting the blade attitude, and changing the cutting speed, based on which mechanical tests were carried out.
(2) The cutting blade bending angle (bending angle) has a significant impact on the formation morphology of wood chips. As the bending angle decreases, the degree of wood chip curling increases, the continuity becomes worse, the force fluctuation in the X-direction during the cutting process becomes larger, the cutting surface becomes less smooth, and the blade skipping phenomenon becomes significant.
When the blade operates at different cutting angles, within the range of 25–30°, as the cutting angle increases, the cutting force first increases and then decreases. When the cutting angle is between 27° and 28°, the rubber tapping force in the X-direction reaches its maximum.
During the rubber tapping process, the uneven surface of the rubber tree causes significant changes in the force acting on the blade in the Z-direction during the profile-following process. When the blade moves to a relatively convex part of the rubber tree, the force received in the Z-axis direction increases significantly.
There is an extremely significant difference between the blade force condition and the attitude angle around the X-axis (p < 0.0001). As the blade attitude angle decreases, the cutting force acting on the blade in the X-direction increases significantly. Therefore, under the condition of ensuring no glue overflow, the larger the blade attitude angle, the better.
(3) A three-factor, three-level experiment was designed using the Central Composite Design method, and tests were conducted on the custom-designed rubber tapping mechanical test bench. The analysis revealed that, among the factors influencing the cutting force, the order of influence (from strongest to weakest) is as follows: cutting blade attitude angle (C), cutting angle (A), and cutting blade bending angle (B). For flatness, the order of influence (from strongest to weakest) is cutting angle (A), cutting blade bending angle (B), and cutting blade attitude angle (C). Furthermore, quadratic polynomial regression models were developed to represent the relationships between cutting force/flatness and the three factors (cutting blade attitude angle, cutting angle, and cutting blade bending angle). The results indicate that the optimal coordination between cutting force and chip condition occurs when the cutting angle is 30°, the cutting blade bending angle is 80°, and the cutting blade attitude angle is 10°. The cutting parameters optimized for cutting force magnitude and chip smoothness in this experiment offer valuable insights for the future development of automatic rubber tapping machines.
Limitations. A limitation of this study is the 10 Hz force sampling rate, which precludes direct observation of vibrations in the tens-to-hundreds-of-hertz range and may allow aliasing of higher-frequency content. Accordingly, our stability assessment pertains to low-frequency (quasi-static) behavior and its correlation with chip morphology, rather than chatter dynamics.

Author Contributions

Conceptualization, Q.H., Y.L., X.W., J.L. and X.Z.; methodology, Q.H. and X.W.; software, Q.H. and X.W.; validation, Y.L., J.L. and X.Z.; investigation, Q.H. and X.W.; writing—original draft preparation, Q.H. and Y.L.; writing—review and editing, Q.H., Y.L., X.W. and J.L.; formal analysis, Q.H. and X.W.; investigation, Y.L.; supervision, Q.H., Y.L. and X.Z.; project administration, X.Z. and Y.L.; funding acquisition, X.Z. All authors have read and agreed to the published version of the manuscript.

Funding

The work was supported by the National Natural Science Foundation of China (Grant No. 32501799; No. U23A20176), Key Research and Development Project of Hainan Province (Grant No. ZDYF2025XDNY127), Yunnan Province’s Science and Technology Challenge Program Projects (Grant No. 202504BW050005), Hainan Provincial Science and Technology Talent Innovation Project (Grant No. KJRC2023C04), Hainan Province Academician Innovation Platform Research (Grant No. YSPTZX202109).

Institutional Review Board Statement

Not applicable.

Data Availability Statement

The data reported in this study are contained within the article.

Conflicts of Interest

The authors declare no conflicts of interest.

References

  1. Hao, L.; Guoxiong, Z.; Xiangjun, W.; Huaiqing, Z. Fine segmentation and structural parameter extraction of rubber tree point cloud based on LiDAR using the TMGH method. Comput. Electron. Agric. 2025, 239, 110950. [Google Scholar] [CrossRef]
  2. Baudoin, M.; Liengprayoon, S.; Khaeduang, T.; Paboeuf, G.; Musigamart, N.; Jantarasunthorn, S.; Lerksamran, T.; Chantuma, P.; Char, C.; Geniez, M.; et al. Impact of size and biochemical composition of rubber particles on their interfacial behavior using two Hevea brasiliensis genotypes. Surf. Interfaces 2025, 67, 106622. [Google Scholar] [CrossRef]
  3. Zhang, H.L.; Li, W.X.; He, J.J.; Luo, P. Development status and prospects of understory planting-breeding models in rubber plantations of China. J. Trop. Biol. 2022, 13, 88–94. [Google Scholar] [CrossRef]
  4. Liu, H.; Tan, S.; Yuan, B.; Fang, F.; He, M.; Wang, M.; Wan, R.; Chen, J.; Hui, S.; Wang, X. Differential accumulation of coronatine-induced protein correlates with secondary laticifer proliferation in vascular cambia of phloem tissues in the Hevea rubber tree. Ind. Crops Prod. 2025, 235, 121742. [Google Scholar] [CrossRef]
  5. Wan, J.; Fan, R.; Yang, W.; Wei, F.; Gao, H.; Wei, H.; Qiu, J. New insights into ethylene-induced latex flow in a dose-dependent manner in rubber tree. Ind. Crops Prod. 2024, 222, 120012. [Google Scholar] [CrossRef]
  6. Nunes, F.M.; Silva, A.L.E.; May, J.; Szarblewski, M.d.S.; Flemming, L.; Assmann, E.E.; Moraes, J.A.R.; Machado, Ê.L. Environmental impacts associated with the life cycle of natural rubbers: A review and scientometric analysis. Ind. Crops Prod. 2025, 224, 120350. [Google Scholar] [CrossRef]
  7. Hayichelaeh, C.; Boonkerd, K. Enhancing the tire performances of truck tire tread based on rubber compounds containing biobased processing oil by adjusting sulfur contents. Ind. Crops Prod. 2024, 224, 120451. [Google Scholar] [CrossRef]
  8. Zhang, C.; Sheng, X.; Zhang, S.; Gao, J.; Yuan, T.; Zhang, J.; Li, W. Experimental study on influencing factors of cutting power consumption for mechanized natural rubber tapping. Trans. Chin. Soc. Agric. Eng. 2018, 34, 32–37. [Google Scholar] [CrossRef]
  9. Gao, J.; Cheng, H. Rubber trees changing the world: 150 years. Sci. China Life Sci. 2024, 67, 1744–1751. [Google Scholar] [CrossRef]
  10. Kum-Ourm, H.; Liengprayoon, S.; Onozuka, N.; Vaysse, L.; Tarachiwin, L.; Lacote, R.; Chaiyut, J.; Jantarasunthorn, S.; Lerksamram, T.; Cakpo, C.B.; et al. Reduction of tapping frequency associated with stimulation of two Hevea brasiliensis clones in Thai non-traditional rubber area. 1. Effect on production, biochemical composition and particle size of latex. Ind. Crops Prod. 2025, 224, 121758. [Google Scholar] [CrossRef]
  11. Li, Y.; Pan, Y.; Luo, P.; Li, F.; Huang, M.; Yuan, K.; Yang, J.; Yuan, Z.; Xie, L. Preliminary report on daytime tapping of rubber trees [Shiyan chubao]. Chin. J. Trop. Crops. 2023, 44, 937–945. [Google Scholar] [CrossRef]
  12. Zhao, L.; Zeng, R.; Ding, L.; Xing, P.; Xin, Z.; Qiu, J.; Gui, H. Practices of six-day tapping system for enhanced natural rubber yield and quality in China. Ind. Crops Prod. 2025, 224, 120343. [Google Scholar] [CrossRef]
  13. Chen, Y.; Zhang, H.; Liu, J.; Zhang, Z.; Zhang, X. Tapped area detection and new tapping line location for natural rubber trees based on improved Mask Region Convolutional Neural Network. Front. Plant Sci. 2023, 13, 1038000. [Google Scholar] [CrossRef]
  14. Zhang, X.R.; Wen, Z.T.; Zhang, Z.F. Design and experiment of spiral motion automatic rubber tapping device. Trans. Chin. Soc. Agric. Mach. 2023, 54, 169–179. [Google Scholar] [CrossRef]
  15. Sun, Z.; Yang, H.; Zhang, Z.; Liu, J.; Zhang, X. An Improved YOLOv5-Based Tapping Trajectory Detection Method for Natural Rubber Trees. Agriculture 2022, 12, 1309. [Google Scholar] [CrossRef]
  16. Wang, L.; Huang, C.; Li, T.; Cao, J.; Zheng, Y.; Huang, J. An Optimization Study on a Novel Mechanical Rubber Tree Tapping Mechanism and Technology. Forests 2023, 14, 2421. [Google Scholar] [CrossRef]
  17. Liu, J.; Sun, Y.; Zhang, X.; Zhang, L.; Sun, H. Design and experiment of laser ranging controlled-depth rubber tapping machine. Trans. Chin. Soc. Agric. Mach. 2025, 56, 284–292. [Google Scholar] [CrossRef]
  18. Pramchoo, W.; Geater, A.F.; Harris-Adamson, C.; Tangtrakulwanich, B. Ergonomic rubber tapping knife relieves symptoms of carpal tunnel syndrome among rubber tappers. Int. J. Ind. Ergon. 2018, 68, 65–72. [Google Scholar] [CrossRef]
  19. Susanto, H.; Ali, S. The design of flexible rubber tapping tool with settings the depth and thickness control. IOP Conf. Ser. Mater. Sci. Eng. 2019, 506, 12002. [Google Scholar] [CrossRef]
  20. Zhang, X.; Chen, X.; Zhang, Z.; Liu, J.; Zhou, J.; Dong, X.; Fu, S. Design and experiment of a three-axis automatic rubber tapping device based on laser profiling. Trans. Chin. Soc. Agric. Mach. 2025, 56, 254–266. [Google Scholar] [CrossRef]
  21. Wen, X.; Hong, Y.; Xiong, J.; Yu, Y.; Tan, J.; Meng, X. Design and experiment of fixed natural rubber automatic tapping machine. Trans. Chin. Soc. Agric. Mach. 2023, 54 (Suppl. 2), 128–135. [Google Scholar] [CrossRef]
  22. Zhou, H.; Gao, J.; Zhang, F.; Zhang, J.; Wang, S.; Zhang, C.; Li, W. Evaluation of Cutting Stability of a Natural-Rubber-Tapping Robot. Agriculture 2023, 13, 583. [Google Scholar] [CrossRef]
  23. Yang, H.; Sun, Z.; Liu, J.; Zhang, Z.; Zhang, X. The Development of Rubber Tapping Machines in Intelligent Agriculture: A Review. Appl. Sci. 2022, 12, 9304. [Google Scholar] [CrossRef]
  24. Zhang, H.; Zhang, G.; Li, Y.; Zhang, L. Parameter Optimization Study of Adaptive Spiral Profiling Automatic Rubber Cutter for Natural Rubber Trees. Forests 2025, 16, 414. [Google Scholar] [CrossRef]
  25. Zeng, S.; Wu, Y.J.; Zeng, F.Y. Design and Experiment of a Fixed Rubber Automatic Tapping Machine. J. Southwest Univ. (Nat. Sci. Ed.) 2024, 46, 92–102. [Google Scholar] [CrossRef]
  26. NY/T 1088-2006; Ministry of Agriculture of the People’s Republic of China—Rubber Tree Tapping Technical Regulations. Ministry of Agriculture of the People’s Republic of China: Beijing, China, 2006. (In Chinese)
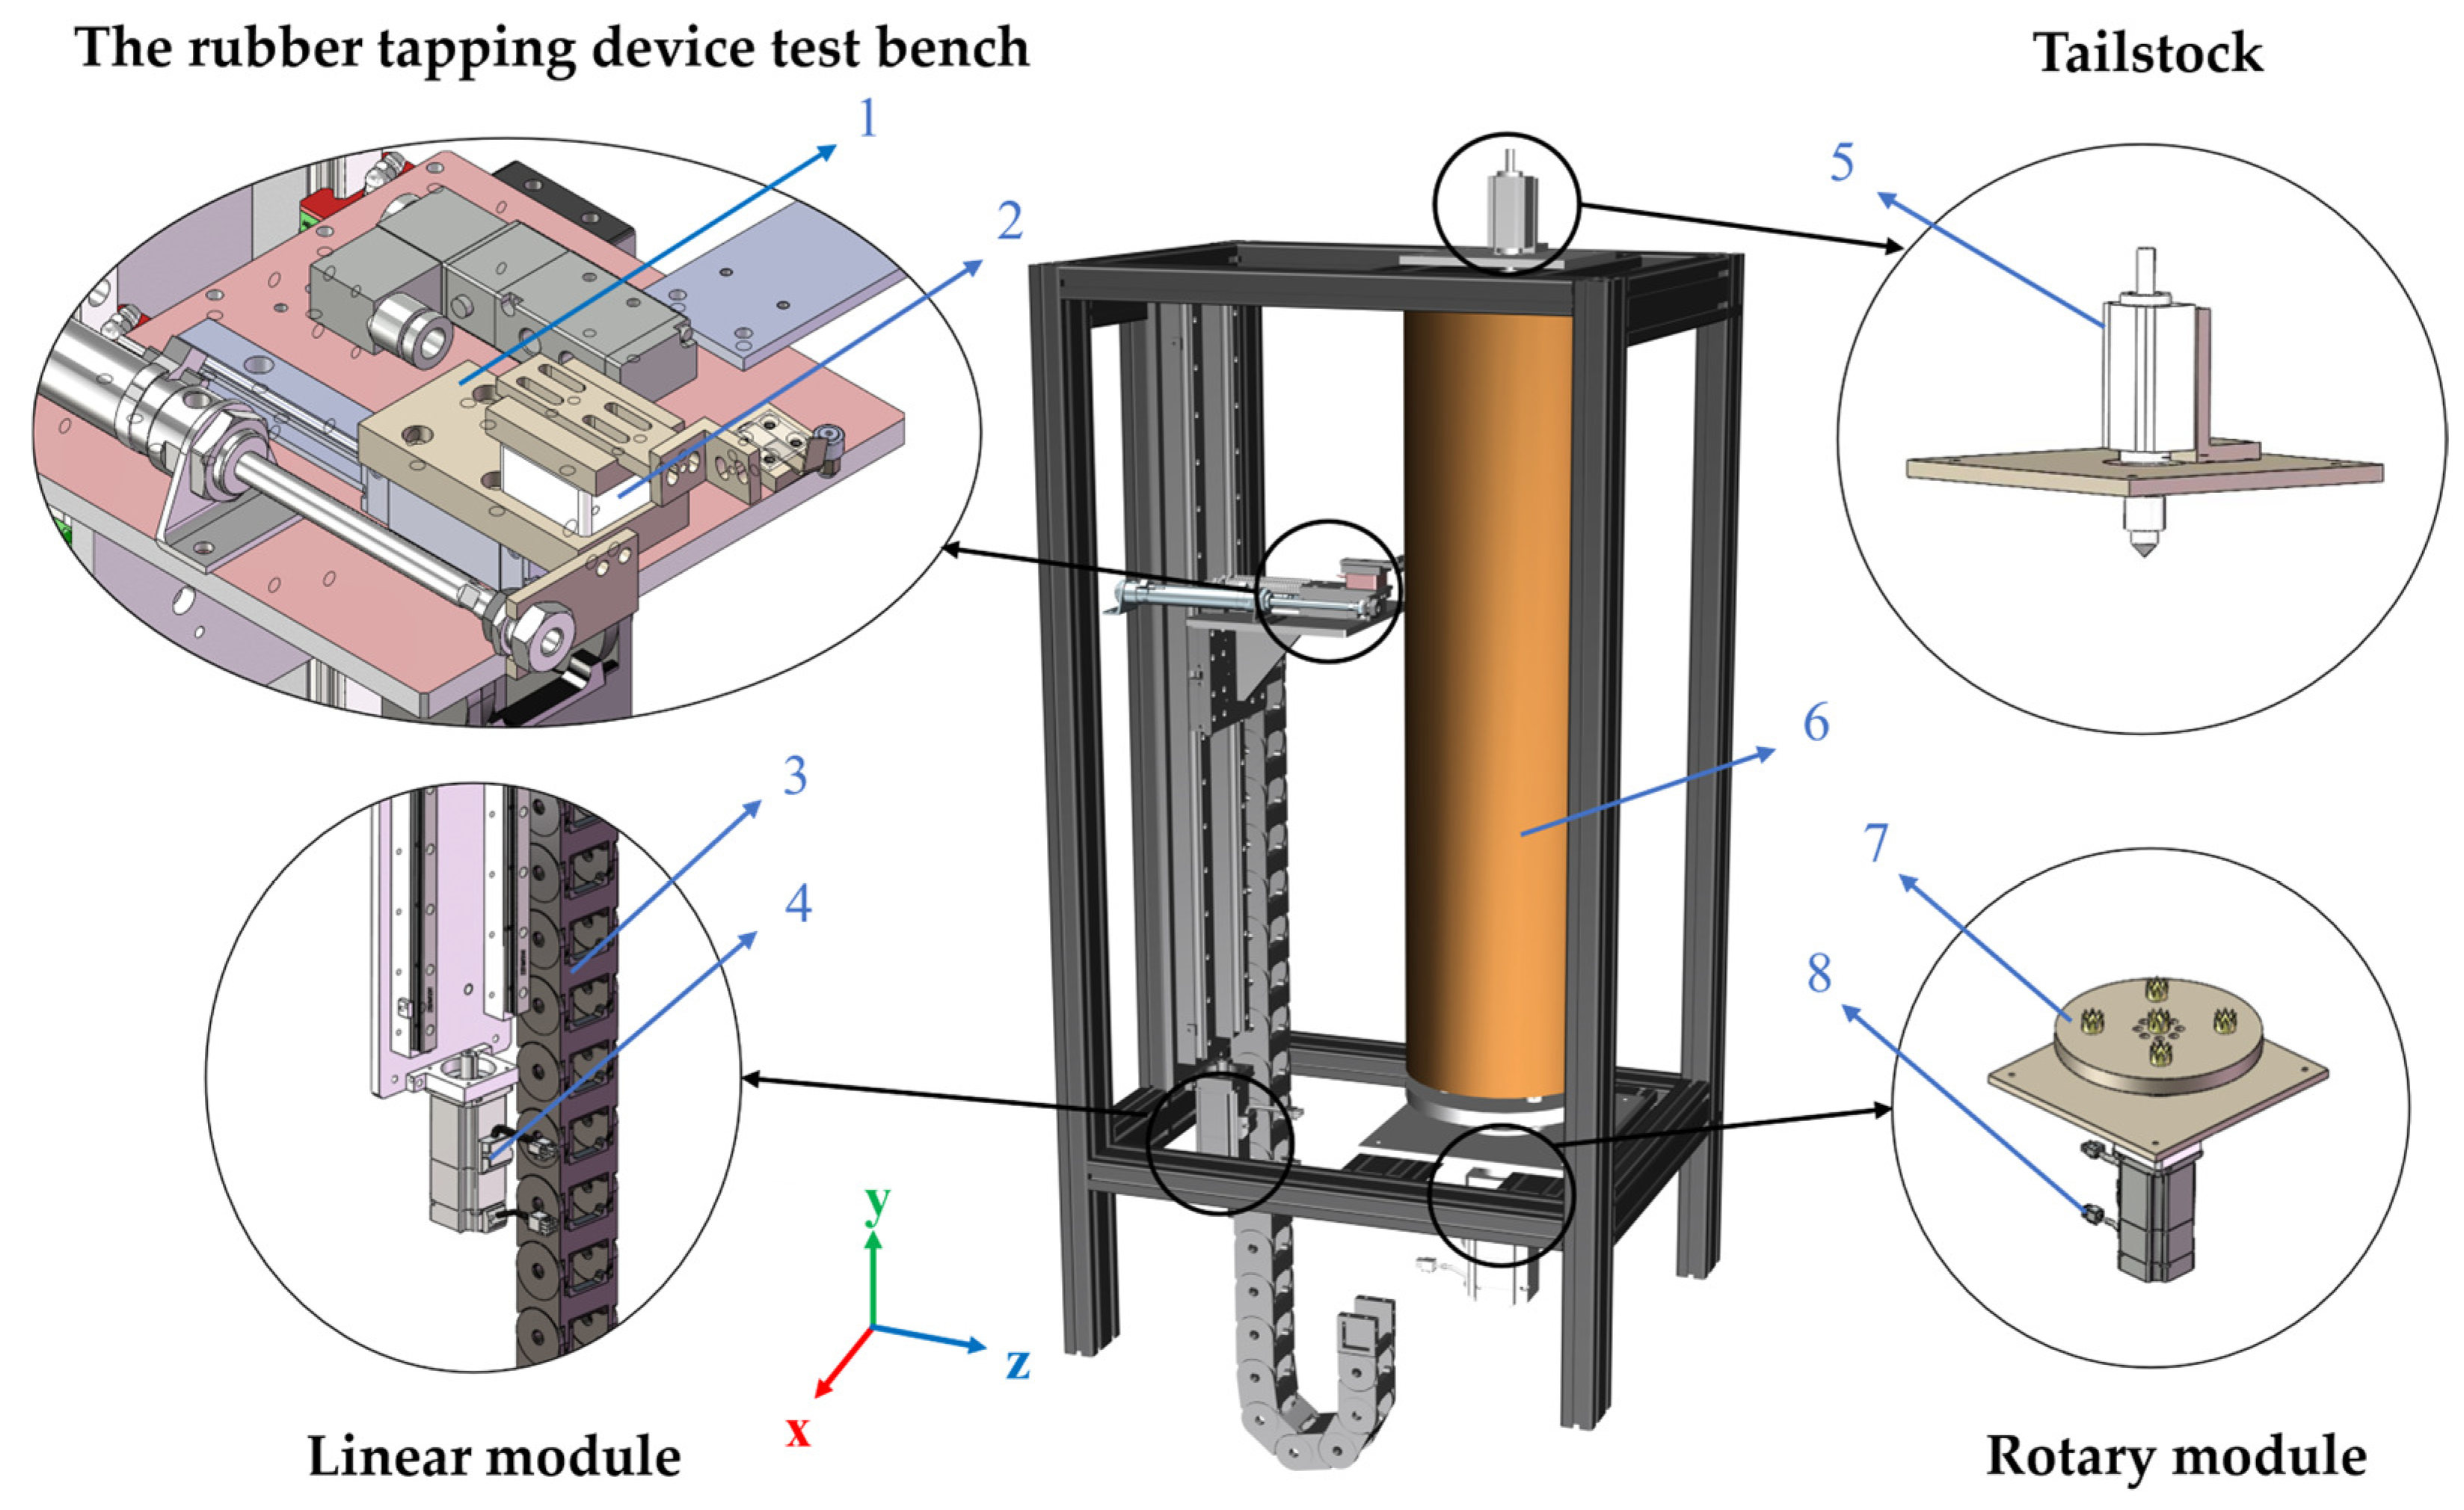
Figure 1. Structural schematic and working principle of the mechanical test bench for the rubber tapping device. Force sensor 1. Blade holder; 2. Force sensor; 3. Energy Chain; 4. Servo motor (1); 5. Center; 6. Rubber tree stump; 7. Horizontal circular platform; 8. Servo motor (2).
Forests 16 01764 g001
Figure 2. Schematic diagram of the forces acting on the blade holder.
Forests 16 01764 g002
Figure 3. Three-dimensional structural diagram of the a. 1. Solenoid Valve; 2. Contour-following mechanism; 3. Air Cylinder; 4. Force sensor; 5. Tapping Blade; 6. Contour-Following Roller. 7. Baffle.
Forests 16 01764 g003
Figure 4. Schematic Diagram of Contour-Following Working Principle for the Tapping Machine’s End Effector.
Forests 16 01764 g004
Figure 5. Schematic Diagram of the Control and Test System for the Rubber Tapping Mechanical Test Bench.
Forests 16 01764 g005
Figure 6. Cutting Blade Bending Angle.
Forests 16 01764 g006
Figure 8. Diagram of Cutting Blade Attitude Angle.
Forests 16 01764 g008
Figure 9. Diagram of Cutting Force in X-direction and Wood Chip Shape for Cutting Blade Bending Angle. (a) Cutting Force in X-direction for Cutting Blade Bending Angle; (b) Wood Chip Shape.
Forests 16 01764 g009
Figure 10. Schematic Diagram of Cutting Force Variation with Cutting Angle (a) Force Analysis Diagram of Variation with Cutting Angle in the X-direction; (b) Force Analysis Diagram of Variation with Cutting Angle in the Z-direction.
Forests 16 01764 g010
Figure 11. Force Analysis Diagram of Variation with Cutting Blade Attitude Angle in the X-direction.
Forests 16 01764 g011
Figure 12. Effects of Various Factors on Cutting Force and Flatness (a) Effects of Factors A and B on Cutting Force; (b) Effects of Factors A and C on Cutting Force; (c) Effects of Factors A and B on Flatness; (d) Effects of Factors B and C on Flatness.
Forests 16 01764 g012
Figure 13. Diagrams of Wood Chips Under Different Cutting Parameters (a) Performance under optimal parameters; (b) Performance when deviating only from the optimal attitude angle; (c) Performance when reducing only the cutting angle; (d) Performance when adjusting only the bending angle.
Forests 16 01764 g013
Table 1. Key Parameters Of The Entire Machine.
Key ComponentsParameters/mm
Frame750 × 520 × 1500
Rubber tree stump length700–1000
Rubber tree stump Dimension600–900
Lead screw length1000
Cylinder stroke100
Table 2. Levels of Experimental Factors.
CodeA: Cutting Angle (°)B: Cutting Blade Bending Angle
(°)
C: Cutting Blade Attitude Angle
(°)
−1.681792823.2966.59−3.41
−125700
027.5755
1308010
1.681792831.783.4113.41
Table 3. Experimental Results and Analysis.
Test NumberA: Cutting Angle/°B: Cutting Blade Bending Angle/°C: Cutting Blade Attitude Angle/°Cutting Force/NVariance of Forces/N2
1−1−1−113.36.59
21−1−125.253.97
3−11−117.57.29
411−122.859.2
5−1−117.469.56
61−1112.14.97
7−11112.85.95
81119.443.87
9−1.6817928310013.374.5
101.6817928310016.753.45
110−1.681792831010.198.46
1201.681792831017.575.96
1300−1.68179283129.356.12
14001.68179283117.019.34
1500018.964.64
1600020.993.97
1700021.564.95
1800019.763.51
1900022.054.25
2000022.765.25
The test results were analyzed using Design-Expert software. The model’s p-value < 0.0001, indicating that the test factors have a very significant impact on the model.
Table 4. Results of Model Significance Test.
Response 1: Cutting ForceResponse 2: Flatness
SourceSum of
Squares
dfMean
Square
F-Valuep-Value SourceSum of
Squares
dfMean
Square
F-Valuep-Value
Model577.5964.1715.36<0.0001significantModel64.6097185.960.0050significant
A43.11143.1110.320.0093 A6.1216125.090.0477
B20.89120.8950.0493 B0.6510650.540.4786
C245.081245.0858.65<0.0001 C0.5410540.450.5182
AB26.64126.646.380.0301 AB6.2016205.150.0467
AC32.08132.087.680.0198 AC4.4414.443.600.0837
BC0.096810.100.02320.8821 BC14.15114.1511.760.0065
A293.02193.0222.260.0008 A20.3510360.300.5943
B2126.081126.0830.170.0003 B213.98113.9811610.0067
C21.5711.570.37620.5534 C219.68119.6816.350.0023
Residual41.79104.18 Residual12.04101.20
Lack of
Fit
31.5856323.090.1205not
significant
Lack of
Fit
9.9551994.790.0552not
significant
Pure Error10.2152.04 Pure Error2.0850.42
Cor Total619.28 Cor Total76.6419
R20.9319 R20.84
Adjusted R20.8719 Adjusted R20.70
Disclaimer/Publisher’s Note: The statements, opinions and data contained in all publications are solely those of the individual author(s) and contributor(s) and not of MDPI and/or the editor(s). MDPI and/or the editor(s) disclaim responsibility for any injury to people or property resulting from any ideas, methods, instructions or products referred to in the content.