Article

Predicting Porosity in Raw Cork Using Near-Infrared Spectroscopy

1
Centro de Estudos Florestais, Laboratório Associado TERRA, Instituto Superior de Agronomia, Universidade de Lisboa, Tapada da Ajuda, 1349-017 Lisboa, Portugal
2
SERQ—Innovation and Competence Forest Centre, 6100-711 Sertã, Portugal
*
Author to whom correspondence should be addressed.
Forests 2025, 16(11), 1737; https://doi.org/10.3390/f16111737
Submission received: 12 October 2025 / Revised: 10 November 2025 / Accepted: 17 November 2025 / Published: 18 November 2025
(This article belongs to the Special Issue Wood Chemistry and Quality)

Abstract

The classification of cork planks as a raw material is traditionally performed through visual inspection of cork pores and defects, both in forest owners’ associations and industrial settings. This method introduces subjectivity and limits reproducibility. This study aimed to develop near-infrared spectroscopy (NIRS) models for predicting porosity in raw cork, distinguishing virgin, secondary, and mature cork types. A total of 156 cork samples representing the three cork types were analyzed. Spectra were collected on the transverse and radial surfaces using a Bruker MPA spectrophotometer. Partial Least Squares Regression (PLS-R) models were developed separately for each cork type, yielding cross-validated coefficients of determination (R2) between 0.48 and 0.64. Additionally, two global models were obtained using a random data split (60% for cross-validation and 40% for validation), differentiated by whether or not areas corresponding to insect galleries were included. The model incorporating insect galleries achieved R2 values of 0.63 (cross-validation) and 0.46 (validation), while the model excluding them yielded R2 values of 0.51 and 0.52, respectively. The final optimized model, based on all samples and using selected spectral regions (9500–7500 and 6100–5450 cm−1) with first derivative and vector normalization preprocessing, achieved an R2 of 0.61, RMSECV of 0.025, and RPD of 1.6 using five latent variables. This model was used to estimate porosity coefficients in visually classified secondary and mature cork. Results confirmed an inverse relationship between porosity and cork quality class: higher-quality classes (Q1, Q2) had lower porosity, with Q1 being the most homogeneous. Porosity increased from Q2 to Q6 in mature cork, expressing declining quality. Greater variability in lower-quality classes highlights porosity’s relevance for classification. These results demonstrate the potential of NIRS as a non-destructive tool for assessing cork porosity, offering a more objective and efficient alternative to conventional methods.

1. Introduction

Cork is the raw material obtained from the cork oak (Quercus suber L.), a species native to the western Mediterranean region. It is the most economically important non-wood forest product supplied by cork oak forests. Cork is extracted by periodically removing the tree’s outer bark as part of a sustainable management system that spans the tree’s entire life cycle [1,2]. According to Costa et al. (2015) [3], the optimal cork exploitation period lasts for approximately 110–120 years, encompassing nine successive harvests.
Throughout its life cycle, the cork oak produces three types of cork: (i) virgin cork, (ii) secondary cork, and (iii) mature cork. According to Portuguese law, cork extraction can begin when the tree reaches a perimeter of 70 cm at breast height (1.3 m), followed by extraction cycles with a minimum nine-year interval. The cork from the first extraction, which typically occurs when the trees are about 25 years old, is called “virgin cork”. The cork from the second extraction is called “secondary”, and the cork from all subsequent extractions is called “mature”. During the tree’s lifetime, there can be up to 15 sequential extractions of mature cork, which makes it the main cork raw material. Due to its tissue continuity, structural homogeneity, and lower density, mature cork has the desired properties associated with cork. Virgin and secondary cork are also used industrially, particularly in decorative products and agglomerates. However, due to deep cracks and structural inhomogeneity, they lack the characteristics necessary for natural cork products, such as cork stoppers or other high-performance cork materials [4,5,6].
As a raw material, cork is industrially classified into quality classes that reflect its potential yield and the quality of the products that can be made from it. This classification considers thickness and structural homogeneity, especially porosity and the presence of defects such as insect galleries or woody inclusions [5,7]. Porosity is the key factor affecting cork quality, which directly determines its suitability for stopper production [8,9] or other usages [10]. Historically, but still practiced largely today, this quality classification has relied on visual inspection by an experienced operator; this process, however, is intrinsically arbitrary and non-reproducible. Image analysis has replaced visual evaluation when it comes to assessing the quality of cork products, such as stoppers and disks. This involves quantifying the number, size and distribution of pores and other defects [6,11]. Several imaging techniques have been explored for this purpose, including terahertz and millimeter-wave imaging [12] near-infrared spectroscopy, [9,13], confocal microscopy [14], and, more recently, X-ray and neutron tomography [11,15,16].
Porosity is commonly measured using the porosity coefficient obtained through image analysis [6], although it can vary significantly within a single-cork plank [6,17]. When it comes to the quality measurement of cork as a raw material, typically in the form of rough planks, this method, while accurate, is laborious, time-consuming and non-practical. In contrast, NIRS is a fast, reliable, and non-destructive technique capable of simultaneously providing information on multiple chemical and physical properties. Its first application in cork research assessed its potential for characterizing visual quality, porosity, and moisture content [9]. Since then, NIRS has been used to predict the geographical origin of cork planks and stoppers [18], detect defects relevant to cork stopper production [19], monitor moisture in real-time during processing, and quantify chemical (e.g., extractives) and physical parameters such as density [20]. NIRS has also shown promise in estimating total polyphenol content and antioxidant activity in cork [21].
Sánchez-González (2016) [13] developed NIRS models to predict the porosity coefficient in raw and boiled cork samples, achieving coefficients of determination of 0.58 and 0.59, respectively.
While previous studies have largely focused on mature cork, this research aims to extend the application of near-infrared (NIR) spectroscopy for porosity assessment across all three cork types: virgin, secondary, and mature. The objective of the present study is to develop a non-destructive, cost-effective methodology for assessing porosity in cork planks using near-infrared spectroscopy. Unlike previous studies, this work aims to build predictive models applicable to all three cork types—virgin, secondary, and mature—thereby broadening the practical utility of the approach. Image analysis was used as the reference method for calibration. This approach seeks to enable rapid, reliable, and objective assessment of cork quality across different cork types, without compromising the integrity of the material. The ultimate goal is to create a technique that is both simple and practical and also sufficiently robust to be employed in an industrial setting, enabling comprehensive quality assessment regardless of cork type.

2. Materials

2.1. Cork Sampling and Preparation

The trees examined in this study were sourced from two natural stands of Quercus suber in Portugal: 30 trees from a stand at Perímetro Florestal da Contenda, located in Santo Aleixo da Restauração, municipality of Moura and 32 from a private stand, located in Santana do Mato, municipality of Coruche. From the total of 62 trees, a representative selection was made to ensure balanced coverage across all seven industrial cork quality classes. This was guaranteed by the classification of the cork samples, carried out by experienced personal at the Associação dos Produtores Florestais do Concelho de Coruche. Specifically, the selection included 3 trees from the 1st quality class, 6 from the 2nd, 12 from the 3rd, 8 from the 4th, 11 from the 5th, 10 from the 6th, and 12 from the 7th (Figure 1).
These trees provided 156 cork strips for analysis, including 58 samples of virgin cork, 62 samples of secondary cork and 36 samples of mature cork (see also Figure S1 Supporting Information). For the determination of cork porosity in the radial and transverse directions, cork strips were polished with a belt sander (FAI™ Model LCU) fitted with P100 grit paper (Norton™), followed by compressed air to remove abrasive residue from the pores, before spectra and cork porosity were obtained. During spectral acquisition, all cork samples were stored in a room with a controlled environment at a temperature of 22 °C and a relative humidity of 45 ± 5%. This ensured the stability of the samples throughout the experiment, thereby minimizing the variability of the spectral data caused by fluctuations in external temperature or humidity.

2.2. Cork Porosity Measurements

Cork porosity was determined in the sanded transverse and radial sections of each raw virgin, secondary and mature cork sample. High-resolution scans of each cork sample’s surface were obtained using a Canon CanoScan Lide 60 scanner and the CanoScan Toolbox 4.9.3 program. Images were acquired with the following characteristics: width: 2480 pixels; height: 3507 pixels; horizontal and vertical resolutions: 300 dpi. During digitization, millimeter paper was added to the cork pieces for image calibration within the analysis software. The images were processed by computer using the image processing software AnalySIS® (Analysis Soft Imaging System GmbH, Münster, Germany, version 3.1) [22]. The digitized cork image was calibrated using graph paper to set the measurement unit and calibration length (10 mm), with a fixed X/Y ratio of 1:1. The optimal conditions for identifying porosity were subsequently defined using the ‘Set Color Thresholds’ tool. This included the cork regions and excluded the pore areas, based on the RGB color system (Red: 148–164, Green: 104–124, Blue: 94–108). The study area was manually defined using the ROI (region of interest) tool by selecting the total sample area while excluding the cork back region. Pore detection criteria were based on area classification (mm2), utilizing the ‘filled’ particle outline style and a particle filter with a minimum of 20 pixels to fill holes. Border particles were set to ‘truncate’.
The software automatically detects color differences caused by different cork characteristics, although some manual corrections of initially identified areas are necessary. The cork porosity coefficient was calculated for each sample, which is the ratio of total pore area (mm2) to total cork surface area (mm2). Two distinct values of cork porosity (CP) were computed either considering the effect of insect galleries together with pores or not: (i) the cork porosity coefficient considering the insect galleries as cork porosity and including them in the total surface area measured (CPVwith galleries, CPSwith galleries and CPMwith galleries, for virgin (V), secondary (S) and mature (M) cork, respectively); (ii) the cork porosity coefficient excluding the insect galleries from the total surface area measured (CPV, CPS and CPM, for virgin, secondary and mature cork, respectively).

3. Methods

3.1. Near-Infrared (NIR) Spectroscopy

Fourier transform near-infrared (FT-NIR) spectra were recorded using a Bruker MPA equipped with an integrating sphere. The spectra were collected in the wave number range 12,500 to 4000 cm−1 with a spectral resolution of 16 cm−1 and 64 scans per spectrum in diffuse reflectance measurement mode. The integrating sphere measurement window is a 20 mm diameter circle, approximately the width of cork strips, which were placed on top of the window for spectra acquisition. The NIR spectra of the entire profile of the cork strip sample were acquired by manually moving the cork strip in 20 mm increments in both radial and transverse directions. The number of spectra per cork strip varied between 10 and 30, depending on its size. After acquiring the spectra in both directions, they were averaged to get one spectrum per cork strip.

3.2. Partial Least Square Regression (PLS-R)

The PLS-R models were developed using the OPUS Quant 2 software (version 7.0, Bruker Optics, Ettlingen, Germany). The analysis covered the spectral range from 10,000 to 4000 cm−1. For all models, the spectra were mean-centered prior to pre-processing.
First, individual models were created for each cork type (virgin, secondary and mature). Subsequently, two global models, including all cork types totaling 156 spectra, were tested, with the data split randomly into 60% for cross-validation and 40% for validation.
Based on this comparison, the final optimized model was obtained using the complete dataset of 156 samples, without splitting, to maximize the robustness of the calibration.
Several spectra pre-processements were tested, including raw spectra (no pre-processing), first (1stDer) and second (2ndDer) derivatives, multiplicative scattering correction (MSC) and vector normalization (VN), as well as combinations of the first derivative with MSC and VN. The optimum number of PLS components (rank) was determined by the full inner cross-validation method (leave one out). All models were calculated to a maximum rank of 10.
The following statistics of the cross-validation were computed for model comparison: coefficient of determination (R2), root-mean-square error of cross-validation (RMSECV) and residual prediction deviation (RPD). Regarding outliers detection, the Mahalanobis distance is commonly employed in multivariate calibration [23]. To identify these outliers, a threshold value for the Mahalanobis distance (Md) is established. In OPUS, this threshold is derived from the statistical distribution of all calibration spectra. Specifically, the mean and standard deviation are computed, and under the assumption of a normal distribution, a one-sided threshold is set to encompass 99.999% of the data [23,24].

4. Results and Discussion

4.1. Cork Porosity

Table 1 presents data on the porosity coefficient of cork, comparing the three cork types—Virgin, Secondary, and Mature—under the two analyzed conditions: with and without insect galleries. For each category, several statistical indicators are provided, including the average, minimum and maximum values, standard deviation (STD), coefficient of variation (CoeVar%), and 95% confidence intervals (CI).
Overall, the porosity coefficient of cork with insect galleries is slightly higher (average value of 0.125, ranging from 0.034 to 0.286), compared to cork without insect galleries (average value of 0.118, ranging from 0.034 to 0.224). Among the cork types, mature cork exhibits the highest porosity coefficient average in both conditions. Virgin cork shows moderate porosity, but with high variability, especially when insect galleries are considered. Compared to virgin and mature cork, secondary cork samples showed consistently lower porosity values overall, averaging 0.119, with the effect of insect galleries, and 0.115 without this effect (Table 1). These results are consistent with those reported by Paulo and Santos (2023) [22], who found average porosity coefficients of 0.115 and 0.114 for virgin and secondary cork, respectively, without the effect of insect galleries. Similarly, Sánchez-González et al. (2016) [13] observed porosity values ranging from 0.027 to 0.365, with an average of 0.161.
The standard deviation remains consistent at 0.04 across all categories except for mature cork without galleries, for which it is slightly lower at 0.03. The coefficient of variation is highest in secondary cork with insect galleries (34.3%) and lowest in mature cork without galleries (22.2%), indicating greater variability in the former (see Table 1).
The confidence intervals indicate the reliability of the average porosity values. Mature cork shows the narrowest confidence intervals (e.g., 0.129–0.143 with galleries), suggesting high consistency and less uncertainty around the mean values. In contrast, secondary cork has broader intervals (e.g., 0.109–0.129 with galleries), reflecting greater variability in sample measurements.

4.2. PLS-R Modeling and Cork Porosity Prediction

The results of the cross-validation demonstrated that the PLS-R models with the best statistical performance were those derived from the spectra using the combination of 1stDerVN and 1stDerMSC pre-processing and the spectral ranges shown in Table 2. Consequently, only these models are presented in the subsequent analysis. The superior performance of the PLS-R models using 1stDer combined with VN or MSC pre-processing can be attributed to their ability to address baseline variations and scattering effects commonly present in NIR spectral data. The first derivative corrects baseline drifts, while VN and MSC remove multiplicative and scatter-related distortions caused by surface heterogeneity and instrumental factors. Comparisons among the tested pre-processing techniques revealed that this combination yielded the lowest prediction errors and highest determination coefficients, confirming its suitability for robust porosity estimation [25].
Table 2 summarizes the PLS-R metrics for individual models obtained for each type of cork type. For virgin cork (CPV), both with and without insect galleries, the models achieved R2 values of 0.53 and 0.48, respectively, and identical RPD scores (1.45 and 1.39), indicating moderate predictive capabilities. However, the model with galleries exhibited a slightly higher RMSECV (0.029) compared to without galleries (0.027). For secondary cork (CPS), the models demonstrated better predictive performance than virgin cork, with R2 values of 0.61 (with galleries) and 0.55 (without galleries). The corresponding RPD scores also improved to 1.60 and 1.44, respectively, while RMSECV values were 0.025 (with galleries) and 0.026 (without galleries). The mature cork (CPM) models showed similar R2 values, comparing without galleries (0.63), and with galleries (0.64), the highest values for all cork types. The RPD values for mature cork were also the highest among all cork types, with 1.64 (without galleries) and 1.68 (with galleries), and the RMSECV values were the lowest at 0.018 and 0.017, respectively. The choice of rank for the CPM model with and without galleries followed the principle of selecting the simplest model that achieves optimal performance. Although rank 5 yielded the lowest RMSECV for the model without galleries, the model with galleries showed a near-optimal RMSECV at rank 2, with no improvement at higher ranks. Since comparable predictive accuracy can be achieved with fewer factors, resulting in greater model stability, rank 2 was selected for the CPM model with galleries to ensure a robust calibration [23].
The findings indicate that mature and secondary cork models demonstrated superior performance compared to virgin cork. The presence of insect galleries was observed to have a slight positive impact on model performance, with the exception of mature cork. This outcome is expectable, as the spectra were acquired across the entire surface of the cork strip, including the areas affected by insect galleries.
Table 3 presents the statistics of the global PLS-R models for predicting the coefficient of porosity in cork samples, encompassing all cork types, both with and without the effect of insect galleries. Two models with good statistics were obtained for the combination of spectral ranges and pre-processing, 9500–7500, 6100–5450 cm−1 with 1stDerVN for CP with insect galleries and without.
Regarding cross-validation for the CP with galleries the model achieved a relatively high R2 of 0.63, indicating good predictive accuracy for the coefficient of porosity. The RMSECV was 0.025, reflecting a low error, and the RPD was 1.65, demonstrating medium reliability for quantitative predictions. The model had a rank (Rk) of 5 and no detected outliers, suggesting robustness. During validation, the R2 dropped to 0.46, but the RMSEP remained low at 0.028, maintaining good predictive accuracy. The RPD decreased slightly to 1.36 but still demonstrated reliable prediction. The rank remained at 5, and no outliers were detected.
The model for the coefficient of porosity without the effect of insect galleries had a lower R2 of 0.51, indicating weaker predictive performance. The RMSECV was 0.025, and the RPD was 1.42, reflecting moderate predictive reliability. The rank was 5, and no outliers were identified. The validation results for samples without galleries showed an R2 of 0.52 and an RMSEP of 0.026. The RPD improved to 1.45 compared to cross-validation, indicating better prediction reliability in validation. The rank was 5, with no outliers identified.
The model for samples with galleries consistently outperformed the model for those without galleries in both cross-validation and validation, as indicated by higher R2, lower RMSECV values, and higher RPD values. This was expected, given that the NIR spectra were acquired across the entire profile of the cork sample, and the presence of insect galleries could not be circumvented. Nevertheless, both models exhibited satisfactory reliability in predicting the coefficient of porosity, with no notable instances of outliers.
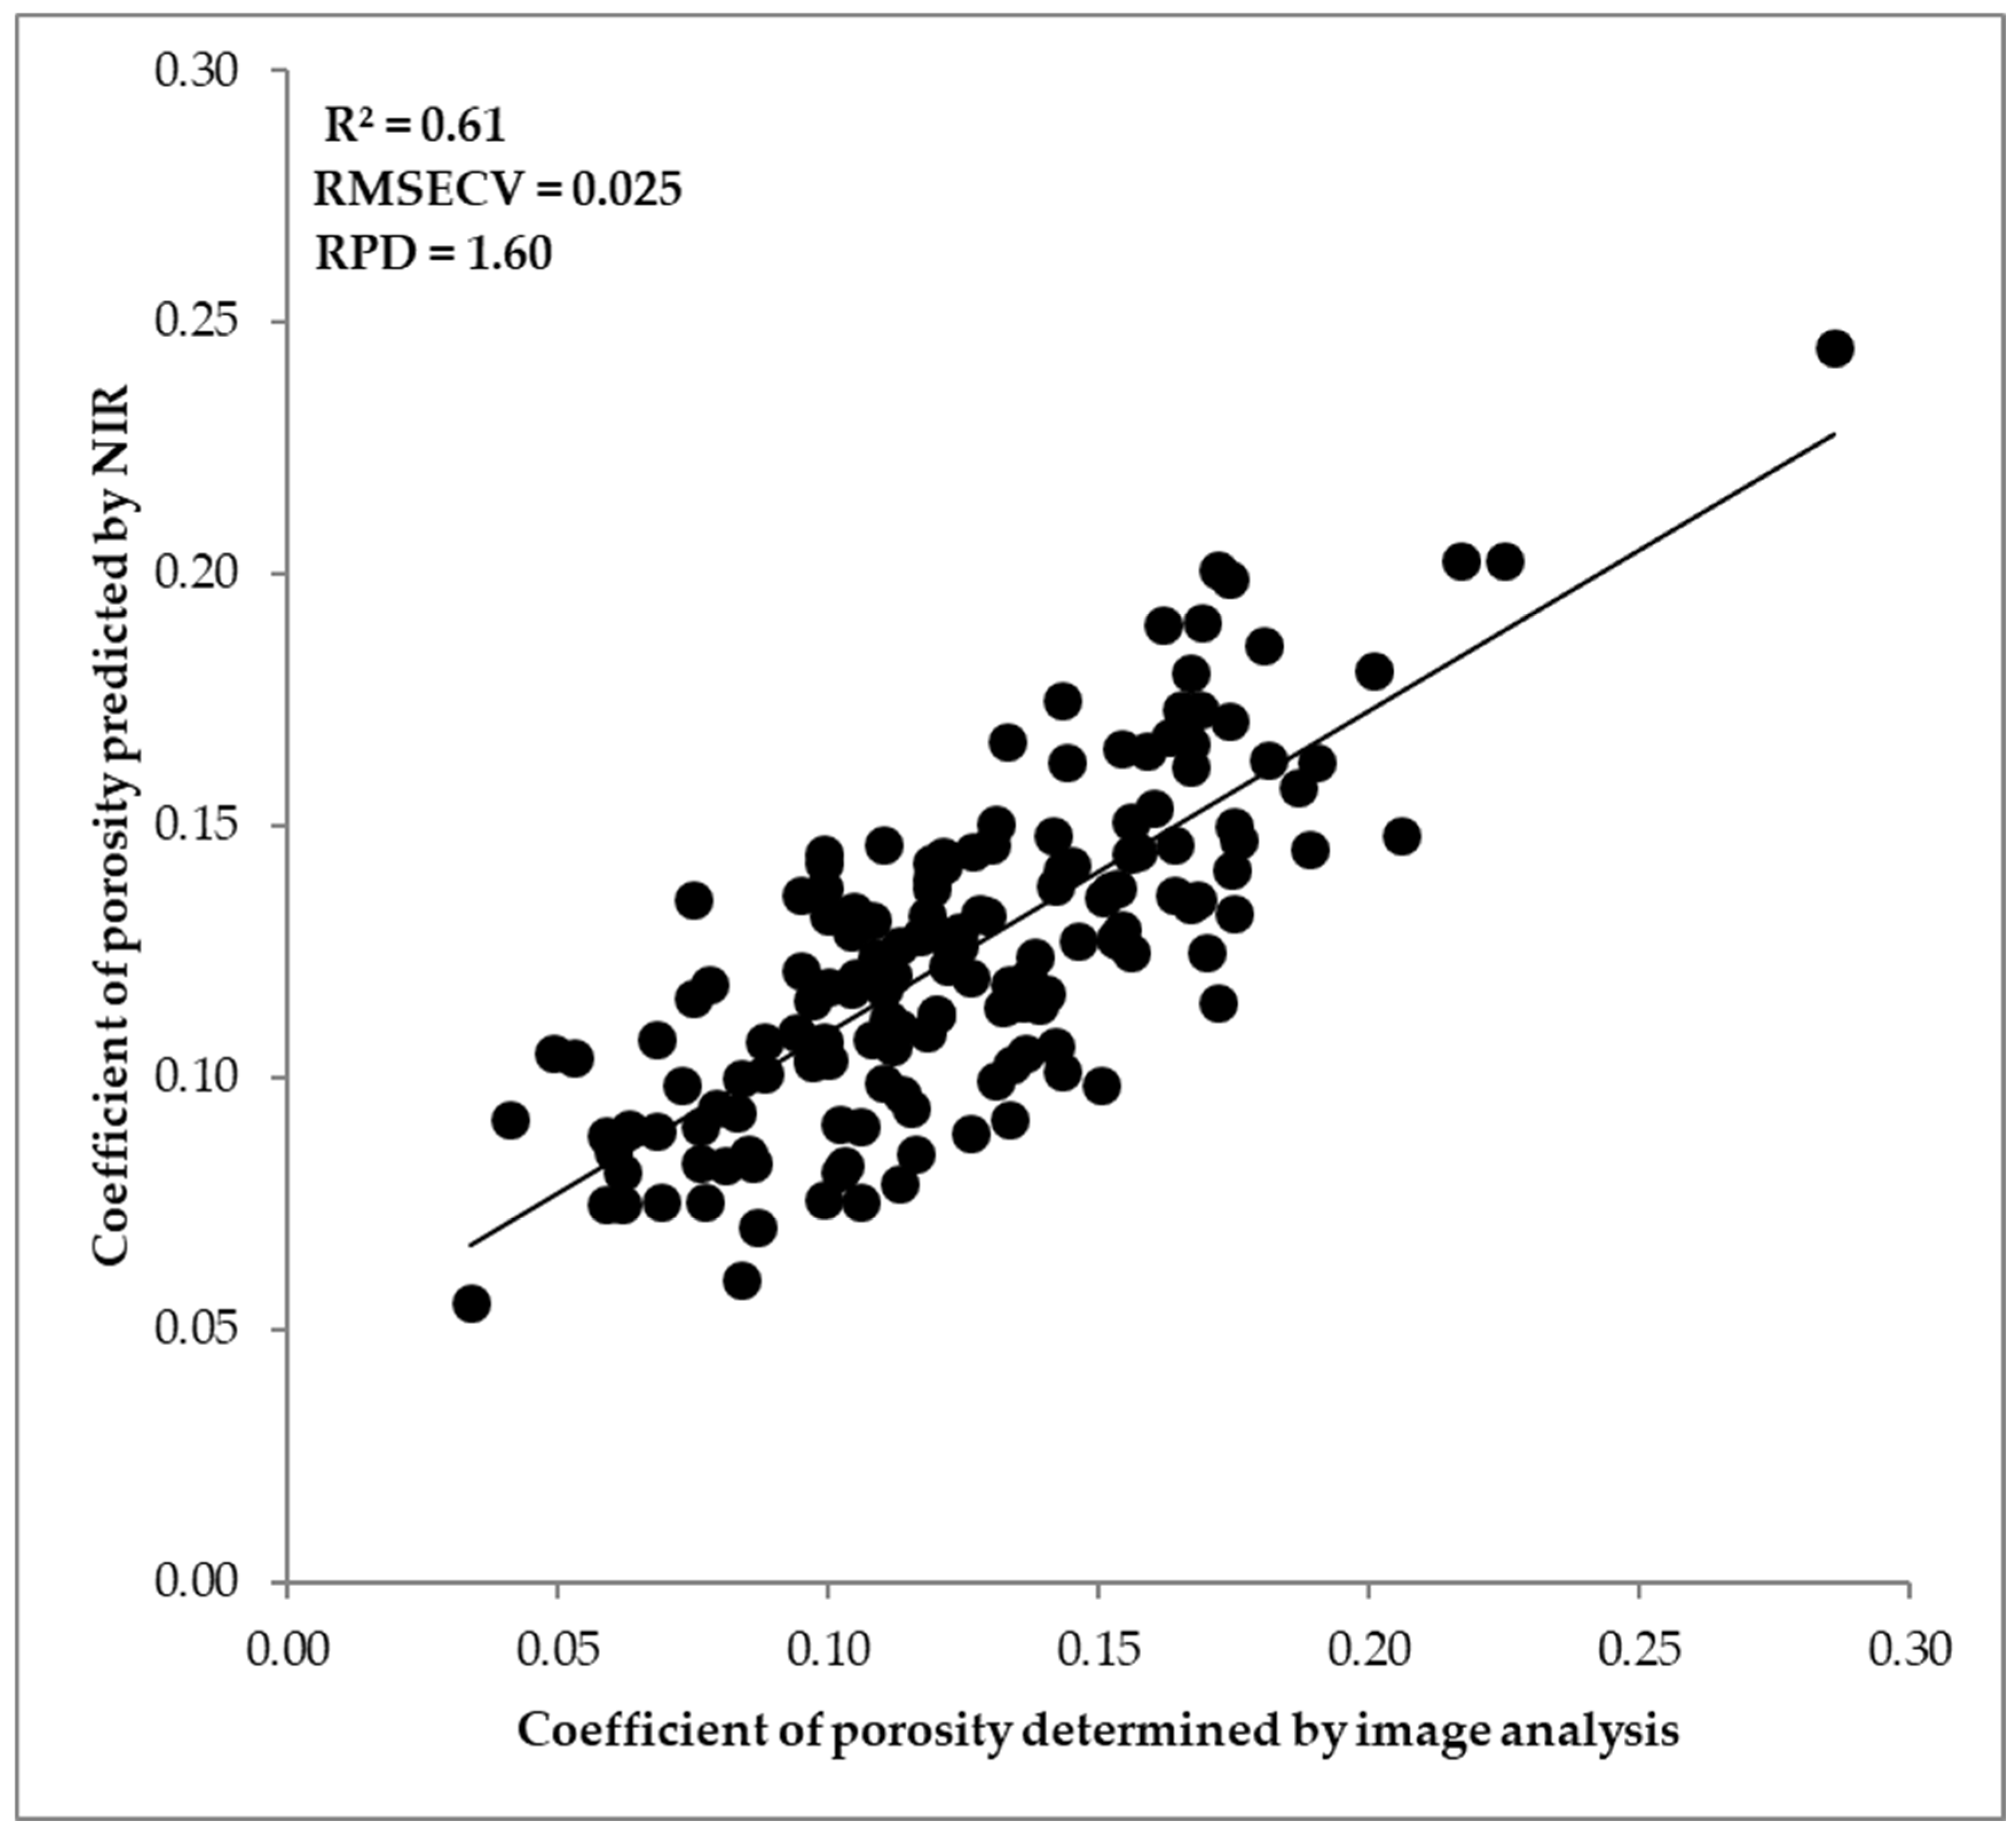
The final optimized model (CPwith galleries) was developed using all 156 samples, based on the spectral regions 9500–7500 and 6100–5450 cm−1 with 1stDerVN pre-processing. It resulted in a PLS-R model with five latent variables, yielding a coefficient of determination (R2) of 0.61, an RMSECV of 0.025, and an RPD of 1.6 (Figure 2).
Sánchez-González et al. (2016) [13] developed models with a residual prediction deviation (RPD) greater than 1.5. The best results were obtained when predicting mature cork porosity in raw or boiled samples using spectra collected from the same type of cork, achieving R2 values of 0.58 and 0.59, respectively. In comparison, Prades et al. (2010) [9] reported slightly better models, with cross-validation coefficients of determination reaching 0.69 for porosity. Similarly, Gómez-Sánchez (2013) [26] found that the most accurate NIRS predictions occurred when porosity was classified into three color-based groups, aligning with image analysis outcomes. This approach was able to distinguish in mature cork the two extreme quality classes in planks (named “refuse” and “race”), two in sheets (R2 = 0.83; r2 = 0.78), and three in stoppers (R2 = 0.67; r2 = 0.53).

4.3. NIR-Predicted Cork Porosity in Secondary Cork Visual Quality Classes

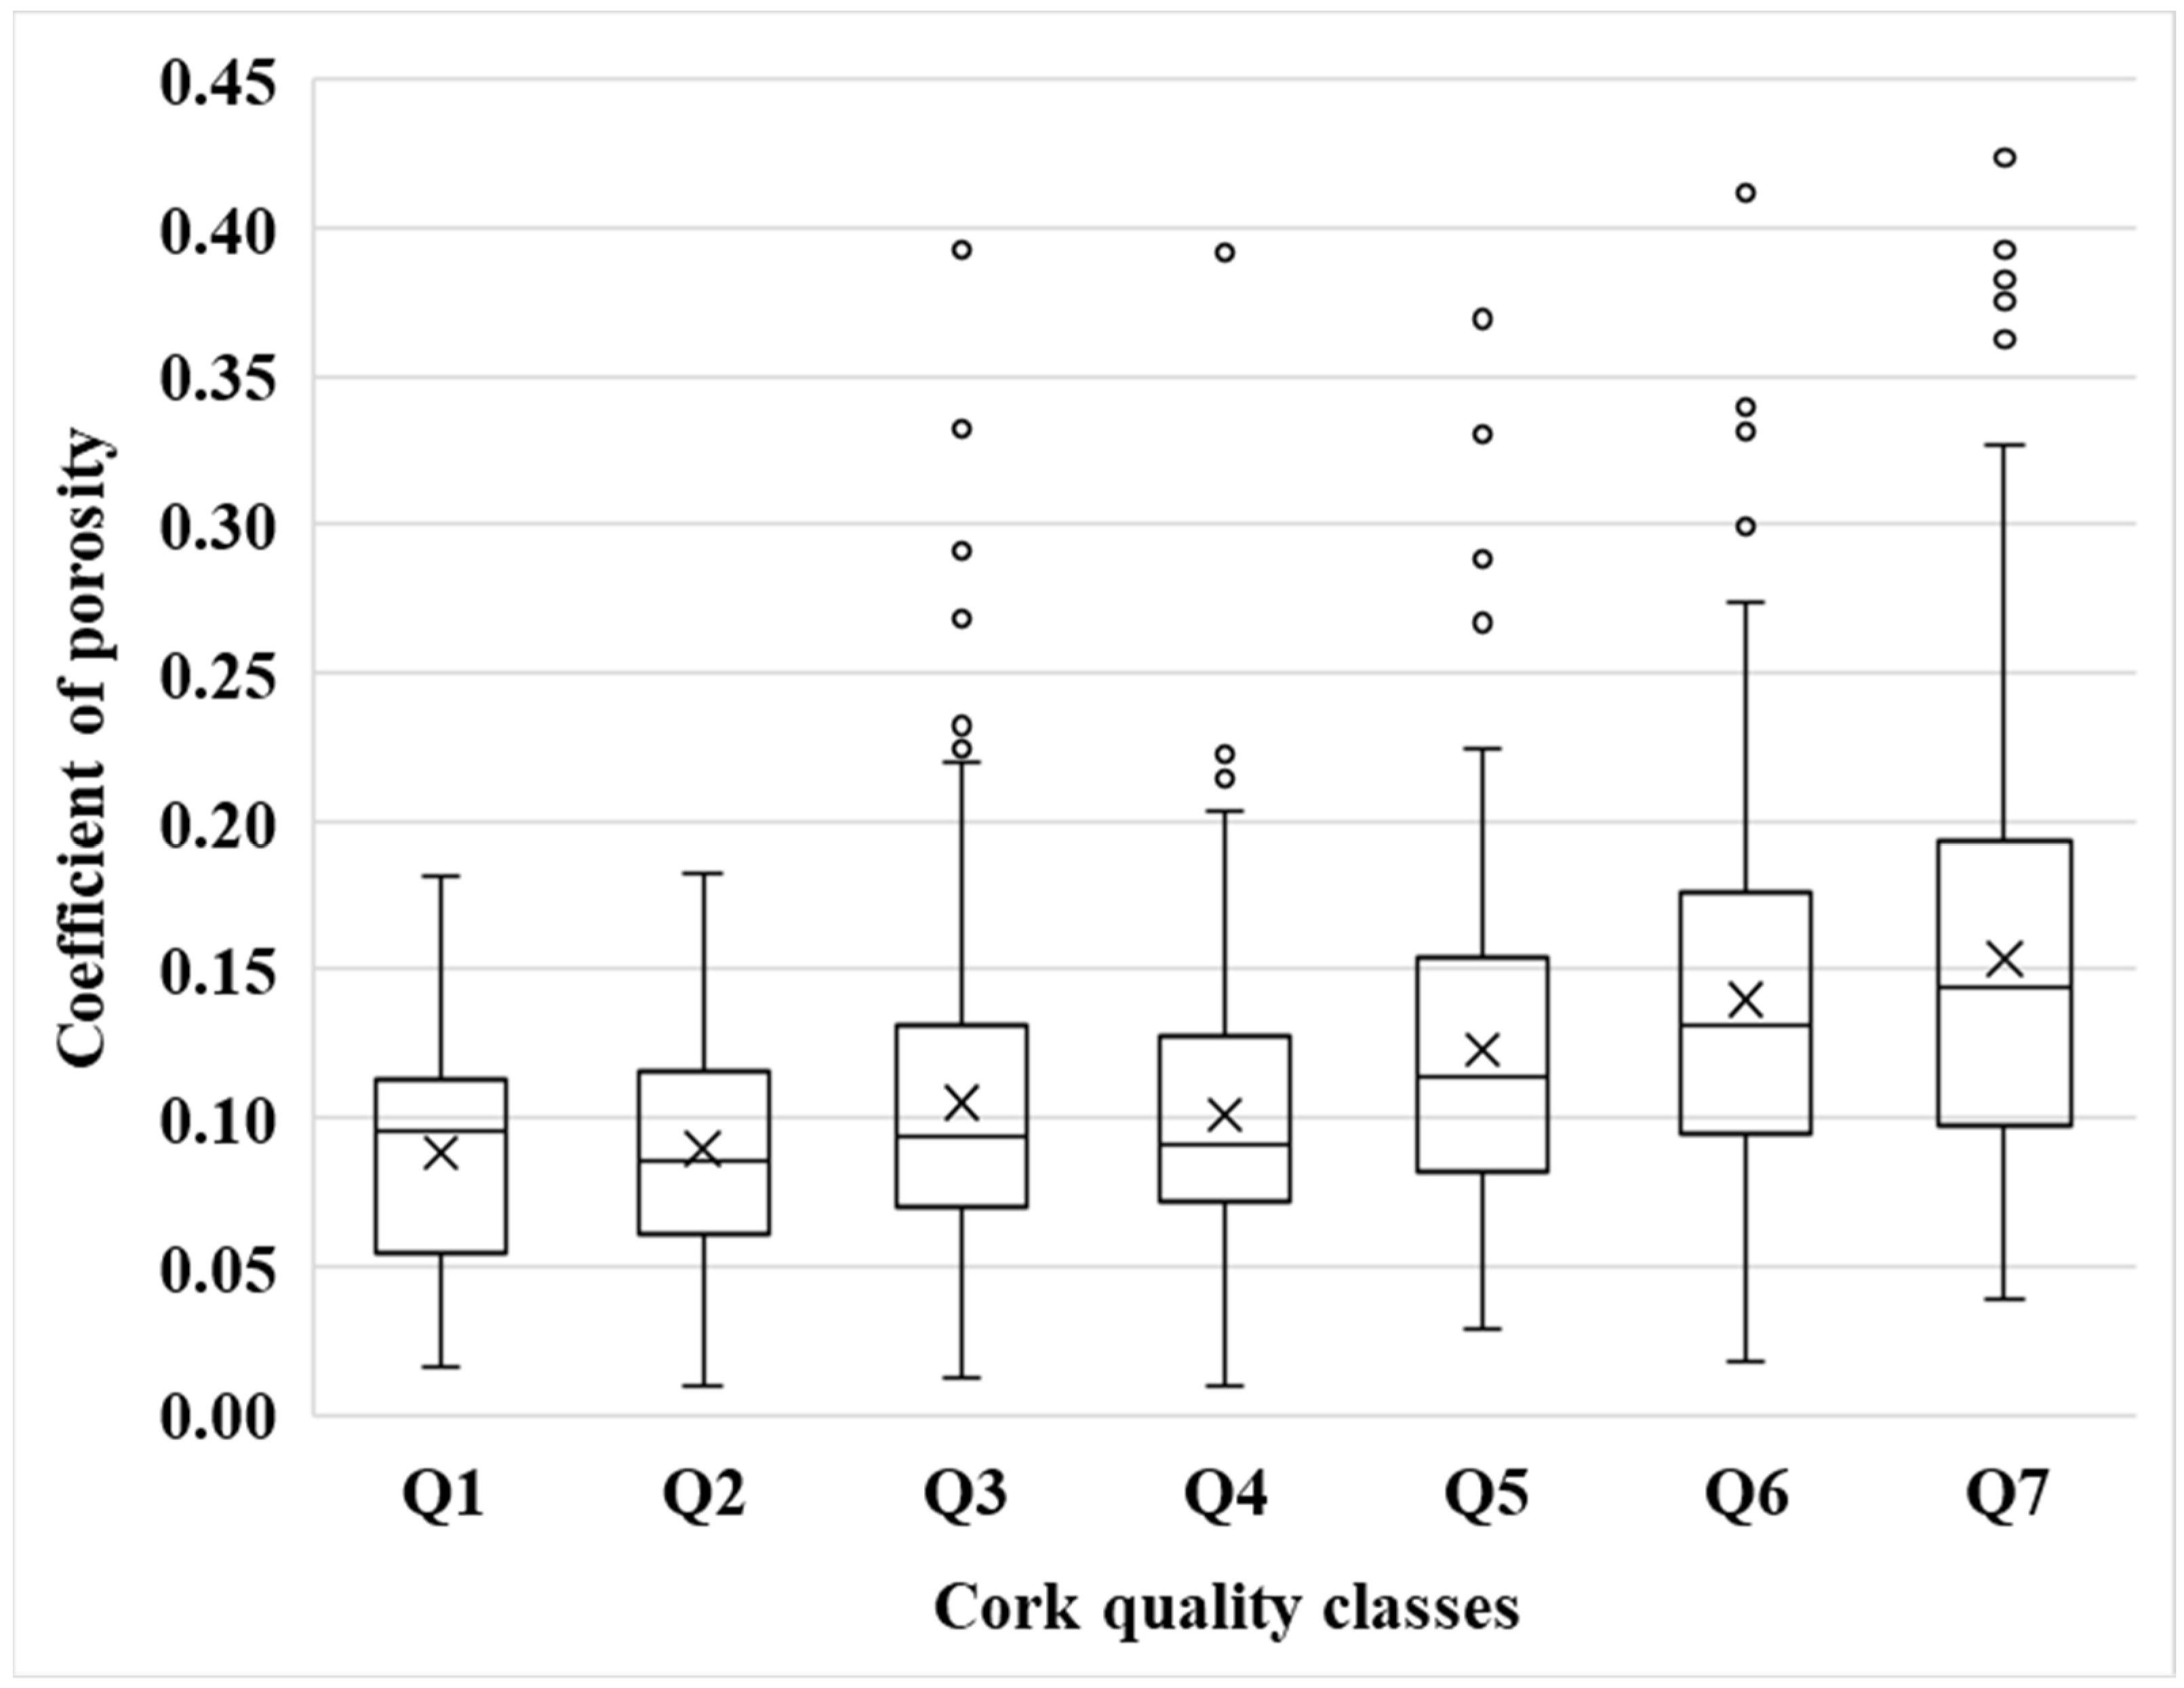
Due to its simplicity, cork quality in the cork industry is still often assessed visually, with industrial quality classes typically numbered from 1 to 7, with 7 being the lowest quality. The NIR-predicted porosity of secondary cork in the different visually assessed quality classes was analyzed. Table 4 shows the porosity coefficients (CPwith galleries) predicted by the NIR-based PLS-R model (Table 3) from 894 secondary cork spectra. The 894 spectra correspond to those obtained from 62 secondary cork strips. The number of samples categorized as outliers was 7.3%; 29% of the outlier spectra are at the limit of the Mahalanobis distance (Md) threshold; 45% exceed the Md threshold by one to two times; and 26% exceed the Md threshold by three to four times. The data were plotted according to seven cork quality classes. Table 4 shows that, as expected, higher-quality corks tend to have lower porosity coefficients, confirming the inverse relationship between porosity and cork quality. In particular, Q1 and Q2 have similar porosity coefficients on average. In addition, Q3 shows a slightly higher porosity coefficient than Q4, which can be attributed to six spectra exceeding 0.225 in porosity and also a higher coefficient of variation (Figure 3).
The porosity coefficients for quality classes Q1 and Q2, as well as Q3 and Q4, are relatively similar, despite being classified into different quality levels. Among these, Q1 exhibits the greatest homogeneity, with a coefficient of variation (CV) of 43.9%, while Q3 displays a higher CV of 54.2%, reflecting greater variability in porosity within that class. Furthermore, Q7 shows a greater number of spectra with porosity values exceeding 0.350 compared to other quality classes (Figure 3).
The confidence intervals indicate the reliability of the average porosity values. Quality class Q4 exhibits the narrowest confidence intervals (e.g., 0.093–0.110 with insect galleries), suggesting high consistency and low uncertainty around the mean. In contrast, Q1 shows broader intervals (e.g., 0.075–0.101 with insect galleries), indicating greater variability in the measurements within that sample group.

4.4. NIR-Predicted Cork Porosity in Mature Cork Visual Quality Classes

The same approach was applied to mature cork, with the porosity of cork samples assigned to different visual quality classes analyzed using the developed NIR models. Table 5 shows the porosity coefficients (CPwith galleries) predicted by the NIR-based PLS-R model (Table 3) from 1102 mature cork spectra. The 1102 spectra correspond to those obtained from 36 mature cork strips. The samples were organized into six cork quality classes, since no cork strips from quality class Q1 were available.
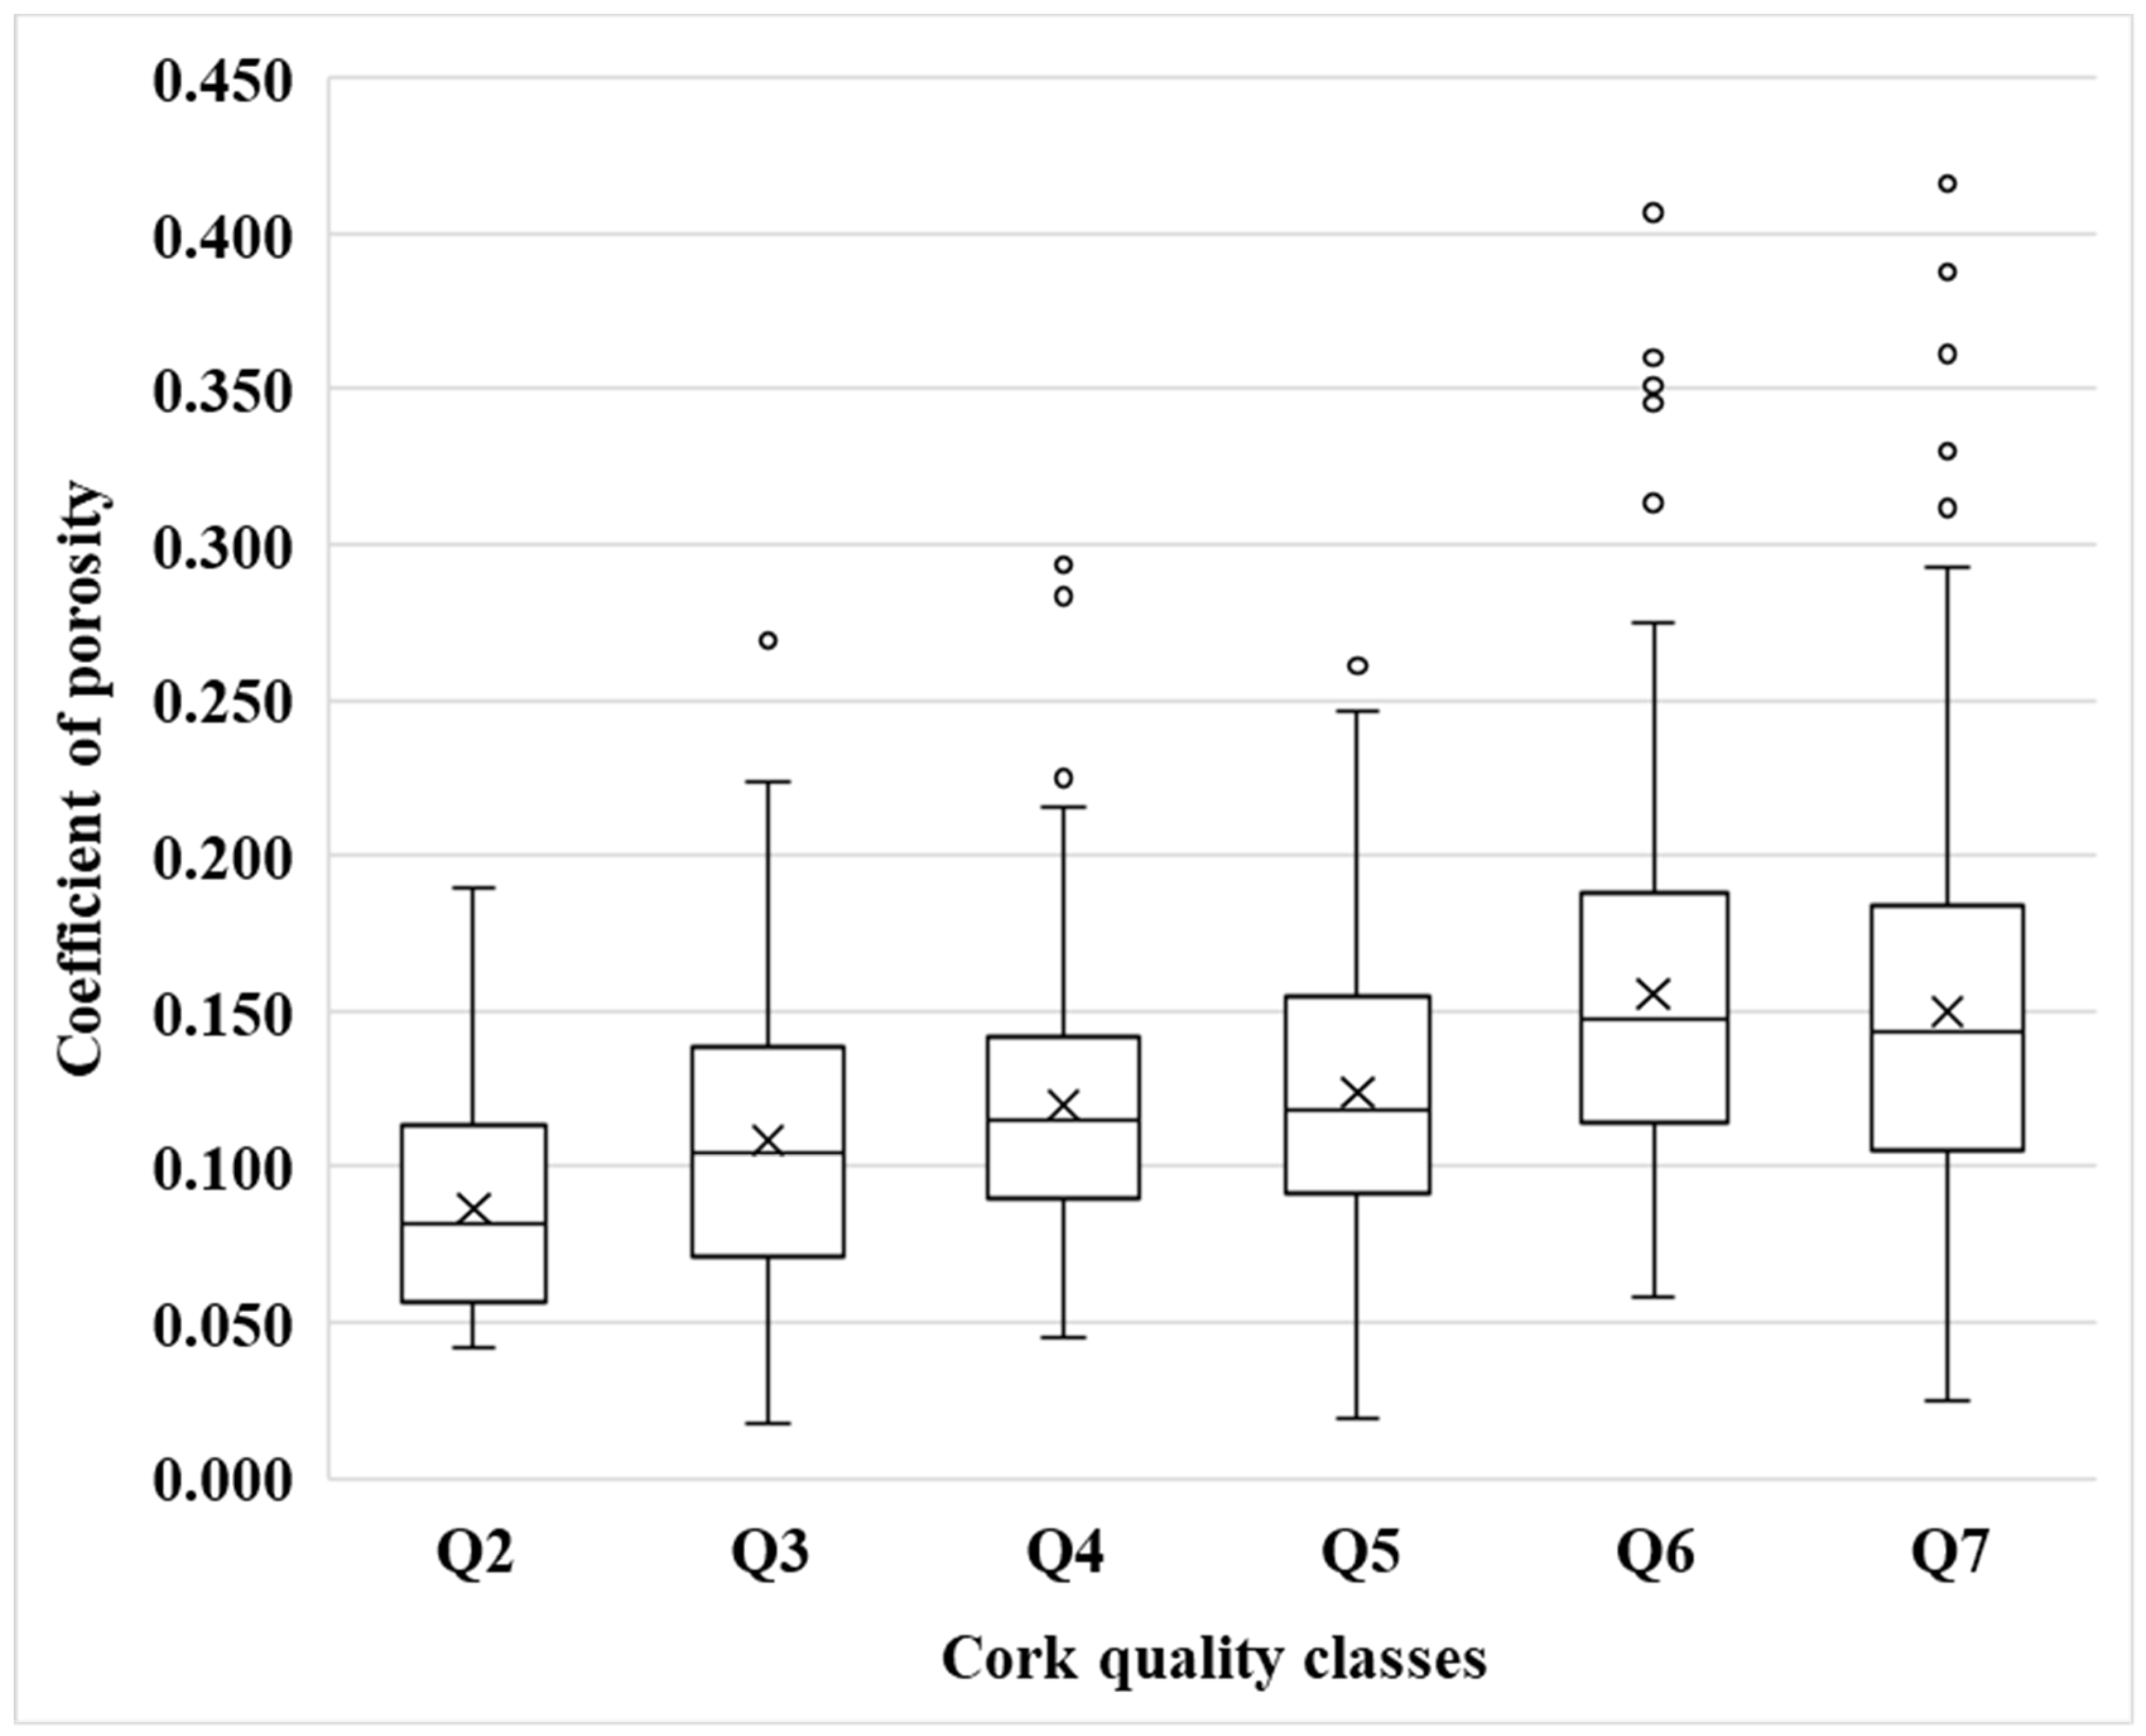
The number of samples categorized as outliers was 8.2%; 18% of the outlier spectra are at the limit of the Mahalanobis distance (Md) threshold; 68% exceed the Md threshold by one to two times; and 14% exceed the Md threshold by three to four times. Table 5 shows that, as expected, higher-quality corks tend to have lower porosity coefficients, confirming the inverse relationship between porosity and cork quality. The analysis of the porosity coefficient across quality levels (Q2–Q7) revealed a general increasing trend in average values, ranging from 0.087 in Q2 to a peak of 0.156 in Q6, followed by a slight decrease to 0.150 in Q7. This suggests an increase in porosity and a decrease in quality level, which could indicate material heterogeneity. On average, the porosity coefficients of Q2 and Q3 are comparable to those of secondary cork. Similarly, Q4 and Q5 have comparable porosity coefficients.
The minimum and maximum values also reflect considerable variability within each quality class, with Q3, Q5, Q6, and Q7 showing particularly broad ranges (e.g., Q7 ranging from 0.025 to 0.418). The standard deviation (STD) increased from 0.036 in Q2 to 0.061 in Q7, supporting the observation of increased spread at less quality levels.
The coefficient of variation (CV) was highest in Q3 (47.2%), indicating high relative variability, while Q4 exhibited the lowest CV (32.5%), suggesting more consistent porosity values within this group. Confidence intervals (95%) were narrowest for Q4 and Q7, pointing to more reliable estimates in this quality category (Table 5 and Figure 4).
Several studies have consistently demonstrated substantial variation in porosity across different cork quality classes. For example, Oliveira et al. (2012) [27] reported that the mean porosity coefficient of the lateral surface of cork stoppers was 2.4% for premium, 4.0% for good, and 5.5% for standard quality classes, with 95% confidence intervals ranging from 2.2–2.5% for premium, 3.7–4.3% for good, and 5.1–5.8% for standard stoppers. Other literature values for porosity coefficients fall within similar ranges, such as 1.6%, 4.6%, and 7.4% reported for superior, standard, and inferior grades, respectively, reflecting that porosity is a major determinant of grade differentiation [28,29]. More recently, Paulo et al. (2023) [22] provided mean and standard deviation values for virgin and secondary cork samples classified as high, medium, or low quality, with porosity coefficients for high-quality virgin cork averaging 0.106 ± 0.038, medium 0.118 ± 0.039, and low 0.119 ± 0.035, while secondary cork samples ranged from 0.080 ± 0.024 in high quality to 0.144 ± 0.037 in low quality. These results reinforce that lower porosity and reduced variability are associated with higher grade cork, across all cork types and industrial sorting practices.
Overall, the data highlight a marked heterogeneity in porosity across visual quality levels, which may be relevant for material performance, durability, or other engineering properties. Further analysis may be necessary to understand the factors driving this variability.

5. Conclusions

This study evaluated the use of NIR spectroscopy in combination with PLS-R modeling to predict porosity in virgin, secondary and mature raw cork samples. Secondary cork consistently had lower porosity than virgin and mature types. An inverse relationship between cork quality and porosity was confirmed, although there was some variability within and between visually defined quality classes.
PLS-R models performed best for mature and secondary cork, with the highest accuracy observed for mature samples. Both models predicting porosity with and without the effect of insect galleries demonstrated robustness, with no detected outliers and consistent ranks across cross-validation and validation phases. The final model (CPwith galleries), with all cork samples (156), using the regions 9500–7500 and 6100–5450 cm−1 with 1stDerVN, resulted in a PLS-R model with five PLS vectors; the coefficient of determination (R2) was 0.61, the RMSECV was 0.025 and the RPD was 1.6. Furthermore, analyzing the PLS loading coefficients provided critical insights into the spectral features underlying model performance. While cork’s inherent structural anisotropy (due to pore orientation) was evident in the preliminary data, the effectiveness of the chosen pre-processing techniques was demonstrated by their capacity to mitigate these directional effects. This allowed for a more robust calibration, regardless of sample alignment.
Porosity analysis of secondary and mature cork samples revealed a consistent inverse relationship between porosity and industrial quality assessed visually by a human operator. Quality class Q1, representing the highest grade of cork, exhibited the lowest porosity and greatest uniformity of all the classes studied. However, mature cork data for Q1 was unavailable. The progressive increase in porosity from Q2 to Q6 in mature cork and the higher variability observed in quality classes such as Q3 and Q7 confirms that porosity is a key factor in the structural and functional differentiation of cork quality. These results emphasize the importance of assessing porosity in cork classification systems and demonstrate the usefulness of NIR-based models for non-destructive evaluation.
Overall, NIR-PLS-R modeling provides a reliable, non-destructive approach to assessing cork porosity, with implications for quality control and resource selection in the cork industry.

Supplementary Materials

The following supporting information can be downloaded at: https://www.mdpi.com/article/10.3390/f16111737/s1, Figure S1. Representative images of cork quality classes (Secondary and Mature cork) and Virgin cork examples.

Author Contributions

Conceptualization, J.A.P., J.G., J.R.; methodology, D.I.S., A.A.; formal analysis, A.A., D.I.S., J.R.; investigation, A.A., D.I.S. and J.A.P.; writing—original draft, A.A. and J.A.P.; writing—review & editing, A.A., D.I.S., J.A.P., J.R. and J.G.; visualization, J.G. and J.R.; supervision, J.A.P., J.R. and J.G.; funding acquisition, J.A.P. All authors have read and agreed to the published version of the manuscript.

Funding

This work was supported by FCT–Fundação para a Ciência e a Tecnologia, I.P., through the projects UID/00239/2025 (DOI:10.54499/UID/00239/2025) and UID/PRR/00239/2025 (DOI:10.54499/UID/PRR/00239/2025) of the Forest Research Centre. Ana Alves was supported by FCT Contract-program No. 2025.CP00039.TENURE (2023.13610.TENURE.001).

Data Availability Statement

Data will be made available on request.

Acknowledgments

The authors would like to acknowledge the valuable contributions of Mariana Ribeiro Telles and Conceição Santos Silva to the classification of cork, and their insightful contributions to discussions on the assessment of cork quality.

Conflicts of Interest

The authors declare no conflict of interest.

References

  1. Pereira, H.; Tomé, M. Non-wood products: Cork Oak. In Encyclopedia of Forest Sciences; Burley, J., Evans, J., Youngquist, J.A., Eds.; Elsevier: Oxford, UK, 2004; pp. 613–620. [Google Scholar]
  2. Pereira, H. The Rationale behind Cork Properties: A Review of Structure and Chemistry. Bioresources 2015, 10, 6207–6229. [Google Scholar] [CrossRef]
  3. Costa, A.; Nunes, L.C.; Spiecker, H.; Graça, J. Insights into the Responsiveness of Cork Oak (Quercus suber L.) to Bark Harvesting. Econ. Bot. 2015, 69, 171–184. [Google Scholar] [CrossRef]
  4. Faias, S.P.; Paulo, J.A.; Tomé, M. Inter-tree competition analysis in undebarked cork oak plantations as a support tool for management in Portugal. New For. 2020, 51, 489–505. [Google Scholar] [CrossRef]
  5. Graça, J.; Pereira, H. The periderm development in Quercus suber. Iawa J. 2004, 25, 325–335. [Google Scholar] [CrossRef]
  6. Pereira, H.; Lopes, F.; Graca, J. The evaluation of the quality of cork planks by image analysis. Holzforschung 1996, 50, 111–115. [Google Scholar] [CrossRef]
  7. Pereira, H. Cork: Biology Production and Uses; Elsevier Science B.V.: Amsterdam, The Netherlands, 2007; pp. 7–31. [Google Scholar]
  8. Fortes, M.A.; Rosa, M.E.; Pereira, H. A Cortiça; IST Press: Lisboa, Portugal, 2004. [Google Scholar]
  9. Prades, C.; García-Olmo, J.; Romero-Prieto, T.; de Ceca, J.L.G.; López-Luque, R. Methodology for cork plank characterization (Quercus suber L.) by near-infrared spectroscopy and image analysis. Meas. Sci. Technol. 2010, 21, 065602. [Google Scholar] [CrossRef]
  10. Demertzi, M.; Paulo, J.A.; Faias, S.P.; Arroja, L.; Dias, A.C. Evaluating the carbon footprint of the cork sector with a dynamic approach including biogenic carbon flows. Int. J. Life Cycle Assess. 2018, 23, 1448–1459. [Google Scholar] [CrossRef]
  11. Lagorce-Tachon, A.; Karbowiak, T.; Loupiac, C.; Gaudry, A.; Ott, F.; Alba-Simionesco, C.; Gougeon, R.D.; Alcantara, V.; Mannes, D.; Kaestner, A.; et al. The cork viewed from the inside. J. Food Eng. 2015, 149, 214–221. [Google Scholar] [CrossRef]
  12. Hor, Y.L.; Federici, J.F.; Wample, R.L. Nondestructive evaluation of cork enclosures using terahertz/millimeter wave spectroscopy and imaging. Appl. Opt. 2008, 47, 72–78. [Google Scholar] [CrossRef]
  13. Sánchez-González, M.; García-Olmo, J.; Prades, C. Correlation between porosity of cork planks before and after boiling using near infrared spectroscopy. Eur. J. Wood Wood Prod. 2016, 74, 509–517. [Google Scholar] [CrossRef]
  14. Inácio, V.; Martins, M.T.; Graça, J.; Morais-Cecílio, L. Cork Oak Young and Traumatic Periderms Show PCD Typical Chromatin Patterns but Different Chromatin-Modifying Genes Expression. Front. Plant Sci. 2018, 9, 1194. [Google Scholar] [CrossRef]
  15. Brunetti, A.; Cesareo, R.; Golosio, B.; Luciano, P.; Ruggero, A. Cork quality estimation by using Compton tomography. Nucl. Instrum. Methods Phys. Res. Sect. B-Beam Interact. Mater. At. 2002, 196, 161–168. [Google Scholar] [CrossRef]
  16. Oliveira, V.; Van den Bulcke, J.; Van Acker, J.; de Schryver, T.; Pereira, H. Cork structural discontinuities studied with X-ray microtomography. Holzforschung 2016, 70, 87–94. [Google Scholar] [CrossRef]
  17. Gonzalez-Adrados, J.R.; Lopes, F.; Pereira, H. Quality grading of cork planks with classification models based on defect characterisation. Holz Als Roh-Und Werkst. 2000, 58, 39–45. [Google Scholar] [CrossRef]
  18. Prades, C.; Gómez-Sánchez, I.; García-Olmo, J.; González-Adrados, J.R. Discriminant Analysis of Geographical Origin of Cork Planks and Stoppers by Near Infrared Spectroscopy. J. Wood Chem. Technol. 2012, 32, 54–70. [Google Scholar] [CrossRef]
  19. Pérez-Terrazas, D.; González-Adrados, J.R.; Sánchez-González, M. Qualitative and quantitative assessment of cork anomalies using near infrared spectroscopy (NIRS). Food Packag. Shelf Life 2020, 24, 100490. [Google Scholar] [CrossRef]
  20. Prades, C.; Gómez-Sánchez, I.; García-Olmo, J.; González-Hernández, F.; González-Adrados, J.R. Application of VIS/NIR spectroscopy for estimating chemical, physical and mechanical properties of cork stoppers. Wood Sci. Technol. 2014, 48, 811–830. [Google Scholar] [CrossRef]
  21. Díaz-Maroto, M.C.; Alarcón, M.; Díaz-Maroto, I.J.; Pérez-Coello, M.S.; Soriano, A. Rapid and non-invasive estimation of total polyphenol content and antioxidant activity of natural corks by NIR spectroscopy and multivariate analysis. Food Packag. Shelf Life 2023, 38, 101099. [Google Scholar] [CrossRef]
  22. Paulo, J.A.; Santos, D.I. Virgin cork colour and porosity as predictors for secondary cork industrial quality. Ind. Crops Prod. 2023, 205, 117513. [Google Scholar] [CrossRef]
  23. Conzen, J. Multivariate Calibration. In A Practical Guide for the Method Development in the Analytical Chemistry; Bruker Optik GmbH: Ettlingen, Germany, 2006; p. 116. [Google Scholar]
  24. Alves, A.; Hevia, A.; Simoes, R.; Majada, J.; Alia, R.; Rodrigues, J. Improving spatial synchronization between X-ray and near-infrared spectra information to predict wood density profiles. Wood Sci. Technol. 2020, 54, 1151–1164. [Google Scholar] [CrossRef]
  25. Rinnan, Å.; van den Berg, F.; Engelsen, S.B. Review of the most common pre-processing techniques for near-infrared spectra. Trac-Trends Anal. Chem. 2009, 28, 1201–1222. [Google Scholar] [CrossRef]
  26. Gómez-Sánchez, I.; de Ceca, J.L.G.; García-Olmo, J.; Lara-Buil, L.; López-Luque, R.; Prades, C. Application of image analysis and NIRS technology to the evaluation of the porosity of planks, sheets and cork stoppers, and its relation with the industrial quality. Maderas-Cienc. Y Tecnol. 2013, 15, 293–309. [Google Scholar] [CrossRef]
  27. Oliveira, V.; Knapic, S.; Pereira, H. Natural variability of surface of porosity of wine cork stoppers of different commercial classes. J. Int. Des Sci. Vigne Vin 2012, 46, 331–340. [Google Scholar] [CrossRef]
  28. Costa, A.; Pereira, H. Influence of vision systems, black and white, colored and visual digitalization, in natural cork stopper quality estimation. J. Sci. Food Agric. 2007, 87, 2222–2228. [Google Scholar] [CrossRef]
  29. Costa, A.; Pereira, H. Quality characterization of wine cork stoppers using computer vision. OENO One 2025, 39, 209–218. [Google Scholar] [CrossRef]
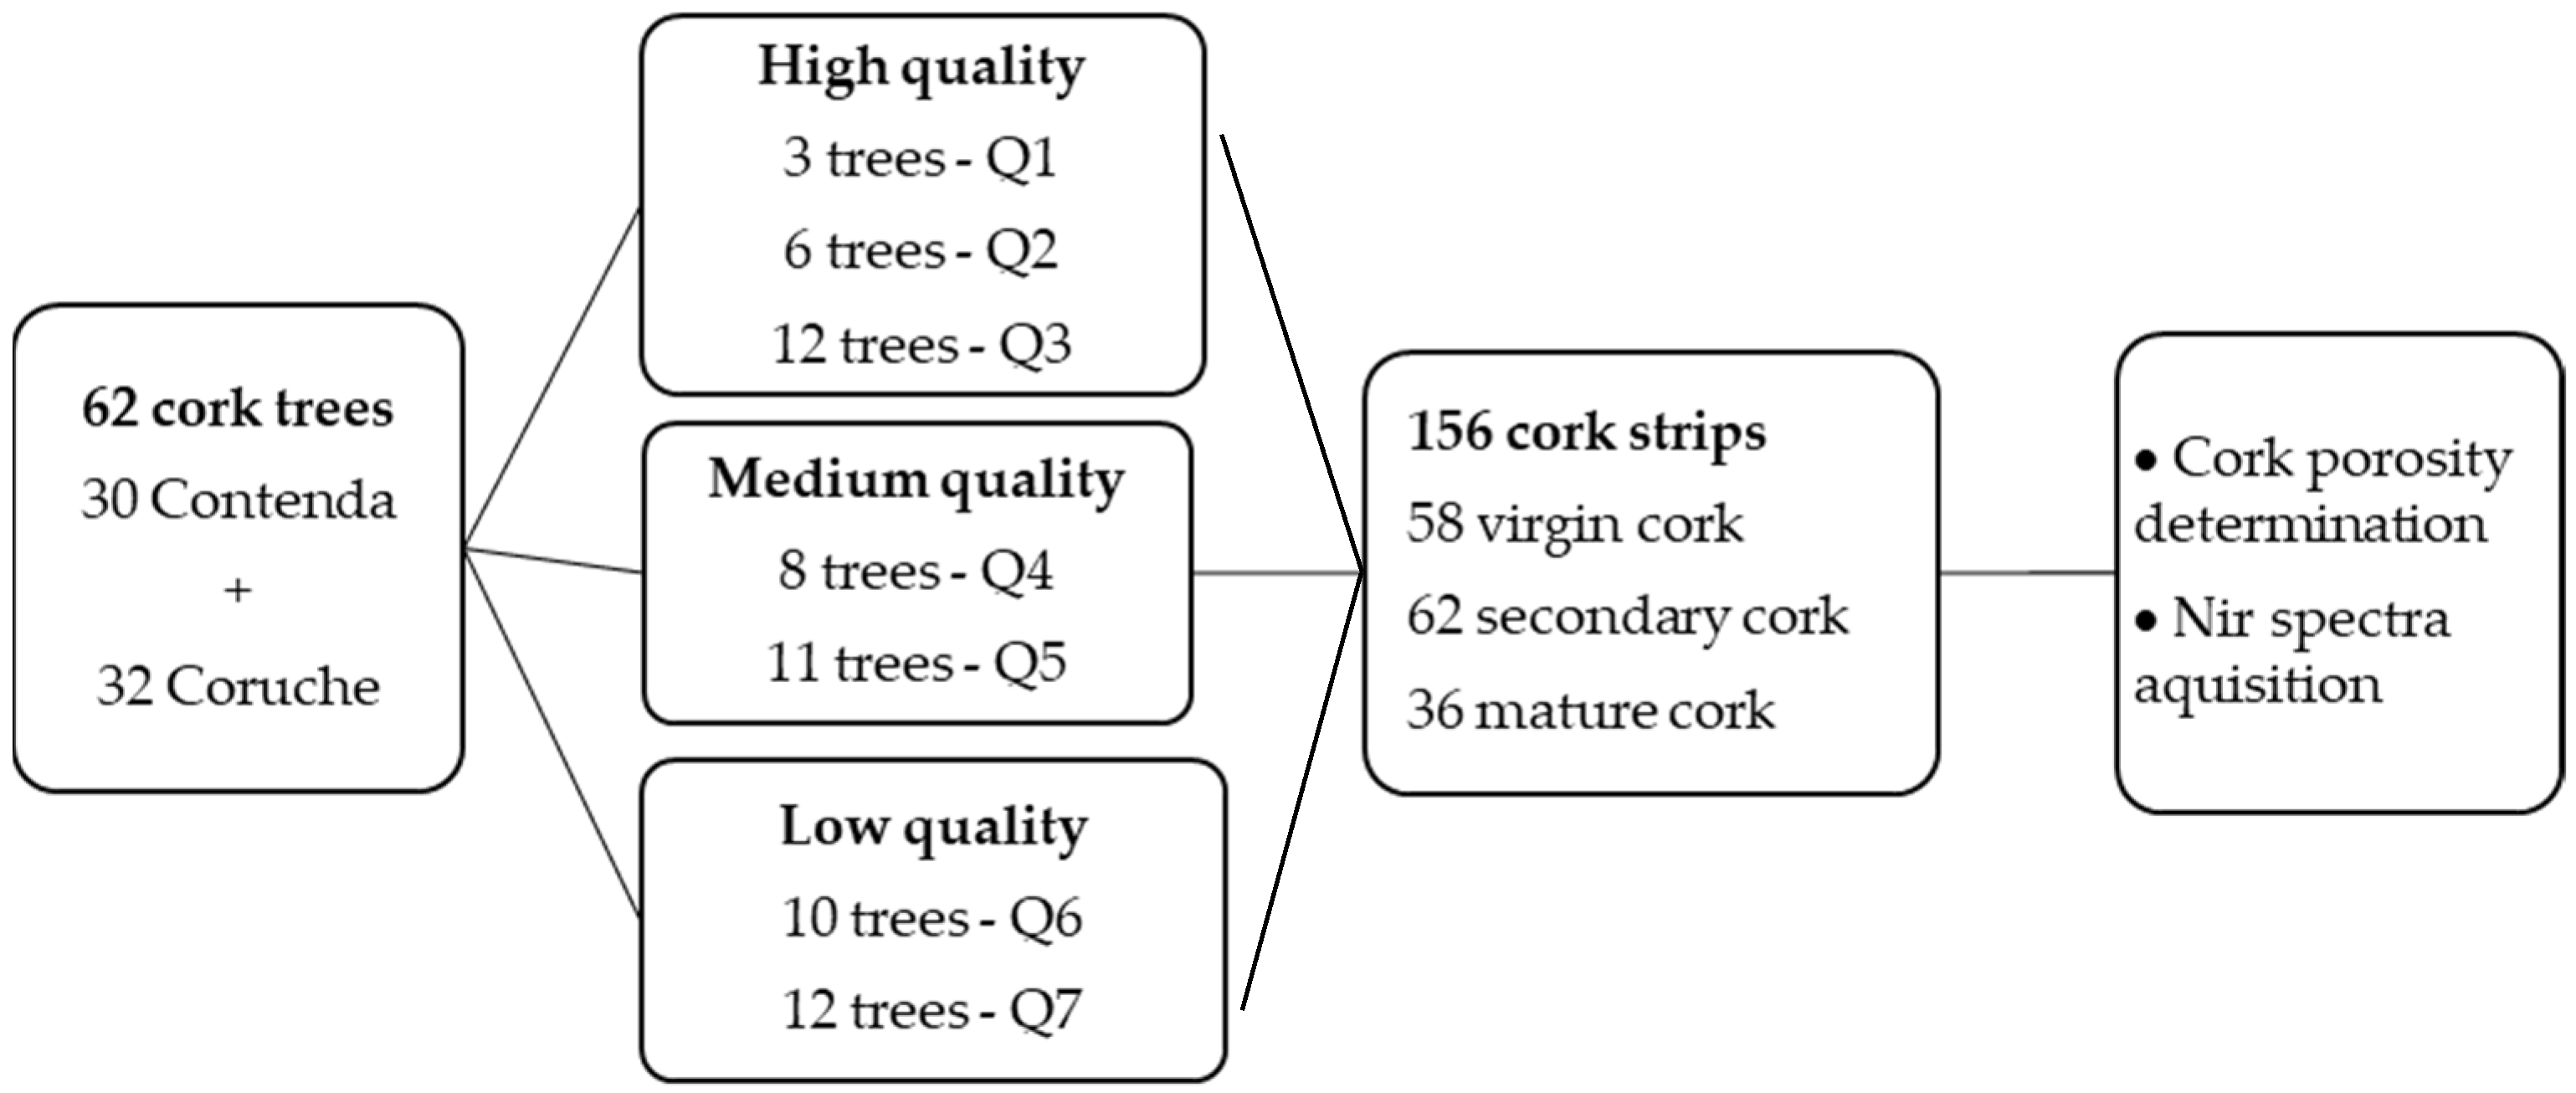
Figure 1. Flow chart of the cork sampling.
Forests 16 01737 g001
Figure 2. Final optimized model (CPwith galleries) for coefficient of porosity determined by image analysis vs. coefficient of porosity predicted by NIR.
Forests 16 01737 g002
Figure 3. Box plot showing the coefficient of porosity for different predicted cork quality classes in secondary cork samples.
Forests 16 01737 g003
Figure 4. Box plot showing the coefficient of porosity for different predicted cork quality classes in mature cork samples.
Forests 16 01737 g004
Table 1. Coefficient of porosity (CP) values for virgin, secondary, and mature cork types with and without insect galleries, as assessed by image analysis.
With Insect GalleriesWithout Insect Galleries
Cork TypeVirginSecondaryMatureTotalVirginSecondaryMatureTotal
Average0.1250.1190.1360.1250.1140.1150.1280.118
Min.0.0490.0340.0830.0340.0430.0340.0830.034
Max.0.2860.2250.2170.2860.2130.2240.2130.224
STD0.040.040.030.040.040.040.030.04
CoeVar (%)33.934.321.731.733.334.022.231.4
CI(0.114; 0.136)(0.109; 0.129)(0.129; 0.143)(0.119; 0.131)(0.104; 0.124)(0.105; 0.125)(0.121; 0.135)(0.112; 0.123)
Min. minimum; Max. maximum; STD standard deviation, CoeVar coefficient of variation; CI 95% confidence interval for average porosity values.
Table 2. Full cross-validation statistics for the coefficient of porosity (CP), individual methods for virgin, secondary and mature cork, with consideration of the effect of insect galleries (with galleries) or without.
ModelPreprocessing Treatment and Wavenumber Range (cm−1)nCross-Validation
R2RMSECVRPDRkOL
CPVwith galleries1stDerVN 9500–6100; 4600–4250580.530.0291.4540
CPV1stDerMSC 6100–5450580.480.0271.3940
CPSwith galleries1stDerMSC 9500–5450; 4600–4424620.610.0251.6050
CPS1stDerMSC 9500–6100; 5450–4250620.550.0261.4450
CPMwith galleries1stDerVN 7500–6100; 5450–4600360.630.0181.6420
CPM1stDerMSC 9400–7500; 5450–4250360.640.0171.6850
n, number of analyzed samples; R2, coefficient of determination; RMSECV, root-mean-square error of cross-validation; RPD, residual prediction deviation; Rk-Rank, number of principal components; OL, outliers.
Table 3. Full cross-validation and validation statistics for the coefficient of porosity (CP) for all cork samples (virgin, secondary and mature) are presented, with consideration of the effect of insect galleries (with galleries) or without.
ModelnCross-Validation 60%Validation 40%
R2RMSECVRPDRkOLR2RMSEPRPDRkOL
CPwith galleries1560.630.0251.64500.460.0281.3650
CP1560.510.0251.42500.520.0261.4550
RMSEP, root-mean-square error of prediction.
Table 4. Coefficients of porosity with insect galleries for secondary cork samples, assigned to visual quality classes, as predicted by NIR-based PLS-R models (Table 3).
Coefficient of Porosity
QualityTotal spectraAverageMin.Max.STDCoeVar (%)CI
Q1330.0880.0160.1820.03943.9(0.075; 0.101)
Q2660.0900.0100.1820.04145.5(0.080; 0.100)
Q31620.1050.0130.3930.05754.2(0.096; 0.114)
Q41260.1010.0100.3920.05049.0(0.093; 0.110)
Q51470.1230.0290.3690.05746.2(0.114; 0.132)
Q61670.1400.0180.4120.06345.3(0.130; 0.149)
Q71930.1540.0390.4240.07447.9(0.143; 0.164)
Min. minimum; Max. maximum; STD standard deviation, CoeVar coefficient of variation; CI 95% confidence interval for average porosity values.
Table 5. Coefficients of porosity with insect galleries for mature cork samples, assigned to visual quality classes, as predicted by NIR-based PLS-R models (Table 3).
Coefficient of Porosity
QualityTotal SpectraAverageMin.Max.STDCoeVar (%)CI
Q1n.a.n.a.n.a.n.a.n.a.n.a.n.a.
Q2190.0870.0420.1900.03641.5(0.071; 0.103)
Q31320.1090.0180.2740.05147.2(0.100; 0.117)
Q41890.1200.0450.2940.03932.5(0.114; 0.126)
Q51140.1240.0190.2620.05241.8(0.115; 0.134)
Q61990.1560.0580.4070.05837.3(0.148; 0.164)
Q74490.1500.0250.4180.06140.4(0.144; 0.156)
Min. minimum; Max. maximum; STD standard deviation, CoeVar coefficient of variation; CI 95% confidence interval for average porosity values; n.a. no samples were available for quality class Q1.
Disclaimer/Publisher’s Note: The statements, opinions and data contained in all publications are solely those of the individual author(s) and contributor(s) and not of MDPI and/or the editor(s). MDPI and/or the editor(s) disclaim responsibility for any injury to people or property resulting from any ideas, methods, instructions or products referred to in the content.