Article

The Influence of Forest Naturalness on Soil Carbon Content in a Typical Semi-Humid to Semi-Arid Region of China’s Loess Plateau

1
New Energy Business Division I, Shandong Electric Power Engineering Consulting Institute Co., Ltd., Jinan 250013, China
2
Technology Research Center for Pollution Control and Remediation of Northwest Soil and Groundwater, College of Earth and Environmental Sciences, Lanzhou University, Lanzhou 730000, China
*
Author to whom correspondence should be addressed.
Forests 2025, 16(11), 1732; https://doi.org/10.3390/f16111732 (registering DOI)
Submission received: 7 October 2025 / Revised: 12 November 2025 / Accepted: 13 November 2025 / Published: 15 November 2025
(This article belongs to the Special Issue Soil Organic Matter Dynamics in Forests)

Abstract

The Loess Plateau (China) is an ecologically fragile region where understanding the impact of forest naturalness on soil carbon content is critical for ecological restoration and enhancing carbon sequestration. This study investigates this relationship in the Cuiying Mountain area (Yuzhong County, Lanzhou City), a representative landscape of the semi-arid Loess Plateau. The Cuiying Mountain ecosystem is characterized by coniferous forests and Gray-cinnamon soils. We assessed forest naturalness using several key indicators: herb coverage, shrub coverage, tree biodiversity, and stand structural attributes. The results revealed a generally low level of forest naturalness at Cuiying Mountain. Although herb coverage was high, shrub coverage was minimal (2.1%), and tree biodiversity was low (Shannon index = 0.09). The stand structure was simple, characterized by considerable variation in individual tree sizes and a single canopy layer (mean mingling degree = 0.14). This structural simplicity aligns with the area’s history of plantation management. Furthermore, analysis of soil physicochemical properties and their relationship with plant diversity identified plant diversity as a significant factor influencing soil carbon content. The strongest correlation was observed between plant species number and topsoil organic carbon (r = 0.77), indicating a particularly pronounced effect of plant diversity on surface soil organic carbon. In summary, while forest naturalness at Cuiying Mountain is generally low, increased plant diversity enhances the accumulation of litter/root exudates and carbonates, suggesting that enhancing plant diversity is an effective strategy for increasing total soil carbon content. This study provides valuable insights for refining ecological restoration practices and strengthening the soil carbon sink function in forest ecosystems across the Loess Plateau and similar semi-arid regions.

1. Introduction

Soils represent a vast global carbon reservoir, storing three times more carbon than the atmosphere and two to four times more than terrestrial vegetation [1]. Consequently, even minor fluctuations in the soil carbon pool can significantly influence the global carbon cycle, alter atmospheric CO2 concentrations, and disrupt the planetary carbon balance [2,3,4]. These disruptions have profound implications for the global climate, driving critical environmental issues such as global warming. Forests, as a core component of the terrestrial ecosystem, provide a crucial carbon sink and deliver indispensable services for maintaining ecological equilibrium [5,6,7]. Therefore, accurately assessing soil carbon stocks and their dynamics across different regions and forest types is essential for designing and implementing targeted ecological conservation and restoration strategies.
Species diversity plays a critical role in regulating ecosystem stability, serving as a key determinant of both ecosystem productivity and stability [8]. It influences soil carbon storage primarily through pathways such as litter input [9], root exudate release [10], and microbial interactions [11]. Evidence indicates that ecosystems with high plant diversity typically exhibit greater productivity, supplying more organic matter and nutrients, which in turn enhances soil quality and promotes nutrient cycling [9,12,13]. Research from the German Jena Experiment demonstrates that increased plant richness enhances carbon input from roots to soil microbial communities, thereby boosting microbial activity and soil carbon storage [14]. Furthermore, highly diverse plant communities promote the formation of mineral–organic associations, which improves soil carbon retention capacity [15]. In addition, variations in tree species composition directly affect recalcitrant compound dynamics—such as lignin content and polyphenols—and soil carbon-to-nitrogen ratios (C/N), consequently influencing the quality and stability of soil carbon sequestration [16]. Unraveling the impact of plant diversity on forest carbon stocks is therefore essential for improving forest management and addressing global change.
The Loess Plateau, located in China’s semi-humid to semi-arid region, is the world’s largest loess deposit. It is a typically fragile ecosystem that has long been subjected to severe soil erosion [17]. In this region, Soil Inorganic Carbon (SIC) is the dominant form of soil carbon [18,19]. Data indicate that the density of SIC in the plateau’s soils is approximately four times that of Soil Organic Carbon (SOC), making it one of China’s most significant SIC reservoirs [20,21]. Despite the predominance of soil inorganic carbon (SIC), the vast majority of research on forest carbon sequestration has focused on soil organic carbon [22,23]. Consequently, the dynamics of SIC and its relationship with plant diversity and total soil carbon in semi-arid forests remain poorly understood. Therefore, this study addresses this gap by focusing on the unique context of the Loess Plateau—a semi-arid, fragile ecosystem dominated by SIC. We specifically investigate the coupling relationships between forest plant diversity and both SIC and SOC, thereby providing novel insights into the species diversity-soil carbon dynamic in SIC-dominated semi-arid forests.
The Cuiying Mountain area in Yuzhong County, Gansu Province, exemplifies the typical loess ridge-mountain landscape of the plateau. The health of its forest ecosystems is crucial for maintaining local and regional ecological balance [24,25]. Historically, the area had sparse vegetation dominated by herbaceous plants, resulting in limited ecological functionality. In recent years, initiatives led by Lanzhou University and local authorities have combined artificial greening projects with the preservation of natural vegetation. This integrated approach has created a restoration model that merges human-assisted rehabilitation with natural regeneration, leading to significant ecosystem improvement [26]. Consequently, the landscape now comprises a mosaic of natural and plantation forests, providing an ideal setting to investigate the relationship between forest naturalness and soil carbon sequestration [27].
Total soil carbon plays a critical role in global ecological change. Unraveling its relationship with plant diversity is therefore vital for informing ecological restoration. However, research on these dynamics in semi-arid forests remains limited. Therefore, this study aims to address the following key questions: (1) to develop a multi-dimensional assessment framework for forest naturalness that integrates herb coverage, shrub coverage, tree biodiversity, and local stand structural attributes; (2) to examine the relationship between plant diversity and soil carbon content at different depths in the cinnamon soil profile [28]. This research will advance our understanding of how species diversity in arid regions regulates soil nutrient cycling via carbon dynamics, providing a theoretical basis for optimizing plantation structures and enhancing soil carbon storage. Ultimately, these insights will offer practical guidance for regional ecological restoration and forest carbon management.

2. Materials and Methods

2.1. Study Area

The study area is located on Cuiying Mountain in Yuzhong County, Lanzhou City, Gansu Province, China (104°08′14″ E–104°08′37″ E, 35°56′36″ N–35°56′40″ N), covering a total area of 3.49 hectares. Cuiying Mountain features a typical loess ridge landform of the Loess Plateau, located at the convergence of the Loess Plateau, the Inner Mongolian Plateau, and the northeastern Tibetan Plateau. The region has a temperate semi-arid continental climate, with a mean annual temperature ranging from 6 to 10 °C and a long-term average precipitation of 350 mm. The soils in the study area are classified as Gray-cinnamon soil according to the Classification and Codes for Chinese Soil, which corresponds to Calcisols in the World Reference Base for Soil Resources (WRB) system. These soils are characterized by an alkaline pH and a distinct subsurface layer of calcium carbonate accumulation (calcic horizon), formed under the arid and semi-arid conditions of the region. The natural vegetation is predominantly composed of xerophytic, psammophytic, and halophytic perennial herbs, shrubs, and tree species. Representative native plants include conifers (e.g., Pinus spp.), sagebrush (e.g., Artemisia spp.), needlegrass (Achnatherum splendens), and goosegrass (Eleusine indica). These species form diverse plant communities with associated companion species, creating an integrated ecosystem that plays a vital role in windbreaking, sand fixation, soil and water conservation, and maintaining ecological balance.

2.2. Sample Collection and Processing

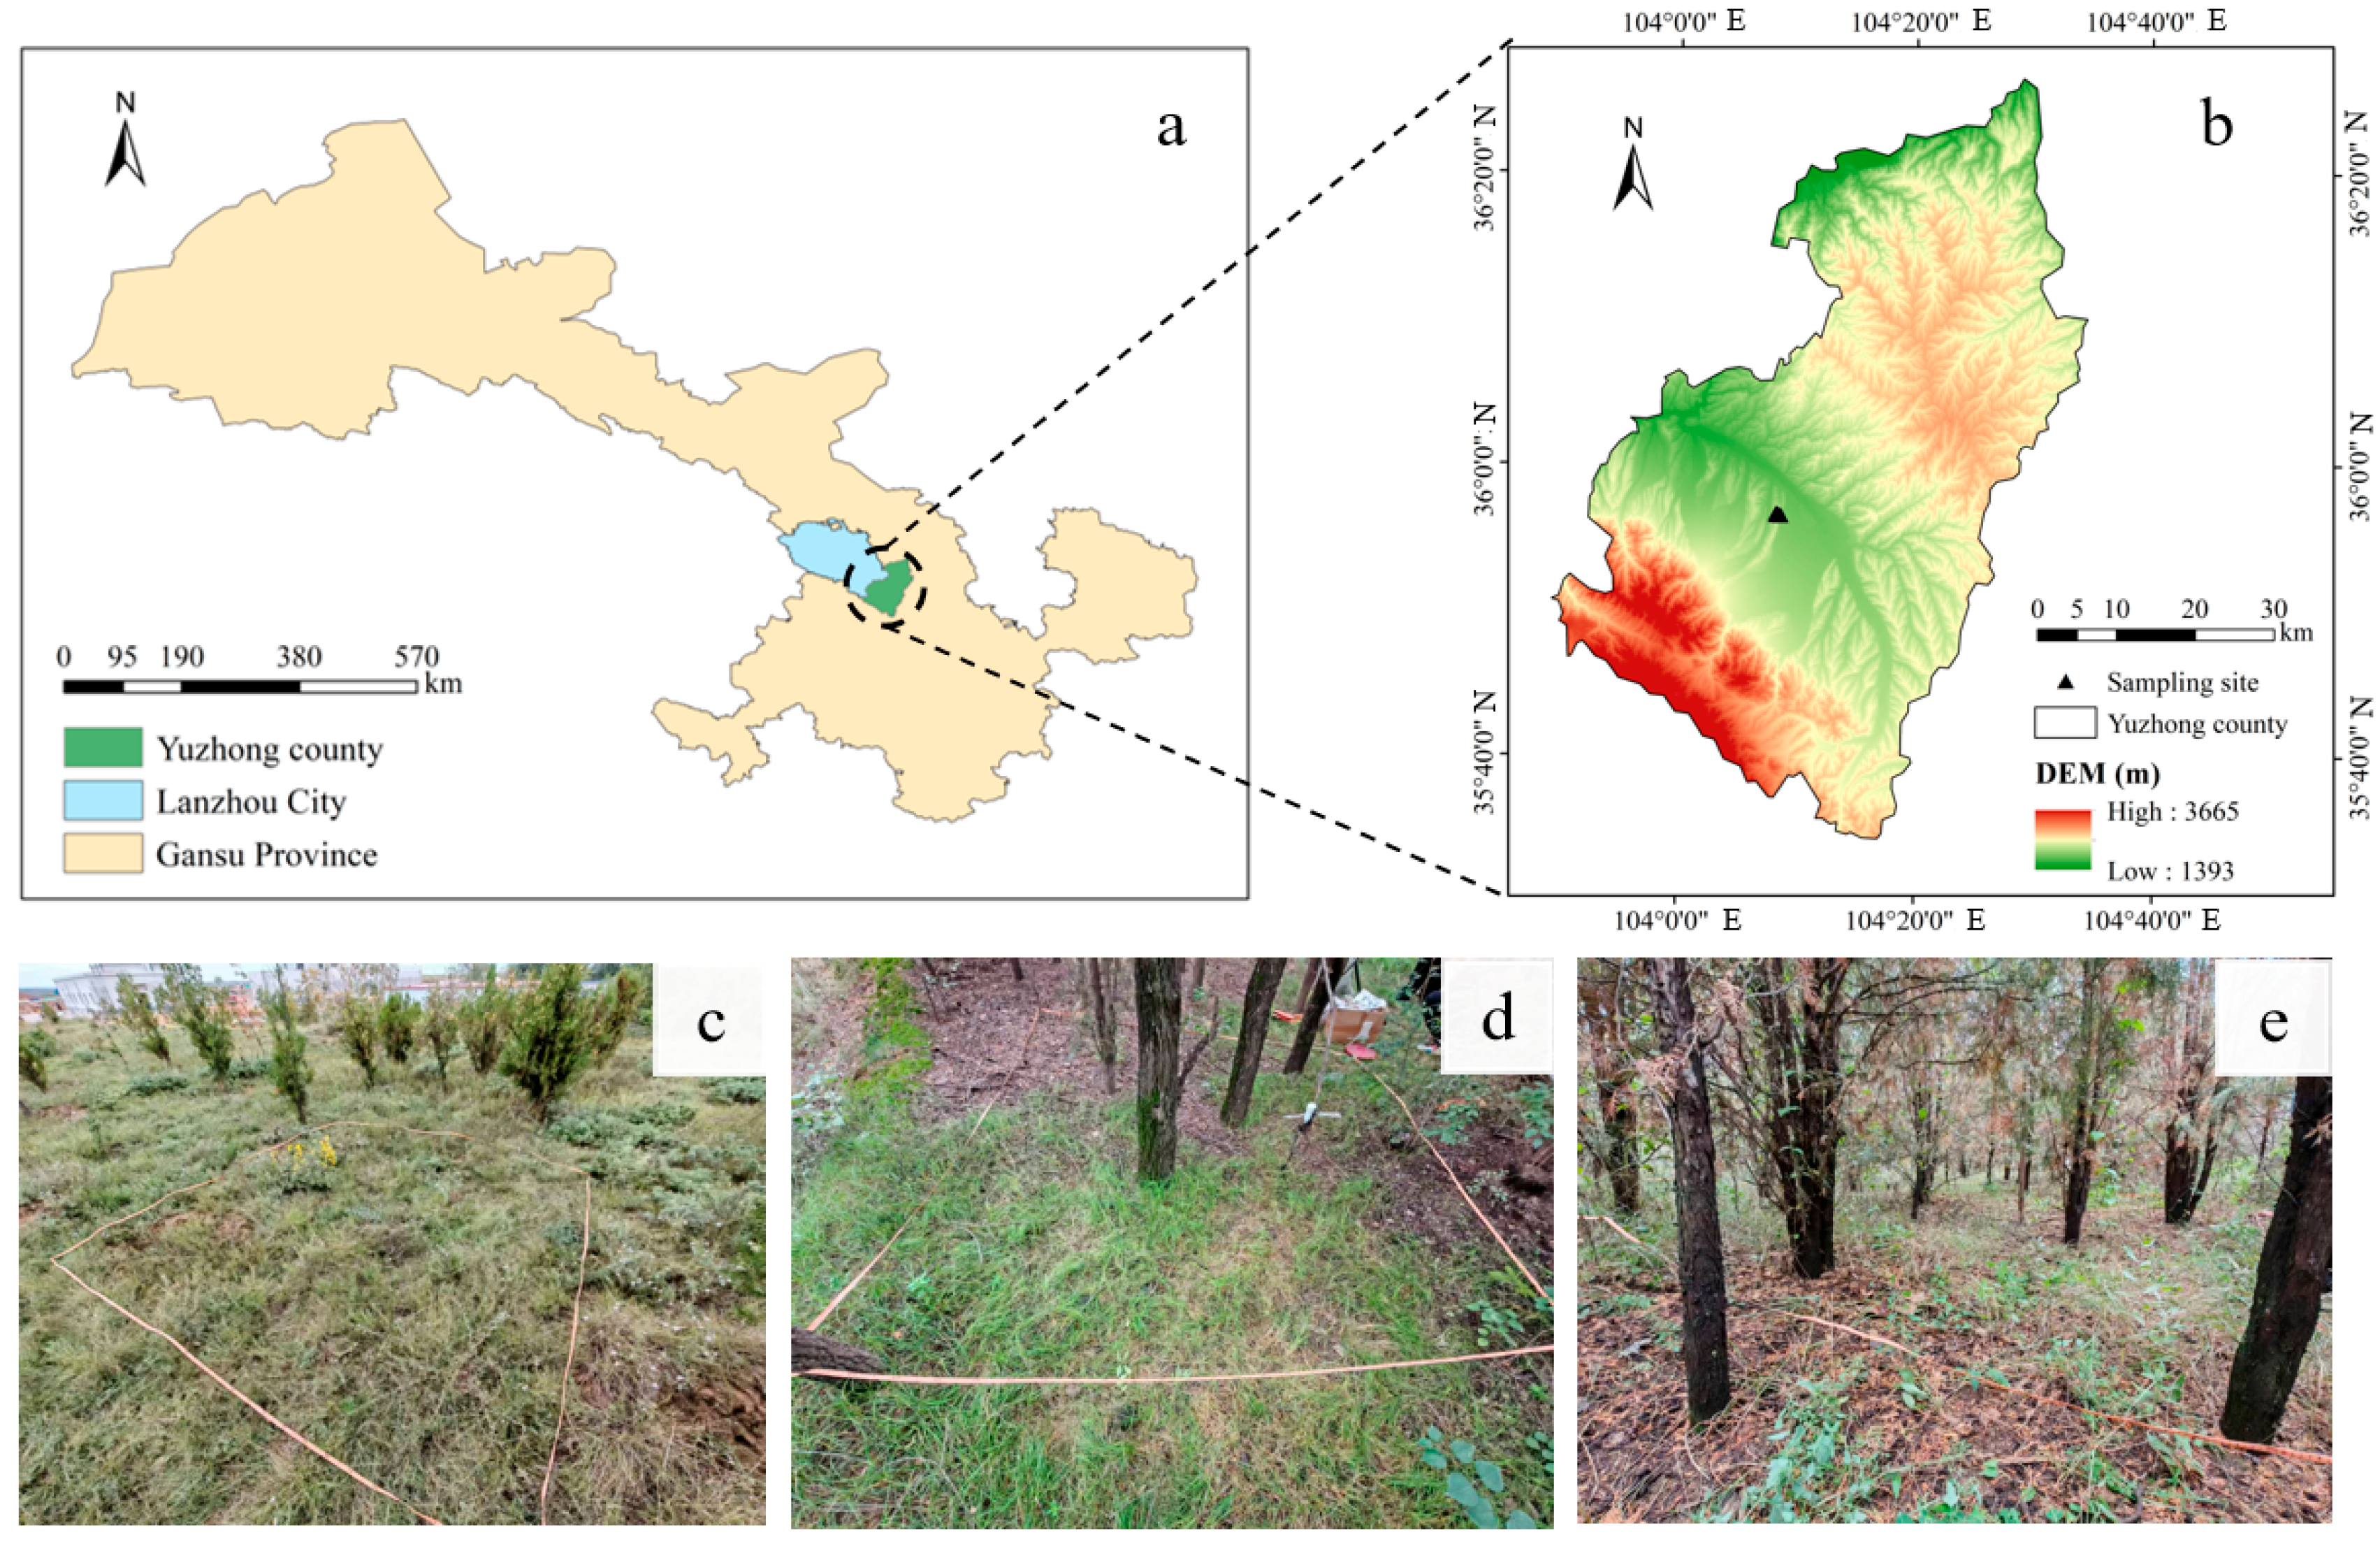
In September 2024, ten sampling sites (Y1–Y10) were established along a hillslope transect from the hilltop to the footslope within the Cuiying Mountain study area (Figure 1). These sites were strategically placed away from human settlements and distributed to represent the area’s primary features. At each sampling site, a 10 m × 10 m plot was established, resulting in a total sampled area of 1000 m2, which accounted for 2.9% of the total study area. Within each plot, we documented plant community characteristics, including species identity, individual count, plant height, and tree diameter at breast height (DBH). Each plot was subdivided into four 5 m × 5 m quadrats. A soil profile was excavated at the center of each quadrat, and a one-meter deep soil sample was collected using a profile sampler. A quartering method was employed to obtain a representative sub-sample, which was then sealed and transported to the laboratory. Prior to analysis, the soils were air-dried, and any stones, plant residues, and roots were removed. The samples were subsequently ground and sieved through 2 mm and 0.149 mm meshes for physicochemical analysis. Basic information for the sampling sites is provided in Table 1. Soil types were identified and classified based on the Classification and Codes for Chinese Soil [28].

2.3. Development of the Forest Naturalness Assessment Framework

Community composition in this study was characterized by three key indicators: herb coverage, shrub coverage, and tree layer biodiversity. Herb coverage, defined as the proportion of ground covered by herbaceous plants, is expressed as a percentage. Similarly, shrub coverage represents the areal extent of shrub vegetation and is also quantified as a percentage [29]. Biodiversity within the tree layer was quantified using the Shannon Index, which incorporates both species richness and the evenness of individual distribution among species. The index was calculated as follows [30]:
H =   i   =   1 s P i ln P i
where H′ is the tree layer biodiversity index (Shannon Index), S is the total number of tree species, and Pi is the proportion of individuals belonging to the i-th species relative to the total number of trees in the stand.
The structural characteristics of the tree layer were characterized by the coefficient of variation of diameter at breast height (CVDBH) and the mean mingling degree ( M ¯ ). The CVDBH measures the relative variability in tree diameters at breast height (DBH, measured at 1.3 m above ground) within a given area and is expressed as the relative standard deviation. It was calculated as follows [31]:
C V D B H   =   σ D B H μ D B H
where CVDBH is the coefficient of variation for diameter at breast height, σ D B H is the standard deviation of DBH, and μ D B H is the mean DBH.
The degree of species segregation in the mixed forest was characterized using a spatial species mingling metric, calculated as the mean mingling degree for all trees in the stand [32]. The formula is as follows:
M i   =   1 n   j   =   1 n V ij
M ¯ = 1 N   i   = 1 N M i
where Mi is the mingling degree of the i-th subject tree, n is the number of its nearest neighbors, and vij is an indicator variable that equals 1 if the j-th neighboring tree is a different species from the subject tree i, and 0 otherwise. The mean mingling degree for the entire stand, M ¯ , was calculated as the average of Mi across all N subject trees surveyed in the stand.
Within each plot, herb coverage was measured by randomly placing five 1 m × 1 m quadrats. The vertical projected area of herbaceous plants was determined in each quadrat, and the average value across the five quadrats was calculated to represent the plot’s herb coverage. Similarly, shrub coverage was assessed using three randomly placed 2 m × 2 m quadrats. The tree layer diversity index was calculated by recording all trees with a diameter at breast height (DBH) ≥ 5 cm, including their species identity and individual counts. The proportion of each species relative to the total number of trees was then computed and used to calculate the Shannon index (H′). The standard deviation of DBH was calculated from all measured trees across the plots. The coefficient of variation of DBH (CVDBH) was then derived as the ratio of this standard deviation to the mean DBH. Finally, the mean mingling degree ( M ¯ ) was determined for each plot. For every tree, its mingling degree was calculated based on the species of its n nearest neighbors (awarding 1 point for a different species and 0 for the same species), as defined in Formula (3). The mean mingling degree for the plot was the average of all individual tree values.

2.4. Laboratory Analysis of Soil Properties

Soil physicochemical properties were analyzed following the procedures outlined in “Soil Agricultural Chemistry Analysis” [33]. Soil pH and electrical conductivity (EC) were measured in a 1:2.5 soil-to-water suspension at room temperature using a pH meter (PHS-3E, Leici, INESA, Shanghai, China) and an EC meter (HI 98311, HANNA Instruments, Villafranca Padovana, Italy), respectively. Soil organic carbon (SOC) was determined by the potassium dichromate oxidation method [34], and soil carbonate (CaCO3) content was measured via volumetric titration [35]. Triplicate measurements were conducted for each specified parameter on every soil sample to ensure analytical precision.

2.5. Data Processing

Data processing, statistical analysis, and standardization were performed using Microsoft Excel 2021. A one-way ANOVA was used to assess differences in soil properties across depths, while the Kruskal–Wallis test was employed to evaluate variations among plots. The relationships between plant species number and soil carbon content were examined using regression analysis, while Pearson’s correlation analysis was used to assess the association between plant diversity and soil carbon. Post hoc multiple comparisons were conducted using the Least Significant Difference (LSD) test, with a significance level of p < 0.05. Graphs and charts were generated using OriginPro 2021, and the sampling location map was created with ArcMap 10.8.1.

3. Results

3.1. Plant Information

Within each quadrat, we recorded plant species, abundance, and dimensions (with DBH measured for trees). The dominant species in each quadrat were identified based on an integrated analysis of plant abundance and volume, as summarized in Table 2.
The vegetation survey recorded 16 plant species in the study area (Table 3). The community was predominantly composed of herbaceous Magnoliopsida (dicotyledons), representing 12 species (75%), while Liliopsida (monocotyledons), including grasses and a geophyte, accounted for the remaining four species (25%). The prevalence of drought-tolerant species (e.g., Artemisia spp., Salsola collina) and the presence of a conifer indicate adaptation to the local semi-arid conditions.

3.2. Forest Naturalness Indicators

The mean values of herb coverage, shrub coverage, and the tree diversity index across all plots are presented in Table 4. The structural characteristics of the trees are summarized in Table 5.

3.3. Soil Physicochemical Properties

The results of the soil physicochemical property analysis (pH, electrical conductivity, carbonate, and organic carbon) are detailed in Table 6, Table 7, Table 8 and Table 9.

3.4. Soil pH

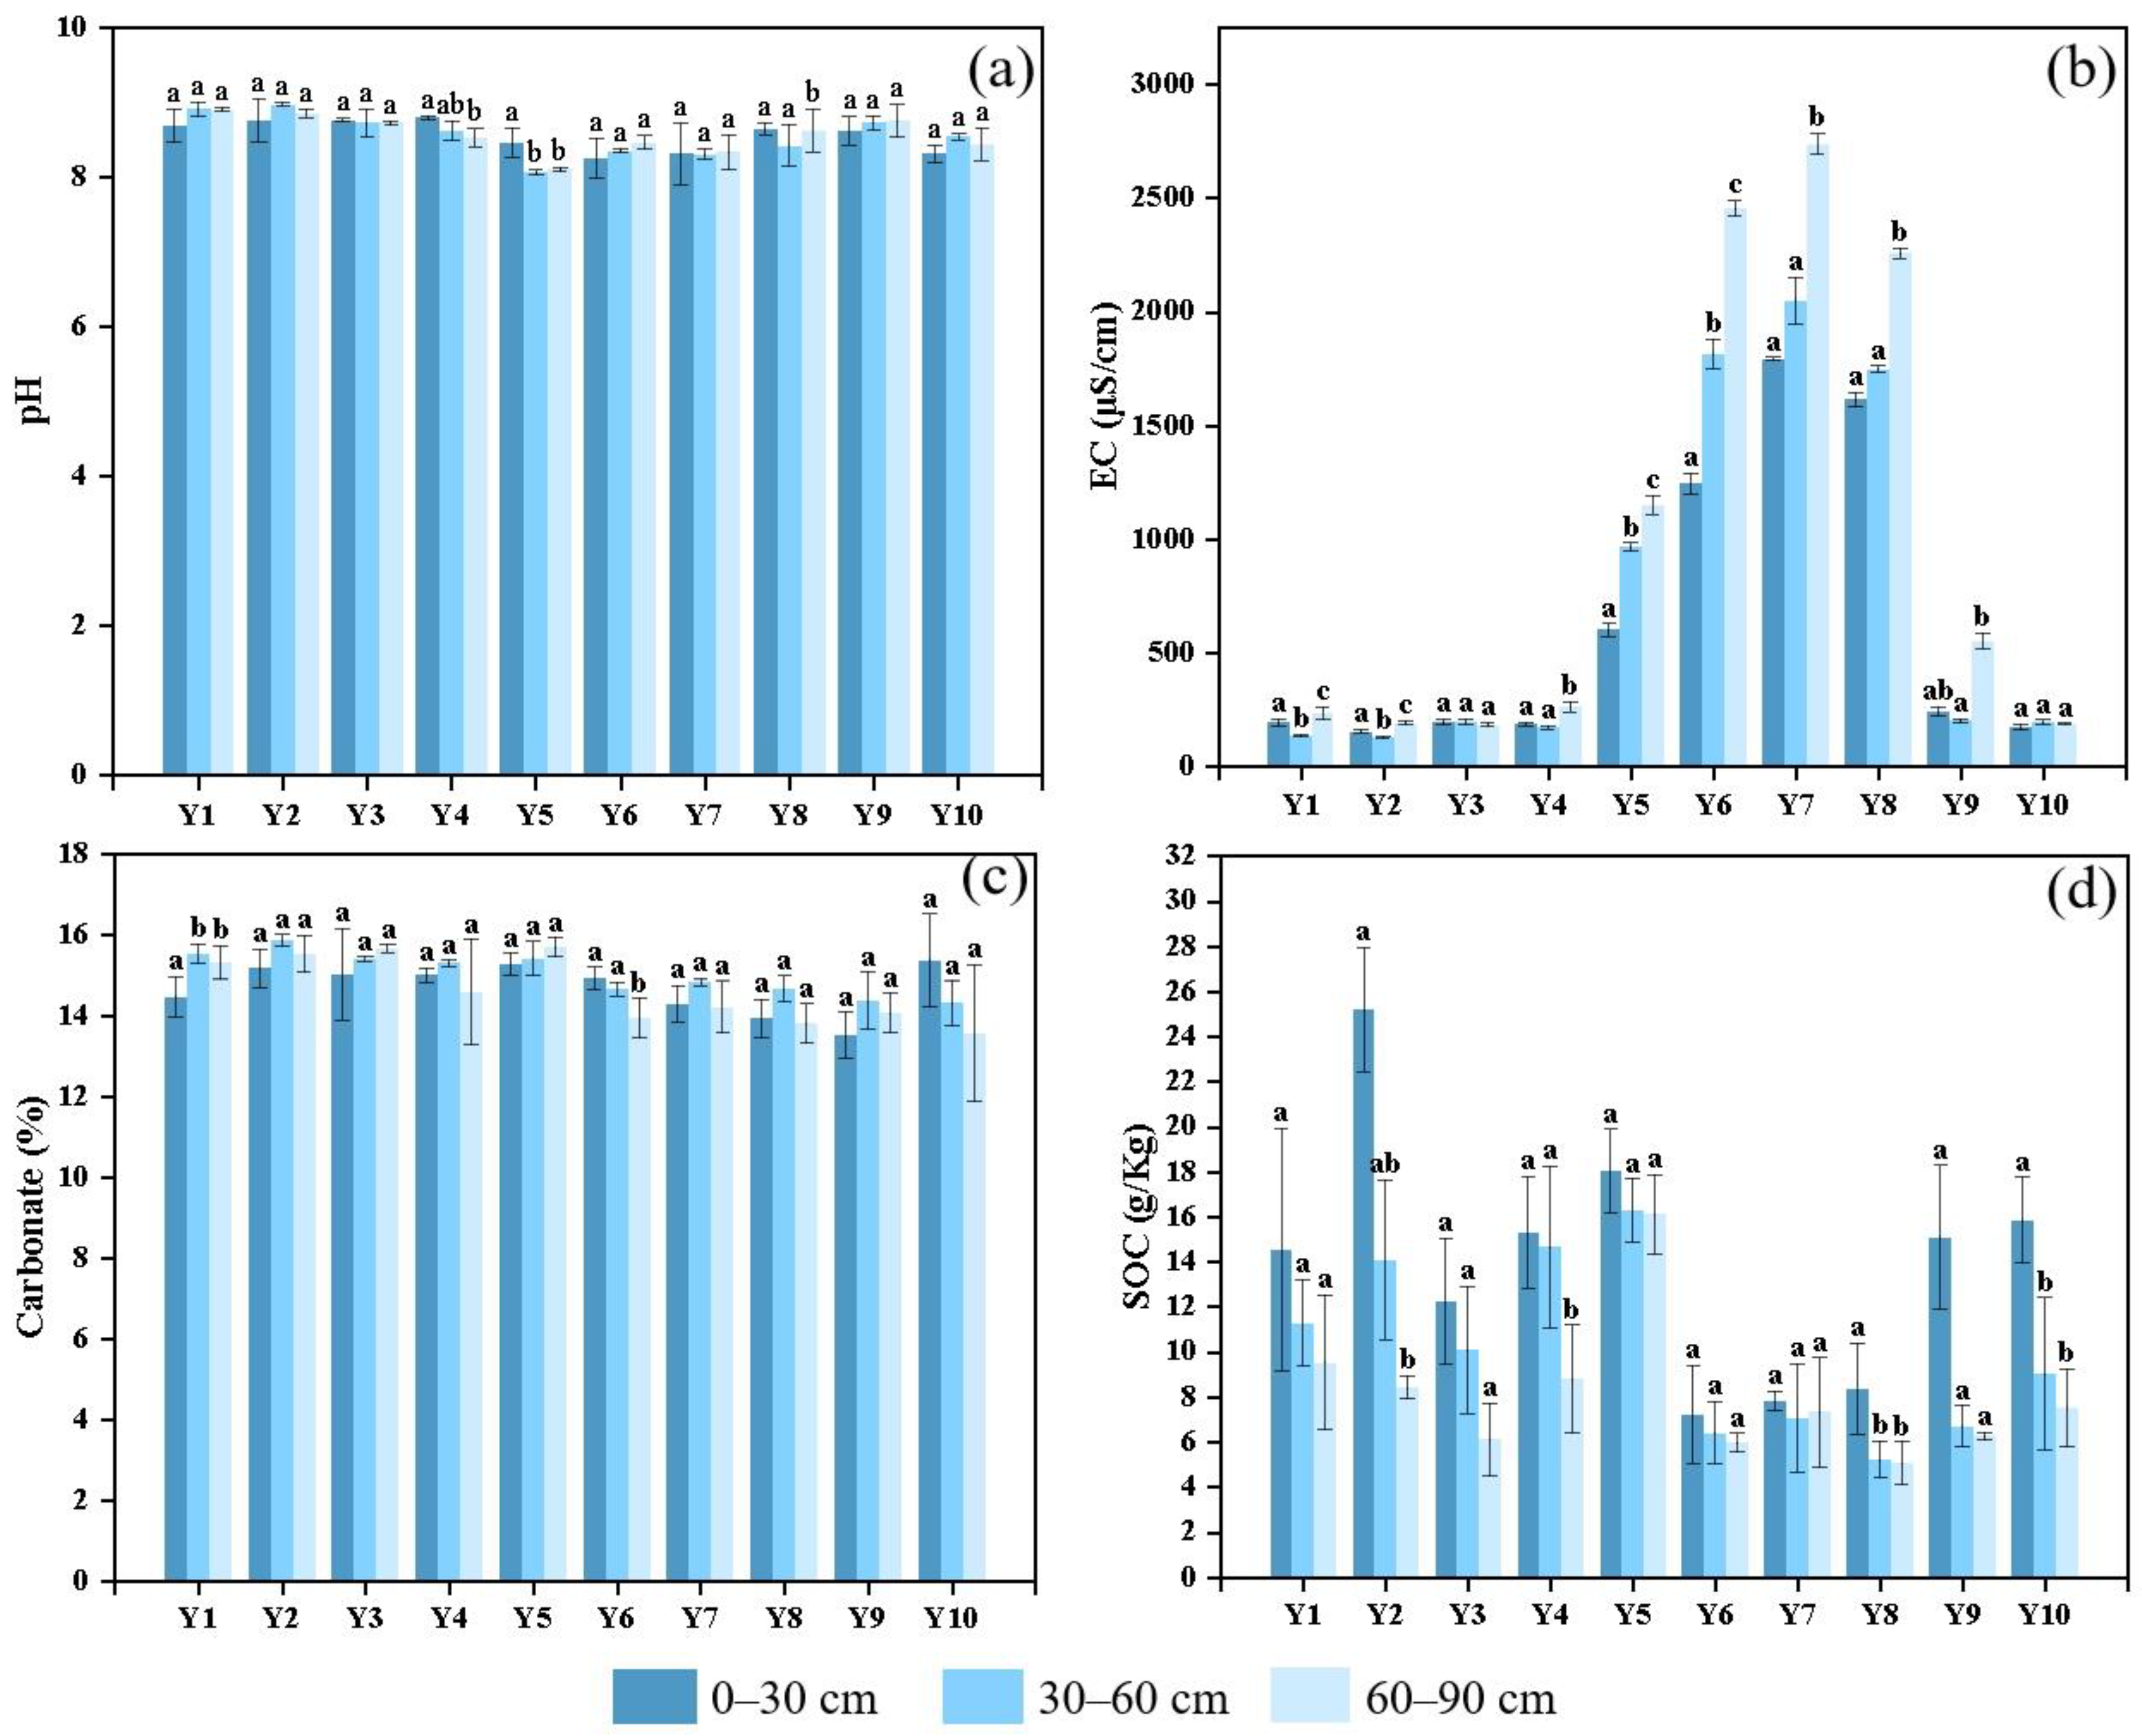
Soils across the study area were alkaline, with pH values ranging from 8.24 to 8.96, representing a decrease from the pH range of 8.98–9.95 recorded in our previous survey in April 2023. The surface soils (0–30 cm) were relatively homogeneous; however, significant differences were detected in the subsurface layers. Specifically, plot Y5 exhibited significantly lower pH values at both 30–60 cm and 60–90 cm depths compared to most other plots (Table 6). In contrast, no significant differences in pH were observed across soil depths within the majority of plots, indicating consistent vertical profiles (Figure 2a). The significant vertical stratification unique to plot Y5 highlights its distinct soil pH pattern.

3.5. Soil Electrical Conductivity

Significant spatial heterogeneity in soil electrical conductivity (EC) was observed among the sampling plots. Specifically, plots Y6, Y7, and Y8 exhibited substantially higher EC values (1245–2737 μS/cm) across all soil depths compared to the other plots (154–601 μS/cm) (Table 7). While some plots maintained relatively stable EC values throughout the soil profile, significant differences with depth were detected in most plots (Figure 2b). Notably, plots Y5 and Y6 showed a marked increase in EC with soil depth, which was particularly evident in the 60–90 cm layer. This vertical stratification was more pronounced in Y6, where EC values approximately doubled from the surface to the deeper layers. The concurrent spatial and vertical heterogeneity in soil EC indicates localized salt accumulation within the study area.

3.6. Soil Carbonate Content

Soil carbonate content in the study area ranged from 13.50% to 15.84%, showing a slight decrease compared to the 2023 survey results (13.77%–16.11%). Comparative analysis among plots revealed relatively homogeneous spatial distribution, with narrow variation in carbonate content and no significant differences detected between most sampling sites (Table 8). However, vertical profile analysis demonstrated distinct stratification patterns in specific plots. Notably, plots Y1 and Y6 exhibited significant differences among soil layers: Y1 showed higher carbonate content in deeper soil layers (30–60 cm and 60–90 cm) compared to the surface layer [36], while Y6 displayed significantly reduced carbonate content in the 60–90 cm layer (Figure 2c). Importantly, the majority of plots maintained consistent carbonate levels across the three depth intervals, indicating generally uniform vertical distribution of carbonates throughout the study area (Figure 2c).

3.7. Soil Organic Carbon

Soil organic carbon (SOC) content in the study area ranged from 7.22 to 25.21 g/kg, representing a substantial increase compared to the 2023 survey results (0.20–8.70 g/kg). Plot-wise comparisons revealed that surface soil SOC content in plots Y2 and Y5 was significantly higher than in plot Y6, with Y2 exhibiting the maximum value (25.21 g/kg) at 0–30 cm depth (Table 9). Notably, plot Y5 maintained relatively high SOC levels across all soil depths, showing significantly higher values at 60–90 cm depth compared to most other plots (Table 9). Vertical profile analysis demonstrated a decreasing trend in SOC content with increasing soil depth in most plots, particularly evident in Y2, Y4, Y8, and Y10 (Figure 2d). Particularly notable was plot Y5, which maintained consistent SOC levels across the three depth intervals without significant differences, displaying a unique vertical distribution pattern (Figure 2d).

4. Discussion

4.1. Structural Characteristics of the Plant Community in Cuiying Mountain

In the study area, the herbaceous layer was dominated by a high coverage of 98%, suggesting substantial light penetration to the forest floor and a likely low canopy density (Table 4). In contrast, shrub coverage was minimal at 2%, representing a critical structural gap in the vegetation profile (Table 4). This scarcity is likely attributable to intense competition for light and soil resources from the dense herbaceous layer, which inhibits successful shrub establishment [37]. The tree layer was characterized by sparse distribution and a low biodiversity index of 0.09, indicating a simplified forest structure (Table 4). Furthermore, the tree population exhibited significant growth heterogeneity, with a DBH standard deviation of 6.35 cm and a coefficient of variation of 0.85 (Table 5). This reflects considerable size disparity among individuals, encompassing multiple age classes—a pattern consistent with the predominantly plantation-based origins of the Cuiying Mountain forest. The mean tree mingling degree was very low at 0.14, indicating that individual trees are predominantly surrounded by conspecifics (Table 5). This low species diversity and clumped or patchy distribution results in a monospecific, aggregated pattern, which consequently reduces the community’s resistance to external stressors such as pests and diseases.
The ecosystem in the study area is characterized by a pronounced dominance of herbaceous vegetation, constrained development of trees and shrubs, low to moderate species diversity, and overall weak stability. This unbalanced vertical structure results in limited ecosystem functionality, particularly in water conservation and carbon sequestration [38]. A reduction in anthropogenic disturbance, coupled with active measures to promote the regeneration of woody plants, could facilitate a gradual succession towards a more complex community structure. Without such interventions, the ecosystem is likely to remain arrested in an early successional stage dominated by herbaceous species.

4.2. Variations in Soil Physicochemical Properties

Soil properties exhibit significant spatial heterogeneity, influenced by the combined effects of parent material, climate, and land use history. Improving these physicochemical properties is a key aspect of enhancing overall soil functionality during vegetation restoration [39,40]. Consequently, a thorough understanding of the spatial variation in soil characteristics is crucial for accurately assessing regional productive potential and guiding ecological rehabilitation. Overall, the soils in the study area were strongly alkaline, with pH values ranging from 8.24 to 8.96 (Table 6). Electrical conductivity (EC) showed high spatial variability, with significant salt accumulation in specific plots (e.g., Y6, Y7, and Y8) (Table 7). Notably, in the subsoil (60–90 cm depth), EC frequently exceeded 2500 μS/cm, indicating localized salt accumulation likely caused by bare soil conditions or capillary rise [41,42].
The contribution of soil inorganic carbon (SIC) to terrestrial carbon stocks is substantial, accounting for an average of 40% of the total soil carbon pool in China [43]. This contribution is particularly pronounced in arid and semi-arid environments, where SIC plays a critical role in maintaining the stability of fragile ecosystems [44,45]. In our study area, the soil carbonate content ranged from 13.50% to 15.80% (Table 8). A slight increase in carbonate with depth was observed in most plots, a pattern consistent with leaching and subsequent precipitation within the soil profile [46]. The concomitant slight increase in pH with depth further supports this pedogenic process [47]. In contrast, soil organic carbon (SOC) was the most distinguishing variable along the soil profile. It plays a central role in maintaining soil multifunctionality and serves as a key indicator of soil ecological health [48]. Across all sampled plots, SOC content was highest in the surface layer (0–30 cm) and decreased progressively with depth (Figure 2d). This vertical pattern results from the pronounced input of plant residues (litter and root exudates) and microbial activity at the surface, coupled with scarce root distribution and limited organic matter input in deeper layers [49,50].

4.3. Effects of Plant Diversity on Soil Carbonate

The soil carbon pool is a crucial component of the global carbon cycle and is chemically divided into soil organic carbon (SOC) and soil inorganic carbon (SIC) [51]. SIC exists primarily in the form of carbonates and is widely distributed in arid and semi-arid regions, such as the Loess Plateau and inland saline-alkali soils of northwestern China. Globally, the SIC stock in the top 1 m of soil (940 Pg) accounts for more than half of the SOC stock (1200–1600 Pg) at the same depth [52]. The SIC pool not only directly influences soil physicochemical properties and ecosystem stability but also exhibits a dynamic feedback response to climate change [53]. It is thus a core carbon reservoir that serves as a long-term sink, supports ecosystem functions, and responds to climatic shifts. However, SIC has received considerably less scientific attention compared to SOC.
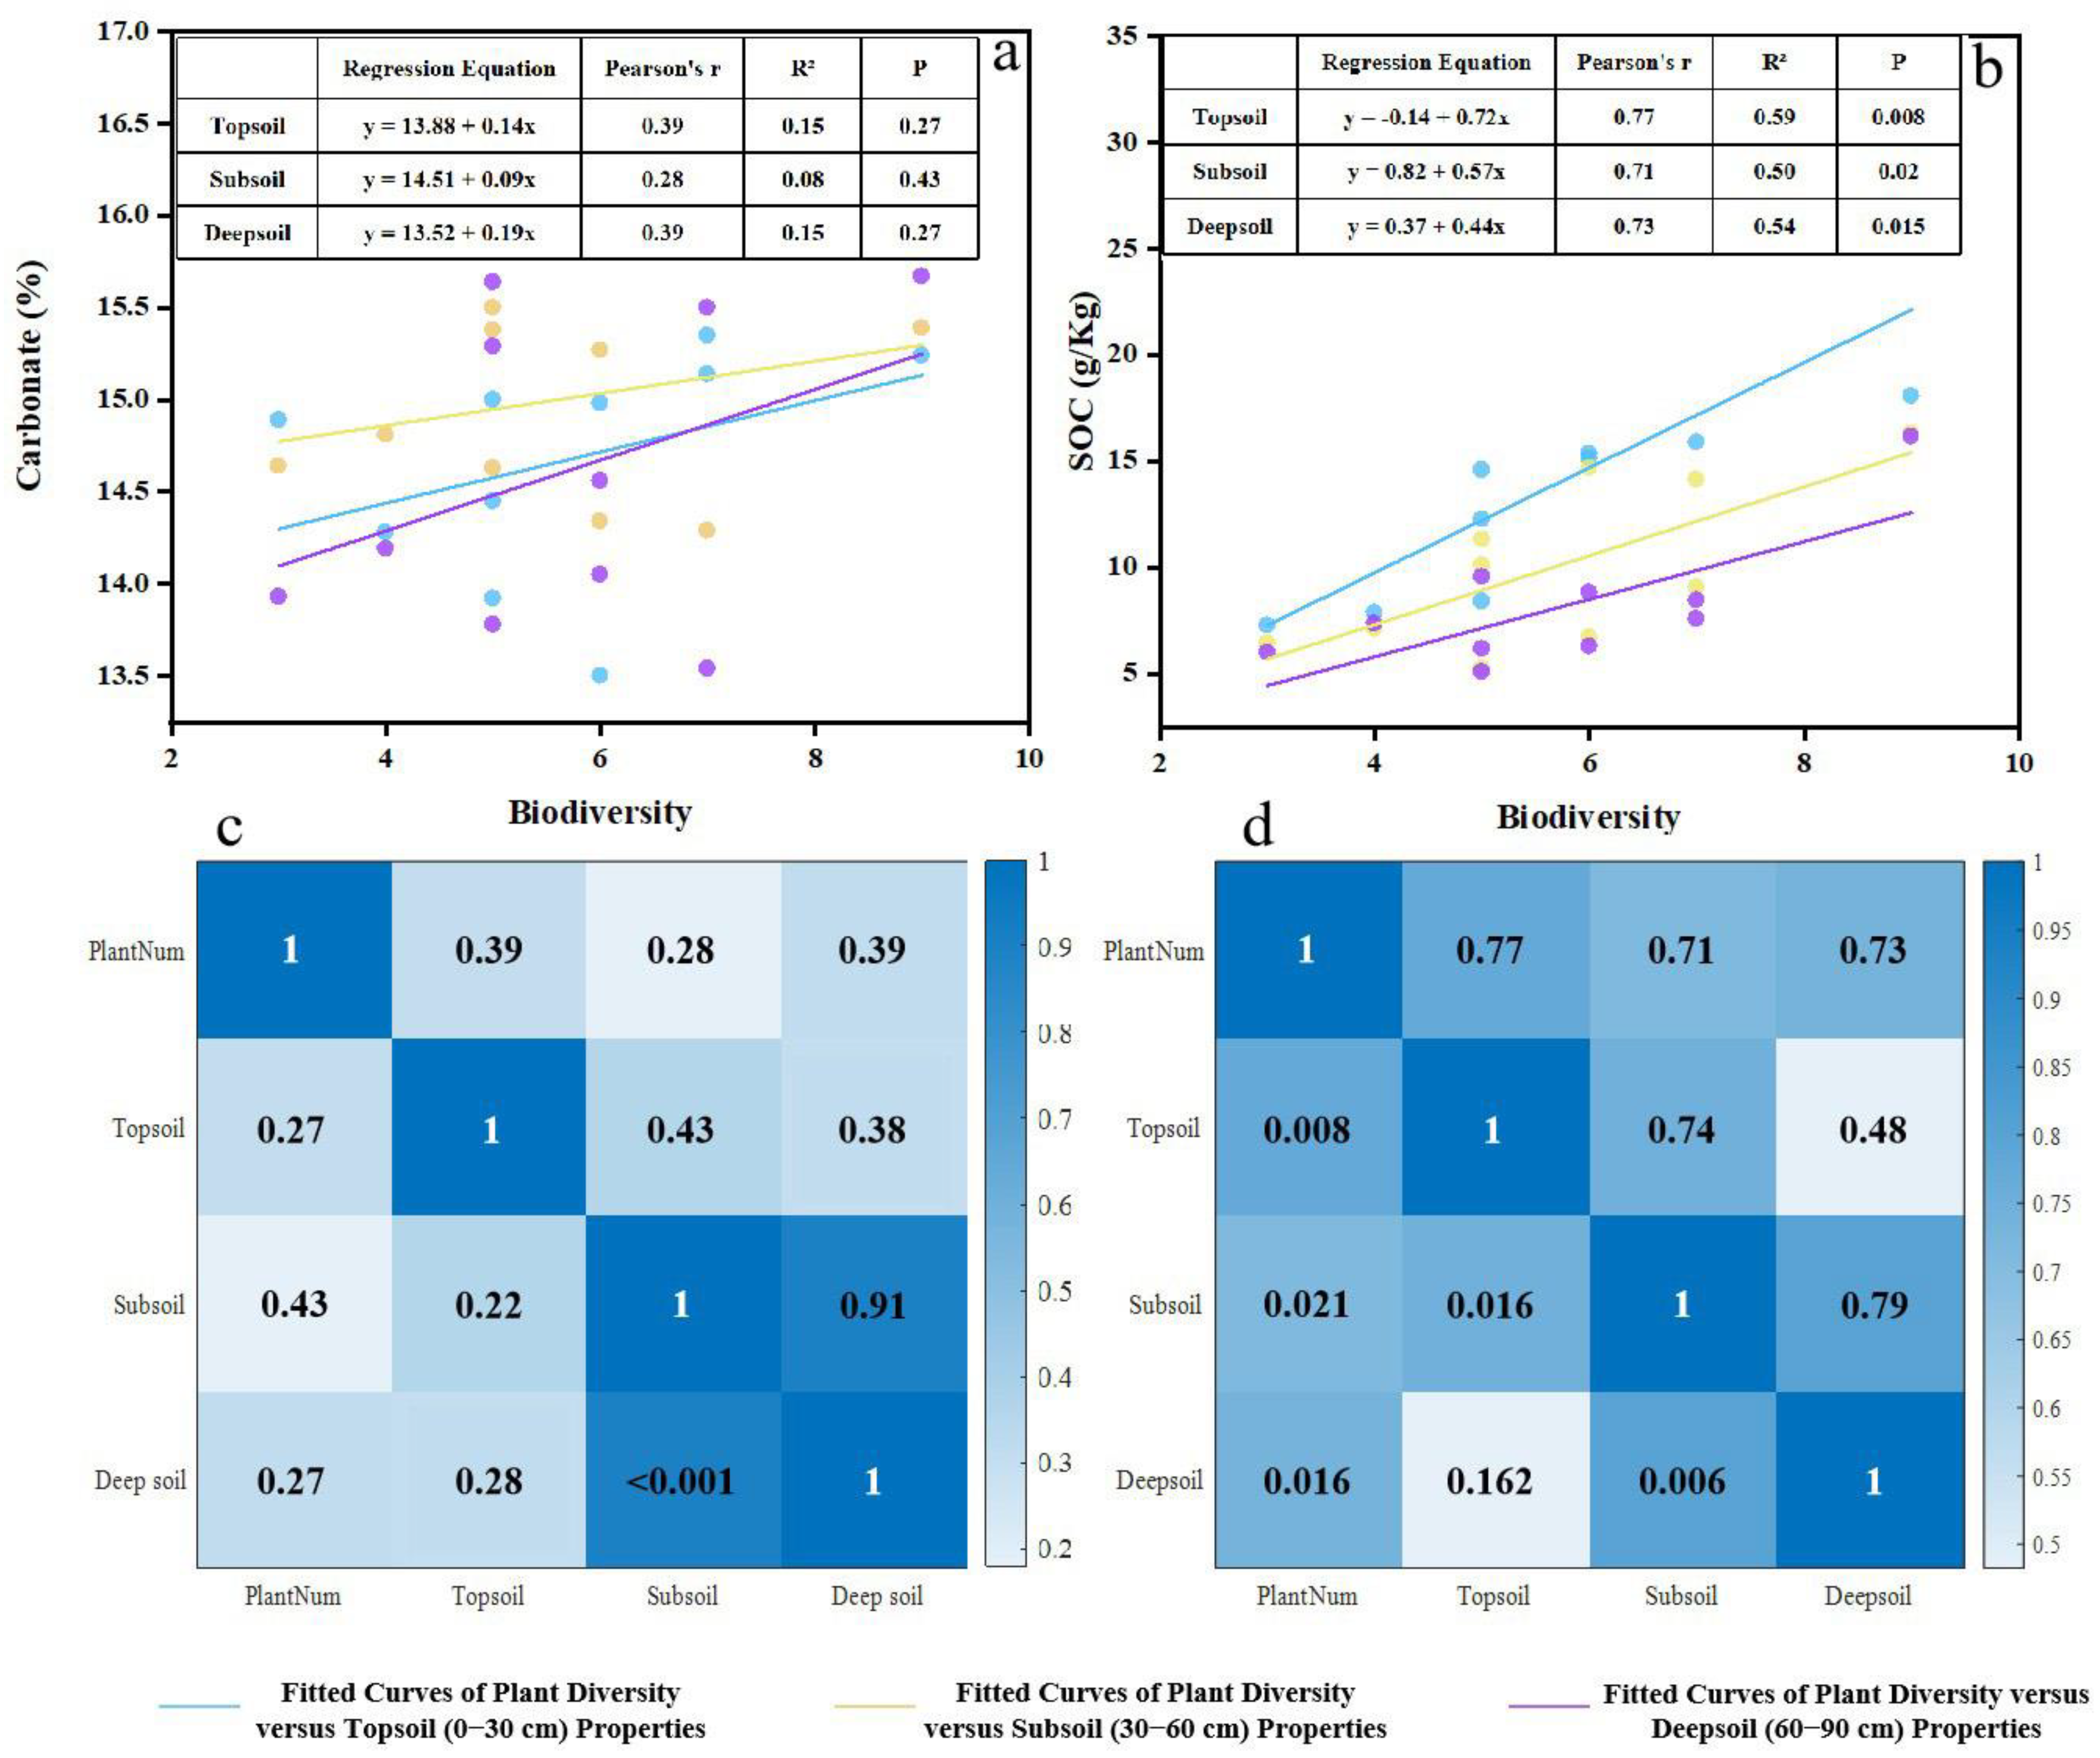
The fitted trends in Figure 3a show an increasing trend in soil carbonate content with rising species diversity across the topsoil, subsoil, and deep soil layers. This suggests a potential positive relationship in the study area, where higher species diversity may promote greater soil carbonate accumulation. Further supporting this, the Pearson’s correlation heatmap (Figure 3c) quantifies the strength of these linear relationships. The correlation between plant species number and carbonate content was 0.3863 for topsoil, 0.2782 for subsoil, and 0.3934 for deep soil, indicating a slightly stronger link with the deep layer than with the subsoil. However, the exceptionally high correlation between subsoil and deep soil carbonate content (0.9104) implies that the increase in deep-layer carbonate is more strongly associated with the pervasive leaching and reprecipitation processes of carbonates within the soil profile [45].
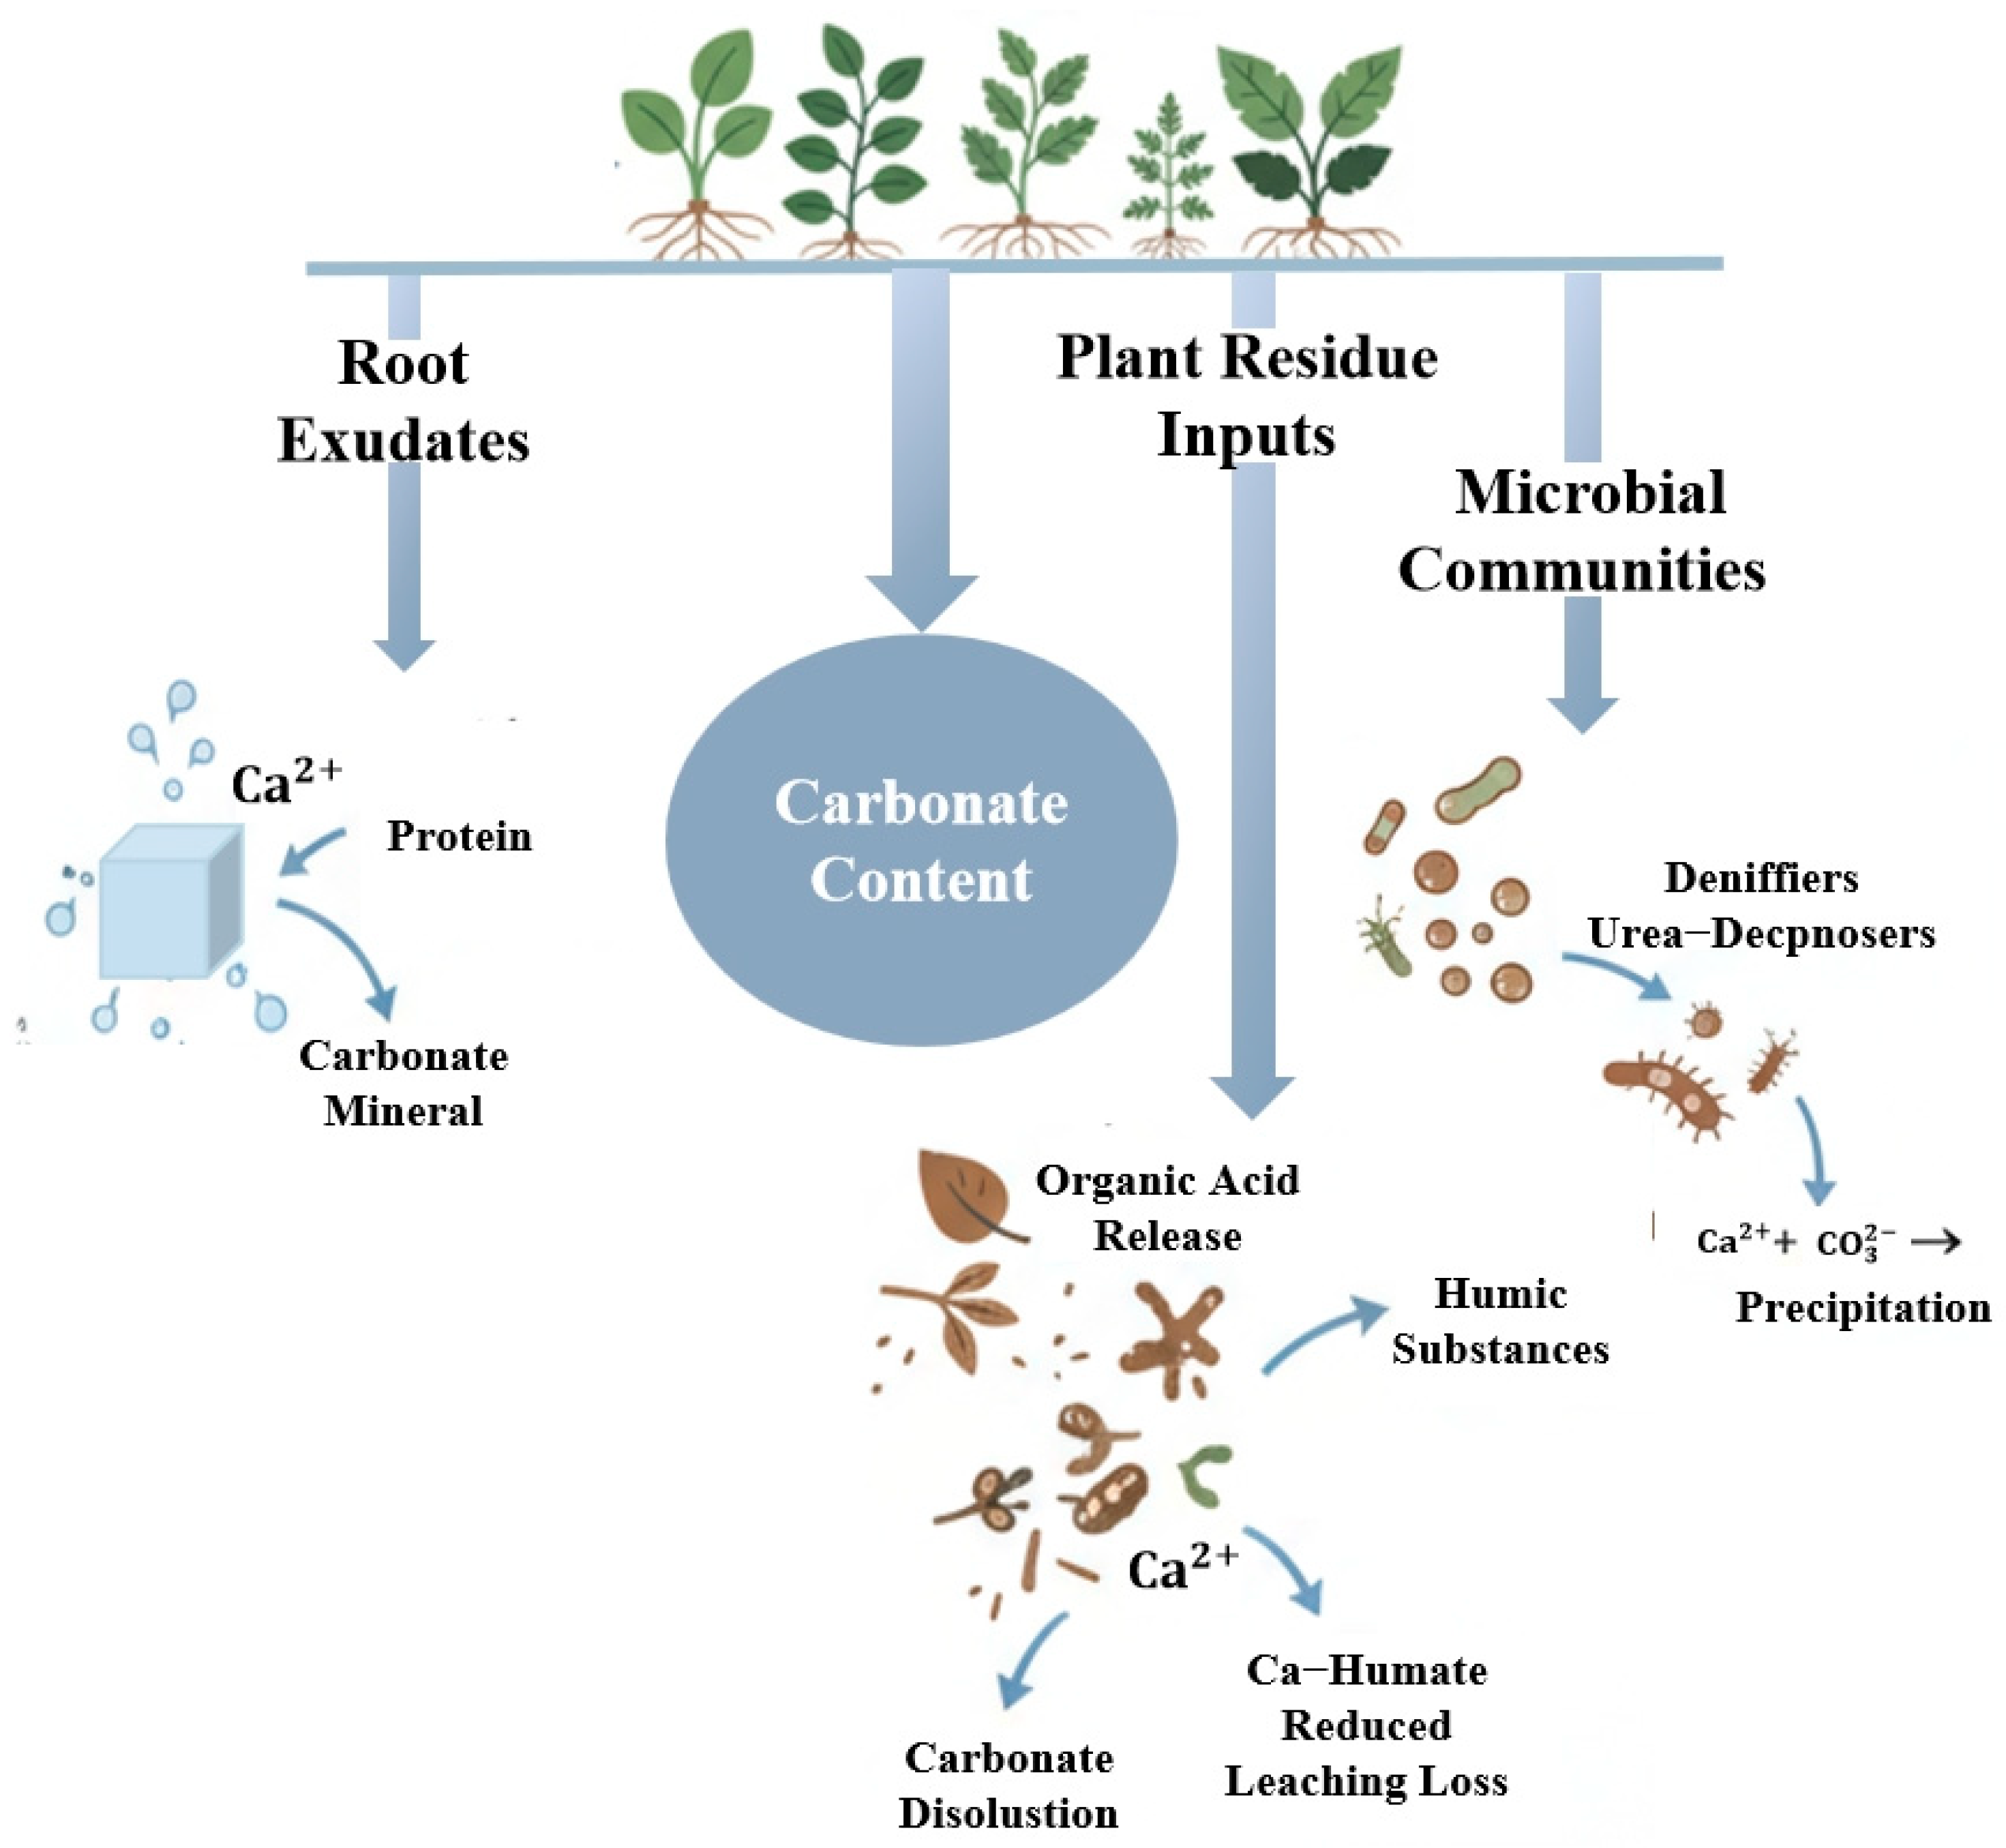
Soil carbonate accumulation exhibits a positive correlation with increased plant species diversity, a trend that is more pronounced in surface soils. Enhanced species diversity promotes carbonate accumulation through several mechanisms (Figure 4): diverse plant communities enrich root exudates [54,55] (e.g., polysaccharides that form organo-mineral complexes and inhibit further carbonate dissolution), improve litter quality and input [56] (accelerated decomposition releases organic acids that promote dissolution, while humus binds with Ca2+ to form calcium humates, reducing leaching loss), and regulate microbial community structure and metabolism [57] (e.g., denitrifying and urea-decomposing bacteria elevate soil pH, facilitating Ca2+ and C O 3 2 precipitation). These processes directly regulate the carbonate dissolution–precipitation equilibrium. In subsurface layers, where direct influence from aboveground plant parts is weaker, carbonate accumulation relies more on root vertical extension, litter decomposition, and synergy with these microbial processes. Therefore, introducing more tree and shrub species enhances root functional diversity, thereby more effectively facilitating carbonate enrichment in deeper soil horizons. Furthermore, plant diversity indirectly influences carbonate vertical migration and leaching by modulating key factors, including soil pH, Ca2+ concentration, and aggregate structure [56,58,59], ultimately leading to the observed pattern of greater carbonate accumulation and stability with higher plant diversity.

4.4. Effects of Plant Diversity on Soil Organic Carbon

Soil organic carbon (SOC) plays a critical role in global ecological change, functioning both as a regulator of greenhouse gases and as a key indicator of soil nutrient status [57]. The primary inputs of SOC are plant-derived, mainly from litter decomposition into humus and root exudates. The dynamics and storage of SOC are regulated by multiple factors—including climate, soil properties, human activity, and vegetation characteristics—exhibiting significant temporal and spatial variation [60,61]. When other factors are constant, SOC levels are strongly influenced by vegetation.
The fitted trends in Figure 3b indicate that soil organic carbon (SOC) content increases with species diversity across the topsoil, subsoil, and deep soil layers. This suggests that plant diversity promotes SOC accumulation, with higher species richness potentially enhancing the soil’s carbon sequestration capacity. The most pronounced increase in SOC content occurred in the topsoil layer. This relationship is quantified by the Pearson’s correlation coefficients in Figure 3d, which showed strong positive correlations between plant species number and SOC content in the topsoil (r = 0.77), subsoil (r = 0.71), and deep soil (r = 0.73). The strongest linear association was found in the topsoil, indicating that species diversity exerts the most direct influence on, and that SOC in the surface layer is most responsive to, changes in plant diversity. Furthermore, the significant correlations between soil layers indicate that SOC content in the subsoil and deep layers is influenced not only by plant diversity but also by the vertical transport of organic matter within the soil profile.
Plant diversity exerts a more pronounced effect on SOC than on SIC. Research indicates that diverse plant communities enhance ecosystem carbon sequestration through two primary mechanisms: by directly supplying carbon to the soil via litter deposition and root exudates [62], and by increasing microbial diversity and abundance, which in turn strengthens the microbial immobilization of organic carbon [63]. These findings underscore the critical role of species diversity in regulating the accumulation and distribution of SOC, establishing it as a key driver of soil organic carbon sequestration.
In summary, plant diversity enhances the accumulation of both soil organic carbon (SOC) and soil inorganic carbon (SIC), with the strongest correlations observed in the topsoil. The enhancement of SOC was more pronounced than that of SIC in the topsoil. This can be attributed to synergistic processes: as the primary zone for aboveground litter input and root activity, the topsoil benefits from a diverse plant community through optimized litter quality and quantity, the synergistic effects of root exudates, and an improved soil microbial environment, which collectively drive SOC enrichment [60,61,62,63]. In contrast, SOC and SIC accumulation in deeper soil layers relies more on root system vertical distribution and carbon translocation processes, as direct litter input is limited [58,62]. Consequently, the correlation with species diversity, while still positive, is weaker than in the topsoil. This demonstrates that enhancing plant diversity serves as a key biological mechanism for soil carbon sequestration, primarily by regulating topsoil biogeochemical processes.
This study elucidates how plant diversity regulates soil nutrient cycling in arid regions by modulating carbon content. Our findings provide a theoretical basis for optimizing the stand structure of the Cuiying Mountain plantation to enhance soil carbon storage. Furthermore, they offer valuable insights for improving ecological restoration practices and strengthening the soil carbon sink function in forest ecosystems across the Loess Plateau and other similar regions.

5. Conclusions

This study evaluated forest naturalness in the Cuiying Mountain area and investigated its relationship with soil carbon content in an arid region of Northwest China. Our findings indicate that (1) the forest exhibited a low level of naturalness, characterized by high herbaceous coverage but minimal shrub coverage (2.1%), low tree diversity (Shannon index = 0.09), a wide range of tree sizes indicating multiple age classes, and a simple, single-layer structure (mean mingling degree = 0.14). (2) Forest naturalness positively influenced both soil inorganic and organic carbon, with the strongest correlation observed with surface soil organic carbon accumulation. The more pronounced effect on SOC can be attributed to distinct accumulation mechanisms. While SIC dynamics are primarily governed by dissolution–precipitation processes influenced by root exudates and litter decomposition, SOC accumulation is directly regulated by plant-derived inputs. These inputs, through litterfall and root secretions, along with the consequent increase in microbial diversity and abundance, directly enhance SOC storage and distribution.
This study provides initial insights into the relationship between forest naturalness and soil carbon content through a single sampling event. A primary limitation is that this single-time-point measurement may not fully capture interannual dynamics in soil carbon and plant–soil interactions, potentially affecting the long-term robustness and generalizability of our findings. Future work should include multi-year monitoring to track how vegetation dynamics influence soil carbon stocks, thereby verifying the persistence and stability of our results. Incorporating additional ecological factors (e.g., microbial community structure, litter decomposition rates) will further elucidate the underlying mechanisms through which plant diversity drives soil carbon accumulation, ultimately providing a more comprehensive theoretical basis for ecosystem carbon management in the Loess Plateau.
Author Contributions

Conceptualization, S.C. and S.W.; Validation, Y.X. and S.W.; Investigation, S.C., Y.X. and P.L.; Data Curation, Y.X.; Writing—Original Draft Preparation, S.C., Y.X. and P.L.; Writing—Review and Editing, S.C., Y.X. and P.L.; Supervision, S.W.; Project Administration, S.W. All authors have read and agreed to the published version of the manuscript.

Funding

This research was funded by the Research and Application of Key Technologies for Efficient Utilization of Biomass in Existing Power Plants—Sub-Project 4: Research on Key Technologies for Carbon Resource Utilization of Biomass (37-K2024-133).

Data Availability Statement

The data relevant to this study are available from the authors on request.

Acknowledgments

We thank Jingjing Wu and Tiantian Liang for their help with field and laboratory work.

Conflicts of Interest

Author Shidan Chi was employed by the company Shandong Electric Power Engineering Consulting Institute Co., Ltd. The remaining authors declare that the research was conducted in the absence of any commercial or financial relationships that could be construed as a potential conflict of interest.

References

  1. Lehmann, J.; Kleber, M. The contentious nature of soil organic matter. Nature 2015, 528, 60–68. [Google Scholar] [CrossRef] [PubMed]
  2. Zhou, Y.; Hartemink, A.E.; Shi, Z.; Liang, Z.; Lu, Y. Land use and climate change effects on soil organic carbon in North and Northeast China. Sci. Total Environ. 2019, 647, 1230–1238. [Google Scholar] [CrossRef] [PubMed]
  3. De Paul Obade, V.; Lal, R. Soil quality evaluation under different land management practices. Environ. Earth Sci. 2014, 72, 4531–4549. [Google Scholar] [CrossRef]
  4. Xiang, H.; Luo, X.; Zhang, L.; Hou, E.; Li, J.; Zhu, Q.; Wen, D. Forest succession accelerates soil carbon accumulation by increasing recalcitrant carbon stock in subtropical forest topsoils. CATENA 2022, 212, 106030. [Google Scholar] [CrossRef]
  5. Wang, Z.; Tao, T.; Wang, Y.; Small, G.E.; Chen, J.; Sun, X. Soil quality in urban forests under different understory management practices. Land Degrad. Dev. 2023, 34, 899–910. [Google Scholar] [CrossRef]
  6. Ren, Y.; Lin, F.; Jiang, C.; Tang, J.; Fan, Z.; Feng, D.; Zeng, X.; Jin, Y.; Liu, C.; Olatunji, O.A. Understory vegetation management regulates soil carbon and nitrogen storage in rubber plantations. Nutr. Cycl. Agroecosyst. 2023, 127, 209–224. [Google Scholar] [CrossRef]
  7. Smith, P. Land use change and soil organic carbon dynamics. Nutr. Cycl. Agroecosyst. 2008, 81, 169–178. [Google Scholar] [CrossRef]
  8. Wang, K.-B.; Ren, Z.-P.; Deng, L.; Zhou, Z.-C.; Shangguan, Z.-P.; Shi, W.-Y.; Chen, Y.-P. Profile Distributions and Controls of Soil Inorganic Carbon along a 150-Year Natural Vegetation Restoration Chronosequence. Soil Sci. Soc. Am. J. 2016, 80, 193–202. [Google Scholar] [CrossRef]
  9. Jia, Y.; Zhai, G.; Zhu, S.; Liu, X.; Schmid, B.; Wang, Z.; Ma, K.; Feng, X. Plant and microbial pathways driving plant diversity effects on soil carbon accumulation in subtropical forest. Soil Biol. Biochem. 2021, 161, 108375. [Google Scholar] [CrossRef]
  10. Prieto, I.; Stokes, A.; Roumet, C. Root functional parameters predict fine root decomposability at the community level. J. Ecol. 2016, 104, 725–733. [Google Scholar] [CrossRef]
  11. Creamer, C.A.; de Menezes, A.B.; Krull, E.S.; Sanderman, J.; Newton-Walters, R.; Farrell, M. Microbial community structure mediates response of soil C decomposition to litter addition and warming. Soil Biol. Biochem. 2015, 80, 175–188. [Google Scholar] [CrossRef]
  12. Brockerhoff, E.G.; Barbaro, L.; Castagneyrol, B.; Forrester, D.I.; Gardiner, B.; González-Olabarria, J.R.; Lyver, P.O.; Meurisse, N.; Oxbrough, A.; Taki, H.; et al. Forest biodiversity, ecosystem functioning and the provision of ecosystem services. Biodivers. Conserv. 2017, 26, 3005–3035. [Google Scholar] [CrossRef]
  13. Liu, Y.; Miao, H.-T.; Chang, X.; Wu, G.-L. Higher species diversity improves soil water infiltration capacity by increasing soil organic matter content in semiarid grasslands. Land Degrad. Dev. 2019, 30, 1599–1606. [Google Scholar] [CrossRef]
  14. Scherber, C.; Eisenhauer, N.; Weisser, W.; Schmid, B.; Voigt, W.; Fischer, M.; Schulze, E.-D.; Roscher, C.; Weigelt, A.; Allan, E.; et al. Bottom-up effects of plant diversity on multitrophic interactions in a biodiversity experiment. Nature 2010, 468, 553–556. [Google Scholar] [CrossRef]
  15. Angst, Š.; Angst, G.; Mueller, K.E.; Lange, M.; Eisenhauer, N. Un(der)explored links between plant diversity and particulate and mineral-associated organic matter in soil. Nat. Commun. 2025, 16, 5548. [Google Scholar] [CrossRef] [PubMed]
  16. Rumpel, C.; Kögel-Knabner, I. Deep soil organic matter—A key but poorly understood component of terrestrial C cycle. Plant Soil 2011, 338, 143–158. [Google Scholar] [CrossRef]
  17. Wang, H.; Yang, Z.; Saito, Y.; Liu, J.P.; Sun, X. Interannual and seasonal variation of the Huanghe (Yellow River) water discharge over the past 50 years: Connections to impacts from ENSO events and dams. Glob. Planet. Change 2006, 50, 212–225. [Google Scholar] [CrossRef]
  18. Zamanian, K.; Pustovoytov, K.; Kuzyakov, Y. Pedogenic carbonates: Forms and formation processes. Earth-Sci. Rev. 2016, 157, 1–17. [Google Scholar] [CrossRef]
  19. Mielnick, P.; Dugas, W.; Mitchell, K.; Havstad, K. Long-term measurements of CO2 flux and evapotranspiration in a Chihuahuan desert grassland. J. Arid. Environ. 2005, 60, 423–436. [Google Scholar] [CrossRef]
  20. Wang, Y.; Fu, B.; Lü, Y.; Song, C.; Luan, Y. Local-Scale Spatial Variability of Soil Organic Carbon and its Stock in the Hilly Area of the Loess Plateau, China. Quat. Res. 2010, 73, 70–76. [Google Scholar] [CrossRef]
  21. Chang, R.; Fu, B.; Liu, G.; Wang, S.; Yao, X. The effects of afforestation on soil organic and inorganic carbon: A case study of the Loess Plateau of China. CATENA 2012, 95, 145–152. [Google Scholar] [CrossRef]
  22. Lange, M.; Eisenhauer, N.; Chen, H.; Gleixner, G. Increased soil carbon storage through plant diversity strengthens with time and extends into the subsoil. Glob. Change Biol. 2023, 29, 2627–2639. [Google Scholar] [CrossRef]
  23. Palandrani, C.; Alberti, G. Tree derived soil carbon is enhanced by tree species richness and functional diversity. Plant Soil 2020, 446, 457–469. [Google Scholar] [CrossRef]
  24. Tu, W.Z.; Zhao, W.W.; Liu, Y.; Zhang, Z.J. Ecological restoration zoning on the Loess Plateau based on the supply and demand of ecosystem services. Acta Ecol. Sin. 2024, 44, 9695–9707. [Google Scholar] [CrossRef]
  25. Zhang, W.; Cheng, Y.; Liu, Y.; Du, S.; Li, G. Diversity of afforestation tree species and its influencing factors in Loess Plateau. Res. Soil Water Conserv. 2026, 33, 1–8. [Google Scholar] [CrossRef]
  26. Ye, X.M.; Wei, T.X.; Yu, H.; Zhang, X.M.; Fan, D.H.; Jiang, S.; Xin, P.C.; Li, S.J. Carbon storage and influencing factors of typical forestecosystems in loess hilly region. Chin. J. Ecol. 2025, 44, 1409–1416. [Google Scholar] [CrossRef]
  27. Gong, Z. Understory plant species diversity and its influencing factors in forests of the Loess Plateau. J. Northeas. For. Univ. 2025, 53, 66–74. [Google Scholar]
  28. GB/T 17296-2009; Classification and Codes for Chinese Soil. Standards Press of China: Beijing, China, 2009.
  29. Wang, Z.X.; Huang, H.S.; Yan, Z.Y.; Yang, R.Z.; Ma, X.D.; Li, C.; He, K.N. Assessment of the near-naturalness of typical forest stands in the Eastern Qilian Mountains. Acta Ecol. Sin. 2025, 45, 8154–8164. [Google Scholar] [CrossRef]
  30. Shannon, C.E. A mathematical theory of communication. Bell Syst. Tech. J. 1948, 27, 379–423. [Google Scholar] [CrossRef]
  31. Zhang, X. The Impact of Forest Structure Adjustment on Tree Radial Growth and Xylem Anatomical Characteristics. Ph.D. Thesis, Northwest A&F University, Xianyang, China, 2025. [Google Scholar] [CrossRef]
  32. Maltamo, M.; Kangas, A.; Uuttera, J.; Torniainen, T.; Saramäki, J. Comparison of percentile based prediction methods and the Weibull distribution in describing the diameter distribution of heterogeneous Scots pine stands. For. Ecol. Manag. 2000, 133, 263–274. [Google Scholar] [CrossRef]
  33. Bao, S.D. Soil and Agricultural Chemistry Analysis; China Agricultural Press: Beijing, China, 2000. [Google Scholar]
  34. Dreimanis, A. Quantitative gasometric determination of calcite and dolomite by using Chittick apparatus. J. Sediment. Res. 1962, 32, 520–529. [Google Scholar] [CrossRef]
  35. Velasco-Molina, M.; Berns, A.E.; Macías, F.; Knicker, H. Biochemically altered charcoal residues as an important source of soil organic matter in subsoils of fire-affected subtropical regions. Geoderma 2016, 262, 62–70. [Google Scholar] [CrossRef]
  36. Shao, M.; Zhang, S.; Pei, Y.; Song, S.; Lei, T.; Yun, H. Soil texture and microorganisms dominantly determine the subsoil carbonate content in the permafrost-affected area of the Tibetan Plateau. Front. Microbiol. 2023, 14, 1125832. [Google Scholar] [CrossRef]
  37. Godefroid, S.; Phartyal, S.S.; Weyembergh, G.; Koedam, N. Ecological factors controlling the abundance of non-native invasive black cherry (Prunus serotina) in deciduous forest understory in Belgium. For. Ecol. Manag. 2005, 210, 91–105. [Google Scholar] [CrossRef]
  38. Chen, C.; Wang, X.-W.; Liu, Y.-Y. Stability of ecological systems: A theoretical review. Phys. Rep. 2024, 1088, 1–41. [Google Scholar] [CrossRef] [PubMed]
  39. Hailemariam, M.B.; Woldu, Z.; Asfaw, Z.; Lulekal, E. Impact of Elevation Change on the Physicochemical Properties of Forest Soil in South Omo Zone, Southern Ethiopia. Appl. Environ. Soil Sci. 2023, 2023, 7305618. [Google Scholar] [CrossRef]
  40. Qiu, D.; Xu, R.; Wu, C.; Mu, X.; Zhao, G.; Gao, P. Vegetation restoration improves soil hydrological properties by regulating soil physicochemical properties in the Loess Plateau, China. J. Hydrol. 2022, 609, 127730. [Google Scholar] [CrossRef]
  41. Akoto, O.; Yakubu, S.; Ofori, L.A.; Bortey-Sam, N.; Boadi, N.O.; Horgah, J.; Sackey, L.N. Multivariate studies and heavy metal pollution in soil from gold mining area. Heliyon 2023, 9, e12661. [Google Scholar] [CrossRef]
  42. Dong, X.X.; Zhang, L.L.; Wu, Z.J.; Li, D.P.; Shang, Z.C.; Gong, P. Effects of the nitrification inhibitor DMPP on soil bacterial community in a Cambisol in northeast China. J. Soil Sci. Plant Nutr. 2013, 13, 580–591. [Google Scholar] [CrossRef]
  43. Mi, N.; Wang, S.; Liu, J.; Yu, G.; Zhang, W.; Jobbágy, E. Soil inorganic carbon storage pattern in China. Glob. Change Biol. 2008, 14, 2380–2387. [Google Scholar] [CrossRef]
  44. Sharififar, A.; Minasny, B.; Arrouays, D.; Boulonne, L.; Chevallier, T.; van Deventer, P.; Field, D.J.; Gomez, C.; Jang, H.-J.; Jeon, S.-H.; et al. Soil inorganic carbon, the other and equally important soil carbon pool: Distribution, controlling factors, and the impact of climate change. Adv. Agron. 2023, 178, 165–231. [Google Scholar]
  45. Ebouel, F.J.D.; Betsi, T.B.; Eze, P.N. Soil inorganic carbon: A review of global research trends, analytical techniques, ecosystem functions and critical knowledge gaps. CATENA 2024, 242, 108112. [Google Scholar] [CrossRef]
  46. Quijano, L.; Kuhn, N.J.; Navas, A. Effects of interrill erosion on the distribution of soil organic and inorganic carbon in different sized particles of Mediterranean Calcisols. Soil Tillage Res. 2020, 196, 104461. [Google Scholar] [CrossRef]
  47. Shi, Y.; Baumann, F.; Ma, Y.; Song, C.; Kühn, P.; Scholten, T.; He, J.-S. Organic and inorganic carbon in the topsoil of the Mongolian and Tibetan grasslands: Pattern, control and implications. Biogeosciences 2012, 9, 2287–2299. [Google Scholar] [CrossRef]
  48. Kopittke, P.M.; Berhe, A.A.; Carrillo, Y.; Cavagnaro, T.R.; Chen, D.; Chen, Q.-L.; Dobarco, M.R.; Dijkstra, F.A.; Field, D.J.; Grundy, M.J.; et al. Ensuring planetary survival: The centrality of organic carbon in balancing the multifunctional nature of soils. Crit. Rev. Environ. Sci. Technol. 2022, 52, 4308–4324. [Google Scholar] [CrossRef]
  49. Quichimbo, P.; Jiménez, L.; Veintimilla, D.; Tischer, A.; Günter, S.; Mosandl, R.; Hamer, U. Forest site classification in the Southern Andean region of Ecuador: A case study of pine plantations to collect a base of soil attributes. Forests 2017, 8, 473. [Google Scholar] [CrossRef]
  50. Manzoni, S.; Taylor, P.; Richter, A.; Porporato, A.; Ågren, G.I. Environmental and stoichiometric controls on microbial carbon-use efficiency in soils. New Phytol. 2012, 196, 79–91. [Google Scholar] [CrossRef] [PubMed]
  51. Song, B.-L.; Yan, M.-J.; Hou, H.; Guan, J.-H.; Shi, W.-Y.; Li, G.-Q.; Du, S. Distribution of soil carbon and nitrogen in two typical forests in the semiarid region of the Loess Plateau, China. CATENA 2016, 143, 159–166. [Google Scholar] [CrossRef]
  52. Post, W.M.; Emanuel, W.R.; Zinke, P.J.; Stangenberger, A.G. Soil carbon pools and world life zones. Nature 1982, 298, 156–159. [Google Scholar] [CrossRef]
  53. Neff, J.C.; Townsend, A.R.; Gleixner, G.; Lehman, S.J.; Turnbull, J.; Bowman, W.D. Variable effects of nitrogen additions on the stability and turnover of soil carbon. Nature 2002, 419, 915–917. [Google Scholar] [CrossRef]
  54. Liu, X.; Trogisch, S.; He, J.-S.; Niklaus, P.A.; Bruelheide, H.; Tang, Z.; Erfmeier, A.; Scherer-Lorenzen, M.; Pietsch, K.A.; Yang, B.; et al. Correction to ‘Tree species richness increases ecosystem carbon storage in subtropical forests’. Proc. R. Soc. B Biol. Sci. 2018, 285, 20182090. [Google Scholar] [CrossRef]
  55. Finzi, A.C.; Abramoff, R.Z.; Spiller, K.S.; Brzostek, E.R.; Darby, B.A.; Kramer, M.A.; Phillips, R.P. Rhizosphere processes are quantitatively important components of terrestrial carbon and nutrient cycles. Glob. Change Biol. 2015, 21, 2082–2094. [Google Scholar] [CrossRef]
  56. Wen, H.; Sullivan, P.L.; Macpherson, G.L.; Billings, S.A.; Li, L. Deepening roots can enhance carbonate weathering by amplifying CO2-rich recharge. Biogeosciences 2021, 18, 55–75. [Google Scholar] [CrossRef]
  57. Lal, R. Soil Carbon Sequestration Impacts on Global Climate Change and Food Security. Science 2004, 304, 1623–1627. [Google Scholar] [CrossRef] [PubMed]
  58. Cui, L.; Liu, C.; Tu, C.; Li, L.; Ding, H. Distribution and isotopic composition of inorganic carbon in soils under different land covers in the loess region. Chin. J. Ecol. 2013, 32, 1187–1194. [Google Scholar] [CrossRef]
  59. Gould, I.J.; Quinton, J.N.; Weigelt, A.; De Deyn, G.B.; Bardgett, R.D. Plant diversity and root traits benefit physical properties key to soil function in grasslands. Ecol. Lett. 2016, 19, 1140–1149. [Google Scholar] [CrossRef]
  60. Wiesmeier, M.; Urbanski, L.; Hobley, E.; Lang, B.; von Lützow, M.; Marin-Spiotta, E.; van Wesemael, B.; Rabot, E.; Ließ, M.; Garcia-Franco, N.; et al. Soil organic carbon storage as a key function of soils—A review of drivers and indicators at various scales. Geoderma 2019, 333, 149–162. [Google Scholar] [CrossRef]
  61. Beillouin, D.; Cardinael, R.; Berre, D.; Boyer, A.; Corbeels, M.; Fallot, A.; Feder, F.; Demenois, J. A global overview of studies about land management, land-use change, and climate change effects on soil organic carbon. Glob. Change Biol. 2022, 28, 1690–1702. [Google Scholar] [CrossRef]
  62. Chen, S.; Wang, W.; Xu, W.; Wang, Y.; Wan, H.; Chen, D.; Tang, Z.; Tang, X.; Zhou, G.; Xie, Z.; et al. Plant diversity enhances productivity and soil carbon storage. Proc. Natl. Acad. Sci. USA 2018, 115, 4027–4032. [Google Scholar] [CrossRef]
  63. Paul, E.A. The nature and dynamics of soil organic matter: Plant inputs, microbial transformations, and organic matter stabilization. Soil Biol. Biochem. 2016, 98, 109–126. [Google Scholar] [CrossRef]
Figure 1. The location of the study area: (a) location of Yuzhong County in China; (b) Location of Sampling Sites; (c) Hilltop Plots; (d) Mid-Slope Plots; (e) Footslope Plots.
Forests 16 01732 g001
Figure 2. Physicochemical properties of forest soil samples from Cuiying Mountain, Yuzhong County. (a) Soil pH; (b) Electrical Conductivity (EC); (c) Soil Carbonate Content; (d) Soil Organic Carbon (SOC). Different letters after the columns indicate significant differences at different depths (p < 0.05).
Forests 16 01732 g002
Figure 3. Relationships between plant diversity and soil carbon components. (a) Regression of plant diversity against soil inorganic carbon; (b) Regression of plant diversity against soil organic carbon (SOC) content; (c) Correlation analysis between plant diversity and soil carbonate content across soil layers (Topsoil: 0–30 cm; Subsoil: 30–60 cm; Deep soil: 60–90 cm); (d) Correlation analysis between plant diversity and soil organic carbon content across soil layers (Topsoil: 0–30 cm; Subsoil: 30–60 cm; Deep soil: 60–90 cm). The upper square presents Pearson correlation coefficients between plant diversity and soil physicochemical parameters, while the lower square shows the respective p-values.
Forests 16 01732 g003
Figure 4. Schematic diagram illustrating the mechanisms through which plants influence soil carbonate.
Forests 16 01732 g004
Table 1. Characteristics of the Sampling Plots.
Sampling Site IDLatitudeLongitudeAltitude(m)Soil Type
Y135°56′43.24″104°08′14.74″1928Calcic Gray—cinnamon soil
Y235°56′36.18″104°08′16.85″1977Calcic Gray—cinnamon soil
Y335°56′35.19″104°08′17.39″1969Calcic Gray—cinnamon soil
Y435°56′43.24″104°08′15.18″1934Calcic Gray—cinnamon soil
Y535°56′34.83″104°08′20.67″1953Typical Gray—cinnamon soil
Y635°56′40.53″104°08′20.03″1948Typical Gray—cinnamon soil
Y735°56′37.17″104°08′25.23″1889Typical Gray—cinnamon soil
Y835°56′35.33″104°08′27.46″1862Calcic Gray—cinnamon soil
Y935°56′34.86″104°08′36.00″1805Calcic Gray—cinnamon soil
Y1035°56′33.23″104°08′37.20″1801Typical Gray—cinnamon soil
Table 2. Species composition across sampling sites.
Sampling Site IDSpecies RichnessDominant Species
Y15Artemisia
Y27Artemisia
Y35Hedera helix
Y46Artemisia
Y59Eleusine indica
Y63Eleusine indica
Y74Eleusine indica
Y85Eleusine indica
Y96Eleusine indica
Y107Eleusine indica
Table 3. Floristic inventory of the study area.
Plant SpeciesBotanical NameClass
Chinese JuniperJuniperus chinensisPinopsida
WormwoodArtemisia spp.Magnoliopsida
Indian KalimerisKalimeris indicaMagnoliopsida
Dwarf LilyturfOphiopogon japonicusLiliopsida
Common Russian ThistleSalsola collinaMagnoliopsida
Wild GoldenpeaThermopsis lupinoidesMagnoliopsida
Chinese NightshadeSolanum septemlobumMagnoliopsida
African RuePeganum harmalaMagnoliopsida
Syrian BeancaperZygophyllum fabagoMagnoliopsida
Green BristlegrassSetaria viridisLiliopsida
Mongolian ChiveAllium mongolicumLiliopsida
Elm TreeUlmus spp.Magnoliopsida
Siberian ApricotPrunus sibiricaMagnoliopsida
GoosegrassEleusine indicaLiliopsida
Black NightshadeSolanum nigrumMagnoliopsida
LambsquartersChenopodium albumMagnoliopsida
Table 4. Phytosociological metrics of the plant community.
Herb CoverageShrub CoverageShannon Diversity Index (Tree Layer)
98%2%0.09
Table 5. Structural Indicators of Trees.
DBH Standard DeviationDBH Coefficient of VariationMean Mingling Degree
6.350.850.14
Table 6. Soil pH across different soil depths (0–90 cm) in the sampling plots.
Sampling Site IDSoil pH
0–30 cm30–60 cm60–90 cm
Y18.68 ± 0.22 a 8.90 ± 0.09 a8.89 ± 0.02 a
Y28.75 ± 0.29 a8.96 ± 0.03 ab8.84 ± 0.05 ab
Y38.75 ± 0.02 a8.71 ± 0.19 ab8.71 ± 0.03 ab
Y48.78 ± 0.02 a8.61 ± 0.13 ab8.52 ± 0.12 ab
Y58.45 ± 0.19 a8.05 ± 0.03 b8.09 ± 0.03 b
Y68.24 ± 0.26 a8.34 ± 0.03 ab8.45 ± 0.09 ab
Y78.30 ± 0.41 a8.29 ± 0.07 ab8.33 ± 0.23 ab
Y88.64 ± 0.08 a8.41 ± 0.28 ab8.61 ± 0.28 ab
Y98.61 ± 0.19 a8.71 ± 0.10 ab8.74 ± 0.22 ab
Y108.30 ± 0.12 a8.53 ± 0.04 ab8.43 ± 0.22 ab
Note. Different lowercase letters indicate significant differences among plots at p < 0.05. The same applies in Table 7, Table 8 and Table 9.
Table 7. Soil Electrical Conductivity across different soil depths (0–90 cm) in the sampling plots.
Sampling Site IDSoil EC (μS/cm)
0–30 cm30–60 cm60–90 cm
Y1192.97 ± 18.43 ab135.33 ± 5.59 a236.00 ± 28.21 ab
Y2154.63 ± 6.04 a126.50 ± 5.12 a192.50 ± 8.25 ab
Y3195.60 ± 11.23 ab197.20 ± 10.01 ab184.97 ± 10.72 a
Y4185.73 ± 8.54 ab174.00 ± 7.28 ab263.33 ± 22.01 ab
Y5601.00 ± 26.96 ab965.67 ± 17.56 ab1150.33 ± 40.92 ab
Y61245.00 ± 46.81 ab1816.67 ± 65.07 b2453.33 ± 35.12 ab
Y71791.33 ± 7.77 b2050.33 ± 103.35 b2736.67 ± 46.19 b
Y81616.33 ± 29.48 b1746.33 ± 15.01 ab2257.00 ± 20.66 ab
Y9243.00 ± 19.29 ab202.50 ± 9.34 ab551.67 ± 32.65 ab
Y10174.50 ± 12.03 ab194.07 ± 11.09 ab186.30 ± 3.30 a
Table 8. Soil carbonate across different soil depths (0–90 cm) in the sampling plots.
Sampling Site IDSoil Carbonate (%)
0–30 cm30–60 cm60–90 cm
Y114.45 ± 0.49 a15.50 ± 0.25 ab15.29 ± 0.41 a
Y215.14 ± 0.48 a15.84 ± 0.14 a15.50 ± 0.46 a
Y315.00 ± 1.13 a15.38 ± 0.06 ab15.64 ± 0.10 a
Y414.98 ± 0.18 a15.27 ± 0.08 ab14.56 ± 1.30 a
Y515.24 ± 0.28 a15.39 ± 0.41 ab15.67 ± 0.24 a
Y614.89 ± 0.28 a14.64 ± 0.17 ab13.93 ± 0.49 a
Y714.28 ± 0.45 a14.81 ± 0.09 ab14.19 ± 0.64 a
Y813.92 ± 0.47 a14.63 ± 0.32 ab13.78 ± 0.49 a
Y913.50 ± 0.58 a14.34 ± 0.70 b14.05 ± 0.49 a
Y1015.35 ± 1.14 a14.29 ± 0.55 ab13.54 ± 1.69 a
Table 9. Soil Organic carbon across different soil depths (0–90 cm) in the sampling plots.
Sampling Site IDSoil SOC (g/Kg)
0–30 cm30–60 cm60–90 cm
Y114.54 ± 2.40 ab11.27 ± 1.93 ab9.51 ± 2.99 ab
Y225.21 ± 2.75 a14.09 ± 3.54 ab8.41 ± 0.51 ab
Y312.22 ± 2.81 ab10.08 ± 2.82 ab6.12 ± 1.60 ab
Y415.31 ± 2.48 ab14.64 ± 3.61 ab8.77 ± 2.40 ab
Y518.02 ± 1.87 ab16.28 ± 1.40 a16.11 ± 1.77 a
Y67.22 ± 2.18 b6.39 ± 1.39 ab5.96 ± 0.40 ab
Y77.82 ± 0.43 ab7.05 ± 2.40 ab7.31 ± 2.41 ab
Y88.35 ± 2.01 ab5.20 ± 0.83 b5.03 ± 0.97 b
Y915.09 ± 3.19 ab6.68 ± 0.93 ab6.24 ± 0.18 ab
Y1015.85 ± 1.91 ab9.02 ± 3.37 ab7.53 ± 1.72 ab
Disclaimer/Publisher’s Note: The statements, opinions and data contained in all publications are solely those of the individual author(s) and contributor(s) and not of MDPI and/or the editor(s). MDPI and/or the editor(s) disclaim responsibility for any injury to people or property resulting from any ideas, methods, instructions or products referred to in the content.