Abstract
Escalating human–land conflicts have exacerbated ecosystem degradation, threatening regional sustainable development. As the largest sandy land in China, the Horqin Sandy Land (HSL) in eastern Inner Mongolia exhibits high ecological fragility. Delineating ecological restoration zones (ERZ) is critical to transition from localized restoration to system-wide stability, thereby enhancing regional ecological security, which reflects ecosystem health and integrity. Ecological security patterns (ESP), as spatial configurations that support and maintain ecological security, serve as the foundational framework for ERZ planning. Unlike conventional applications of InVEST and MSPA, this study integrates an ecosystem service assessment with morphological spatial pattern analysis (MSPA) under a “Source–Resistance–Corridor–Note” paradigm to develop a novel “ecological network–zoning” approach. This framework transforms ecological connectivity analysis into actionable restoration zoning, bridging theoretical ESP construction with practical management needs. Key findings include the following: (1) In total, 76 vital ecological source regions were mapped, representing about 10,204.38 km2 of ecologically significant land, with primary distribution in the northwestern mountainous regions; (2) A total of 169 ecological corridors were extracted, spanning 4071.94 km in length. Ecological pinch points with 239.91 km2 and barrier points with 568.85 km2 were systematically identified; (3) A “Five Zones, Three Belts, One Core” spatial strategy was proposed, aligning with regional ecological conditions and development goals. This study provides a transferable methodology for ecosystem restoration in global arid and semi-arid regions, bridging theoretical frameworks with actionable zoning practices.
1. Introduction
Under the dual pressures of intensifying climate change and escalating human activities, global ecosystem structures and functions are experiencing widespread degradation, leading to increasingly severe ecological security challenges worldwide. The United Nations Decade on Ecosystem Restoration (2021–2030) reveals that over 2 billion hectares of ecosystems globally face degradation risks, with declining ecosystem service capacities becoming a fundamental constraint on sustainable development [1,2], particularly in arid and semi-arid developing countries, where ecosystem restoration encounters multifaceted challenges that urgently require systematic and scientifically grounded spatial rehabilitation strategies. In response, China has proposed building a “life community integrating mountains, waters, forests, farmlands, lakes, grasslands and deserts” while progressively establishing key regions, such as the “Three Zones and Four Belts”, thereby developing an ecosystem conservation and restoration philosophy that is based on ecological security patterns [3]. Against this background, the construction of ESP based on ecosystem service and structural characteristics has emerged as the primary foundation for ecological restoration zoning [4,5,6].
Based on landscape ecology theory, the “ecological source-resistance surface-ecological corridor” framework has become a canonical paradigm for constructing ESP [7,8,9,10]. Ecological sources refer to patches with a high ecosystem service and landscape connectivity [11]. Currently, the identification methodology for ecological source areas remains a focal point of scholarly attention. While qualitative extraction methods that directly designate well-preserved ecosystems, such as forests, grasslands, wetlands, and nature reserves, as source areas offer objectivity, they often overlook fragmented ecological source patches [12,13]. Recent studies increasingly identify ecological sources through integrated assessments of ecosystem structural integrity and functional performance, utilizing tools like the InVEST and MSPA model to pinpoint areas exhibiting both high ecosystem service capacity and superior landscape connectivity [14,15,16,17,18]. Building upon these foundations, this study advances the InVEST–MSPA integration by identifying ecological sources to support the delineation of ERZ. The ecological resistance surface quantifies the difficulty of species’ movement between landscape patches. Common resistance surface construction methods involve either calibrating land-use type resistance values or a weighted summation of multiple resistance indicators. For instance, Cao et al. [19] employed the normalized difference vegetation index (NDVI), slope, and digital elevation model (DEM) as calibration factors, while Zhang et al. [20] integrated landscape type, DEM, NDVI, slope, distance to urban areas, distance to road networks, and ecological barriers as composite resistance indicators. Currently, no unified indicator framework exists for resistance surface construction, with land-use type calibration remaining more prevalent due to its operational simplicity [21,22]. Ecological corridors serve as critical conduits for material/energy flows and species migration between sources, effectively mitigating ecosystem fragmentation [23,24]. Although the minimum cumulative resistance (MCR) model remains widely used for corridor extraction [25,26], its limitation to identifying single optimal paths often fails to capture ecosystem complexity. Recent advances demonstrate that circuit theory models better simulate species’ stochastic movement patterns, significantly improving corridor identification accuracy [27,28,29].
However, current research predominantly focuses on ecological security pattern construction, with ecological restoration zoning often relying on administrative divisions [14,15], ecosystem service supply–demand relationships [30], ecological vulnerability evaluations [31], or ecosystem health assessments [32], combined with natural breaks classification. These approaches lack systematic pathways for translating “ecological networks” into “restoration zoning”, failing to support regionally differentiated conservation and restoration strategies. Several recent studies have attempted to link ecological networks with restoration zoning, providing valuable methodological insights [33]. However, most of these efforts have been concentrated in humid or mountainous regions and have not fully addressed the challenges of translating ecological network structures into restoration-oriented spatial strategies in arid and semi-arid sandy ecosystems. Moreover, ecological restoration strategies remain ambiguous for high human-activity areas like croplands, particularly in sandy lands and ecotones where ecosystem degradation manifests not as visible bare land expansion, but as “ecological function weakening”, demanding precise identification and zonal restoration approaches. Therefore, the HSL was selected as a typical case area for ecological restoration to supplement existing research. Historically, the Horqin Grassland was rich in water and vegetation. However, with the intensification of drought, caused by global climate change and overgrazing activities, the region has experienced grassland degradation, land desertification, and groundwater decline. These processes have led to the weakening of key ecosystem services, such as soil and water conservation, wind prevention and sand fixation, carbon sequestration, and biodiversity maintenance, and the grassland has gradually evolved into the largest sandy land in China. Conducting ecological restoration research in the HSL is of great importance for enhancing the supporting capacity of the Xiliao River Basin, strengthening the dominant function of the northern sand-prevention belt, and consolidating the ecological security barrier of northern China, which also contributes to global ecological governance.
This paper contributes to addressing these research gaps through a comprehensive study of the HSL. As shown in Figure 1, under the “Source–Resistance–Corridor–Note” paradigm, an ecological security pattern was constructed to reveal the spatial organization of ecological processes, which served as the foundation for establishing a restoration zoning scheme. Specifically, this study integrated an ecosystem service assessment and MSPA to identify ecological sources, and applied circuit theory to extract ecological corridors and key ecological nodes, such as pinch points and barriers. Building upon these findings, we propose a “Five Zones, Three Belts, One Core” spatial framework for ecological conservation and restoration, aiming to provide both scientific evidence and innovative paradigms for ecosystem rehabilitation in arid and semi-arid regions. The study specifically addresses three key scientific questions: (1) Within the ecosystem structure–function coupling framework, how can multi-source data be synthesized to identify critical ecological sources and characterize the distribution patterns and functional attributes of core ecosystem units? (2) How should we construct an ecological security pattern incorporating ecosystem services (ES), landscape connectivity, and resistance mechanisms to delineate ecological corridors, nodes, and barrier areas, thereby revealing spatial pathways of ecological processes? (3) How can we translate ecological networks into functional restoration zoning, proposing spatially differentiated management strategies “conservation–restoration–transition” to establish a science-informed spatial governance framework?
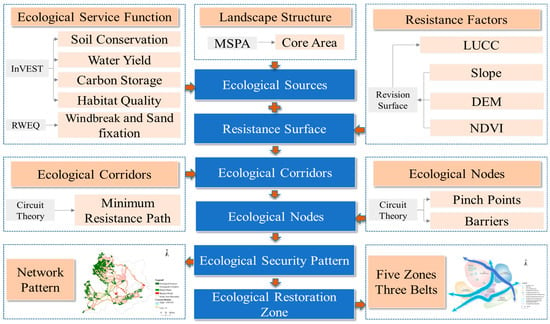
Figure 1.
Framework of the study.
2. Materials and Methods
2.1. Study Area
The HSL is a vast sandy belt extending approximately 400 km in northeastern China, characterized by dynamically shifting boundaries without a clearly defined unified demarcation. As the Horqin Grassland Ecological Function Zone represents a nationally designated key ecological functional area located in the heart of this sandy land system, this study selects it as the focal research area.
The Horqin Grassland Ecological Function Zone is situated in a transitional ecotone between the Songnen Plain and Inner Mongolian Plateau, with geographic coordinates ranging from 121°42′–123°02′ E, and 43°22′–43°58′ N (Figure 2). Located within the northern shelterbelt region of China, this region suffers from severe desertification and soil erosion, demonstrating high ecological sensitivity. Covering an area of approximately 111,103 km2 across eleven counties [34], the zone features a distinctive saddle-shaped topography, with higher elevations in the western and southern sections and relatively flat eastern plains. The area experiences a temperate continental monsoon climate, characterized by hot, rainy summers and cold, dry winters, with the mean annual precipitation ranging between 350 and 450 mm (National Bureau of Statistics of Chin). Grassland and cropland constitute the dominant land-use types, while severe grassland degradation has led to increased bare land areas and accelerated landscape fragmentation.
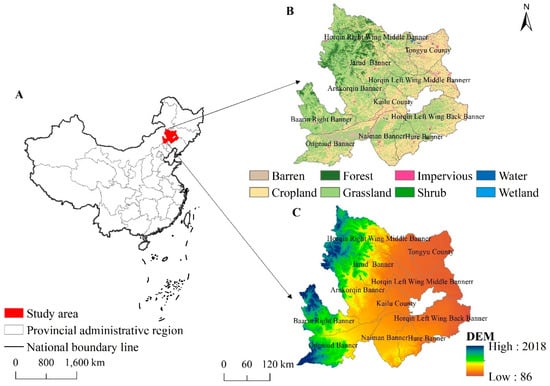
Figure 2.
The location of study area. Note: (A): the location of study area; (B): the land cover of study area; and (C): the elevation of study area.
From the perspective of ESP, the study area exhibits three distinctive spatial characteristics. First, forest and grassland ecosystems demonstrate a pronounced northwest–southeast bimodal distribution pattern, where the western hilly forest–grassland complexes and southeastern plain wetland remnants collectively form critical ecological core areas. Second, the central zone experiences intensive anthropogenic disturbances that disrupt ecological connectivity, creating a typical ecological barrier zone with significant restoration challenges. Third, the region shows strong interdependencies among ecological processes, with highly coupled ES, such as water conservation and windbreak-sand fixation functions, making it a priority area for conservation–restoration zoning. As such, the HSL serves not only as a nationally significant ecological functional zone, but also as a key component of China’s northern ecological security barrier and desertification control strategy belt. The area’s complex topography, diverse ecosystem structures, and dynamic land-use transitions provide an exemplary case for developing ESP and restoration zoning based on structure–function coupling mechanisms, with broad applicability across similar ecosystems.
2.2. Data Sources
The dataset in this study includes land-use data, topographic data, NDVI data, meteorological data and soil data (Table 1). The same projection coordinate system (Albers_Conic_Equal_Area) and spatial resolution (30 m × 30 m) were utilized for all data and all grid data, respectively.

Table 1.
Data sources and introductions.
2.3. Methodology
2.3.1. Identifying Ecological Sources
Ecological sources are patches that play a critical role in providing fundamental ES. This study employs a structure–function coupling model to identify ecological sources. First, five key ES were selected, including water yield, soil conservation, carbon storage, habitat quality, and windbreak and sand fixation. The selection was based on the study area’s natural characteristics, consistency with prior studies conducted in arid regions [35,36,37] and alignment with the targets of Sustainable Development Goal 15 (life on land), proposed by the United Nations in 2015. After consulting the relevant literature and expert advice [19,38,39], these services were equally weighted to generate a comprehensive ecosystem service index through overlay analysis [40]. Using the natural breaks method, the ESs were classified into five levels [11,23], and areas identified as “extremely important” and “important” ecological sources were extracted as preliminary ecological sources. Second, MSPA was applied to compute the ecosystem structure and identify core areas. Finally, the overlapping regions between the core areas and the preliminary ecological source areas were delineated as the final ecological source areas.
- (1)
- ES
This study employed the revised wind erosion equation (RWEQ) model to quantify the windbreak and sand fixation service, while the other four ES were evaluated using the InVEST 3.16.1 software.
- Soil conservation.
The InVEST model’s sediment delivery ratio (SDR) module was employed to estimate soil conservation, encompassing both potential retention and potential soil loss. The computation follows the equations derived from references [35,36]:
where denotes soil retention (t/hm2·a), represents potential soil erosion (t/hm2·a), and refers to potential soil loss (t/hm2·a). and orrespond to rainfall erosivity (MJ·mm/m2·h·a), soil erodibility factor (t·hm2·h/hm2·MJ·mm), and the topographic factor, respectively, while and account for the factor of vegetation cover and crop management, respectively: a factor of soil and water conservation measures without dimension
- Windbreak and sand fixation.
The function of windbreak and sand fixation was assessed through the revised wind erosion equation (RWEQ) model, which quantifies potential and actual soil loss driven by aeolian processes. The relevant equations are as follows [37]:
where is the amount of sand fixation (kg/m2); and are potential soil wind erosion (kg/m2) and actual soil wind erosion (kg/m2), respectively; and are the potential and actual maximum transfer volume of blown sand (kg/m), respectively; and are potential block length (m) and critical block length (m), respectively; is the maximum downwind erosion occurrence distance (m); is the meteorological factor (kg/m); is the soil erodibility factor (no dimension); is soil crust factor (dimensionless); is the surface roughness factor (dimensionless); and is vegetation cover factor (dimensionless).
- Carbon Storage.
Based on the carbon density method, the carbon storage and sequestration module in the InVEST model is used to calculate carbon storage. The calculation formula is as follows [41]:
where denotes the total carbon storage of the study area, is the area of land-use type (hm2), and is the carbon density value of the four carbon pools corresponding to land-use type : namely, above-ground carbon density (, t/hm2), underground carbon density (, t/hm2), soil carbon density (, t/hm2), and carbon density of dead organic matter , t/hm2).
With reference to the relevant literature [42,43], the temperature and precipitation were used to correct the carbon density value. We revised the national land carbon density data and the Loess Plateau carbon density data when the land types were not in the national land carbon density data. Finally, the carbon density value of the study area was shown in Table 2.

Table 2.
The carbon density for each land-use type in the study area (mg C/hm2).
The formula is as follows:
where and are the biomass coefficients for the precipitation and temperature, respectively; refers to the biomass correction coefficient; and correspond to the soil coefficients for the precipitation and temperature, respectively; KS denotes the soil organic correction coefficient; and represent the dead coefficients for the precipitation and temperature, respectively; represents the final dead organic correction coefficient; P′ and P″ represent precipitation in the study area and on a national scale or the Loess Plateau (mm); T′ and T″ represent temperature in the study area and on a national scale or the Loess Plateau (°C).
- Water Yield.
The water yield module of the InVEST model is used to calculate the water yield. The specific formula is as follows [36,37]:
where is the annual water quantity (mm) of the land-use type in cell ; is the actual evapotranspiration (mm) of the land-use type in cell . is the annual precipitation of cell (mm). is the Budyko dimensionless index of the land-use type in cell . is the ratio of annual vegetation water requirements to precipitation.
- Habitat Quality.
Habitat quality was assessed using the InVEST habitat quality module, which evaluates the relationship between habitat suitability and degradation. The formulation is given in Equation [44]:
where refers to the habitat quality index, represents the habitat sensitivity of the land-use type , denotes the habitat degradation degree of the land-use type in grid , and accounts for the half-saturation constant; and z corresponds to the normalization constant, typically taken as 2.5 [45,46].
- (2)
- MSPA
The MSPA model is developed to identify areas with better connectivity. Land-use types are divided into foreground and background. The foreground is the ecological space including forest, grassland, shrub, water, and wetland, and their value is 2. Bare land, impervious surfaces, and cropland are regarded as the background, and their value is 1. Based on the Guidos Toolbox 3.3 software, the MSPA calculated core areas, islands, bridges, edges, voids, loops, and branches. The core area, with less disturbance and most species, has been widely regarded as an ecological source [32,47].
2.3.2. Revising Ecological Resistance Surface
Ecological resistance refers to the impedance encountered during the exchange of material flow, energy flow, information flow, and other ecological processes between different ecological sources. With reference to existing studies [19,22], the construction of the ecological resistance surface in this study involved three main steps. First, initial resistance values were assigned to different land-use types. Based on research by Wang et al. [48] and Cao et al. [19], and considering the regional characteristics of the study area, the initial resistance values for forest, grassland/shrubland, water/wetland, cropland, bare land, and impervious surfaces were set as 1, 10, 30, 50, 70, and 100, respectively. Second, the digital elevation model (DEM), normalized difference vegetation index (NDVI), and slope were selected to modify the resistance surface [19]. These three factors were normalized and assigned equal weights. Third, the initial resistance values of land-use types were adjusted using the modified resistance factors. The correction formula is as follows [19]:
where is the final resistance surface, is the modified resistance surface, and is the initial resistance value of land-use type .
2.3.3. Extracting Ecological Corridors and Ecological Nodes
Ecological corridors establish connectivity between ecological sources, facilitating the exchange of energy, information, and ecosystem functions among species, and serve as vital channels for ecosystem restoration. Ecological barrier points, on the other hand, denote locations where such ecological connectivity is weakened or interrupted, hindering species dispersal and energy transmission. The circuit theory model treats the ecological resistance surface as a resistor network, simulating the migration process of species between ecological sources. Using the Linkage Mapper Toolkit in ArcGIS (https://www.arcgis.com/home/index.html), ecological corridors and nodes were extracted [49,50].
The Build Network and Map Linkages function was applied using both cost-weighted and Euclidean distance adjacency analyses to delineate optimal corridors under varying cost thresholds. The pinch point Mapper module, adopting an all-to-one analytical framework, was used to compute the cumulative current density, with high-current regions representing critical bottlenecks in the ecological network. Finally, the Barrier Mapper tool, employing a 1000 m search radius, was used to locate areas with elevated barrier scores that signified potential ecological obstacles.
2.3.4. Dividing ERZ
Building upon the established literature and considering the fundamental characteristics of ecological sources, corridors, and nodes, we propose the following zoning criteria (Table 3 and Table 4): (1) ecological sources are designated as conservation zones; (2) areas with high resistance values are classified as restoration zones; (3) ecological pinch points are identified as priority protection areas; (4) ecological barrier points are demarcated as critical restoration areas; and (5) the centroid of the ecological source with the highest corridor connectivity is designated as the primary core area, while sources with relatively high connectivity are classified as secondary core areas. Through systematic integration of these elements with the regional ecological baseline, we developed a comprehensive ecological protection and restoration zoning framework.

Table 3.
Ecological zoning classification criteria.

Table 4.
A classification of ecological restoration.
3. Results
3.1. Ecological Sources
3.1.1. Evaluation of ES
Ecosystem service functions in the Horqin Grassland Ecological Function Zone have significant spatial heterogeneity (Figure 3). Overall, habitat quality (Figure 3b), soil conservation (Figure 3e), and carbon storage (Figure 3d) services have high value in the western mountain area, whereas the windbreak and sand fixation (Figure 3a) and water yield (Figure 3c) services’ high value was predominately located in the eastern plain area. Specifically, the Kailu County, Horqin left wing back banner, Hure Banner, Naiman Banner, and Ongniud Banner showed dominant high-value areas of windbreak, sand fixation, and water yield services, in which the main land-use types are cultivated land and bare land. Habitat quality and carbon storage services’ high-value areas are distributed in the northwest of the Arukorqin Banner, Baarin Right Banner, Jarud Banner and Horqin Right Wing Middle Banner, where the land-use types are mainly grassland and woodland. Soil conservation’s spatial distribution trend was similar to the habitat quality and carbon storage services, but it was more widespread and distributed in the south of the Hure Banner, Naiman Banner, and Ongniud Banner.
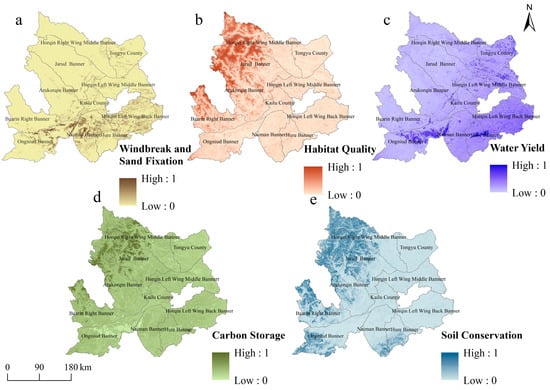
Figure 3.
Spatial distribution of ecosystem service functions. Note: (a): windbreak and sand fixation; (b): Habitat quality; (c): water yield; (d): carbon storage; (e): soil conservation.
The importance levels of ESs in the study area were obtained by the weighted superposition of five ESs and a natural breakpoint method (Figure 4). The northwest mountainous and the southeast plain areas showed extremely important and important ESs. The reason for this is that the areas have a high proportion of forest and grassland. The importance level of ES in the central region is relatively low, which distributed cropland, bare land, and impervious surfaces. Extremely important and important ecosystem service areas were identified as primary ecological sources, with an area of about 19,261.45 km2, accounting for 17.3%.
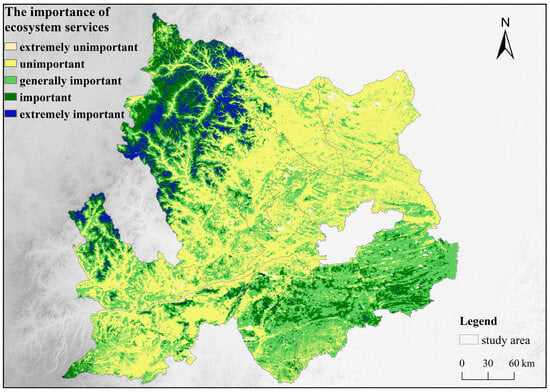
Figure 4.
The importance of ES.
3.1.2. The Consequence of MSPA
The landscape based on MSPA shows that the core area is mainly distributed in the northwest and southeast regions, with the largest area accounting for 39.8% (Figure 5). The core area is mainly distributed in the ecological conservation redline area, such as the Greater Khingan Mountains water conservation and biodiversity maintenance function ecological conservation redline area in the northwest, and the windbreak and sand fixation function ecological conservation redline area in the southeast sandy grassland. These places have a good ecological environment and landscape connectivity, which make them suitable for choosing as ecological sources. The bridge, loop, and branch areas play the role of landscape connection, accounting for 5.2%, 2.6%, and 2.9%, respectively. Isolated islands, known as “stepping stones”, are of great significance in maintaining ecological security, accounting for 2% of the total area. The edge and perforation area are distributed in the inner and outer edges of the core area, which have a certain effect on protecting the core area. In the study area, the edge and perforation areas account for 7.7% and 3%, which are relatively large areas and could protect the core area well. In general, the core areas are concentrated and contiguous, with good protection and good landscape connectivity, forming a healthy and stable ecosystem.
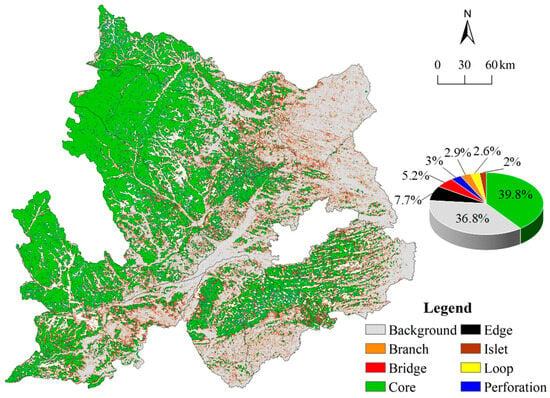
Figure 5.
Landscape classification and proportion of MSPA.
3.1.3. Ecological Sources Identication
From a structure–function perspective, this study integrated landscape pattern analysis with ecosystem service assessment to identify 76 critical ecological source areas, primarily distributed in the western mountainous regions and southeastern plains, including the Jarud Banner, Arukorqin Banner, Hure Banner, Horqin Left Wing Middle Banner, and Baarin Right Banner (Figure 6). These sources cover a total area of 10,204.38 km2, accounting for 9.18% of the study area. Dominated by forest and grassland ecosystems with minimal anthropogenic disturbances, these zones play a vital role in maintaining both the structural integrity and service functions of the ecosystem. The largest ecological source patch has an area of 1270.83 km2 and is located in the northwestern mountainous region, while the smallest patch, with an area of 50.12 km2, is situated adjacent to the largest patch. Overall, aside from the largest patch, the remaining ecological source patches exhibit relatively small differences in size, with a mean area of 134.27 km2.
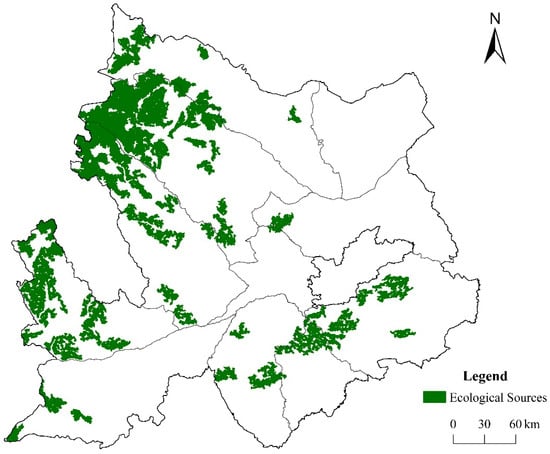
Figure 6.
The distribution of ecological sources.
3.2. Resistance Surfaces
Through the revision of land-use types’ resistance values, the spatial distribution of each resistance factor and comprehensive resistance surface is shown in Figure 7. The high resistance values were found in places with high urbanization levels and serious ecological degradation, such as the central part of Kailu County and the southern part of the Kulun Banner and the Naiman Banner, where there are concentrated bare lands and impervious surfaces. Meanwhile, the spatial distribution trend of low resistance value was similar to ecological source areas, where there was concentrated high vegetation coverage and less human disturbance.
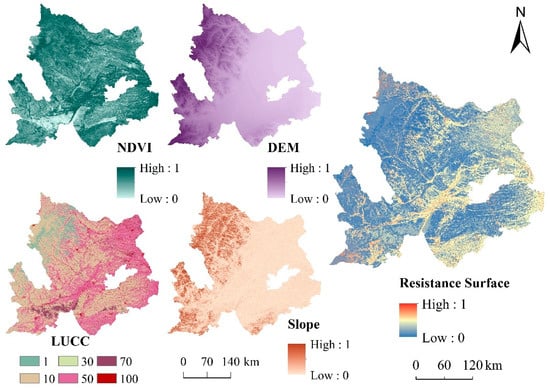
Figure 7.
The distribution of resistance surface.
3.3. Ecological Corridors and Ecological Nodes
The analysis involved varying the corridor width from 5 km to 50 km to evaluate how the ecological connectivity and the identification of key ecological corridors change with different thresholds. The results indicate that the 20 km threshold represents a reasonable balance between ecological connectivity and practical feasibility in the HSL. Using circuit theory modeling, 169 ecological corridors have been identified, totaling 4071.94 km in length, exhibiting a distinct west-dense, east-sparse spatial distribution pattern (Figure 8).
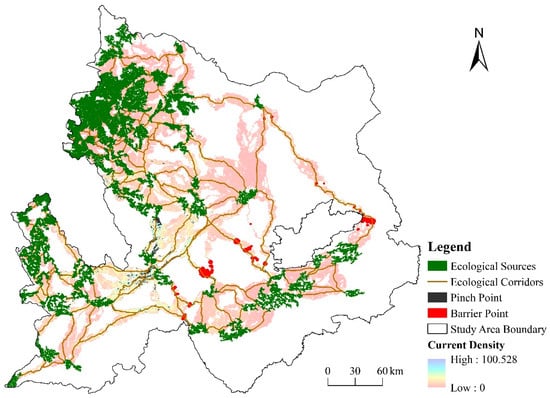
Figure 8.
The distribution of ecological security patterns.
Analysis of current density results identified critical ecological pinch points in areas with higher current density values, which constrain species movement and energy flows. As shown in Figure 8, these pinch points cover 239.91 km2 and exhibit clustered distributions in: (1) the southeastern Ar Horqin Banner and Bairin Left Banner, and (2) the northeastern Ongniud Banner. These zones serve as vital connectivity enhancers between northwestern and southwestern ecological source areas, warranting prioritized conservation efforts.
Ecological barrier points represent critical zones that disrupt species migration and energy flows between ecological sources, thereby compromising the ecosystem equilibrium. The analysis reveals that these barriers exhibit a fragmented spatial distribution, covering 568.85 km2, primarily along corridors connecting the northwestern and southeastern ecological sources. Dominated by bare land, impervious surfaces, and croplands, these areas demonstrate significantly reduced ecosystem service capacity, and thus constitute priority targets for restoration interventions. The classification criteria are determined by comprehensively evaluating each barrier point’s landscape resistance value and its land-use type.
3.4. Ecological Conservation and Restoration Zones
Based on comprehensive analyses of ecological sources, resistance surfaces, corridors, pinch points, and barrier points, following the proposed zoning criteria, this study established a “Five Zones, Three Belts, One Core” spatial framework for ecological conservation and restoration (Figure 9). The “Five Zones” are the northwest core protection zone, the southwest ecological protection zone, the central ecological restoration transition zone, the southeast wetland ecological restoration zone, and the northeast ecological restoration zone. The “Three Belts” are the wind-prevention and sand-fixation belt, the ecological protection belt of the Xiliao River Basin, and the ecological restoration belt. The “One Center” is the key ecological protection center.
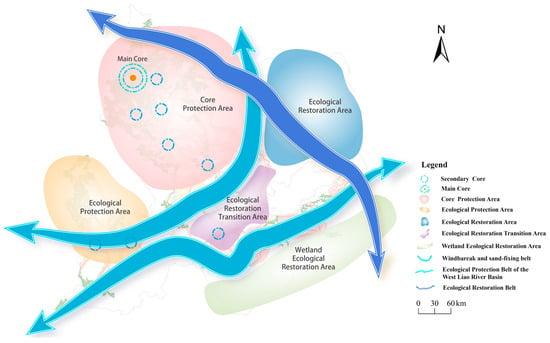
Figure 9.
Ecological protection and restoration patterns.
4. Discussion
4.1. Analysis for Improvement Countermeasures
The ecological restoration zoning of the Horqin Sandy Land fully considers multiple factors such as the importance of ecological functions, the connectivity of ecological structure, and the vulnerability of ecosystems, aiming to restore and enhance the stability and sustainability of the ecosystem. Similarly to the approach taken in the Maiji District [35], where divisions were based on “types of outstanding ecological problems,” our zoning strategy responds to the core drivers of desertification.
The “Five Zones” primarily focus on the ecological conservation and restoration through the systematic management of mountains, waters, forests, farmlands, lakes, grasslands, and sandy areas in the Horqin grasslands. The Western Ecological Conservation Zone and the Core Protection Zone, located in mountainous areas such as the foothills of the Greater Khingan Mountains, with dense ecological sources covering 76.27% of the total ecological source area, should continue to strengthen the protection of natural forest resources, actively promote pilot construction of natural parks like the Argun Dulun Grassland Park and the Elun Grassland Park, and rationally adjust the boundaries of protected areas. Initiatives such as precision forest quality improvement projects should be implemented to comprehensively advance the conservation of natural forests, the management of public welfare forests, and the restoration of degraded forests, thereby enhancing forest functions like water conservation, and windbreak and sand fixation. The Central Ecological Restoration Transition Zone and the Northern Ecological Restoration Zone coincide with high resistance, where the average resistance value is greater than 36 and the maximum resistance value is 54.99, and major barrier areas are identified by the circuit theory. These areas are predominantly characterized by three severe sandy belts: the southern bank of the Laoha River, the banks of the Jiaolai River, the Agula Sandy Belt, and the Taminchagan Sandy Belt, consisting mainly of mobile and semi-mobile sandy lands. It is recommended to combine the establishment of shelterbelt forests with the construction of plant-generated sand barriers to achieve mechanical sand fixation. Through the natural development of plants, sand barrier communities can form, accelerating the restoration and reestablishment of vegetation in sandy areas and enhancing the stability of sand-fixing plants. For fixed sandy lands with sparse vegetation, measures such as creating windbreak and sand-fixation forest networks and artificially reseeding grasses should be adopted to increase forest and grassland coverage, reduce the proportion of moderately and severely desertified land, and decrease soil wind erosion in desertified areas. The Southeastern Wetland Ecological Restoration Zone, identified as a pinch point area with a high water yield (Figure 3c), plays a vital role in maintaining regional hydrological balance. Restoration here should prioritize the protection of national wetland parks such as the Hulistai Naor, restore degraded wetlands, enhance wetland ecological functions, and strengthen the conservation of important river sources, upstream wetlands, and critical water sources in key rivers like the West Liaohe River, Xar Moron River, Laoha River, Jiaolai River, Xinkai River, and Ulgai Moron River. This will help to build an ecological protection system and improve water conservation functions. It is noteworthy that greater efforts should be made to protect farmland in sandy areas [3], vigorously promote water-saving technologies, such as shallow-buried drip irrigation, especially in southern areas with a high water yield (Figure 3c), and adjust and optimize the crop cultivation structure in sandy farmland to prevent land degradation and desertification caused by reclamation practices.
The delineation of the “Three Belts” holds significant importance for establishing ecological barriers and maintaining regional ecological security. The Windbreak and Sand-Fixation Belt, located along forested corridors in the western foothills of the Greater Khingan Mountains, aligns with high corridor connectivity and functions as a landscape-scale windbreak to block sand transport from high-resistance areas. The West Liaohe River Ecological Protection Belt, a typical pinch-point region, faces corridor interruption due to vegetation degradation and land desertification [19]; therefore, measures such as riparian buffer restoration, wetland rehabilitation, and water resource management are necessary to maintain the integrity of ecological corridors [51]. The Ecological Restoration Belt, dominated by barrier points in cropland and bare land in the north of the region, requires reseeding, windbreak establishment, and conversion of marginal farmland to reduce resistance and enhance connectivity. Overall, compared to previous studies, the “Three Belts” identified in this research provide a more in-depth analysis of ecological restoration in the study area from the perspectives of overall ecosystem stability and optimization of ecological conservation strategies, offering greater practical significance. Moving forward, efforts should focus on promoting agricultural water conservation in the West Liaohe River Basin, establishing riparian and lakeside buffer zones, actively advancing ecological restoration and protection of the water environment, and implementing both in situ and ex situ conservation measures for rare and endangered aquatic species, as well as important aquatic genetic resources. These actions will help safeguard water conservation ecological spaces and maintain biodiversity.
The “Core Zone” represents the area with the highest corridor connectivity, linking 11 corridors and serving as the central hub of the ecological network [52]. Located between the Huolin River and the Kunduleng River, this area includes the Inner Mongolia Hanshan National Nature Reserve and is home to important ecological public welfare forests, playing a crucial role in maintaining ecological balance and ecosystem connectivity. Therefore, it should focus on strengthening ecological protection, restoring fragmented patches, and maintaining connectivity among key corridors to ensure regional ecological security and ecosystem stability.
4.2. Limitations and Prospects
This study considers the structure and function of the ecosystem, uses the methods of ecosystem service and morphological spatial patterns, and combines circuit theory to construct an ecological protection and restoration pattern, providing scientific guidance for ecological restoration in arid areas. Nevertheless, there are still some limitations in this study. First, it constructs ecological protection and restoration zones only from an overall and macroscopic perspective, ignoring scale integration and cross-scale connections, which may weaken the effectiveness of ecological protection and restoration [53,54]. Second, it should be noted that some of the datasets used in this study have relatively coarse spatial resolution and temporal inconsistencies, and field validation was limited. Future research could improve accuracy by using higher-resolution and temporally consistent data, combined with more extensive ground verification. In addition, the study area largely corresponds to regions affected by historical land degradation and desertification trends (1990–2020). Integrating multi-decadal desertification trend data could further refine prioritization in future studies, and reinforce the urgency of restoration actions. Future research should focus on spatio-temporal scale issues to improve and refine the ecological protection and restoration pattern.
5. Conclusions
This study takes the HSL as a case area and integrates ecosystem structure and function to support ecological planning in an agropastoral landscape. The research addresses the following:
- (1)
- Identification of critical ecological sources: By coupling multiple datasets on ecosystem structure and function, key ecological source areas were identified, and their spatial distribution and functional attributes were characterized, highlighting regions that were critical for maintaining landscape connectivity and ecological integrity.
- (2)
- Construction of ESP: Using circuit theory, ecological corridors, nodes, and barrier points were delineated by integrating ES, landscape connectivity, and resistance mechanisms. This revealed the spatial pathways of ecological processes and identified areas where the ecological function is constrained by human activities, such as agriculture and settlements.
- (3)
- Translation into functional restoration zoning: The ecological network was transformed into a spatially differentiated protection and restoration pattern (“Five Zones, Three Belts, and One Center”), providing management strategies along a conservation–restoration–transition gradient. Policy recommendations were proposed to balance trade-offs between agriculture, settlements, and ecological protection, including passive restoration in bare lands, establishment of shelterbelts along cropland edges, and guidance for settlement expansion, away from critical ecological nodes.
Overall, this study demonstrates the value of combining multi-source data, MSPA, and circuit theory with a zoning-based framework to generate science-informed spatial governance strategies, reduce reliance on administrative boundaries, and provide practical guidance for sustainable ecosystem management in agropastoral sandy landscapes.
Author Contributions
Conceptualization, Q.Q. and Y.H.; Methodology, Y.F.; Investigation, M.Z.; Data curation, G.S.; Writing—original draft, W.Z.; Supervision, S.L.; Funding acquisition, W.Z. and Y.H. All authors have read and agreed to the published version of the manuscript.
Funding
This work was supported by the National Key R&D Program of China (Grant No. 2024YFF1306200, 2024YFF1306203, 2024YFF1306204) and the Establishment of Ecological Civilization Demonstration Areas (Grant No. 22110404005002001). The APC received no external funding.
Data Availability Statement
Data available upon request to the corresponding author.
Acknowledgments
We are grateful for the funding support provided by the Key Research and Development Program Project for this research. We also express our appreciation to the National Ecological Civilization Base Creation Work Group at the Chinese Research Academy of Environmental Sciences for their support during the research phase. We sincerely thank anonymous reviewers and editors for their valuable suggestions, which have significantly improved and strengthened this paper.
Conflicts of Interest
The authors declare no conflicts of interest.
References
- Willemen, L.; Barger, N.N.; Brink, B.T.; Cantele, M.; Erasmus, B.F.N.; Fisher, J.L.; Gardner, T.; Holland, T.G.; Kohler, F.; Kotiaho, J.S.; et al. How to halt the global decline of lands. Nat. Sustain. 2020, 3, 164–166. [Google Scholar] [CrossRef]
- Waltham, N.J.; Elliott, M.; Lee, S.Y.; Lovelock, C.; Duarte, C.M.; Buelow, C.; Simenstad, C.; Ivan, N.; Claassens, L.; Wen, C.K.-C.; et al. UN Decade on Ecosystem Restoration 2021–2030—What Chance for Success in Restoring Coastal Ecosystems? Front. Mar. Sci. 2020, 7, 71. [Google Scholar] [CrossRef]
- Liu, S.; Dong, Y.; McConkey, K.R.; Tran, L.-S.P.; Wang, F.; Liu, H.; Wu, G. Scientific concept and practices of life community of mountains, rivers, forests, farmlands, lakes, grasslands, and deserts in China. Ambio 2023, 52, 1939–1951. [Google Scholar] [CrossRef]
- Ran, Y.; Lei, D.; Li, J.; Gao, L.; Mo, J.; Liu, X. Identification of crucial areas of territorial ecological restoration based on ecological security pattern: A case study of the central Yunnan urban agglomeration, China. Ecol. Indic. 2022, 143, 109318. [Google Scholar] [CrossRef]
- Li, Q.; Zhou, Y.; Yi, S. An integrated approach to constructing ecological security patterns and identifying ecological restoration and protection areas: A case study of Jingmen, China. Ecol. Indic. 2022, 137, 108723. [Google Scholar] [CrossRef]
- He, H.; Yu, X.; Yu, H.; Ma, Z.; Luo, Y.; Liu, T.; Rong, Z.; Xu, J.; Chen, D.; Li, P.; et al. Suitable habitat evaluation and ecological security pattern optimization for the ecological restoration of Giant Panda habitat based on nonstationary factors and MCR model. Ecol. Model. 2024, 494, 110760. [Google Scholar] [CrossRef]
- Yu, K. Security patterns and surface model in landscape ecological planning. Landsc. Urban Plan. 1996, 36, 1–17. [Google Scholar] [CrossRef]
- Sun, D.; Wu, X.; Wen, H.; Ma, X.; Zhang, F.; Ji, Q.; Zhang, J. Ecological Security Pattern based on XGBoost-MCR model: A case study of the Three Gorges Reservoir Region. J. Clean. Prod. 2024, 470, 143252. [Google Scholar] [CrossRef]
- Wang, J.; Bai, Y.; Huang, Z.; Ashraf, A.; Ali, M.; Fang, Z.; Lu, X. Identifying ecological security patterns to prioritize conservation and restoration: A case study in Xishuangbanna tropical region, China. J. Clean. Prod. 2024, 444, 141222. [Google Scholar] [CrossRef]
- Li, H.; Chen, J.; Ling, M.; Chen, Z.; Lan, Y.; Huang, Q.; Li, X.; You, H.; Wang, F.; Han, X.; et al. A framework for dynamic assessment of soil erosion and detection of driving factors in alpine grassland ecosystems using the RUSLE-InVEST (SDR) model and Geodetector: A case study of the source region of the Yellow River. Ecol. Inform. 2025, 85, 102928. [Google Scholar] [CrossRef]
- Peng, J.; Yang, Y.; Liu, Y.; Hu, Y.; Du, Y.; Meersmans, J.; Qiu, S. Linking ecosystem services and circuit theory to identify ecological security patterns. Sci. Total Environ. 2018, 644, 781–790. [Google Scholar] [CrossRef]
- Aminzadeh, B.; Khansefid, M. A case study of urban ecological networks and a sustainable city: Tehran’s metropolitan area. Urban Ecosyst. 2010, 13, 23–36. [Google Scholar] [CrossRef]
- Wang, Z.; Shi, P.; Zhang, X.; Tong, H.; Zhang, W.; Liu, Y. Research on Landscape Pattern Construction and Ecological Restoration of Jiuquan City Based on Ecological Security Evaluation. Sustainability 2021, 13, 5732. [Google Scholar] [CrossRef]
- Qiao, E.; Reheman, R.; Zhou, Z.; Tao, S. Evaluation of landscape ecological security pattern via the “pattern-function-stability” framework in the Guanzhong Plain Urban Agglomeration of China. Ecol. Indic. 2024, 166, 112325. [Google Scholar] [CrossRef]
- Chen, X.; Kang, B.; Li, M.; Du, Z.; Zhang, L.; Li, H. Identification of priority areas for territorial ecological conservation and restoration based on ecological networks: A case study of Tianjin City, China. Ecol. Indic. 2023, 146, 109809. [Google Scholar] [CrossRef]
- Zhao, Y.; He, L.; Bai, W.; He, Z.; Luo, F.; Wang, Z. Prediction of ecological security patterns based on urban expansion: A case study of Chengdu. Ecol. Indic. 2024, 158, 111467. [Google Scholar] [CrossRef]
- Kong, F.; Yin, H.; Nakagoshi, N.; Zong, Y. Urban green space network development for biodiversity conservation: Identification based on graph theory and gravity modeling. Landsc. Urban Plan. 2010, 95, 16–27. [Google Scholar] [CrossRef]
- Xue, J.; Li, Z.; Feng, Q.; Gui, J.; Zhang, B. Construction of ecological conservation pattern based on ecosystem services of Three River Headwaters, Western China. Glob. Ecol. Conserv. 2023, 44, e02491. [Google Scholar] [CrossRef]
- Cao, W.; Li, X.; Lyu, X.; Dang, D.; Wang, K.; Li, M.; Liu, S. To explore the effectiveness of various ecological security pattern construction methods in many growth situations in the future: A case study of the West Liaohe River Basin in Inner Mongolia. Sci. Total Environ. 2024, 948, 174607. [Google Scholar] [CrossRef]
- Zhang, W.; Li, B.; Millington, A. Research on an Analytical Framework for Urban Spatial Structural and Functional Optimisation: A Case Study of Beijing City, China. Land 2021, 10, 86. [Google Scholar] [CrossRef]
- Ding, M.; Liu, W.; Xiao, L.; Zhong, F.; Lu, N.; Zhang, J.; Zhang, Z.; Xu, X.; Wang, K. Construction and optimization strategy of ecological security pattern in a rapidly urbanizing region: A case study in central-south China. Ecol. Indic. 2022, 136, 108604. [Google Scholar] [CrossRef]
- Zhou, G.; Huan, Y.; Wang, L.; Lan, Y.; Liang, T.; Shi, B.; Zhang, Q. Linking ecosystem services and circuit theory to identify priority conservation and restoration areas from an ecological network perspective. Sci. Total Environ. 2023, 873, 162261. [Google Scholar] [CrossRef]
- Gao, M.; Hu, Y.; Bai, Y. Construction of ecological security pattern in national land space from the perspective of the community of life in mountain, water, forest, field, lake and grass: A case study in Guangxi Hechi, China. Ecol. Indic. 2022, 139, 108867. [Google Scholar] [CrossRef]
- Santos, D.C.; Filho, P.W.M.S.; Nascimento, W.D.R.; Cardoso, G.F.; Santos, J.F.D. Land cover change, landscape degradation, and restoration along a railway line in the Amazon biome, Brazil. Land Degrad. Dev. 2020, 31, 2033–2046. [Google Scholar] [CrossRef]
- Knaapen, J.P.; Scheffer, M.; Harms, B. Estimating habitat isolation in landscape planning. Land-Scape Urban Plan. 1992, 23, 1–16. [Google Scholar] [CrossRef]
- Dai, L.; Liu, Y.; Luo, X. Integrating the MCR and DOI models to construct an ecological security network for the urban agglomeration around Poyang Lake, China. Sci. Total Environ. 2021, 754, 141868. [Google Scholar] [CrossRef] [PubMed]
- Li, T.; Li, M.; Liang, J.; Li, D.; Huang, X.; Liu, Q. Optimizing ecological networks for rare and endangered Plants: An integration of complex network analysis and circuit theory. J. Environ. Manag. 2025, 393, 127206. [Google Scholar] [CrossRef] [PubMed]
- Peng, B.; Yang, J.; Li, Y.; Zhang, S. Land-Use Optimization Based on Ecological Security Pattern—A Case Study of Baicheng, Northeast China. Remote Sens. 2023, 15, 5671. [Google Scholar] [CrossRef]
- Huang, K.; Peng, L.; Wang, X.; Deng, W.; Liu, Y. Incorporating circuit theory, complex networks, and carbon offsets into the multi-objective optimization of ecological networks: A case study on karst regions in China. J. Clean. Prod. 2023, 383, 135512. [Google Scholar] [CrossRef]
- Shen, J.; Zhao, M.; Tang, X.; Wu, C. Ecological restoration zoning and strategy based on ecosystem service supply and demand relationships: A case study of the Yellow River Basin. J. Nat. Conserv. 2025, 84, 126837. [Google Scholar] [CrossRef]
- Cong, Z.; Yang, S.; Zhu, B.; Wang, Y.; Liu, J. Identification of key ecological restoration areas based on ecological security patterns and territorial spatial ecological restoration zoning: A case study of the middle and lower reaches of the Yellow River in China. J. Nat. Conserv. 2025, 84, 126793. [Google Scholar] [CrossRef]
- Chen, W.; Gu, T.; Xiang, J.; Luo, T.; Zeng, J.; Yuan, Y. Ecological restoration zoning of territorial space in China: An ecosystem health perspective. J. Environ. Manag. 2024, 364, 121371. [Google Scholar] [CrossRef]
- Jiang, H.; Peng, J.; Zhao, Y.; Xu, D.; Dong, J. Zoning for ecosystem restoration based on ecological network in mountainous region. Ecol. Indic. 2022, 142, 109138. [Google Scholar] [CrossRef]
- Yang, J.; Huang, X. The 30 m annual land cover dataset and its dynamics in China from 1990 to 2019. Earth Syst. Sci. Data 2021, 13, 3907–3925. [Google Scholar] [CrossRef]
- Li, Z.; Deng, X.; Jin, G.; Mohmmed, A.; Arowolo, A.O. Tradeoffs between agricultural production and ecosystem services: A case study in Zhangye, Northwest China. Sci. Total Environ. 2020, 707, 136032. [Google Scholar] [CrossRef]
- Jiang, W.; Fu, B.; Gao, G.; Lv, Y.; Wang, C.; Sun, S.; Wang, K.; Schüler, S.; Shu, Z. Exploring spatial-temporal driving factors for changes in multiple ecosystem services and their relationships in West Liao River Basin, China. Sci. Total Environ. 2023, 904, 166716. [Google Scholar] [CrossRef]
- Hu, W.; Wu, X.; Zhang, K. Spatiotemporal change of beneficiary area from wind erosion prevention service in the Ulan Buh Desert in 2008 and 2018. Geogr. Sustain. 2022, 3, 119–128. [Google Scholar] [CrossRef]
- Cao, C.; Luo, Y.; Xu, L.; Xi, Y.; Zhou, Y. Construction of ecological security pattern based on InVEST-Conefor-MCRM: A case study of Xinjiang, China. Ecol. Indic. 2024, 159, 111647. [Google Scholar] [CrossRef]
- Wei, W.; Zhang, Y.; Wei, X.; Xie, B.; Ma, Z.; Liu, C.; Yu, L.; Zhou, J.; Shi, W.; Liu, T.; et al. Construction and optimization of ecological security patterns based on ecosystem service function and ecosystem sensitivity in the important ecological functional area—A case study in the Yellow River Basin. Ecol. Eng. 2025, 215, 107609. [Google Scholar] [CrossRef]
- Jie, Y.; Baopeng, X.; Taibing, W.; Mak-Mensah, E. Identification and optimization strategy of ecological security pattern in Maiji District of Gansu, China. Ecol. Indic. 2023, 157, 111309. [Google Scholar] [CrossRef]
- Zafar, Z.; Zubair, M.; Zha, Y.; Mehmood, M.S.; Rehman, A.; Fahd, S.; Nadeem, A.A. Predictive modeling of regional carbon storage dynamics in response to land use/land cover changes: An InVEST-based analysis. Ecol. Inform. 2024, 82, 102701. [Google Scholar] [CrossRef]
- Tang, X.; Zhao, X.; Bai, Y.; Tang, Z.; Wang, W.; Zhao, Y.; Wan, H.; Xie, Z.; Shi, X.; Wu, B.; et al. Carbon pools in China’s terrestrial ecosystems: New estimates based on an intensive field survey. Proc. Natl. Acad. Sci. USA 2018, 115, 4021–4026. [Google Scholar] [CrossRef]
- Xu, C.; Zhang, Q.; Yu, Q.; Wang, J.; Wang, F.; Qiu, S.; Ai, M.; Zhao, J. Effects of land use/cover change on carbon storage between 2000 and 2040 in the Yellow River Basin, China. Ecol. Indic. 2023, 151, 110345. [Google Scholar] [CrossRef]
- Wu, S.; Zhao, C.; Yang, L.; Huang, D.; Wu, Y.; Xiao, P. Spatial and temporal evolution analysis of ecological security pattern in Hubei Province based on ecosystem service supply and demand analysis. Ecol. Indic. 2024, 162, 112051. [Google Scholar] [CrossRef]
- Zhao, C.; Wu, S.; Yang, L.; Wu, Y.; Xiao, P.; Xu, J.; Liu, Y. Evaluating ecological conservation effectiveness of security patterns under multiple scenarios: A case study of Hubei Province. Ecol. Indic. 2024, 166, 112528. [Google Scholar] [CrossRef]
- Terrado, M.; Sabater, S.; Chaplin-Kramer, B.; Mandle, L.; Ziv, G.; Acuña, V. Model development for the assessment of terrestrial and aquatic habitat quality in conservation planning. Sci. Total Environ. 2016, 540, 63–70. [Google Scholar] [CrossRef]
- Zhang, Z.; Wang, Q.; Feng, Y.; Sun, Y.; Liu, N.; Yan, S. The spatio-temporal evolution of spatial structure and supply-demand relationships of the ecological network in the Yellow River Delta region of China. J. Clean. Prod. 2024, 471, 143388. [Google Scholar] [CrossRef]
- Wang, H.; Hu, Y.; Yan, H.; Liang, Y.; Guo, X.; Ye, J. Trade-off among grain production, animal husbandry production, and habitat quality based on future scenario simulations in Xilinhot. Sci. Total Environ. 2022, 817, 153015. [Google Scholar] [CrossRef]
- Mcrae, B.H.; Beier, P. Circuit theory predicts gene flow in plant and animal populations. Proc. Natl. Acad. Sci. USA 2007, 104, 19885–19890. [Google Scholar] [CrossRef]
- Qu, C.; Xu, J.; Li, W.; Zhai, Y.; Wang, Y.; Liu, B.; Yan, S. Integrating circuit theory and network modeling to identify ecosystem carbon sequestration service flow networks. Ecol. Inform. 2025, 87, 103077. [Google Scholar] [CrossRef]
- Li, X.; Li, X.; Lyu, X.; Dang, D.; Wang, K.; Zhang, C.; Cao, W. Linking ecological and social systems to promote regional security management: A perspective of ecosystem services supply-flow-demand. Ecol. Indic. 2023, 156, 111124. [Google Scholar] [CrossRef]
- Luo, X.; Le, F.; Zhang, Y.; Zhang, H.; Zhai, J.; Luo, Y. Multi-scenario analysis and optimization strategy of ecological security pattern in the Weihe river basin. J. Environ. Manag. 2024, 366, 121813. [Google Scholar] [CrossRef] [PubMed]
- Gong, D.; Huang, M.; Lin, H. Construction of an Ecological Security Pattern in Rapidly Urbanizing Areas Based on Ecosystem Sustainability, Stability, and Integrity. Remote Sens. 2023, 15, 5728. [Google Scholar] [CrossRef]
- Han, B.; Jin, X.; Xiang, X.; Rui, S.; Zhang, X.; Jin, Z.; Zhou, Y. An integrated evaluation framework for Land-Space ecological res-toration planning strategy making in rapidly developing area. Ecol. Indic. 2021, 124, 107374. [Google Scholar] [CrossRef]
Disclaimer/Publisher’s Note: The statements, opinions and data contained in all publications are solely those of the individual author(s) and contributor(s) and not of MDPI and/or the editor(s). MDPI and/or the editor(s) disclaim responsibility for any injury to people or property resulting from any ideas, methods, instructions or products referred to in the content. |
© 2025 by the authors. Licensee MDPI, Basel, Switzerland. This article is an open access article distributed under the terms and conditions of the Creative Commons Attribution (CC BY) license (https://creativecommons.org/licenses/by/4.0/).