Article

Effects of Stand Age Gradient and Thinning Intervention on the Structure and Productivity of Larix gmelinii Plantations

1
Research Institute of Forestry Policy and Information, Chinese Academy of Forestry, Beijing 100091, China
2
Chinese Academy of Forestry, Beijing 100091, China
*
Author to whom correspondence should be addressed.
Forests 2025, 16(10), 1552; https://doi.org/10.3390/f16101552
Submission received: 29 August 2025 / Revised: 1 October 2025 / Accepted: 4 October 2025 / Published: 8 October 2025
(This article belongs to the Section Forest Inventory, Modeling and Remote Sensing)

Abstract

Larix gmelinii is the fourth most important tree species in China and a typical zonal climax species in the cold temperate region, with high ecological and resource value. However, intensive logging, high-density afforestation, and insufficient scientific management have led to overly dense, homogeneous, and unstable plantations, severely limiting productivity. To clarify the mechanisms by which structural dynamics regulate productivity, we established a space-for-time sequence (T1–T3, T2-D, CK) under a consistent early-tending background. Using the “1 + 4” nearest-neighbor framework and six spatial structural parameters, we developed tree and forest spatial structure indices (TSSI and FSSI) and integrated nine structural–functional indicators for multivariate analysis. The results showed that TSSI and FSSI effectively characterized multi-level stability and supported stability classification. Along the stand-age gradient, structural stability and spatial use efficiency improved significantly, with FSSI and biomass per hectare (BPH) increasing by 91% and 18% from T1 to T3, though a “structural improvement–functional lag” occurred at T2. Moderate thinning markedly optimized stand configuration, reducing low-stability individuals from 86.45% in T1 to 42.65% in T2-D, while DBH, crown width, FSSI, and BPH (229.87 t·hm−2) increased to near natural-forest levels. At the tree scale, DBH, tree height, crown width, and TSSI were positive drivers, whereas a high height–diameter ratio (HDR) constrained growth. At the stand scale, canopy density, species richness, and mean DBH promoted FSSI and BPH, while mean HDR and stand density imposed major constraints. A critical management window was identified when DBH < 25 cm, HDR > 10, and TSSI < 0.25 (approximately 10–30 years post-planting). We propose a stepwise, moderate, and targeted thinning strategy with necessary underplanting to reduce density and slenderness, increase diameter and canopy structure, and enhance diversity, thereby accelerating the synergy between stability and productivity. This framework provides a practical pathway for the scientific management and high-quality development of L. gmelinii plantations.

1. Introduction

Forest ecosystems are the most important terrestrial carbon sinks globally and play a central role in the carbon cycle and climate regulation [1,2]. Guided by China’s “dual carbon” strategy and increasing demands for ecological restoration, the country has implemented a combination of national programs and forest management measures. These include the Natural Forest Protection Program, the Grain for Green Program, nationwide land greening initiatives, stand tending, forest transformation, and close-to-nature management. Collectively, these efforts have contributed to sustained improvements in ecosystem conditions and a significant expansion of forest area [3,4]. By 2022, China’s forest area had increased from approximately 117 million hm2 in the 1970s to 231 million hm2, with the largest area of planted forests in the world [5,6]. However, high-density, single-species plantation forests still exhibit significantly lower structural complexity, stability, ecological functions, and biodiversity compared to natural forests [7,8]. The mechanisms through which management interventions improve forest quality and ecological functions remain insufficiently understood [9].
Cold-temperate coniferous forests account for approximately 30% of the global forest area and play critical roles in timber production, carbon storage, water conservation, and ecological security [10]. Located in northeastern China, the Lesser Khingan–Greater Khingan region represents the southernmost margin of the cold-temperate coniferous forest zone, where it transitions into the temperate forest zone. This region is not only integral to the national strategic resource reserve but also indispensable to ecological security across Northeast Asia and beyond [4]. Within this region, Larix gmelinii is a typical zonal climax species [11], together with L. principis-rupprechtii and other larch species forming the main body of larch forests in China. L. gmelinii occupies 55% of the total larch forest area and 75% of the total standing volume [12]. According to the Ninth National Forest Resources Inventory (2014–2018), its importance value reached 10.99, ranking fourth among all tree species nationwide, which highlights its outstanding ecological and resource significance in cold-temperate forests [13]. However, since the mid-20th century, L. gmelinii has undergone intensive logging followed by high-density afforestation, resulting in large areas of even-aged monocultures [3,14,15]. These stands are commonly characterized by excessive density, imbalanced height–diameter ratios, and low structural stability, which have led to growth suppression, reduced productivity, and limited resistance to disturbances [14]. Under low-intensity disturbance scenarios, natural succession toward a climax community would require several centuries [16,17], which is insufficient to meet the urgent demand for rapid enhancement of carbon sequestration and ecological functions.
Forestry theory posits that forest community structure evolves over time from a simple, homogeneous state into a more diverse and stable complex system, accompanied by enhanced ecological functions [18,19]. Nature-based forest restoration and scientifically guided management interventions are widely recognized as key strategies for increasing terrestrial carbon sinks, promoting biodiversity conservation, and enhancing ecosystem resilience [6,8,20]. However, passive restoration approaches such as enclosure and natural succession have only locally facilitated species colonization and functional differentiation. Unmanaged conifer plantations still lag significantly behind natural forests in terms of structural heterogeneity, ecological stability, productivity, and ecosystem service provision [8]. Global comparative evidence demonstrates that stand structural stability, spatial heterogeneity, and architectural complexity are critical drivers of forest productivity and multifunctionality [21]. Specifically, enriched spatial tree patterns, multi-layered canopy structures, and well-regulated stand density can substantially improve light-use efficiency, enhance carbon accumulation, and promote community stability [22]. Therefore, L. gmelinii plantations urgently require scientifically based management interventions to accelerate the timeline for structural optimization and functional enhancement.
Reducing stand density, increasing species mixing, and enhancing spatial heterogeneity have been shown to significantly improve plantation productivity and resistance to disturbance [23]. Global studies indicate that, on average, mixed-species plantations exhibit 5.4% greater mean tree height (TH), 6.8% larger mean diameter at breast height (DBH), and 25.5% higher aboveground biomass compared to monocultures, with these advantages further amplified by increasing functional trait divergence among species [7]. In some cases, the aboveground biomass of 31-year-old mixed forests has been reported to exceed that of same-aged monocultures by as much as 64% [24]. Transformation practices of conifer monocultures in Europe have also confirmed these positive effects [23]. However, continuous and systematic empirical data on the interactive effects of stand age progression and management interventions in cold-temperate conifer monocultures remain scarce [8,25].
Close-to-nature management simulates natural disturbances through practices such as thinning, selective cutting, and pruning [26,27]. These interventions can optimize canopy structure and spatial tree configuration over relatively short timeframes, promote the natural regeneration of shade-tolerant broadleaved species, and enhance stand stability and resistance to disturbances [28,29]. At the same time, the space-for-time substitution approach, by comparing stands of different age classes, enables rapid identification of structural and functional change patterns, effectively addressing the temporal limitations of long-term fixed-plot monitoring [30]. However, several key gaps remain in current research: (1) a lack of multi-scale and integrated indicator systems for systematically evaluating structural stability and productivity at both the tree and stand levels; (2) the absence of chrono sequence-based experimental plots that combine continuous stand age gradients with management intervention controls, which are essential for uncovering the mechanisms underlying structural and functional improvement; and (3) insufficient identification of the key structural and functional variables that promote or limit forest development and ecosystem functioning [8,14].
To fill this research gap and to reveal the coupling mechanism between structural dynamics and productivity enhancement in L. gmelinii plantations, we established a typical multi-stage space-for-time plot sequence under a consistent early tending background. Using the “1 + 4” nearest-neighbor framework, tree spatial structure was characterized from multiple dimensions, including mingling, competition intensity, and spatial distribution pattern, and an evaluation system for spatial structural stability and productivity was developed. On this basis, we systematically assessed the combined effects of stand age gradient and thinning intervention. Furthermore, by integrating representative stand structural and functional indicators and applying multivariate analytical approaches such as generalized additive models (GAMs) and redundancy analysis (RDA), we quantitatively identified the mechanisms and regulatory factors driving productivity improvement through structural evolution and determined the optimal timing of intervention. The findings may provide scientific evidence and practical guidance for precision management and high-quality development of L. gmelinii plantations in cold-temperate regions.

2. Materials and Methods

2.1. Study Area

The study area is located in Yichun City [31], Heilongjiang Province, China (127°37′~130°46′ E, 46°24′~49°24′ N). The region has a northern temperate continental monsoon climate, with a mean annual temperature of 1.0~1.2 °C, annual accumulated temperature of 1700~2200 °C, a frost-free period of 87~120 days, and annual precipitation ranging from 750 to 820 mm, most of which falls between June and August. The dominant soil types are dark brown forest soil, meadow soil, and marsh soil, with humus content ranging from 6% to 8%, pH values between 5.0 and 5.5, and an average soil depth of up to 70 cm. The topography is generally higher in the northwest and lower in the southeast, with elevations ranging from 400 to 800 m and a maximum elevation of 1429 m [32]. The location of the study area is shown in Figure 1. Dominant tree species include Pinus koraiensis, L. gmelinii, Picea asperata, Abies fabri, Populus davidiana, Betula platyphylla, Juglans mandshurica, and Fraxinus mandshurica. Natural secondary forests and conifer plantations are widely and extensively distributed throughout the area [33].

2.2. Data Collection and Processing

2.2.1. Monitoring Plot Layout and Data Collection

Following the principles of representativeness and comparability, typical study plots were selected based on stand origin, stand age, age group, and management history. To minimize site heterogeneity, major site factors such as elevation, slope, aspect, and soil type were controlled. A space-for-time substitution approach [30] was applied in environmentally comparable areas to establish five stand types: (1) young forest (T1); (2) half-mature forest (T2); (3) thinned half-mature forest (T2-D), which underwent 20% thinning at ages 14 (in 2013) and 19 (in 2018) during the young forest; (4) pre-mature and mature forest (T3); and (5) natural secondary forest at the half-mature (CK), used as a reference control. All plantation plots were established using two-year-old L. gmelinii seedlings at an initial planting density of 3300 trees per hectare. The T1, T2, and T3 plots underwent only basic tending treatments during the first 10 years after planting, including light thinning, shrub cutting, and weeding, to promote the growth of target trees. No further management interventions were implemented afterward. For each stand type, three standard square plots of 0.0667 hm2 (25.82 m × 25.82 m) were established [34,35,36]. All plots were spaced more than 500 m apart to ensure spatial independence [37]. The spatial distribution of the sample plots is shown in Figure 1.
Field investigations were carried out during the peak growing season from August to October 2024. The coordinates of the four corners and the center of each plot were recorded using a high-precision RTK positioning device (Qianxun A300), and permanent markers were installed to delineate plot boundaries. A complete inventory was conducted within each plot for all trees with DBH ≥ 5 cm [12,35,38]. For each tree, the recorded attributes included species, DBH, TH, crown width (CW) in both the east–west and north–south directions, and geographic coordinates. DBH was measured at 1.3 m using a forestry caliper, TH was obtained with a Trupulse 200 laser rangefinder, and CW was measured using a compass combined with a laser distance meter [35].

2.2.2. Data Preprocessing

To ensure data quality and the accuracy of subsequent analyses, a systematic preprocessing of the raw field data was performed following the completion of the field survey. First, each tree record was carefully checked to remove duplicate entries, incomplete information, or measurement anomalies. Outliers in each variable were identified using statistical methods and then manually verified and corrected or excluded based on field notes. Second, data field names and measurement units were standardized. Tree species names were normalized according to the standards of the Plant Science Data Center of the Chinese Academy of Sciences (https://www.plantplus.cn/cn, accessed on 8 May 2025) to ensure taxonomic accuracy. Coordinate data were corrected based on the CGCS2000 national geodetic coordinate system. Projection transformation was conducted using ArcGIS 10.8, and projected coordinates were extracted for all trees and plot boundaries.

2.3. Calculation of Structural and Functional Indicators

2.3.1. Calculation and Classification of Spatial Structural Parameters

This study adopted a “1 + 4” nearest-neighbor framework to characterize tree spatial structure at a fine scale from three dimensions: species mixture, resource competition intensity, and spatial distribution pattern. Six key indicators were selected as core structural metrics: uniform angle index (UAI), mingling degree (MD), crowding (C), neighborhood comparison (NC), opening degree (OD), and competition index (CI). These metrics provided the foundational data for the subsequent development of the tree spatial structure index (TSSI). The definitions and classification criteria of each indicator are summarized as follows: UAI measures the horizontal uniformity of the reference tree and its nearest neighbors, with values of 0, 0.25, 0.50, 0.75, and 1 corresponding to five spatial patterns: highly uniform, uniform, random, aggregated, and highly aggregated. A value around 0.50, representing random distribution, is considered the optimal pattern for structural stability [39,40]. MD reflects the degree of species segregation between the reference tree and its neighbors, with values of 0, 0.25, 0.50, 0.75, and 1 representing no mixing, weak mixing, moderate mixing, strong mixing, and complete mixing, respectively [41]. C indicates the proportion of horizontal crown overlap between the reference tree and its neighbors, with values of 0, 0.25, 0.50, 0.75, and 1 corresponding to very sparse, sparse, moderately dense, dense, and very dense conditions. Higher values suggest increased spatial crowding and intensified competition [42]. NC assesses the relative size of the reference tree compared to its neighbors in terms of DBH. The values 0, 0.25, 0.50, 0.75, and 1 denote dominant, co-dominant, intermediate, suppressed, and highly suppressed status, respectively. Lower values indicate greater competitive advantage of the reference tree [43]. OD measures vertical openness using the ratio of the horizontal distance between the reference tree and its neighbors to the height of neighboring trees. It is classified into five levels: severely limited (0, 0.2], limited (0.2, 0.3], moderately sufficient (0.3, 0.4], sufficient (0.4, 0.5], and highly sufficient (0.5, +∞). Larger values reflect more open surrounding space and better conditions for light and nutrient availability [44,45]. CI represents the overall resource competition pressure experienced by the reference tree within its local neighborhood. Higher values indicate stronger growth limitation and serve as a key indicator for assessing structural stability and successional dynamics [46].

2.3.2. Construction of TSSI and FSSI

Tree- and stand-level spatial structures are inherently complex and heterogeneous, and thus cannot be adequately represented by a single indicator. To enable consistent and quantitative evaluation of spatial structure at the individual-tree scale, this study employed a multiplicative–divisive composite evaluation model to construct the TSSI [47]. In this approach, each structural variable was first normalized and classified as either a positive indicator (higher values indicate better conditions) or a negative indicator (lower values indicate better conditions). The final composite score was calculated as the ratio of the geometric product of positive indicators to that of negative indicators. Compared with traditional additive weighted methods, the multiplicative–divisive model retains the relative weights of all indicators while reducing the influence of extreme values, thereby allowing an integrated quantification of spatial structural stability. The decision vector is denoted as c = [ c 1 , c 1 , , c n ] , where the first b components are positive indicators and the remaining components are negative indicators. For all i ( 0 , n ) , v c i > 0 holds, and the composite evaluation function is defined as:
Q w = v c 1 v c 1 v c b v c b + 1 v c b + 2 v c n
Based on the above mechanism, six structural indicators (UAI, MD, OD, C, NC, and CI) were used to characterize spatial distribution patterns, interspecific association, stand density, individual dominance, and resource competition, respectively. Among them, MD and OD were regarded as positive indicators, while UAI, C, NC, and CI were treated as negative indicators. Specifically, since the optimal value of UAI corresponds to 0.5, a symmetric transformation was applied to align its directionality with the interpretation that lower values are more favorable. The transformation formula is as follows:
U A I i = U A I i 0.5
After transformation, the UAI values were mapped from the interval (0, 1] to (0, 0.5], where smaller values indicate a distribution pattern closer to the ideal random configuration. Based on these standardized indicators, the TSSI was calculated using the following formula:
T S S I g = [ 1 + M D g ] · 1 σ M D · [ 1 + O D g ] · 1 σ O D [ 1 + U A I g ] · σ U A I · [ 1 + C g ] · σ C · [ 1 + N C g ] · σ N C · [ 1 + C I g ] · σ C I
where T S S I g denotes the tree spatial structure index for the g-th individual, the terms U A I , MD, OD, C, NC, and CI represent the corresponding structural indicators, and σ denotes the standard deviation of each indicator within the stand. The constant term “1” in both numerator and denominator was introduced to prevent division by zero and to mitigate the influence of extreme values. To facilitate inter-tree comparison and visualization, the resulting TSSI values were normalized to the [0, 1] range using the min–max normalization method. Higher TSSI values indicate a more favorable and stable spatial structure. Finally, following the classification scheme proposed by Cao et al. [39], the TSSI values were divided into five levels: Class I (TSSI ≤ 0.2), Class II (0.2 < TSSI ≤ 0.4), Class III (0.4 < TSSI ≤ 0.6), Class IV (0.6 < TSSI ≤ 0.8), and Class V (TSSI > 0.8). In addition, the mean TSSI of all trees within a plot was used to represent the forest spatial structure index (FSSI) for that stand [48].

2.3.3. LBP-GAM Model Construction

To quantitatively evaluate the effects of tree structural attributes on individual tree biomass (TB) and enhance the accuracy of productivity estimation, a Generalized Additive Model (GAM) was employed to establish a nonlinear predictive framework. Five structural variables were selected as explanatory factors, including DBH, TH, CW, HDR, and TSSI, with TB as the response variable. Based on this framework, a Larch Biomass Prediction model based on GAM (LBP-GAM) was constructed. The mathematical formulation of the model is as follows:
T B i = β 0 + s 1 D B H i + s 2 T H i + s 3 C W i + s 4 H D R i + s 5 T S S I i + ε i
where β 0 is the intercept term, s k ( · ) denotes the smoothing spline function of k -th explanatory variable, and ε i represents the independently and identically distributed error term. This model allows each structural factor to exert an additive effect on TB in a nonlinear form, effectively capturing the allometric growth patterns of L. gmelinii across multiple structural dimensions.

2.3.4. Calculation of Stand Structural and Functional Parameters

Building upon the analysis of spatial structural characteristics at the tree level, this study further assessed stand growth status and productivity at both individual-tree and stand scales. At the individual-tree scale, the HDR and TB were selected to represent structural stability and productivity, respectively. These metrics were further used to derive the mean HDR (MHDR) and biomass per hectare (BPH). At the stand scale, several indicators were obtained, including age group (AG), average age (AA), mean DBH (MDBH), stand mean height (SMH), average CW (ACW), stand density (SD), crown density (CD), species richness (SR), and FSSI. Among these, SR reflects species composition diversity and serves as a fundamental indicator of structural stability at the community level [49]. The FSSI is derived from the integrated evaluation of tree-level spatial structural attributes and is used to assess the rationality and stability of stand structure. The calculation procedures and ecological interpretations of the associated indicators are described as follows:
(1)
HDR and MHDR
The HDR refers to the ratio of tree height to DBH for individual trees and is a fundamental dendrometry parameter used to characterize stem form [50]. HDR holds both mechanical and ecological significance: a higher value indicates a slender stem form and reduced resistance to windthrow or snow damage, whereas a lower value suggests a sturdier structure with greater resistance to disturbance. Typically, HDR decreases as DBH increases, showing a pattern of higher values at young developmental stages followed by gradual stabilization. Thus, HDR can be used to evaluate individual tree resistance to wind and snow as well as growth vigor, while MHDR serves as a sensitive indicator of stand-level competition intensity and structural optimization processes.
(2)
TB
Biomass is a key indicator for assessing forest quality and ecosystem functions, estimating carbon sequestration, and formulating forest management plans [51]. In this study, aboveground biomass for each tree was first estimated based on plot inventory data and existing species-specific allometric equations for dominant species. TB was then calculated by applying species-specific conversion coefficients between belowground and aboveground biomass. The sum of TB values for all trees within a plot was converted to per-hectare values to derive BPH, which was used as a proxy for stand productivity. The formula for calculating BPH is as follows:
B P H = 1 A i n t b i × 10,000
where BPH is the biomass per hectare (t·hm−2), A is the area of the plot (m2), n is the number of trees within the plot, and t b i is the biomass (t) of the i-th tree. For the dominant tree species, including L. gmelinii, Pinus koraiensis, Betula dahurica, and Abies fabri, aboveground biomass was estimated using species-specific bivariate allometric models. The general form of the equation is as follows:
A G B i = a · D B H i 2 · T H i b
where AGB is the aboveground biomass of the i th tree, DBHi (cm) and Hi (m) represent the diameter at breast height and tree height, respectively, and a and b are species- and region-specific model parameters. If the model estimates only aboveground biomass, total biomass can be derived using authoritative root-to-shoot conversion coefficients. The models and parameters used in this study were primarily referenced from national and industry standards, including the China Forest Tree Biomass Model Dataset [52], Methodology for Forest Management Carbon Sink Projects, Methodology for Afforestation Carbon Sink Projects, and the standards Biomass Models and Carbon Accounting Parameters for Oak Trees (LY/T 2658—2016), Biomass Models and Carbon Accounting Parameters for Birch Trees (LY/T 2659—2016), and Biomass Models and Carbon Accounting Parameters for Major Tree Species (GB/T 43648—2024).
(3)
SD
SD refers to the number of living trees per unit area (trees·hm−2), and serves as a fundamental metric for assessing forest structure, competition intensity, and resource use efficiency. Ecologically, SD directly reflects the spatial aggregation of trees. In low-density stands, competition is weak, and individual growth is mainly constrained by intrinsic potential. In contrast, high-density stands exhibit both inter- and intraspecific complementarity and competition, which alter resource allocation patterns and overall productivity. Numerous studies have demonstrated that SD is a key explanatory variable for productivity variation across different sites and climatic conditions, often with greater explanatory power than species richness [22]. Therefore, accurate quantification of SD is essential for analyzing competitive dynamics, determining thinning intensity, and optimizing forest management strategies. In this study, SD was estimated using the tree count method, with the calculation formula as follows:
S D = n A
where n is the number of trees with DBH ≥ 5 cm measured in the plot, and A is the area of the plot (hm2).
(4)
CD
CD refers to the proportion of the horizontal crown projection area relative to the total plot area. It quantifies canopy closure and space occupation efficiency [53]. This indicator directly reflects the stand’s capacity to regulate light resources and is closely related to photosynthetic potential, biomass accumulation, and ecological service provision [54]. In this study, the crown projection method was used to estimate CD. At the individual tree level, the horizontal crown area was approximated as an ellipse. The crown projection area for each tree was calculated and then summed across all individuals within the plot. The total canopy coverage area was divided by the plot area to obtain CD. The calculation formula is as follows:
C D = i = 1 n   π C W N S , i C W E W , i 4 A
where CD is crown density (dimensionless), C W N S , i and C W E W , i are the north–south and east–west crown diameters (m) of the i-th tree, n is the number of trees within the plot, and A is the plot area (m2).

2.4. Data Analysis Procedures and Statistical Methods

This study conducted multi-level statistical analyses at both the individual-tree and stand scales to systematically evaluate the variation patterns in structure–function characteristics of L. gmelinii plantations under different age gradients and thinning interventions. The goal was also to clarify the regulatory effects of stand-level factors on structural stability and productivity. The analytical framework included correlation analysis, classification, regression modeling, significance testing, and constrained ordination. First, structural and functional parameters were calculated according to the methods described in Section 2.3. Based on the TSSI and the standards described in Section 2.3.2, all samples were divided into five grades (I–V). The number distribution of L. gmelinii individuals at different grades was then summarized by stand type to quantify the improvement effect of structural stability. Second, the Shapiro–Wilk test was used to assess the normality of each variable, and Levene’s test was applied to test for homogeneity of variances. For variables that did not meet the assumptions of normality, Box–Cox transformation was used to fulfill the prerequisites for parametric analysis [55]. Depending on the distribution characteristics of each variable, Spearman or Pearson correlation coefficients were computed to construct a structure–function correlation matrix. Third, one-way analysis of variance (ANOVA) was employed, in combination with Tukey’s HSD test and the Compact Letter Display (CLD) method, to conduct multiple comparisons and intergroup visualization, so as to analyze the significant differences in structural and functional indices among different stand types [37]. Subsequently, at the individual-tree scale, GAM was employed to fit the nonlinear response of TB to five explanatory variables: DBH, TH, CW, HDR, and TSSI. Marginal response intervals and model fitting performance were extracted to evaluate the contribution of each structural factor. At the stand scale, ordinary least squares (OLS) regression was used to model the linear influence of MDBH, SMH, ACW, MHDR, CD, SR, SD, and FSSI on BPH. The regression slope, coefficient of determination (R2), and statistical significance of each factor were evaluated. Finally, redundancy analysis (RDA) was applied to build a constrained ordination model that elucidated the structure and function relationships. This approach identified the key driving variables and their directions of influence, and revealed the structure and function coupling patterns across different stand types within the ordination space.
Spatial data processing was conducted using ArcMap 10.8. Statistical analyses and visualizations were implemented within the Anaconda 3 environment using Python 3.9 scripts developed in PyCharm 2021.1.1. Key libraries used for data preprocessing, visualization, regression modeling, and multivariate analysis included NumPy 1.26.4, Pandas 2.2.3, Matplotlib 3.9.4, Seaborn 0.13.2, Scikit-learn 1.6.1, Statsmodels 0.14.4, Semopy 2.3.11, pyGAM 0.9.1, and SciPy 1.11.4.

3. Results

3.1. Structural and Functional Parameters

3.1.1. Tree-Level Parameter Calculations

Based on the collected data and following the method described in Section 2.3.1, spatial structural parameters of L. gmelinii trees (MD, OD, UAI, CN, C, and CI) were calculated. Descriptive statistics, including minimum, maximum, mean, and standard deviation, were then performed for DBH, TH, CW, TB, HDR, and the six structural parameters, as summarized in Table 1.
As shown in Table 1, L. gmelinii trees exhibited considerable variation in diameter at DBH, TH, CW, TB, and HDR. The mean values of DBH and TH were 20.00 cm and 18.42 m, respectively, while the means of CW and TB were 3.59 m and 200.27 kg, and the mean HDR was 9.99. Regarding spatial structural parameters, the mean values of MD, OD, UAI, C, CN, and CI were 0.24, 0.19, 0.47, 0.69, 0.42, and 1.83, with corresponding standard deviations of 0.30, 0.08, 0.17, 0.29, 0.35, and 1.03. These results indicate that the mean morphological traits and spatial structural parameters of L. gmelinii were generally at a moderate level, but the wide ranges of values demonstrate marked variability among individual trees.

3.1.2. Stand-Level Parameter Calculations

Based on the tree-level parameters, stand characteristics were summarized by plot. Stand species composition (SC) was calculated as the proportion of each species’ volume to the total stand volume in a plot, while age group (AG) and average age class (AA) were determined from plot survey records. Spatial structural parameters (MD, OD, UAI, CN, C, and CI) were first calculated at the tree level and then averaged arithmetically within each plot (weighted by the number of trees) to represent stand-scale characteristics, with statistical results presented in Table 2. The ranges of the six spatial structural parameters across the 15 plots were 0–0.80, 0.14–0.33, 0.43–0.51, 0.53–0.96, 0.44–0.51, and 1.42–4.68 for MD, OD, UAI, C, NC, and CI, respectively. Among them, MD, C, and CI exhibited relatively wide ranges with pronounced differences among plots, whereas OD, UAI, and NC showed comparatively small variation.
Furthermore, following the methods described in Section 2.3.2 and Section 2.3.4, structural and functional parameters, including MDBH, SMH, ACW, MHDR, SD, CD, SR, and BPH, were calculated and summarized for each stand group. Their means and standard deviations are reported, with descriptive statistics provided in Table 3. Along the T1–T3 gradient, most stand-level positive indicators exhibited an overall increasing trend, while MHDR and SD declined. Notably, BPH decreased in T2 but reached a relatively high level in T3. Overall comparisons indicated that the T1 group had the lowest MDBH, SMH, ACW, CD, and SR with values of 15.32 cm, 16.09 m, 2.53 m, 0.56, and 1.6, respectively, while showing the highest MHDR and SD with values of 10.87 and 1465 trees·hm−2, respectively. However, most indicators in T1 fluctuated within a relatively narrow range. Further comparison of T2, T2-D, and CK revealed that T2-D exhibited the most favorable MDBH, SMH, ACW, and MHDR with values of 23.12 cm, 18.57 m, 5.20 m, and 8.78, respectively. Its CD, SR, SD, and BPH were close to those of CK, though SMH, ACW, and SR showed larger variation. The CK group had the highest SR and BPH with values of 10.33 and 267.58 t·hm−2, respectively, but with significant within-group differences.

3.2. Tree and Stand Spatial Structure Indices

3.2.1. Tree-Level TSSI Results

Based on tree spatial structural parameters, TSSI was calculated for all individual trees in each plot following the method described in Section 2.3.2. For the ten most abundant species, the mean, variance, standard deviation, and median of TSSI were computed, with results shown in Table 4.
As shown in Table 4, significant differences in TSSI were observed among species. L. gmelinii had the largest number of individuals, but its mean TSSI was only 0.28, indicating a relatively low level. P. koraiensis, B. platyphylla, U. pumila, and B. dahurica had mean values ranging from 0.31 to 0.39, representing intermediate levels. F. mandshurica showed a mean of 0.42 and a median of 0.32, suggesting relatively stable performance. P. asperata and Acer pictum Thunb. had mean values of 0.38 and 0.37, but their medians were much lower, reflecting greater internal variation. Q. mongolica recorded the lowest mean at 0.25. Although P. amurense had the fewest individuals, it exhibited the highest mean of 0.44, an extremely low median of 0.03, and the largest standard deviation of 0.51, indicating the greatest variability among species.

3.2.2. Classification of Tree Structural Stability Levels

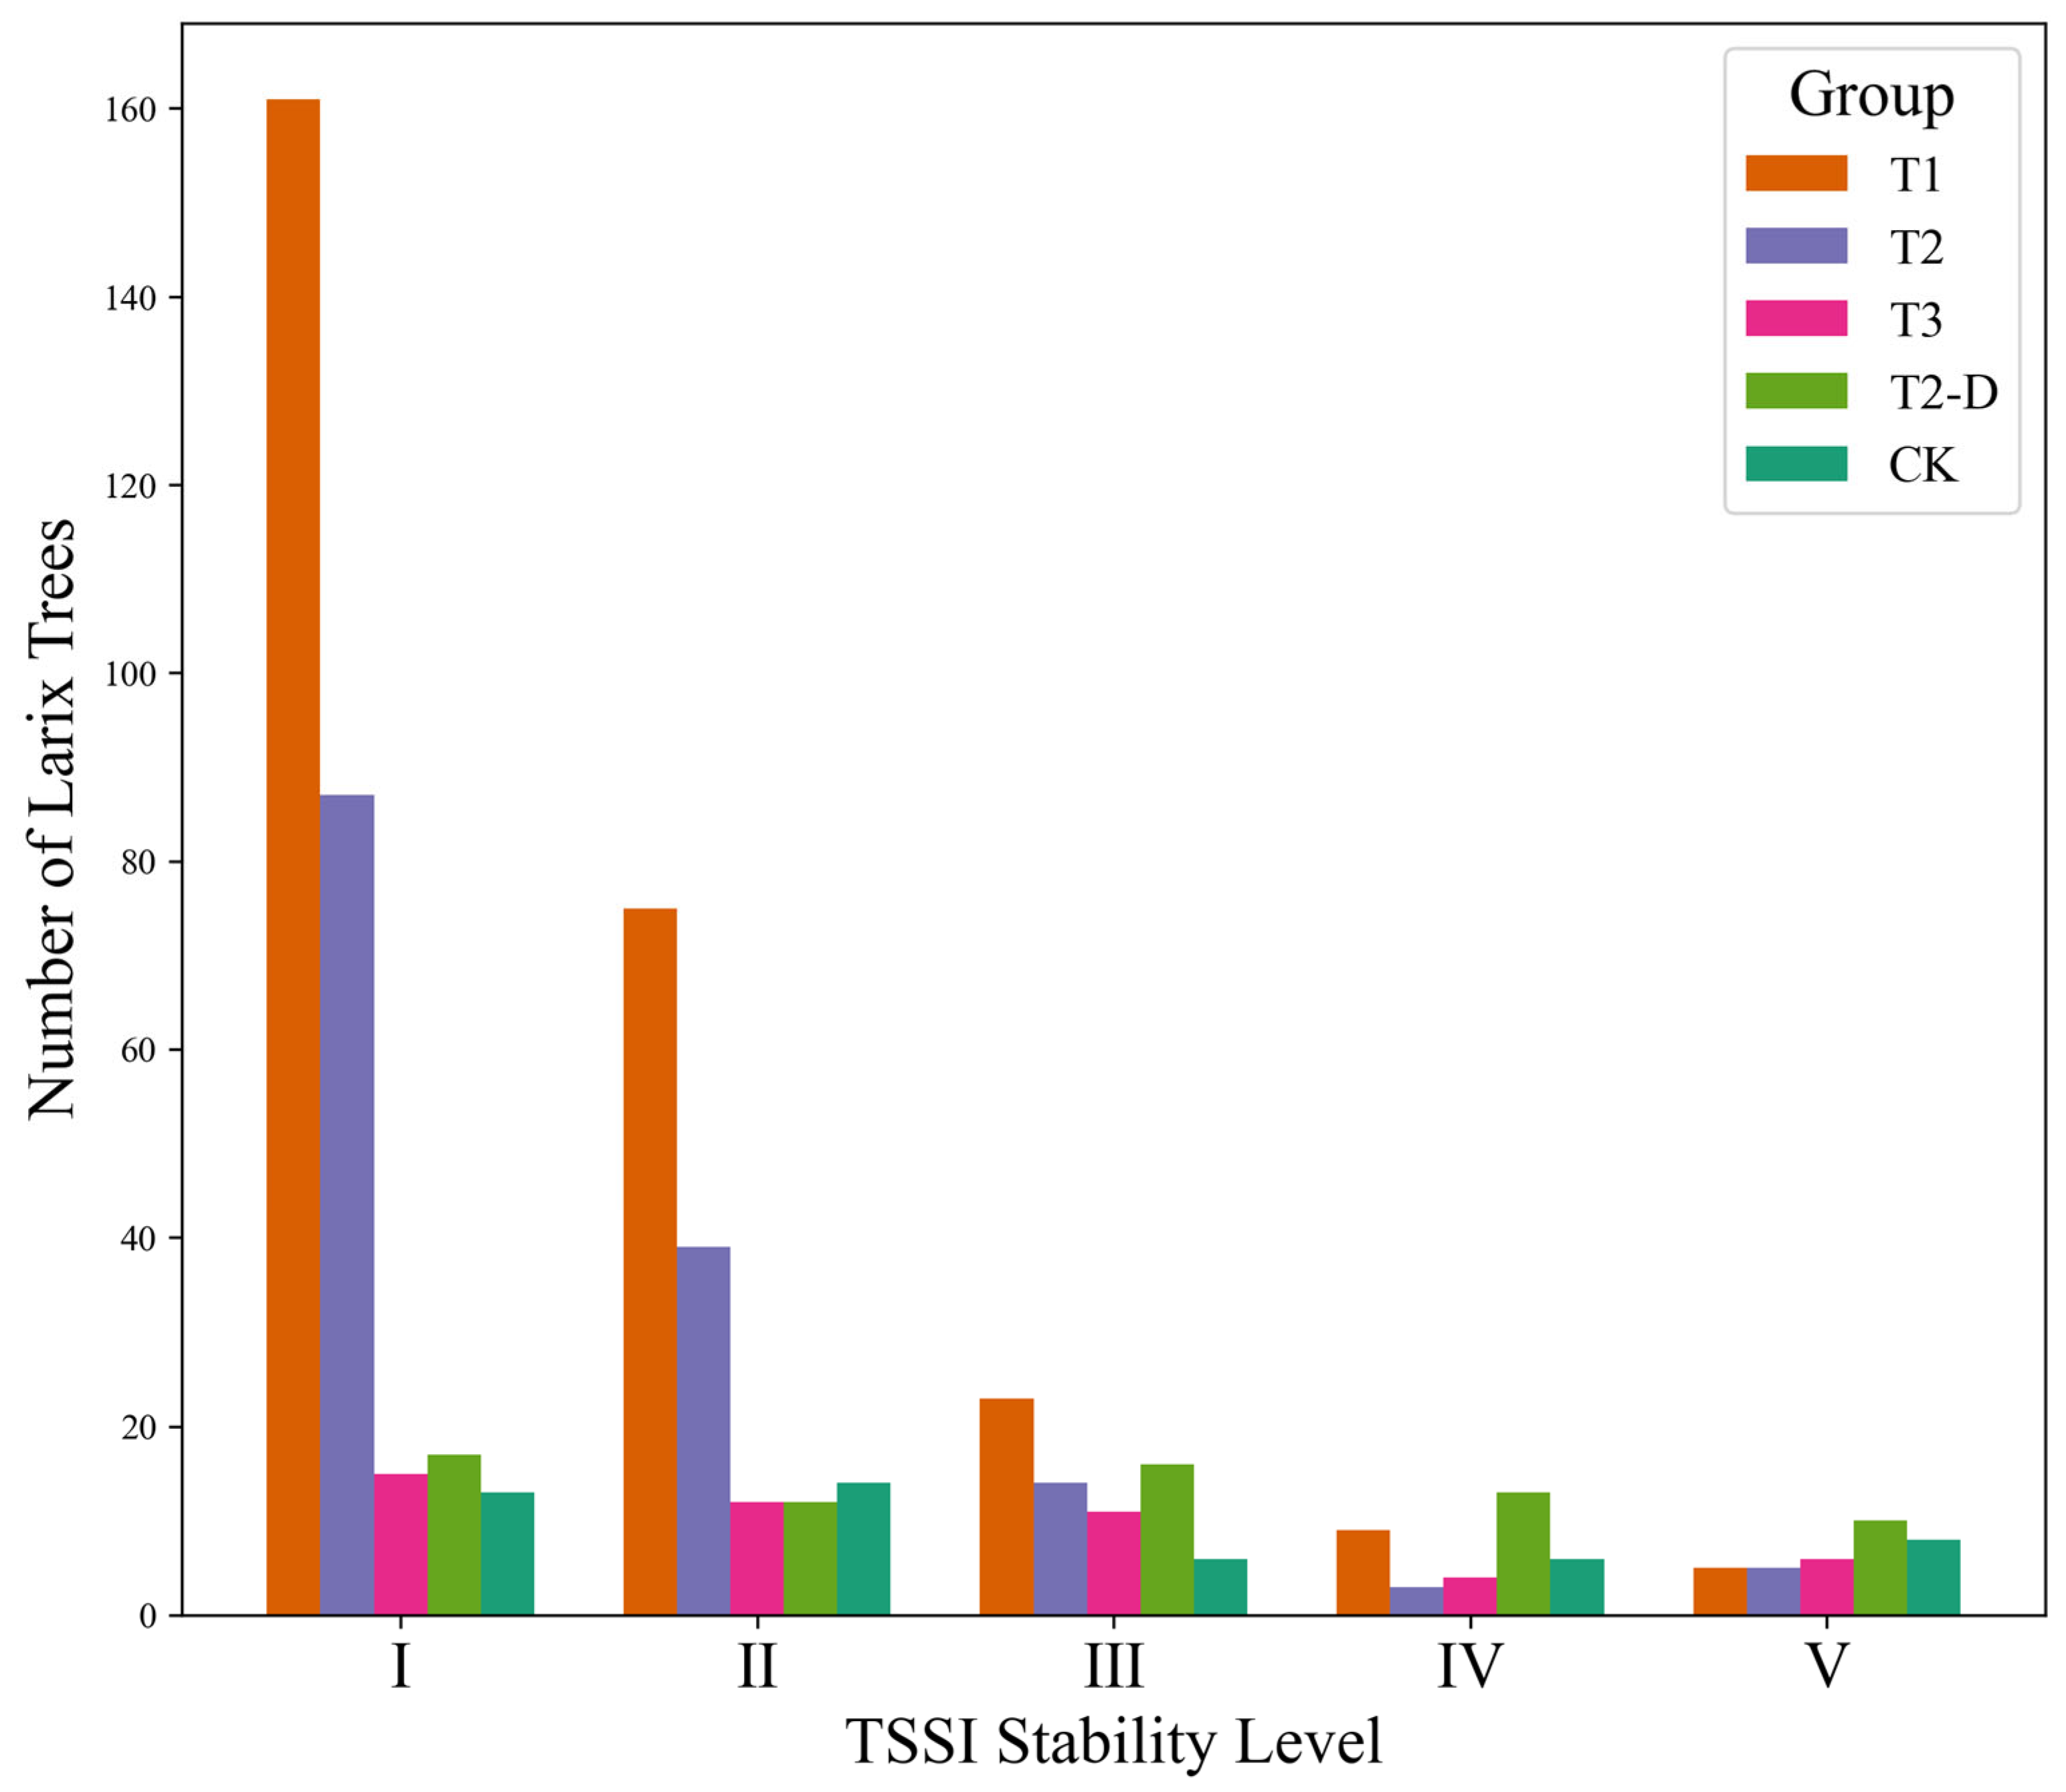
Based on the TSSI values and the classification method described in Section 2.3.2, all samples were categorized into five structural stability levels (Levels I to V), representing a gradient from low to high stability. Subsequently, key attributes of L. gmelinii trees, including DBH, TH, CW, HDR, TSSI, and TB, as well as the number of individuals in each class, were statistically summarized (Table 5). In addition, the number and proportional distribution of trees across the five stability levels were visualized for each stand type, as shown in Figure 2.
As shown in Table 5, among the 584 L. gmelinii trees sampled, 293 and 152 individuals were classified as Stability Levels I and II, accounting for 50.17% and 26.03% of the total, respectively. Level III included 70 individuals (11.99%), while Levels IV and V combined accounted for only 69 trees (11.82%). Overall, low-stability trees (Levels I and II) represented 76.20% of the population, indicating a predominance of structurally weak individuals and an overall need for structural improvement. Furthermore, trees at different TSSI levels exhibited clear gradient responses in structural and functional attributes. With increasing stability level, DBH and TH rose significantly from 15.39 cm and 16.33 m at Level I to 34.24 cm and 23.82 m at Level V. Correspondingly, TB increased from 117.23 kg to 500.69 kg, reflecting more than a threefold enhancement in individual growth potential. CW expanded from 2.81 m to 6.50 m, indicating stronger crown development and improved spatial efficiency in high-stability trees. In contrast, HDR decreased from 11.04 to 7.37, suggesting that structurally stable individuals exhibit sturdier and more balanced stem forms. In summary, TSSI-based classification closely aligns with variations in growth traits and effectively reflects structural stability differences and developmental stages. These results demonstrate the robust performance and practical applicability of TSSI as a structural evaluation tool.
As shown in Figure 2, the proportions of L. gmelinii trees in Stability Levels I and II were 86.45%, 85.13%, 56.25%, 42.65%, and 57.45% in the T1, T2, T3, T2-D, and CK groups, respectively. In contrast, the proportions in Levels IV and V were 5.13%, 5.41%, 20.83%, 33.82%, and 29.79%. The T2-D group had the lowest proportion of low-stability individuals, followed by the CK group, indicating that thinning intervention effectively enhanced structural stability and productivity [56].

3.2.3. Stand-Level FSSI Results

Based on the tree-level TSSI results, values were further aggregated at the plot scale to obtain the stand-level FSSI. Descriptive statistics of FSSI for each plot, including mean, variance, standard deviation, and median, are shown in Table 6.
As shown in Table 6, the T1 group was generally low, with FSSI ranging from 0.17 to 0.27, the highest in plot T1-3. The T2 group varied more, with values of 0.29 and 0.30 in T2-1 and T2-2, and 0.20 in T2-3. The T3 group improved markedly, reaching 0.45 and 0.50 in T3-2 and T3-3, the highest stability levels. T2-D ranged from 0.36 to 0.45, overall higher than the naturally developed T2. CK was relatively balanced at 0.32–0.37, but with large internal variance, indicating strong within-group differences.

3.3. Correlation Between Stand Structural Attributes and Ecosystem Functions

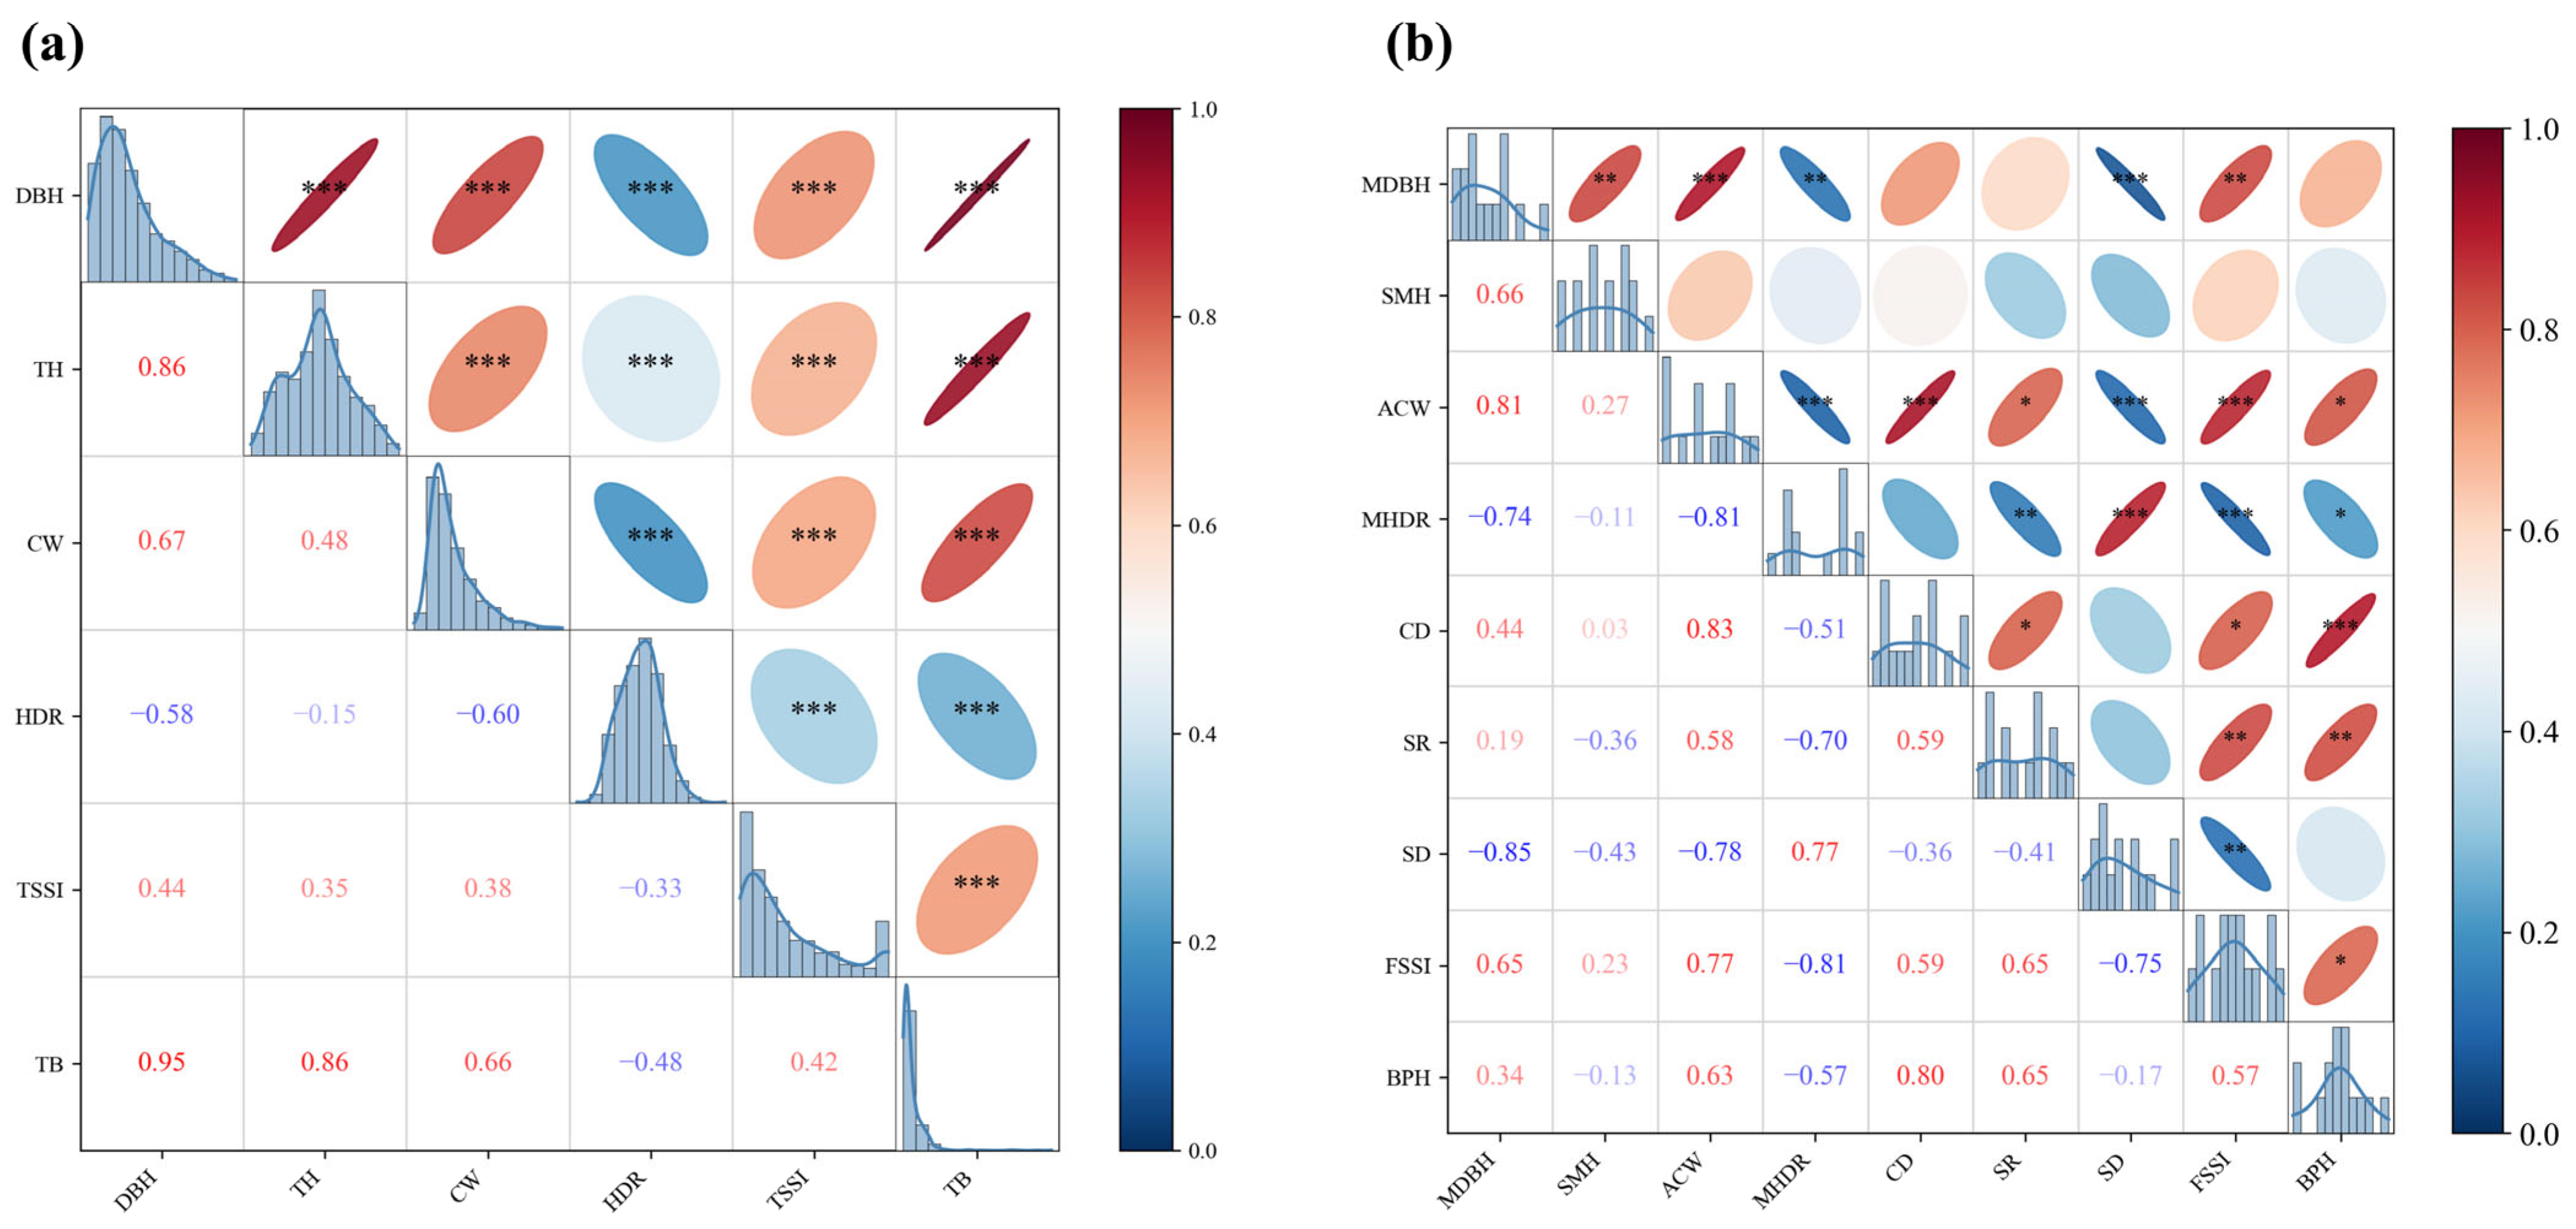
Prior to correlation analysis, the Shapiro–Wilk test and Levene’s test were conducted to assess normality and homogeneity of variance, respectively. Most variables at the individual-tree scale failed to meet the assumption of normality and were thus analyzed using Spearman’s rank correlation. At the stand scale, several variables approximated normality after Box–Cox transformation, allowing the use of Pearson’s correlation to assess linear relationships. As shown in Figure 3a, at the individual-tree scale, DBH, TH, CW, TSSI, and HDR exhibited strong correlations with TB, with correlation coefficients of 0.95, 0.86, 0.66, 0.42, and −0.48, respectively. All variables were highly significant (p < 0.001), indicating a strong explanatory capacity of structural parameters for productivity. Among them, DBH emerged as the core variable, showing significant positive correlations with both TH and CW, together reflecting the growth potential of individual trees. In contrast, HDR was significantly negatively correlated with TB and also showed negative correlations with other structural variables (ranging from −0.15 to −0.60), suggesting a close association between morphological instability and structural imbalance in trees [57]. At the stand scale (Figure 3b), most structural attributes also showed significant relationships with functional indicators. The correlation coefficients between FSSI and MDBH, SMH, ACW, MHDR, CD, SR, and SD were 0.65, 0.17, 0.77, −0.81, 0.59, 0.60, and −0.75, respectively. Among these, MDBH, ACW, and SR were strongly and positively correlated with FSSI (p < 0.01), whereas MHDR and SD were strongly negatively correlated (p < 0.01). Regarding BPH, ACW, CD, and SR had correlation coefficients of 0.62, 0.79, and 0.64, all of which were significant (p < 0.05) or highly significant (p < 0.01), indicating their positive contributions to stand productivity. In contrast, MHDR was negatively correlated with BPH (r = −0.57, p < 0.05). Additionally, SD showed negative correlations with several other variables, confirming the adverse impact of excessive stand density on productivity [58].

3.4. Stand Structural and Functional Comparisons Under Different Scenarios

3.4.1. Variation Along the Stand-Age Gradient

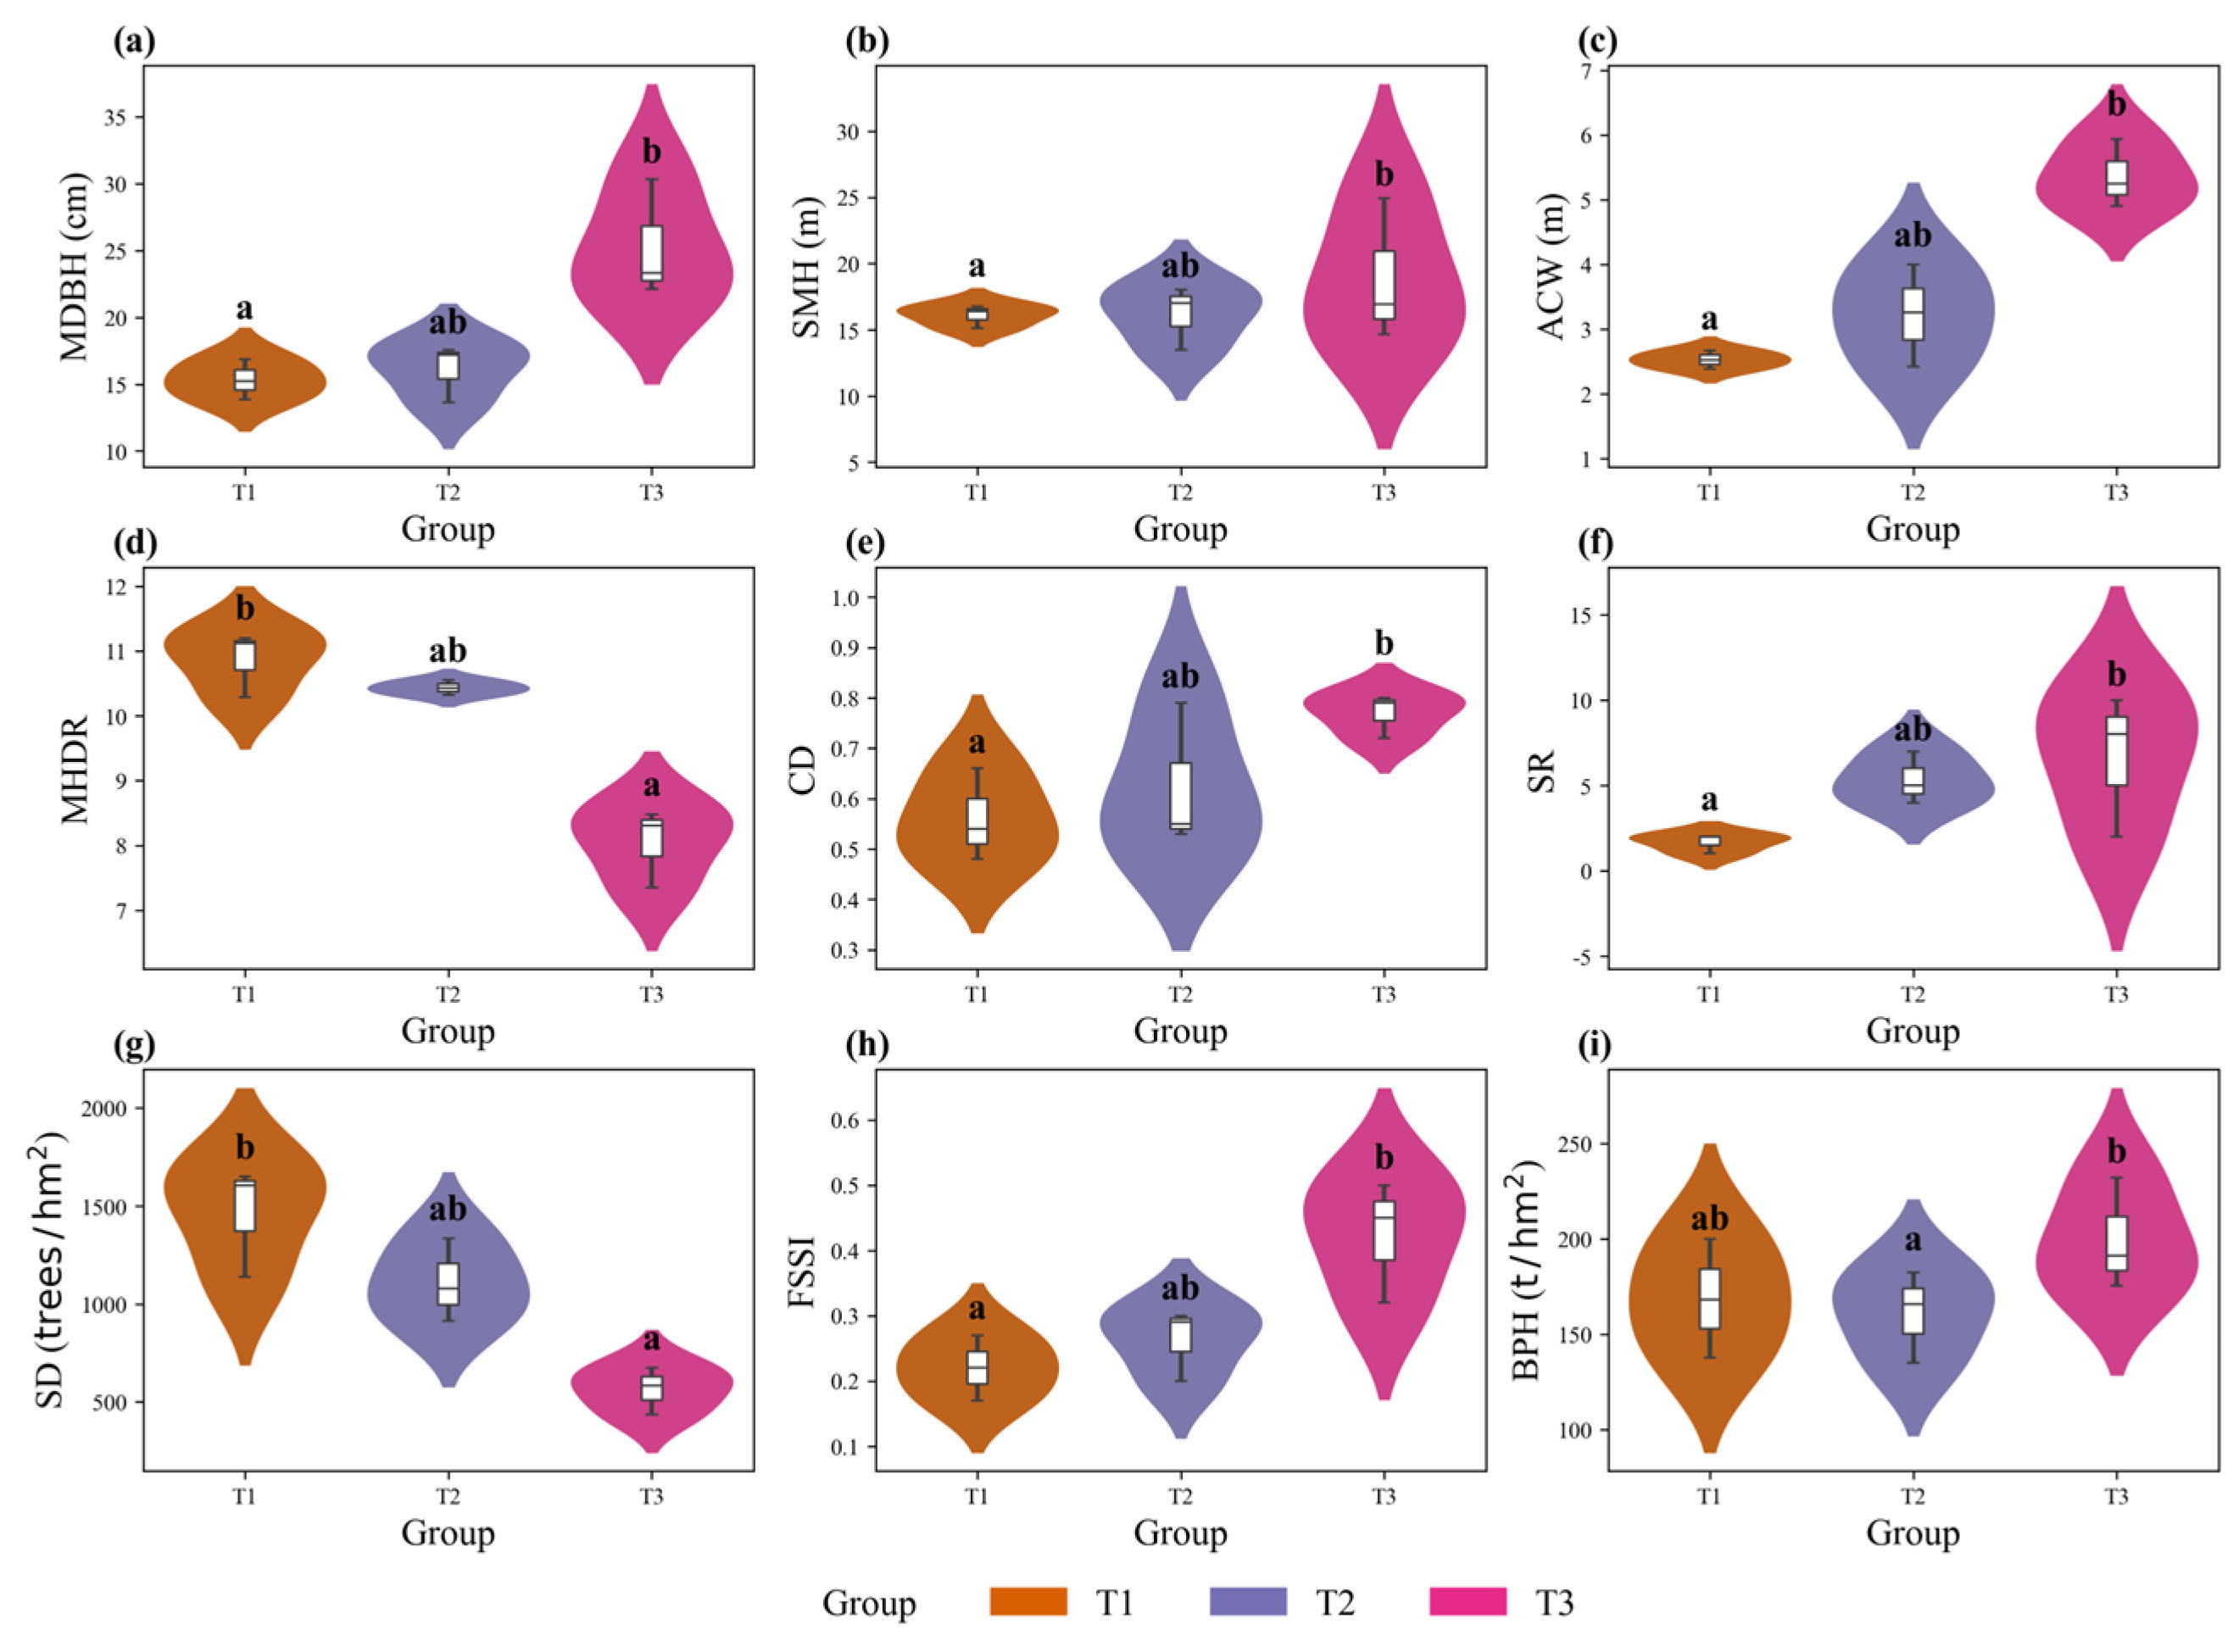
Within the framework of forest age gradients, nine indicators, including MDBH, SMH, ACW, MHDR, CD, SR, SD, FSSI, and BPH, were selected to analyze their response patterns to stand age. In addition, one-way ANOVA and Tukey’s HSD test were used to identify significant differences among groups. As shown in Figure 4, along the T1–T3 gradient, the distributions of MDBH and ACW shifted upward and became wider. The median MDBH in T3 was 23.34 cm, and the median ACW was 5.25 m, both significantly higher than the T1 medians of 15.25 cm and 2.53 m and the T2 medians of 17.18 cm and 3.26 m. MHDR and SD declined markedly with increasing stand age, with median values of 11.12 and 1605 trees·hm−2 in T1, decreasing to 8.31 and 585 trees·hm−2 in T3. CD and SR increased substantially in T3, with medians of 0.79 and 9.20 and noticeably wider distributions. FSSI and BPH were also significantly higher in T3 than in T1 and T2, with median values of 0.45 and 191.3 t·hm−2. Significance tests showed that, except for the two negative indicators MHDR and SD, which followed a reverse pattern of b–ab–a, all positive indicators exhibited a typical a–ab–b increasing trend, indicating that stand structure and function were synergistically optimized during stand-age succession.

3.4.2. Variation After Thinning Intervention

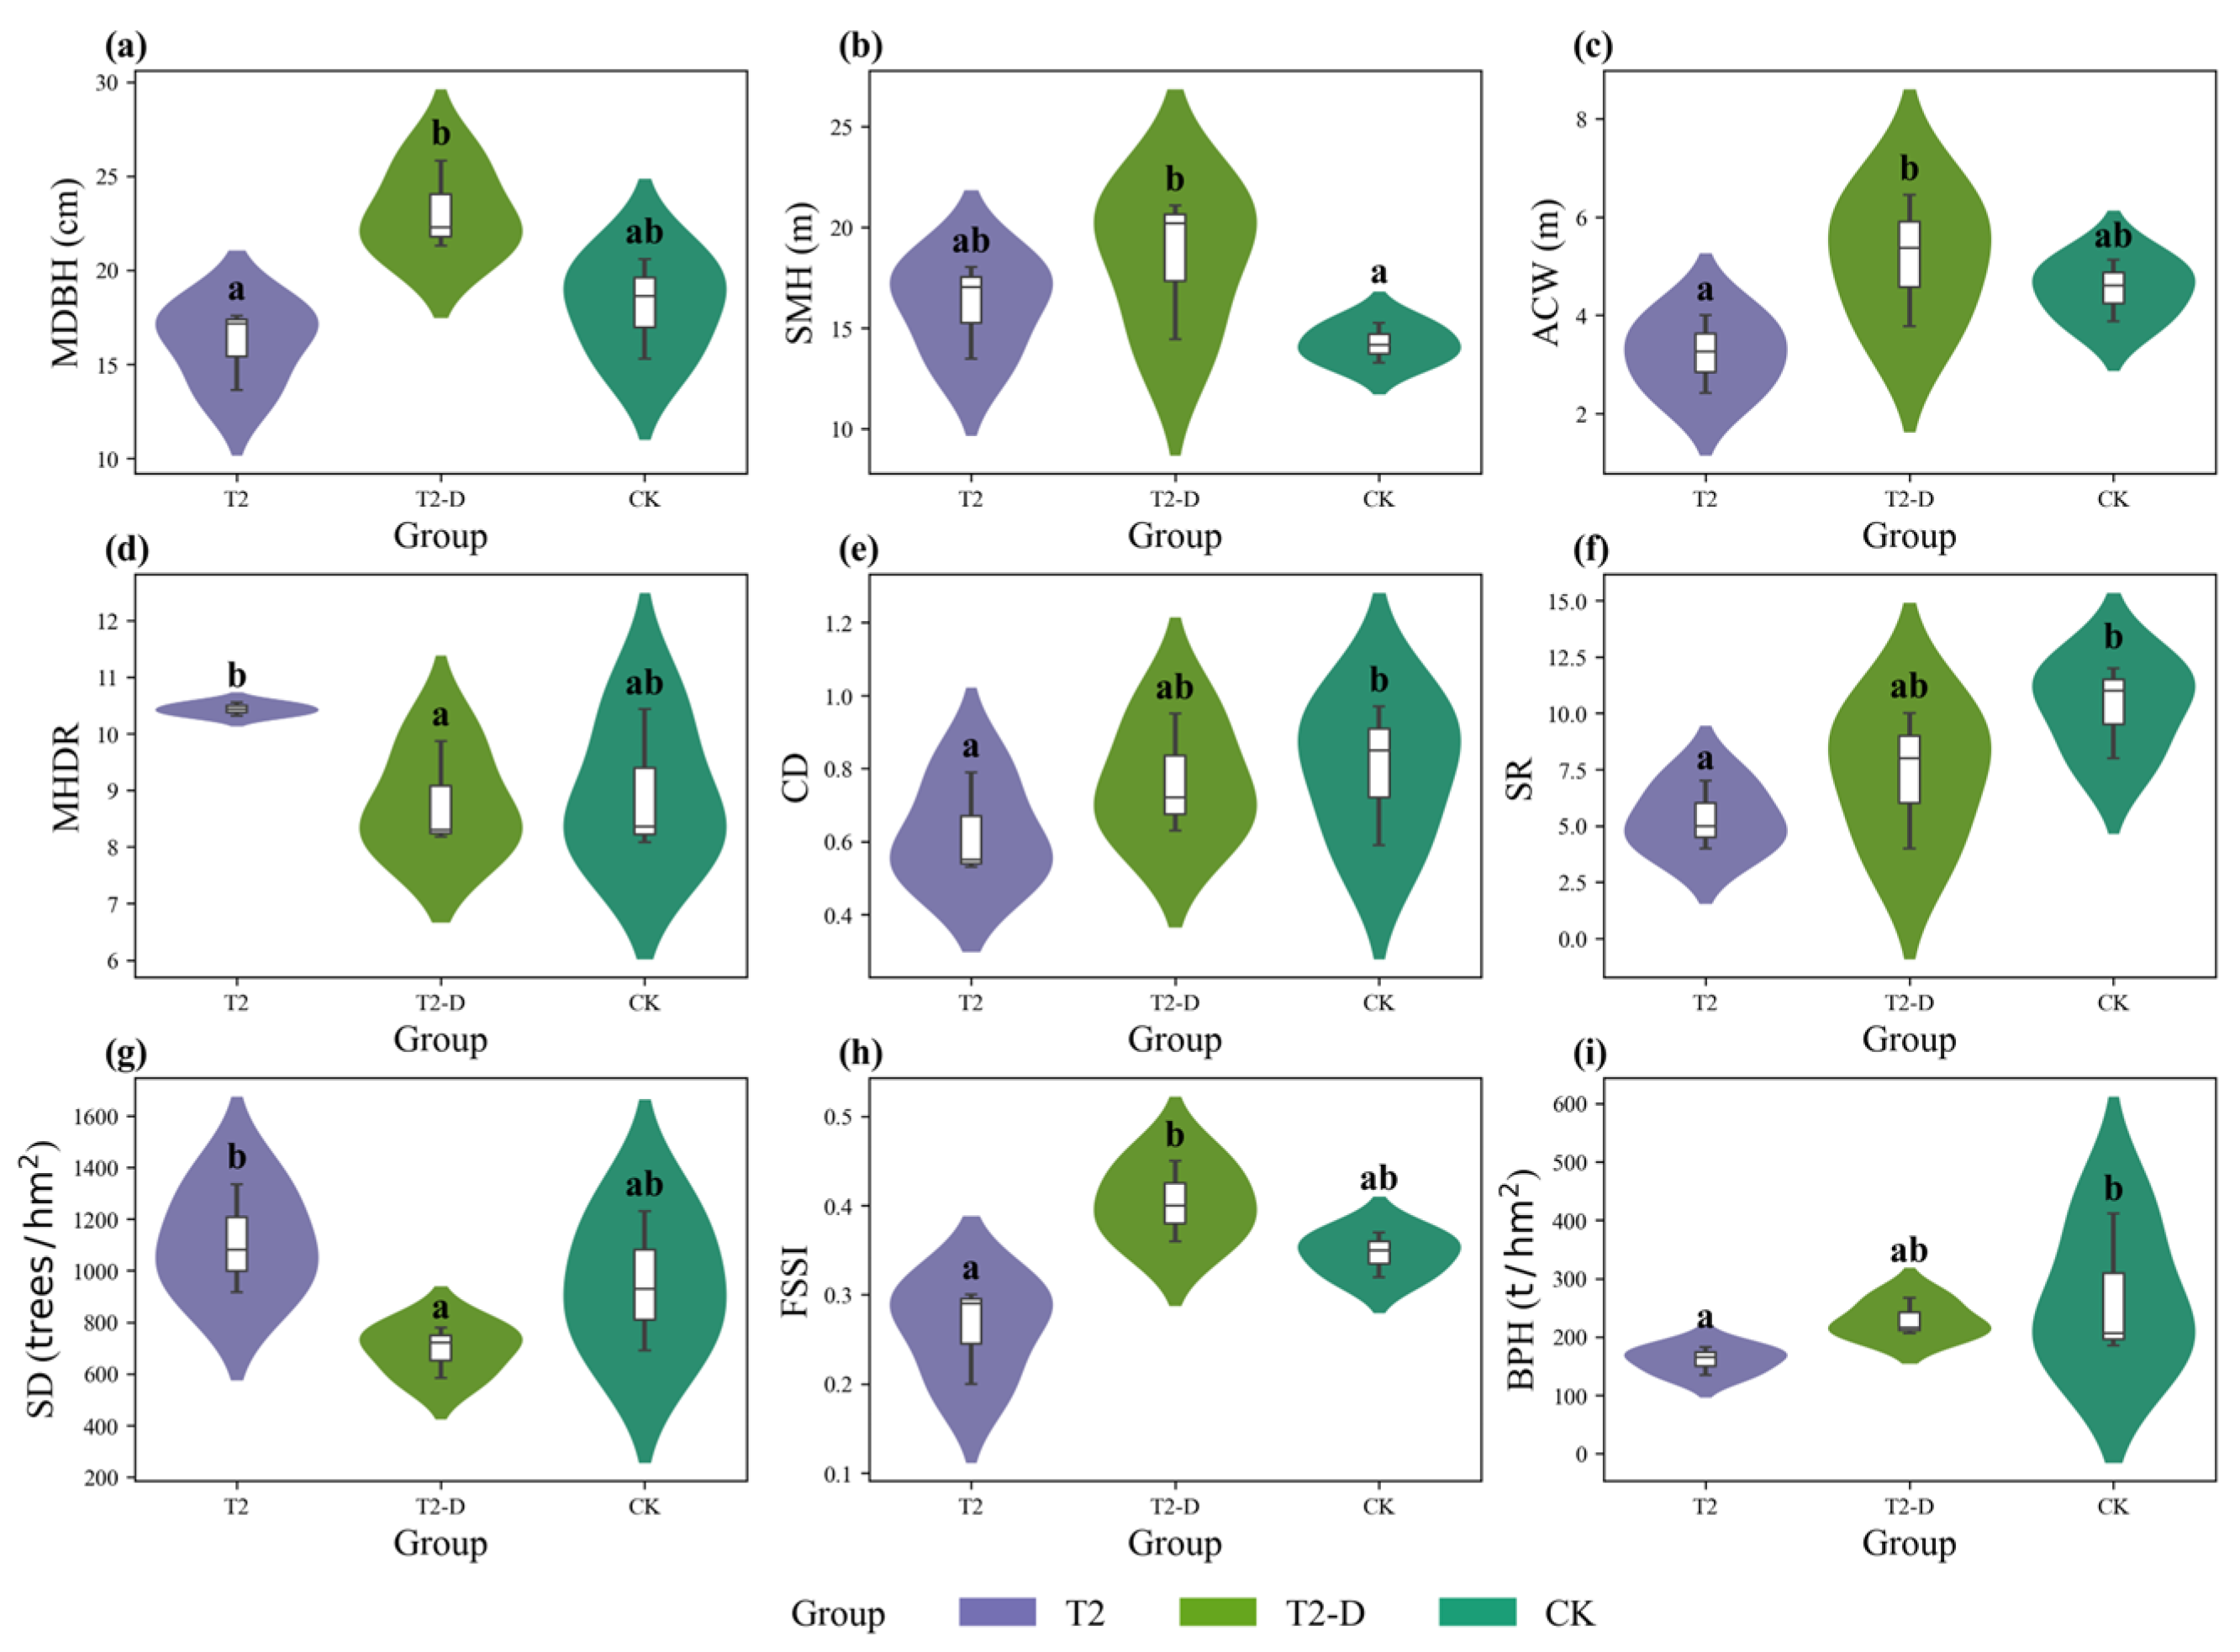
To systematically compare the structural and functional responses of L. gmelinii plantations and natural secondary forests across different stand ages and thinning treatments, nine key indicators (MDBH, SMH, ACW, MHDR, CD, SR, SD, FSSI, and BPH) were used to assess variation across stand types. The results are presented in Figure 5.
As shown in Figure 5, the distributions of all indicators in the T2-D group shifted upward and were markedly superior to those in T2. The median values of MDBH, SMH, ACW, CD, SR, FSSI, and BPH in T2-D were 22.27 cm, 20.19 m, 5.37 m, 0.72, 8.0, 0.40, and 216.2 t·hm−2, respectively, while MHDR and SD declined to 8.3 and 720 trees·hm−2. Compared with CK, T2-D had higher medians for MDBH, SMH, and ACW, a similar FSSI, and slightly lower SR and BPH. Significance testing showed that most indicators followed the pattern T2 < T2-D ≥ CK. Specifically, T2-D was significantly higher than T2 in MDBH, SMH, ACW, and FSSI, reaching levels comparable to or exceeding CK, whereas SR and BPH were highest in CK, intermediate in T2-D, and lowest in T2. MHDR and SD displayed the opposite trend of T2 > CK > T2-D. Overall, T2-D demonstrated clear advantages in most structural and functional indicators, with its overall level approaching, and in some cases surpassing, that of the natural CK stands.

3.5. Relationships Between Structural Factors and Productivity

Building on the above analyses, coordinated variation was observed between structural and functional indicators, but the specific influence of individual structural factors on tree biomass and stand productivity remained unclear. To address this, we further analyzed their relationships at both tree and stand scales using correlation and regression, as detailed below.

3.5.1. Tree-Level Factors and Biomass

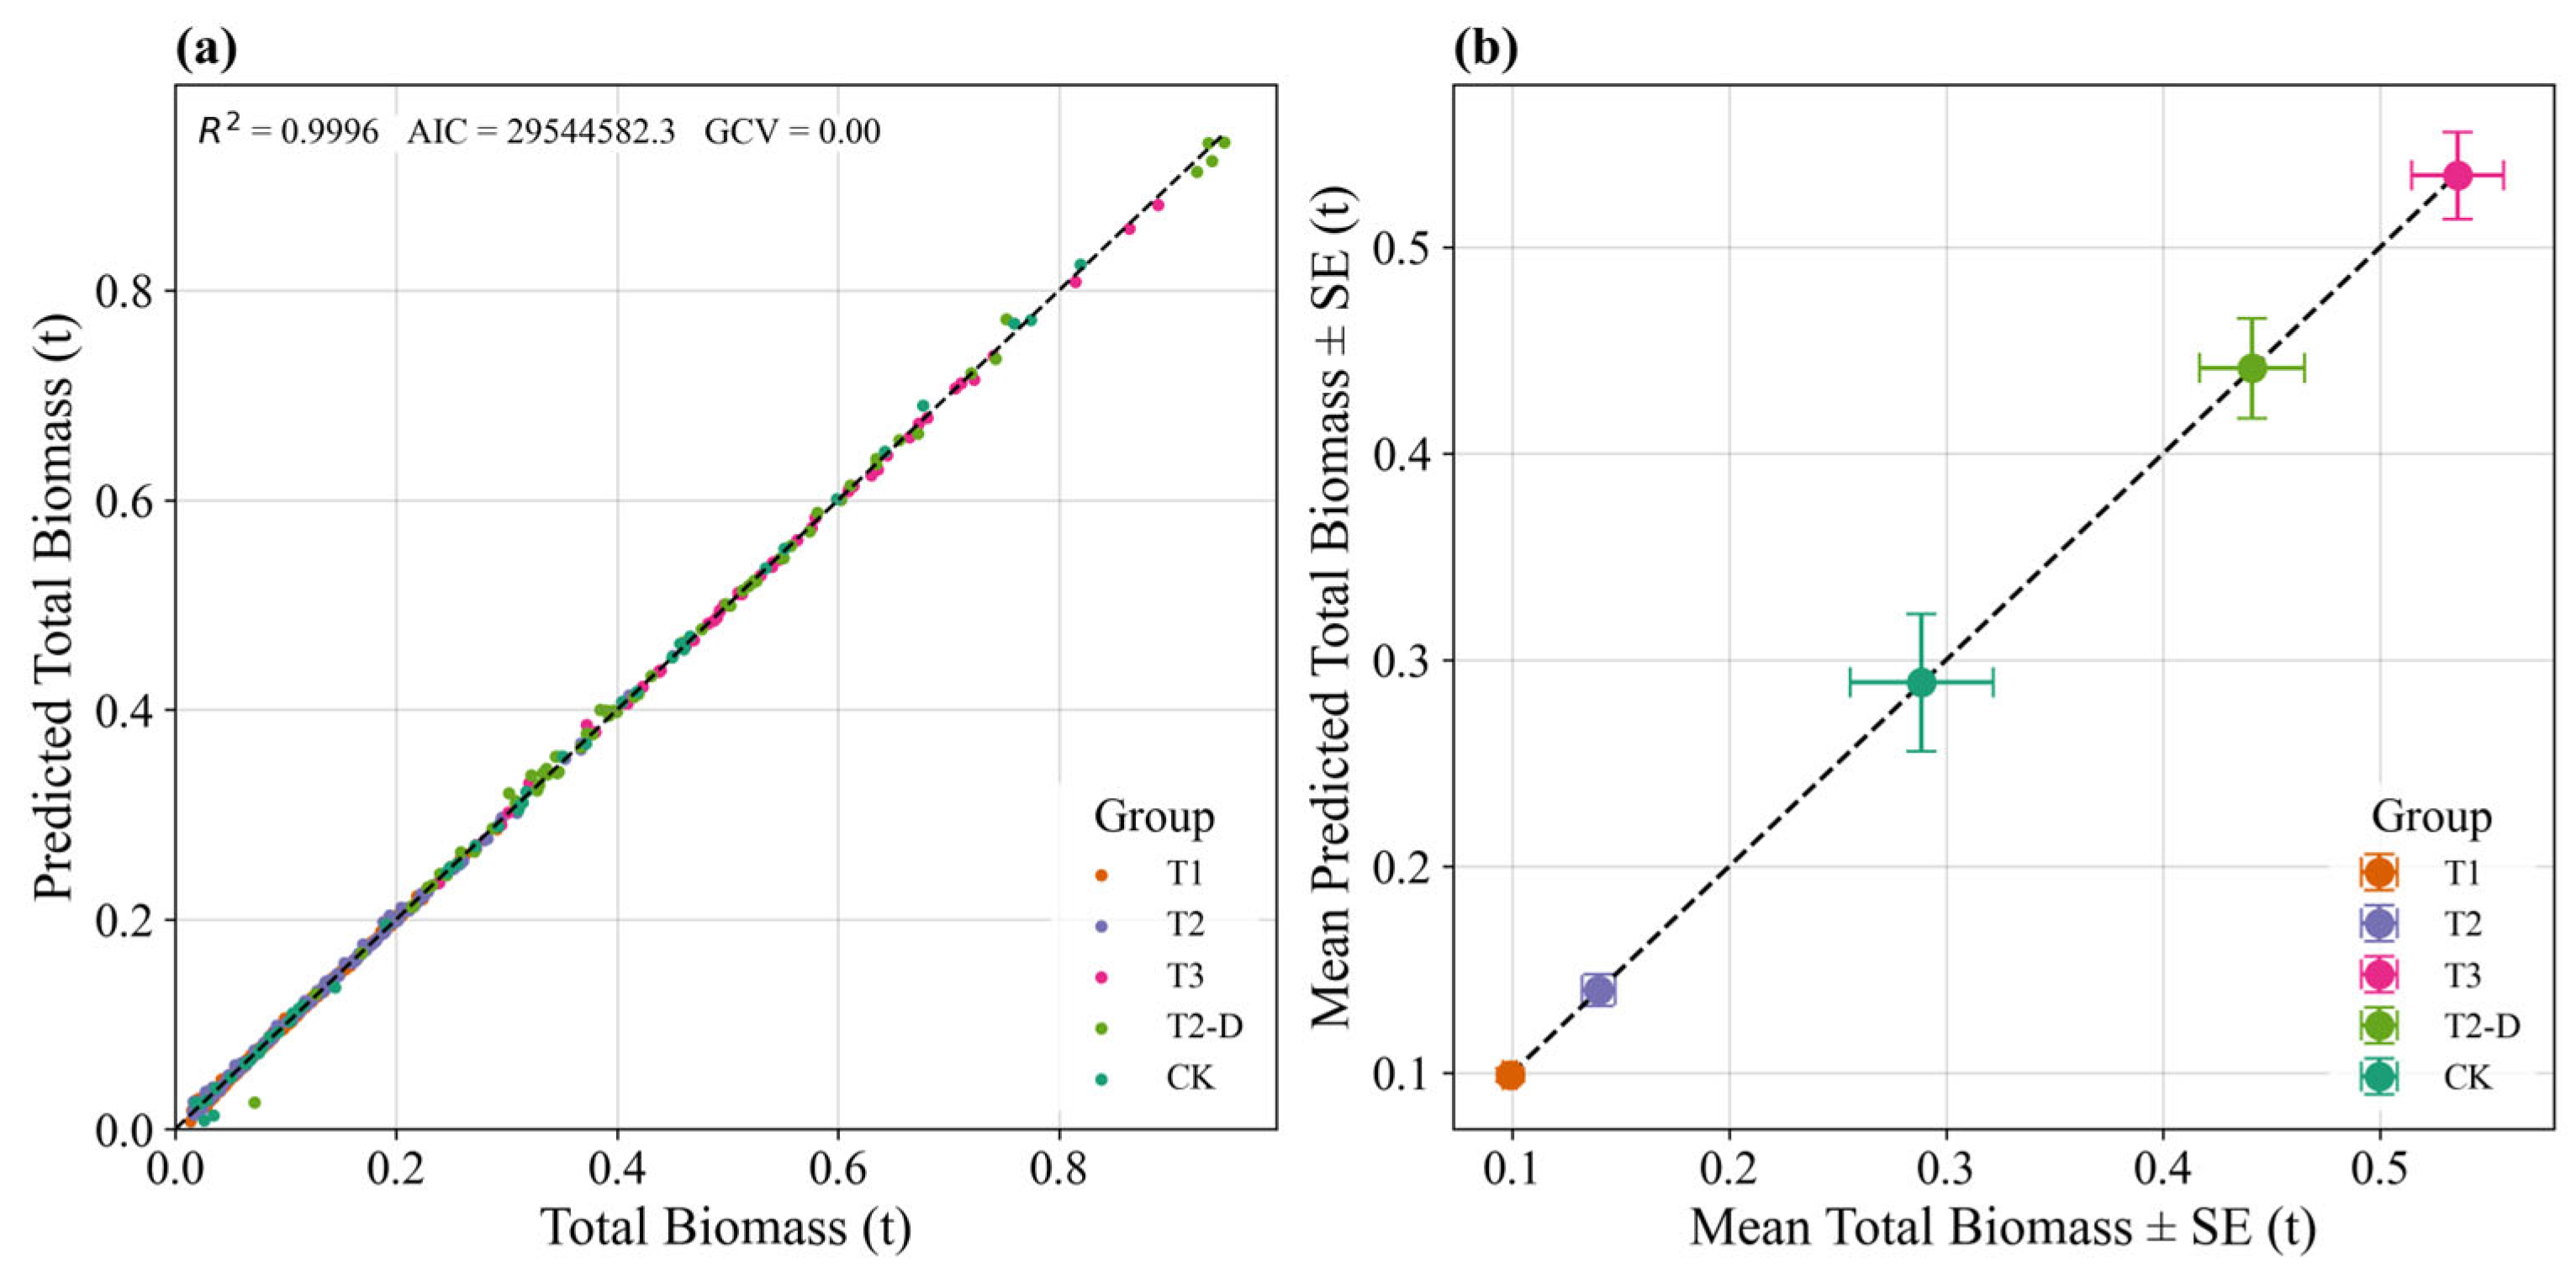
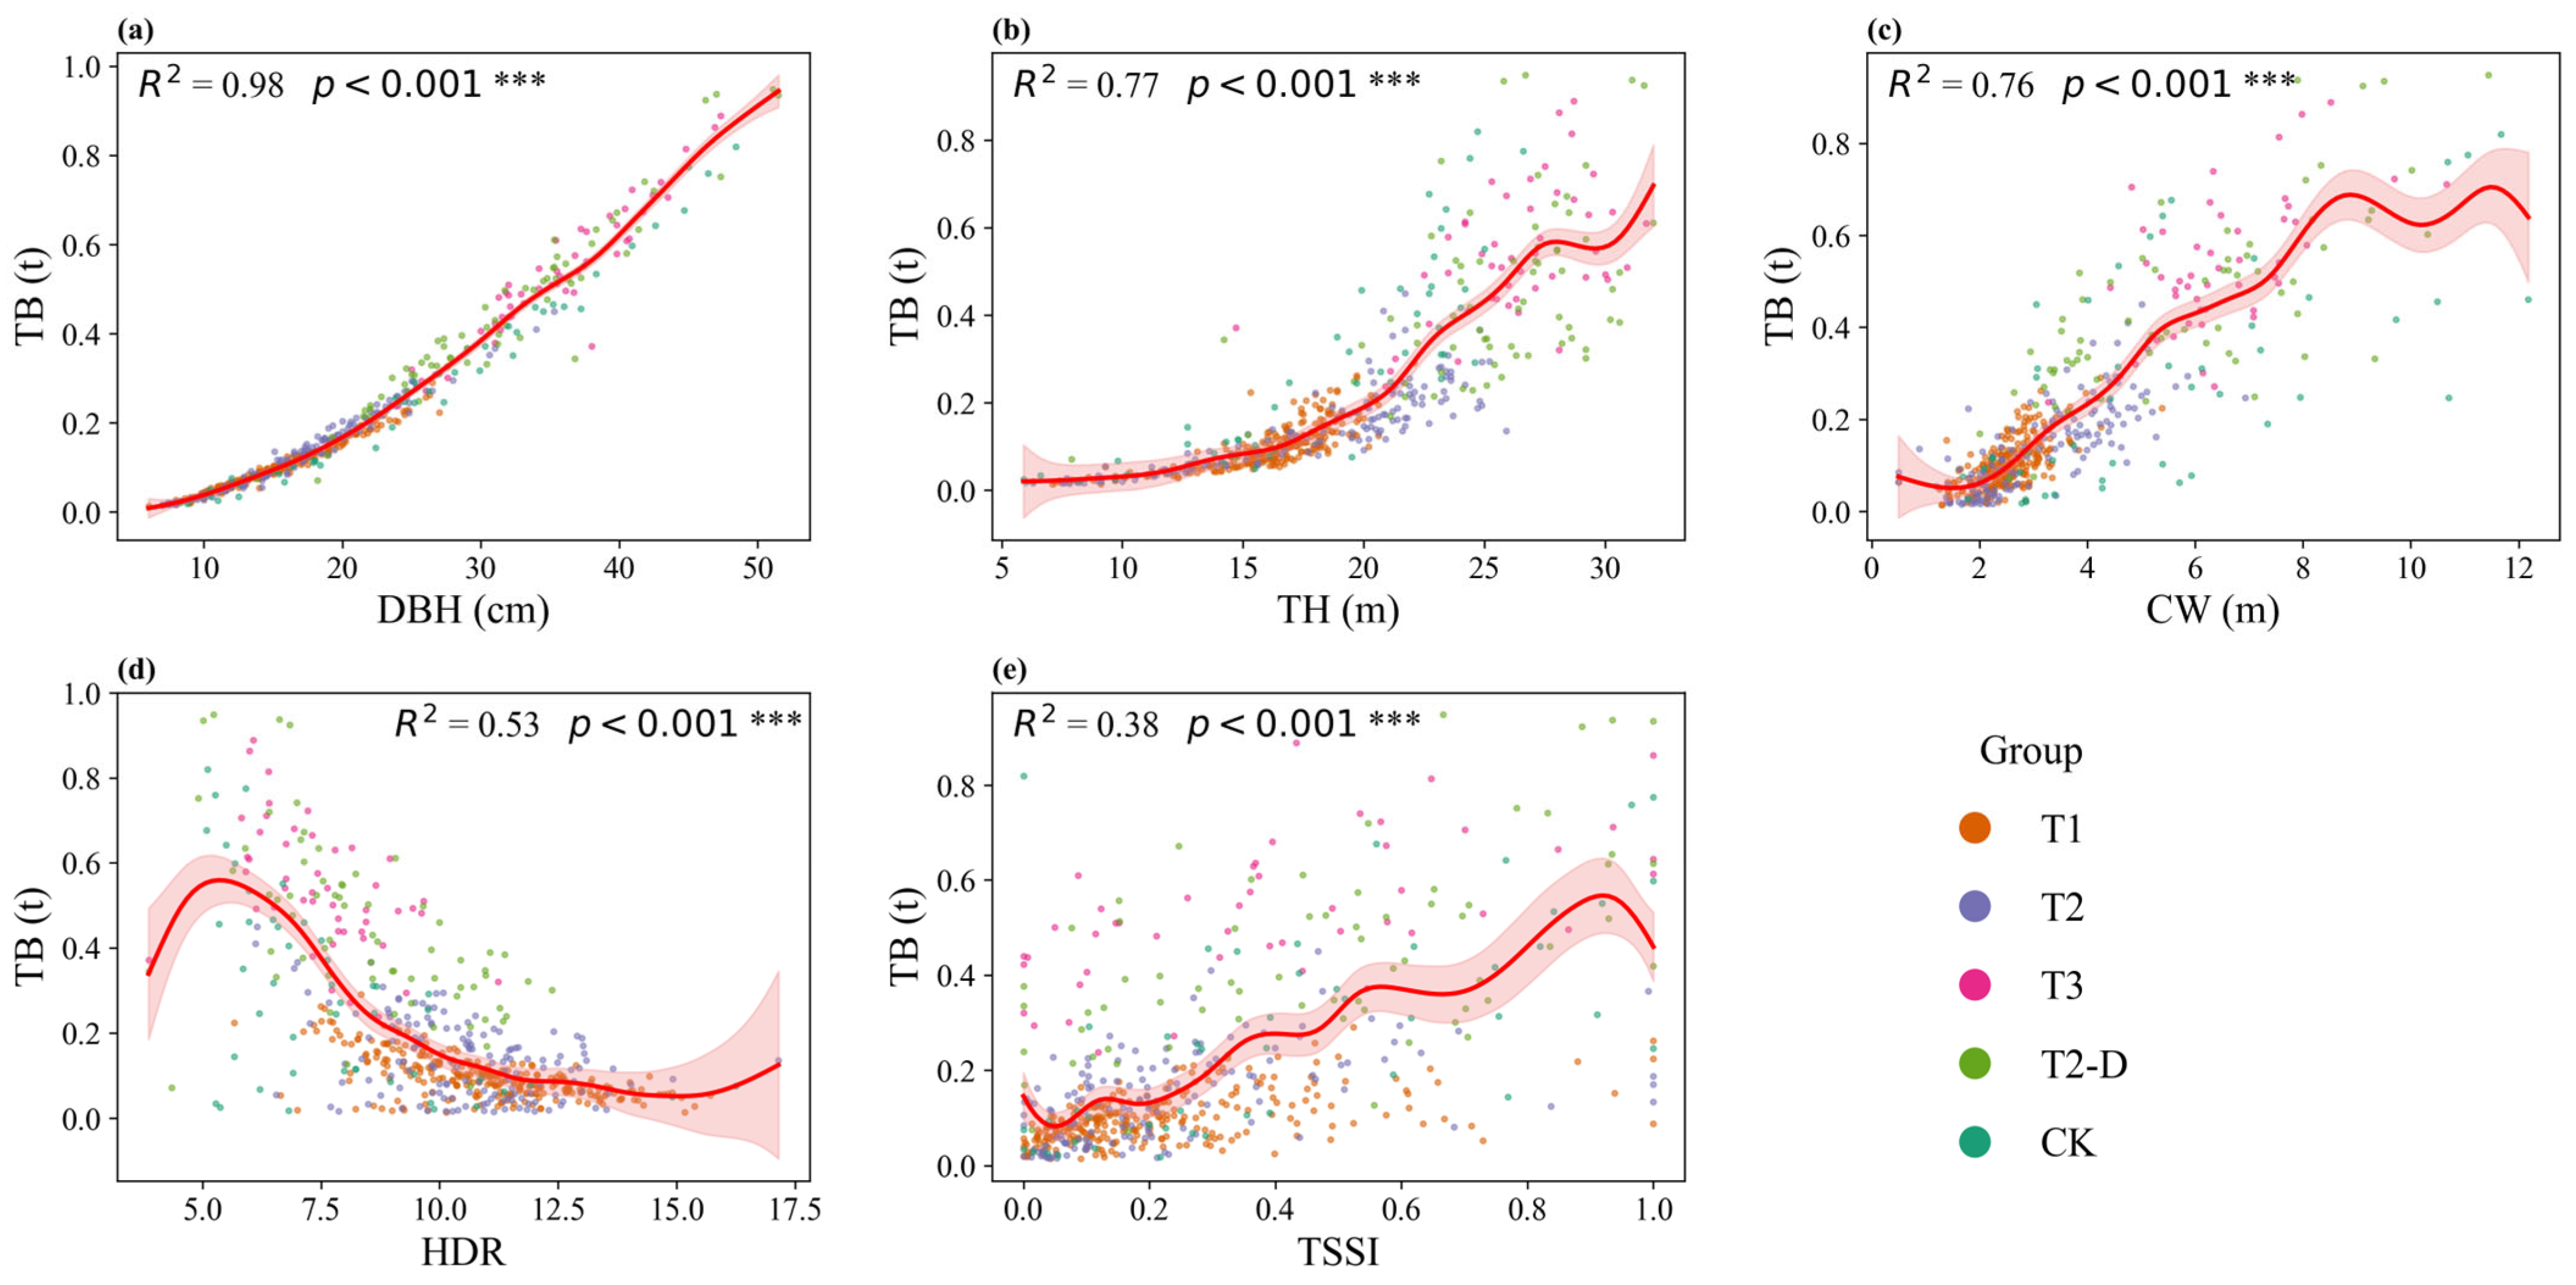
An LBP-GAM model was developed using 584 L. gmelinii trees following the procedure in Section 2.3.3. The model fit is shown in Figure 6, with smoothed effects of structural variables displayed in Figure 7.
Figure 6a shows that nearly all observed and predicted values fall along the 1:1 diagonal line, with a coefficient of determination (R2 = 0.9996), indicating excellent model performance in predicting individual tree biomass. Figure 6b further demonstrates that the measured and predicted means across different stand types are almost identical, with narrow standard error ranges, confirming the validity of TSSI and FSSI as well as the robustness and generalizability of the LBP-GAM under both age-gradient and thinning scenarios. As shown in Figure 7, five tree structural factors, including DBH, TH, CW, HDR, and TSSI, exhibited significant nonlinear relationships with TB, with all fitted models highly significant (p < 0.001). This indicates that GAM effectively captured the combined regulatory effects of multidimensional structural factors on TB, with R2 values ranging from 0.38 to 0.98. DBH showed the best fit with TB (R2 = 0.98), and its response curve displayed a typical J-shaped pattern. TB increased slowly when DBH was less than 25 cm, but rose sharply once DBH exceeded 25 cm. TH and CW were both positively correlated with TB, with R2 values of 0.77 and 0.76, respectively. HDR was negatively correlated with TB (R2 = 0.53), and its response curve showed a marked decline in TB when HDR was greater than 10. TSSI had a relatively lower fit with TB (R2 = 0.38), but its response curve rose steeply when TSSI exceeded 0.25.

3.5.2. Stand-Level Factors and Productivity

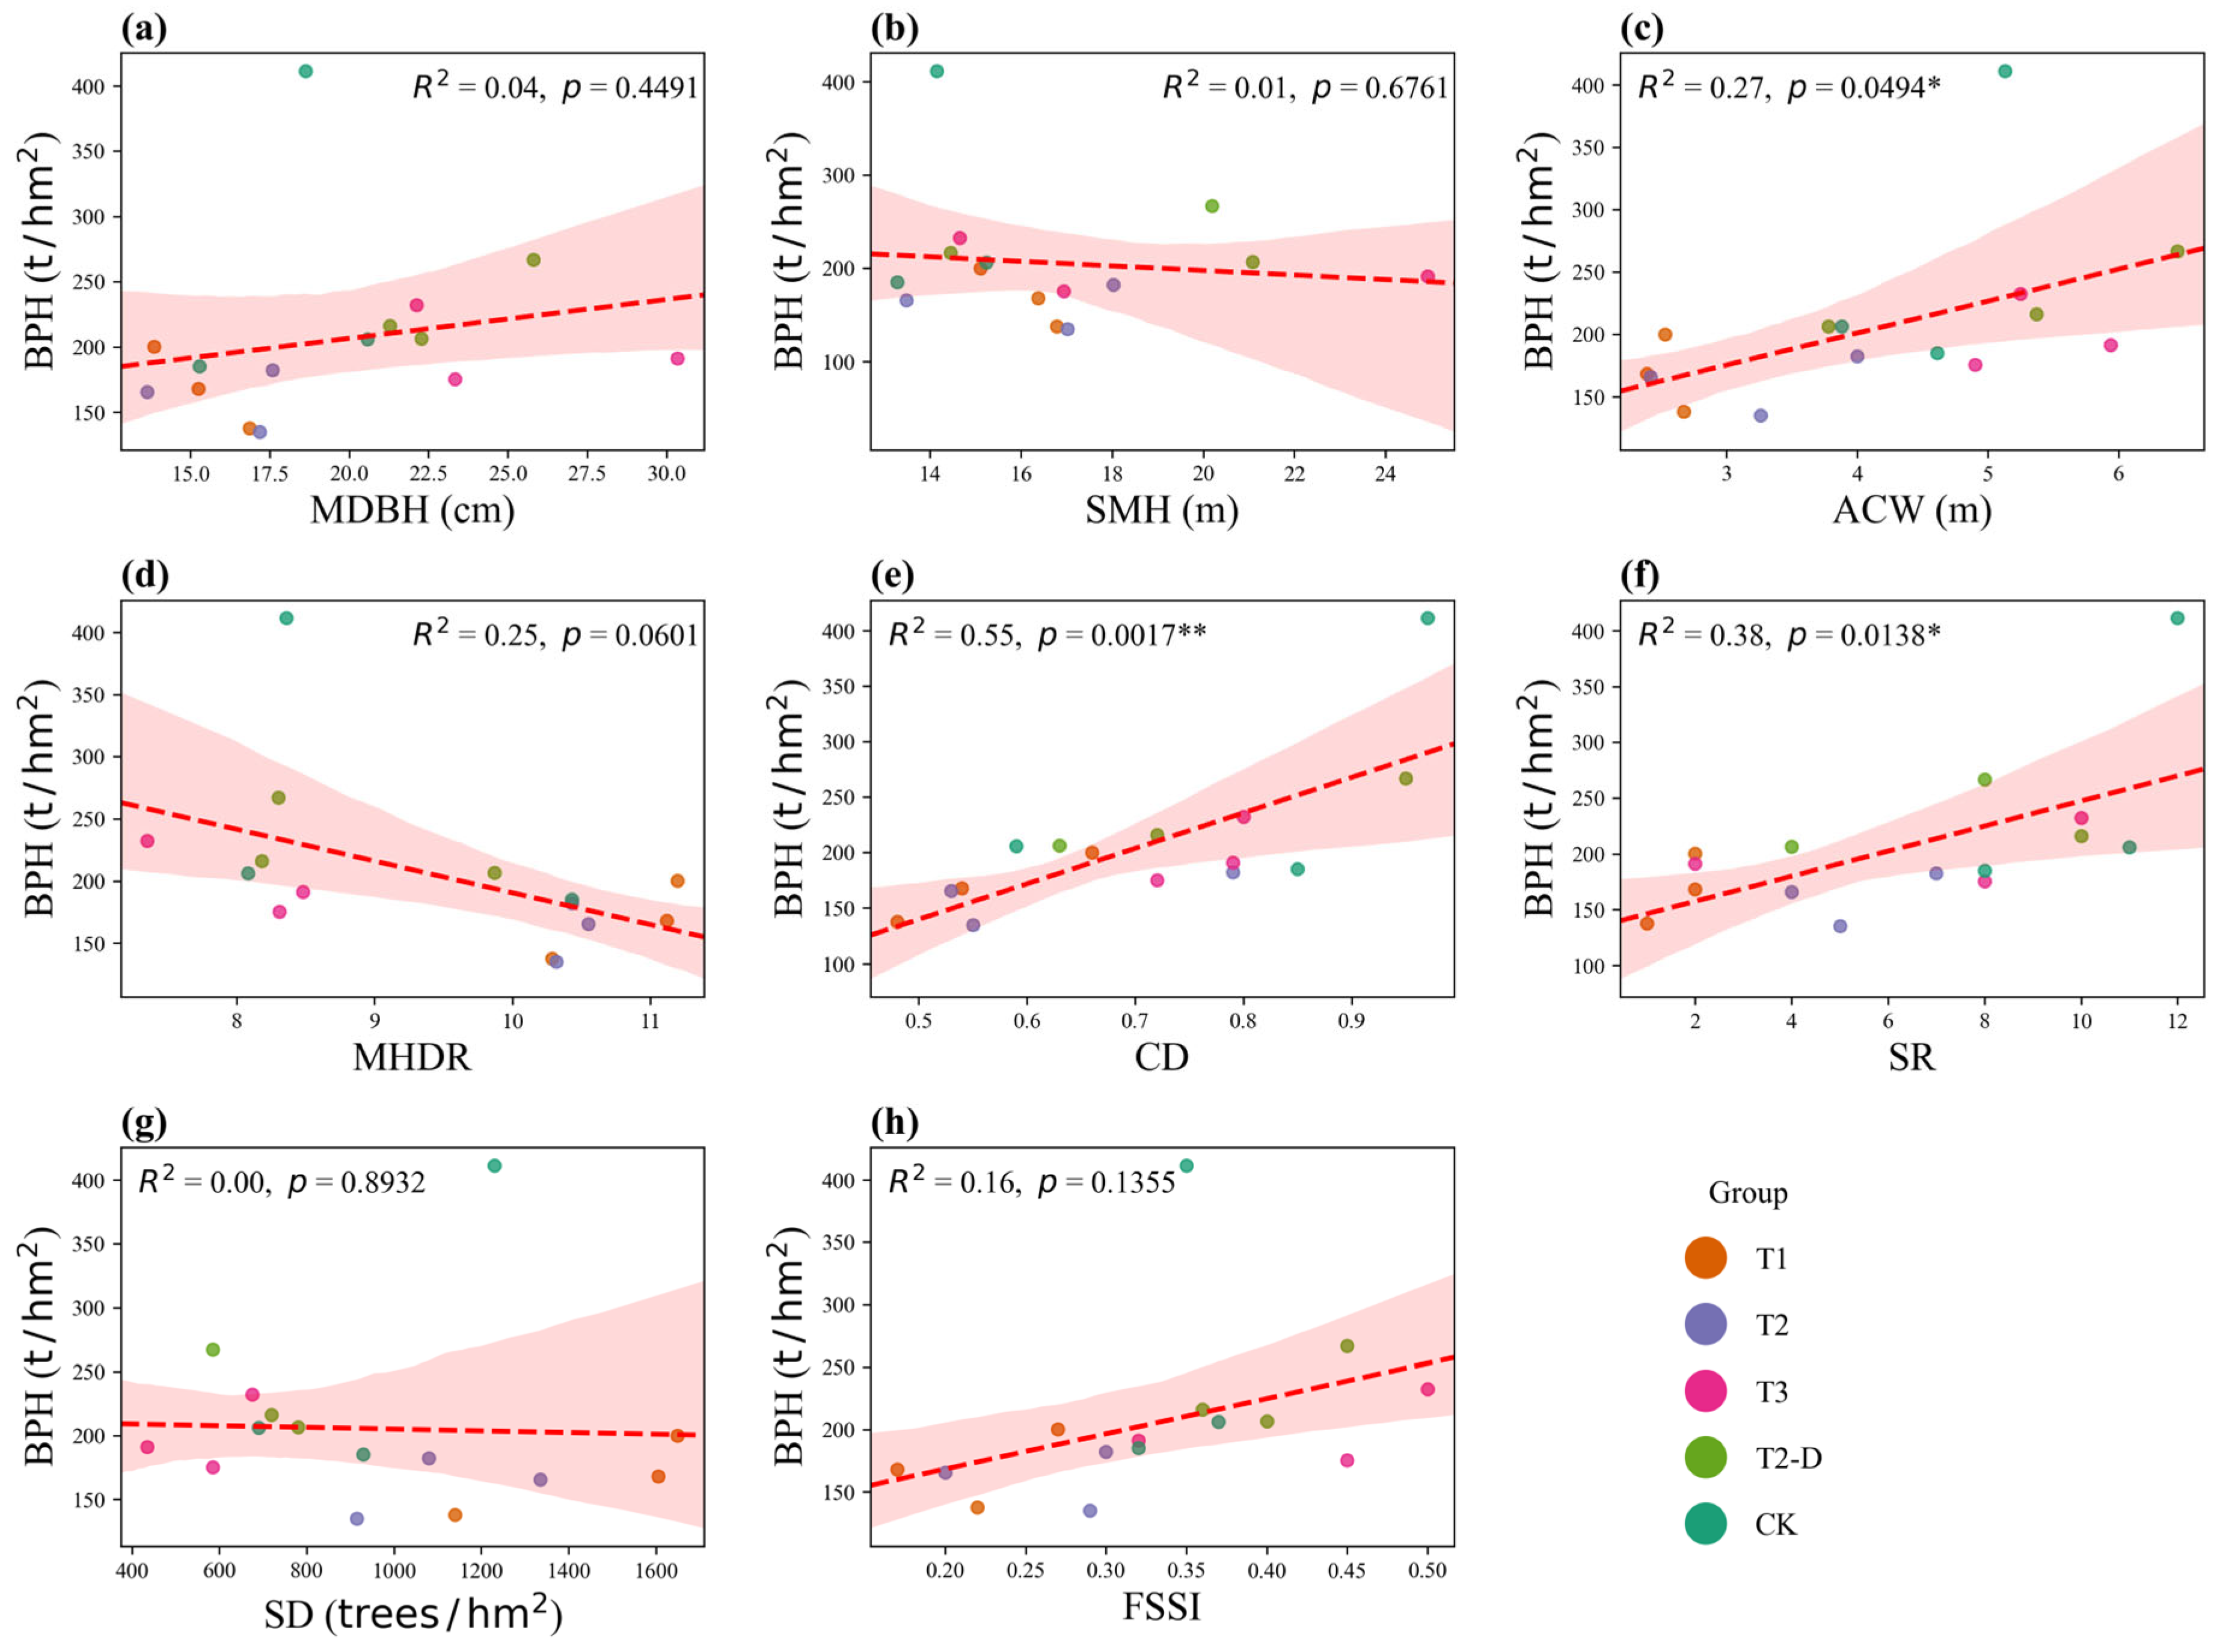
The linear relationships between eight structural indicators (MDBH, SMH, ACW, MHDR, CD, SR, SD, and FSSI) and BPH were fitted using OLS regression. R2 values and significance levels were calculated. As shown in Figure 8, different structural factors had varying effects on stand productivity (BPH). Overall, MDBH, ACW, CD, SR, and FSSI were positively correlated with BPH, whereas SMH, MHDR, and SD were negatively correlated. Among these, CD showed the strongest explanatory power with R2 = 0.55 (p < 0.01). SR and ACW were also significantly and positively correlated with BPH (p < 0.01), with R2 values of 0.38 and 0.27, respectively. MHDR was negatively correlated with BPH, with R2 = 0.25 (p = 0.0601), which was close to significance. The remaining indicators, including MDBH, SMH, SD, and FSSI, had poor fits with BPH, with R2 values below 0.2 and no significant effects. Overall, BPH was mainly driven positively by CD, SR, and ACW, while MHDR exerted a notable negative regulatory effect, and other factors showed limited explanatory power.

3.6. Dominant Effects of Stand-Level Factors on Stability and Productivity

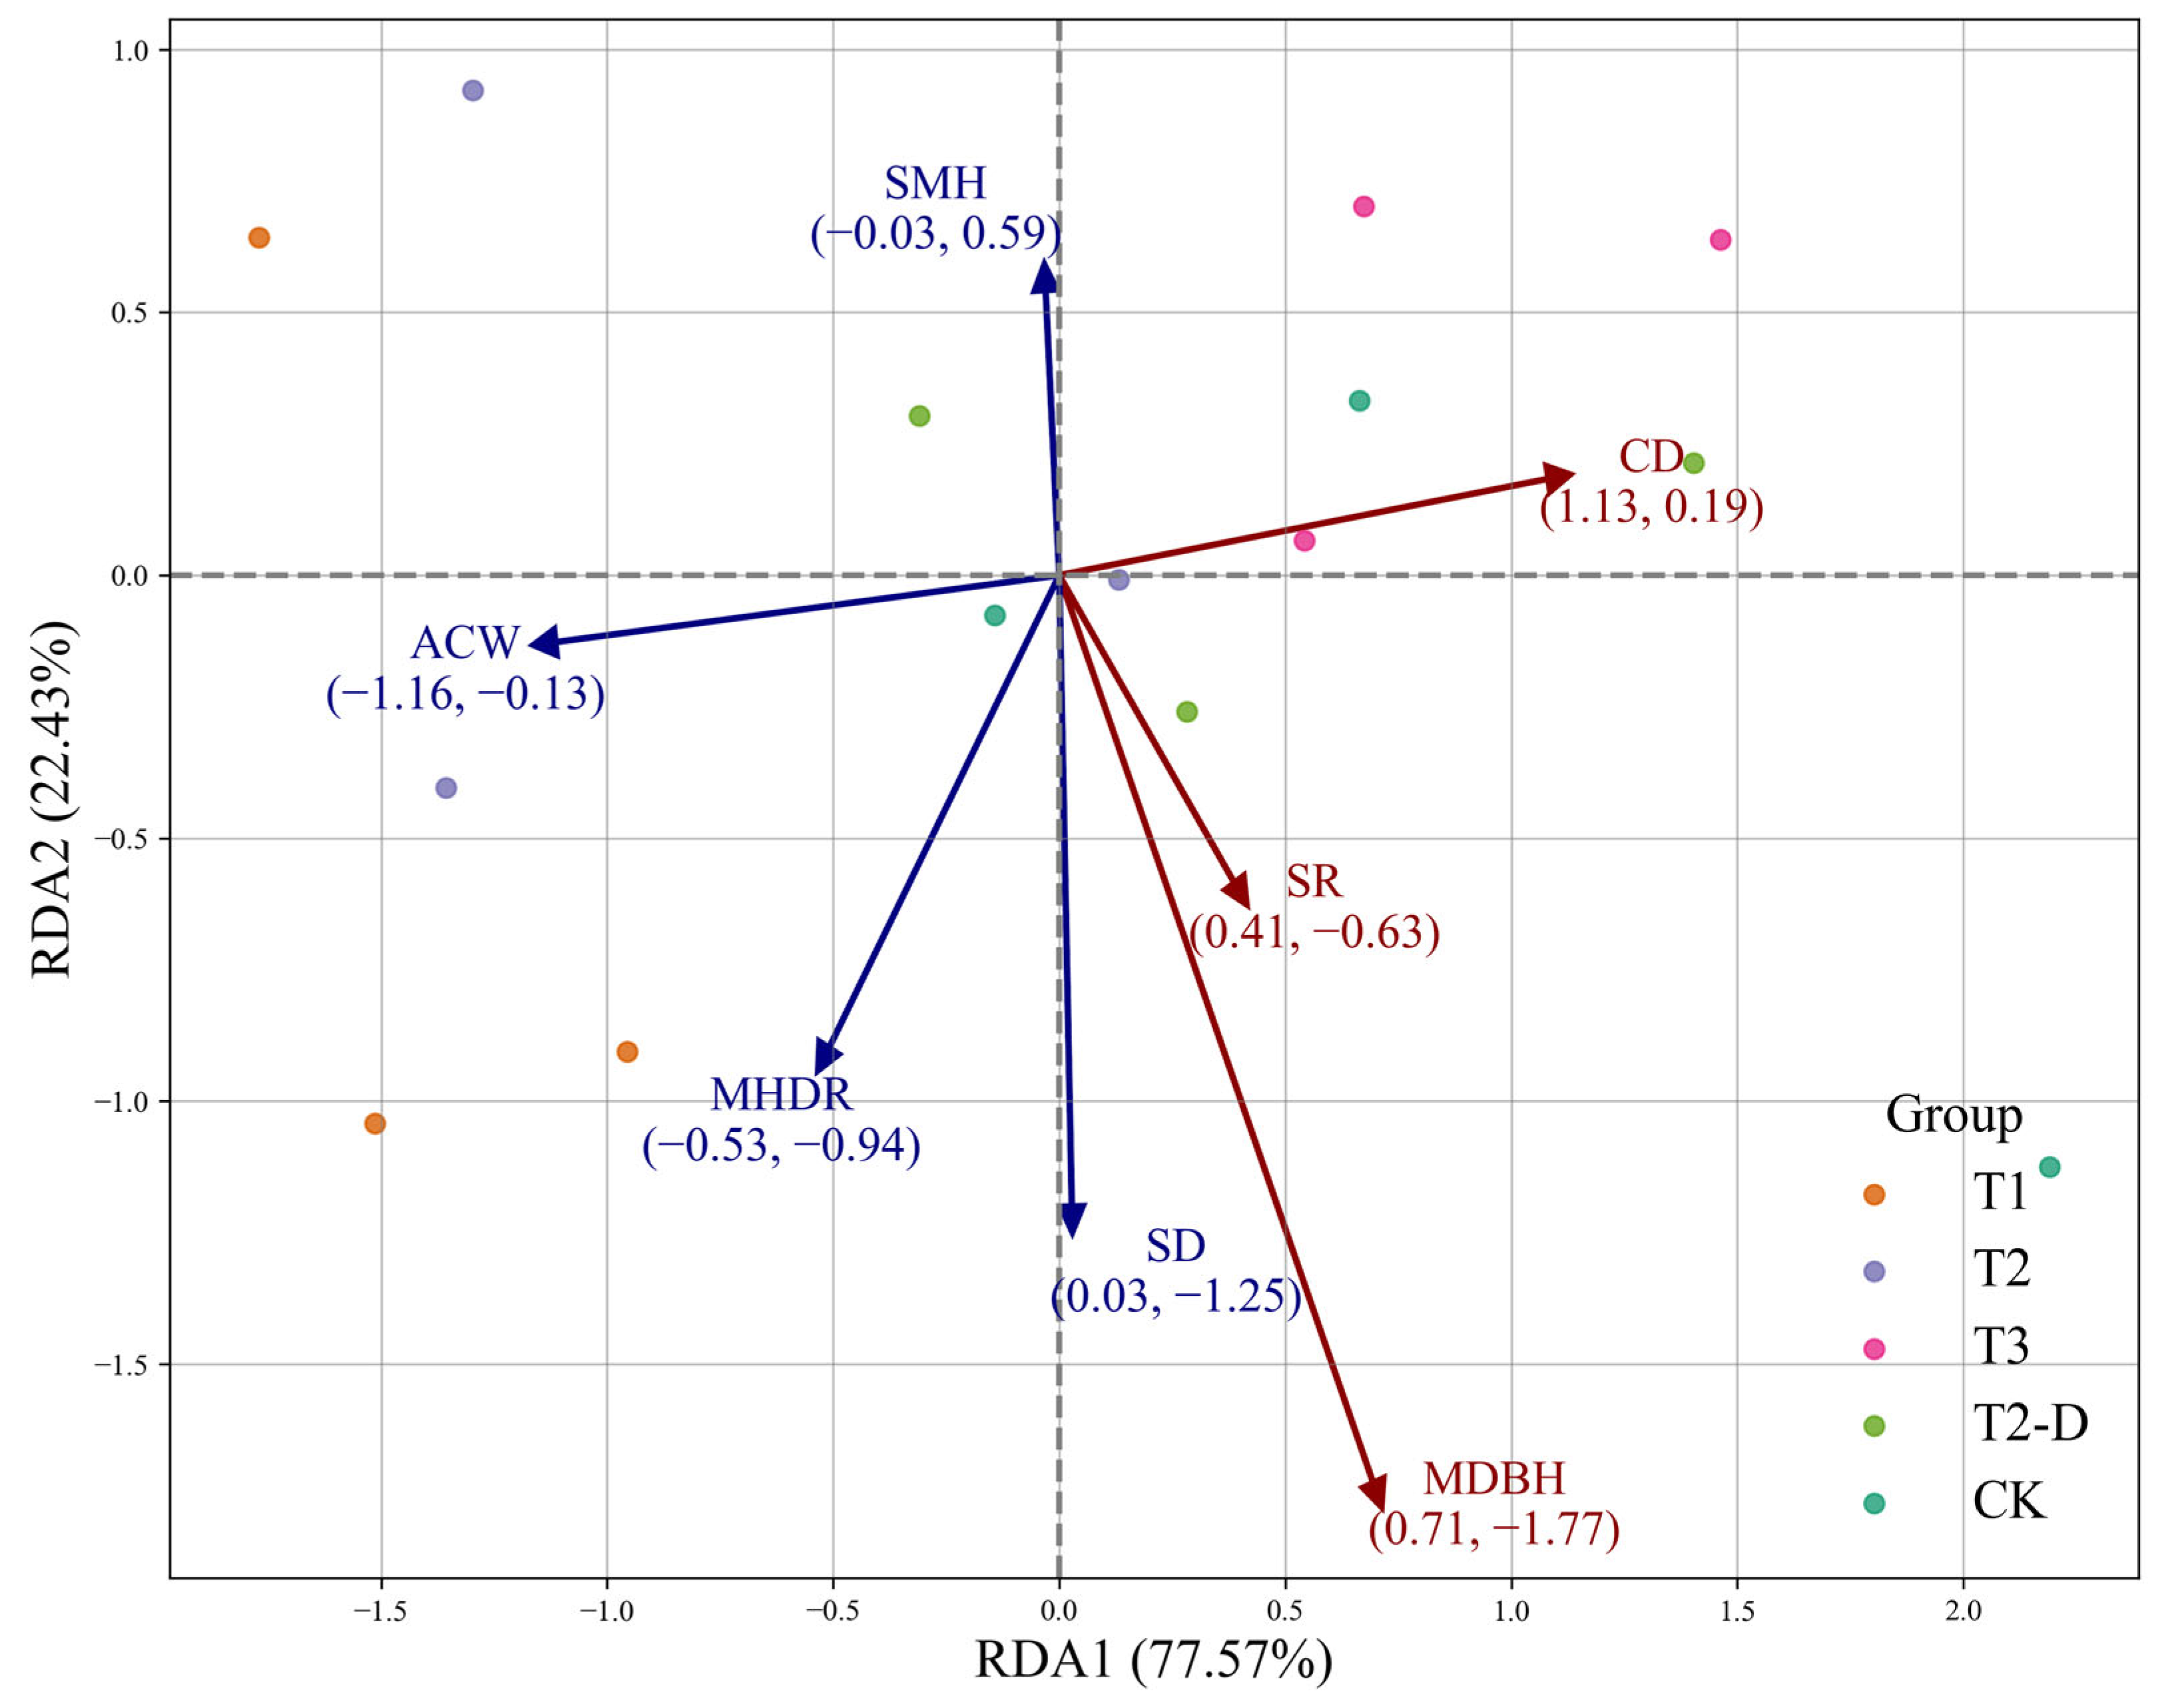
Using MDBH, SMH, ACW, MHDR, CD, SR, and SD as explanatory variables and FSSI and BPH as response variables, a dual-response RDA model was constructed to explore the dominant effects and coupling pathways of structural attributes on functional outcomes. All data were standardized using Z-scores to eliminate dimensional differences and ensure the comparability and robustness of the ordination results. The analysis results are presented in Figure 9.
As shown in Figure 9, RDA1 and RDA2 explained 77.57% and 22.43% of the total variation, respectively, indicating strong overall explanatory power. The vector directions and lengths of the structural factors differed markedly, reflecting their varying influences on stand functions. CD (1.13, 0.19), SR (0.41, −0.63), and MDBH (0.71, −1.77) were closely aligned with RDA1 and exhibited the strongest explanatory power, emerging as the key positive drivers of FSSI and BPH. ACW and SMH had shorter vectors and contributed relatively little. In contrast, MHDR (−0.53, −0.94) and SD (0.03, −1.25) pointed opposite to the functional indicators, indicating negative effects, with MHDR exerting the stronger constraint. In terms of plot distribution, T2-D, T3, and CK clustered in the positive right-hand quadrants, aligned with CD and SR, and showed higher structural quality and functional levels. T1 plots were concentrated in the lower-left quadrants, far from the positive region, with weaker functional performance. Notably, T2-D was positioned close to the advantageous zone, highlighting the prominent role of thinning intervention in optimizing stand structure and function.

4. Discussion

4.1. Structural and Functional Dynamics of L. gmelinii Plantations Under Different Scenarios

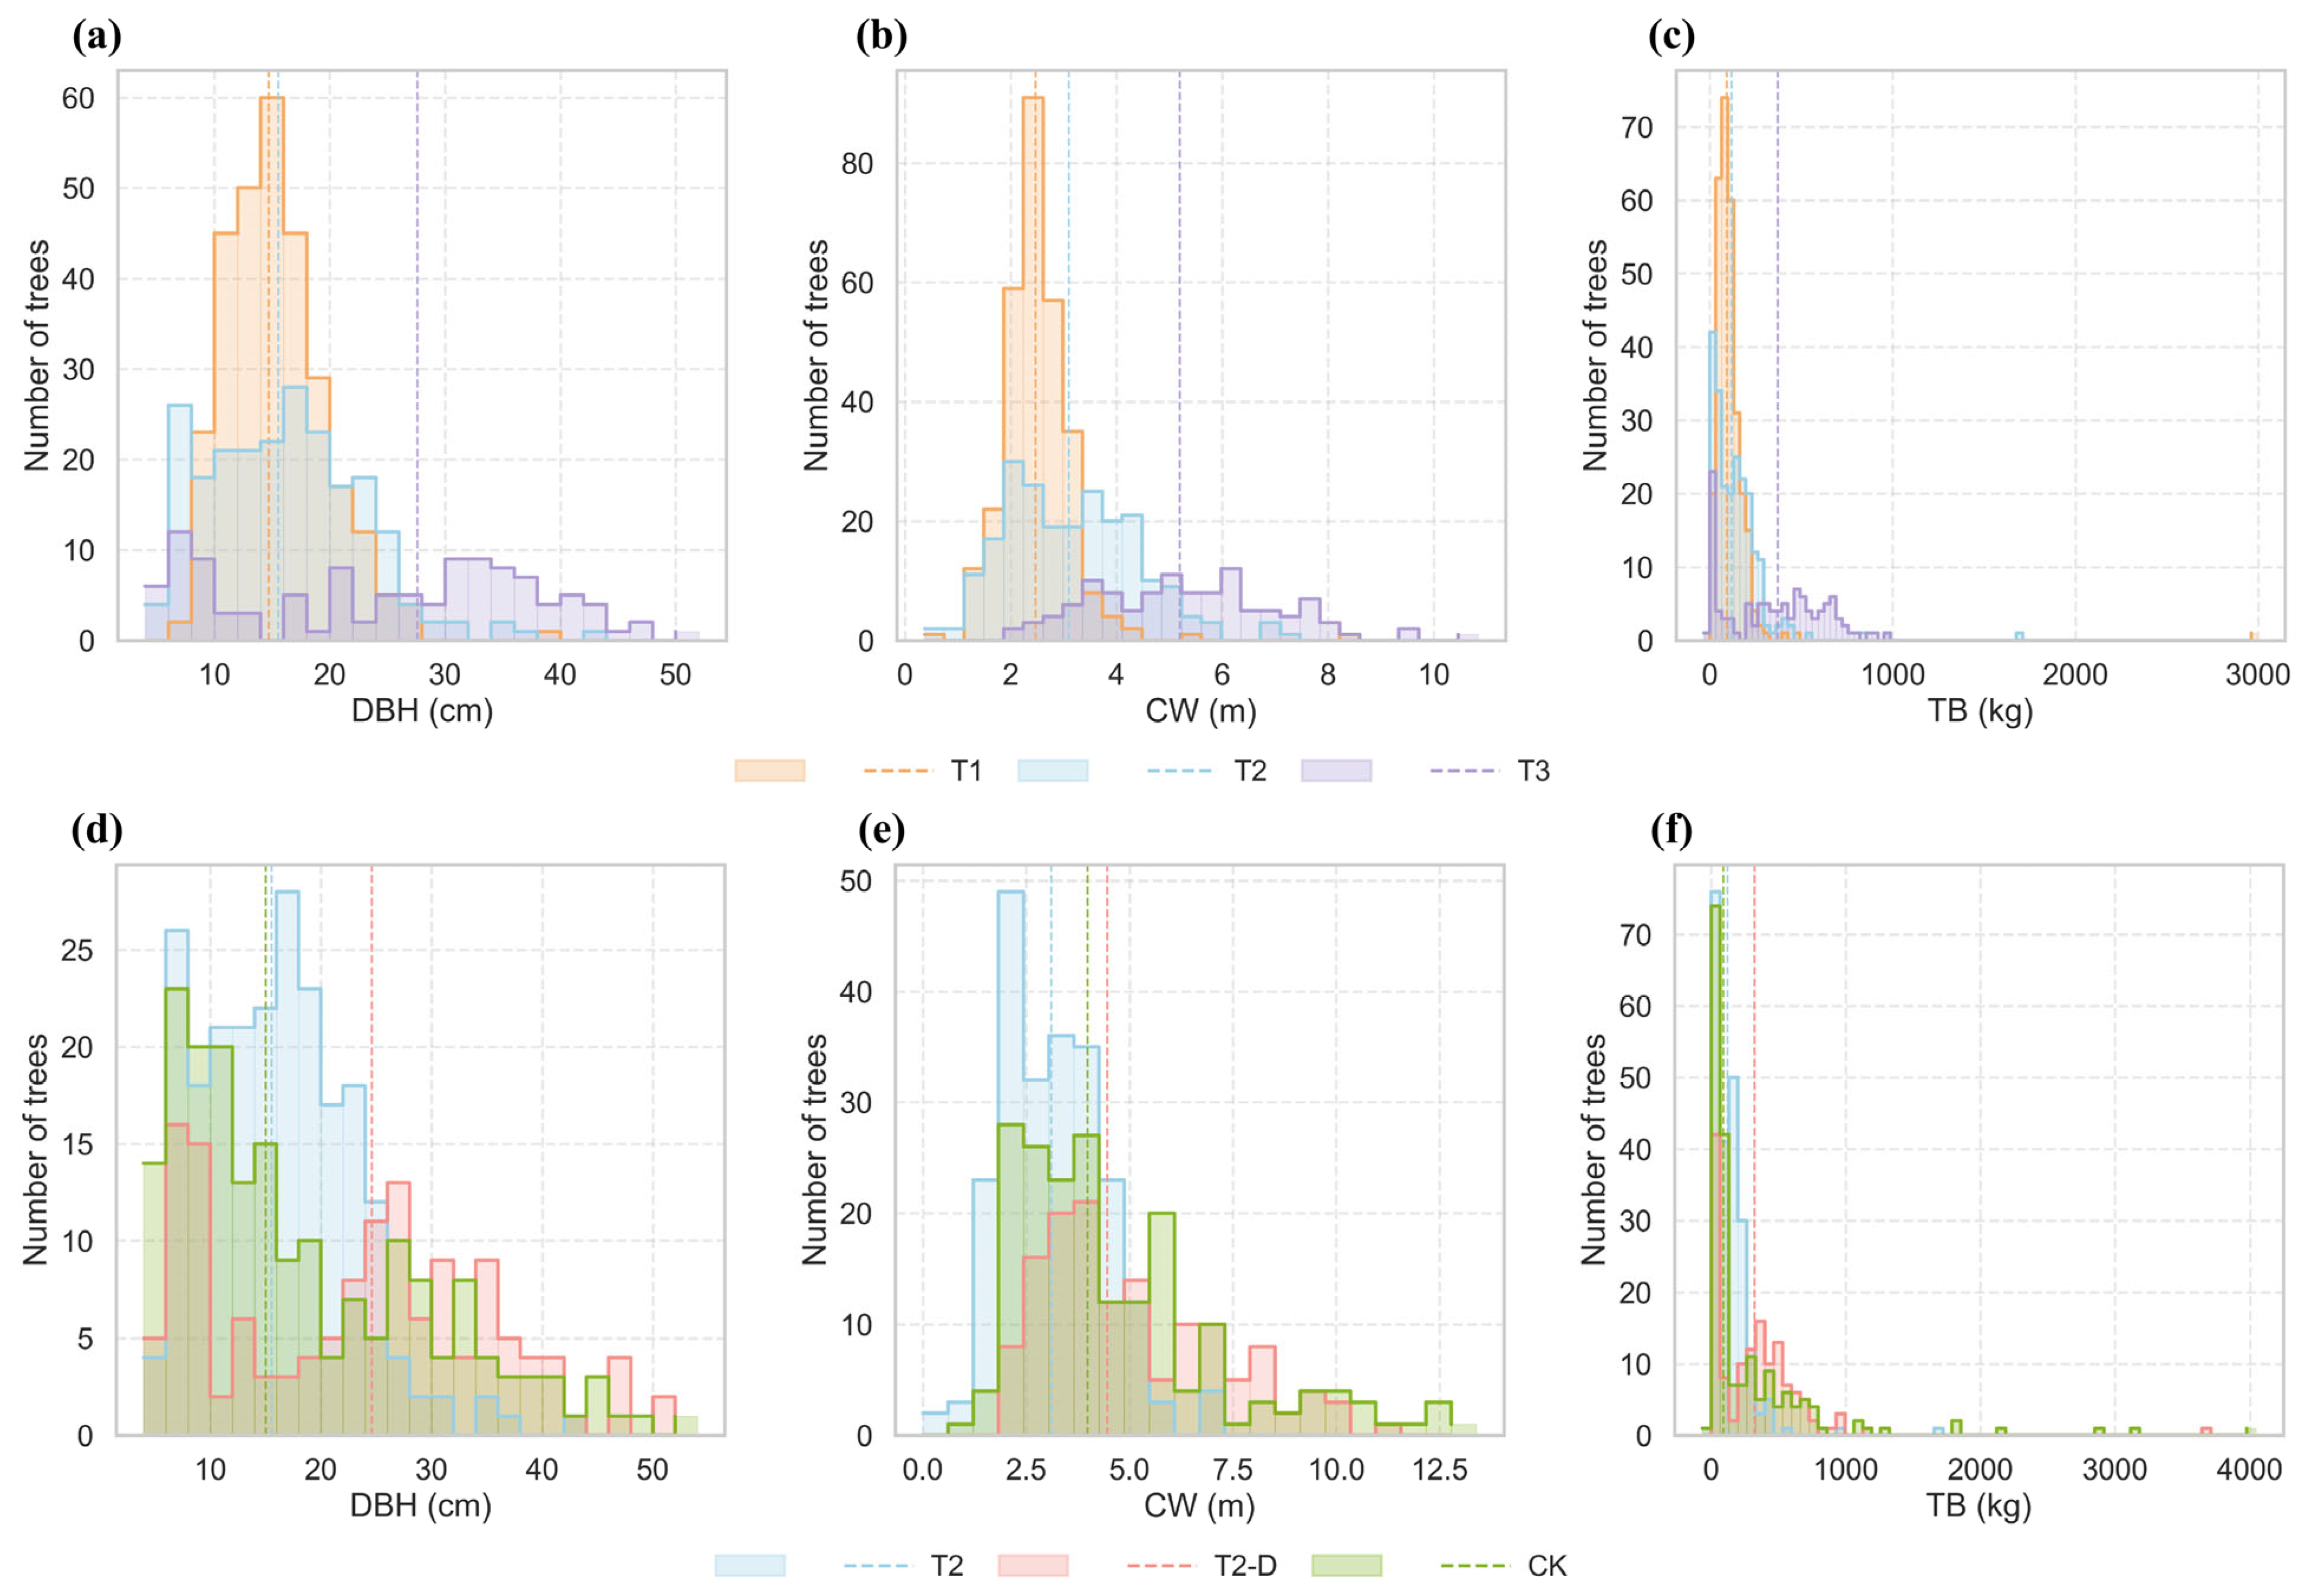
Understanding the dynamics of stand structure and stability along age gradients and under management interventions is essential for improving the quality and productivity of L. gmelinii plantations. Forest ecology theory suggests that as stands age, ecosystems accumulate biomass, develop more complex and stable structures, and enhance functional integrity [59]. Thinning, as a key silvicultural practice, can reduce canopy closure, increase heterogeneity, and improve growth conditions, thereby enhancing plantation quality and ecosystem functions [60]. In this study, we established two plot sequences: a stand-age gradient (T1–T3) and a thinning intervention (T2-D) compared with both T2 and a natural secondary forest (CK). Results indicated that structural optimization and functional enhancement generally progressed with stand age, although a structural improvement–functional lag occurred at T2. Moderate thinning effectively improved structure, stability, and productivity, enabling plantations to approach or even surpass the performance of natural stands. The following section examines the mechanisms behind these patterns and compares DBH, CW, and TB distributions across scenarios (Figure 10).

4.1.1. Responses of Structure and Productivity to Increasing Stand Age

In this study, along the T1–T3 stand-age gradient, both tree- and stand-level structural and functional indicators generally increased, and inter- and intra-group differences widened with age. Figure 10a–c show that the distributions of DBH, CW, and TB shifted to the right and became wider, with increasing proportions of large-diameter trees, large-crown individuals, and high-biomass trees. T1 was concentrated in a narrow low-value range, while T2 represented a transitional state, consistent with the classic successional pattern in which the “inverse J-shape” gradually shifts toward a near-normal distribution as stand structure stabilizes [61,62]. Table 2 shows that MD increased from 0.09 to 0.58, OD from 0.15 to 0.27, C from 0.63 to 0.85, and CI from 2.19 to 2.77, indicating enhanced species mingling and spatial heterogeneity, as well as intensified canopy closure and competition, which promote stable regeneration and growth patterns [63]. As illustrated in Figure 5, the medians and distribution widths of MDBH, SMH, and ACW in T3 were significantly higher than those in T1 and T2, while the negative indicators MHDR and SD exhibited continuous declines. The reduction in MHDR indicates more balanced tree morphology, and the decrease in SD reflects the cumulative effects of self-thinning density regulation [14]. The violin plots in Figure 5 further reveal that T3 displayed a “high-value–wide-range” distribution, corresponding to the simultaneous enhancement of productivity, structural complexity, and functional heterogeneity at the near-mature stage [64]. In contrast, T1 was characterized by a “low-value–narrow-range” distribution, with high structural homogeneity and restricted growth, while T2 was intermediate, reflecting a gradual successional transition. Consistently, FSSI increased from 0.22 to 0.42, suggesting continuously enhanced structural stability. However, BPH first declined from 168.68 t·hm−2 in T1 to 161.03 t·hm−2 in T2, before rising to 199.65 t·hm−2 in T3. These results indicate that structural optimization and functional enhancement generally progressed in parallel with increasing stand age, but a phenomenon of “structural improvement with relatively lagging function” remained evident at the middle-aged stage (T2).
These patterns are consistent with previous studies showing that natural forests, owing to their more complex structures and species compositions in later successional stages, generally accumulate higher biomass and exhibit greater stability [65,66]. Plantations, although characterized by rapid early growth (with sapling growth rates approximately 1.6–2.1 times those of natural forests), have shorter peak periods, with about 74% of plantations experiencing a slowdown after a brief maximum, thereby limiting their long-term carbon sequestration and stability [67]. For example, a comparison of young European beech stands showed that at age 15, aboveground biomass in plantations reached about 48 Mg·hm−2, nearly equivalent to that of naturally regenerated stands of the same age. However, natural forests displayed higher initial productivity in early stages, and the net primary productivity of the two only converged at age 16 [68]. In summary, L. gmelinii plantations exhibited a dominant trend of “structural–functional co-enhancement” with increasing stand age. Nevertheless, in the middle-aged stage (T2), functional indicators lagged behind structural improvements, highlighting the need for targeted density and structural regulation during the young and middle-aged periods to avoid mismatches between structural development and functional responses and to accelerate the transition from structural optimization to quality improvement.

4.1.2. Effects of Thinning Intervention on Structure and Productivity

In this study, moderate thinning substantially increased individual size and biomass distributions, improved stand structural configuration, and enhanced stability and productivity, bringing plantation performance close to, and in some cases comparable with, that of natural forests. At the tree scale, Figure 10d–f show that the distributions and medians of DBH, CW, and TB in T2-D shifted to the right and became wider, with the right tail of TB extending markedly. This indicates a significant increase in the proportion of large-diameter, large-crown, and high-biomass individuals [27]. In contrast, trees in the unthinned T2 remained concentrated in a narrow low-value range, reflecting limited structural development and high homogeneity. As shown in Figure 2, the proportion of L. gmelinii individuals with low stability (levels I and II) decreased from 86.45% in T1 to 42.65% in T2-D, demonstrating that thinning effectively reduced structurally disadvantaged individuals and increased the dominance of superior trees, thereby jointly improving structural stability and productivity [56]. These findings are consistent with cross-species and cross-regional evidence reported in previous studies [69,70,71].
At the stand scale, after two thinning treatments of 20% intensity, T2-D outperformed T2 significantly in most indicators (p < 0.05) and was comparable to or even reached the level of natural secondary forest CK (Table 3 and Table 6). Compared with T2, positive indicators in T2-D increased, with MD, OD, C, CI, MDBH, SMH, ACW, CD, SR, FSSI, and BPH increasing by 0.23, 0.05, 0.18, 0.02, 6.99 cm, 2.4 m, 1.97 m, 0.14, 2.0, 0.14, and 68.84 t·hm−2, respectively, while negative indicators decreased, with MHDR and SD decreasing by 1.65 and 415 trees·hm−2, respectively. Figure 5a–c,h illustrate a “high-value–wide-range” distribution for T2-D, while CK (Figure 5e,f,i) maintained a higher upper limit and wider range, highlighting its inherent advantages in diversity and productivity. Taken together, Figure 5a–f, h indicate that T2-D has already approached, and in some respects surpassed, CK in several indicators. This quality transition of stands is consistent with recent findings that thinning in L. gmelinii plantations promotes biomass accumulation and carbon storage [60,72,73]. Furthermore, these results align with the theory of “close-to-nature” forest management, whereby selective thinning of target trees guides monoculture plantations toward multi-layered, uneven-aged, mixed structures resembling natural forests, thereby gradually enhancing heterogeneity, productivity, and ecological functions [74,75].
The experimental evidence from this study demonstrates that thinning reduces stand density and spatial competition, releases vertical and horizontal growing space for dominant trees, and promotes biodiversity, thereby jointly driving increases in FSSI and BPH. Combined with improved canopy openness and enhanced understory light conditions, thinning generates a cascading effect of “structural optimization, growth acceleration, and functional enhancement”. This conclusion has been confirmed by many other studies, which have shown that thinning significantly increases canopy openness and understory light availability, promotes understory regeneration and community diversity recovery, and consequently enhances stand structural stability and ecosystem functioning [25,72,73].

4.2. Pathways and Mechanisms of Structural Factors in Enhancing Productivity

The results of this study indicate that multidimensional structural factors at both tree and stand scales exert significant regulatory effects on productivity, with distinct pathways operating at different levels. At the individual scale, Figure 3 shows significant correlations between DBH, TH, CW, HDR, TSSI, and TB (p < 0.001). Similarly, Figure 7 demonstrates significant nonlinear relationships between these five factors and TB (p < 0.001, 0.38 ≤ R2 ≤ 0.98), confirming that multidimensional structural factors jointly regulate tree growth potential. Among them, DBH provided the best fit with TB (R2 = 0.98), and its response curve exhibited a typical J-shaped pattern. When DBH was less than 25 cm, TB increased slowly, suggesting that individual growth potential was not yet fully released. Once DBH exceeded 25 cm, TB rose sharply, entering a phase of accelerated biomass accumulation, indicating that 25 cm may represent a critical threshold for structural regulation and productivity release. TH and CW ranked second, with R2 values of 0.77 and 0.76, respectively, and both showed continuous positive correlations with TB, reflecting the direct promoting effects of tree height growth and crown expansion on productivity [76]. HDR was negatively correlated with TB (R2 = 0.53), and TB declined sharply once HDR exceeded 10, implying that excessively slender stems weakened individual stability and resource accumulation, and should be avoided in structural management [77]. TSSI showed a relatively lower fit (R2 = 0.38), but its response curve rose steeply once TSSI exceeded 0.25, indicating that improvements in structural stability significantly enhanced its marginal contribution to productivity [78]. Consistent with the distributions in Figure 5, T1 and T2 individuals clustered in regions with HDR > 10, TSSI < 0.25, and relatively low DBH and CW, indicating underused TB growth potential. By contrast, T2-D, T3, and CK individuals clustered where HDR < 10 and TSSI > 0.25, reflecting more favorable structure and higher TB. At the stand scale, MDBH, ACW, CD, and SR were significantly and positively correlated with FSSI and BPH (p < 0.05), whereas MHDR and SD were the principal negative factors (Figure 3b). OLS and RDA consistently identified CD, SR, and MDBH as the main drivers of stand functions, with MHDR and SD constraining stability and productivity. In particular, Figure 8 CD showed the strongest relationship with BPH (R2 = 0.55, p < 0.01) [45], while SR and ACW were also positive and significant (R2 = 0.38 and 0.27, p < 0.01), indicating the benefits of diversity and crown expansion [77]. MHDR was negatively related to BPH and was nearly significant, whereas MDBH, SMH, SD, and FSSI each had R2 < 0.2 and were not significant. Spatial patterns in Figure 9 corroborate these results: T2-D, T3, and CK cluster on the right, aligned with CD and SR, indicating higher structural quality and function; T1 lies mainly in the lower left, reflecting structural homogeneity and weaker function. The position of T2-D near the advantageous zone underscores the role of moderate thinning in optimizing structure and enhancing both stability and productivity.

4.3. Management Implications for L. gmelinii Plantations

Synthesizing the results from both stand-age gradients and thinning interventions, L. gmelinii plantations exhibited an overall pattern of structural–functional co-enhancement with increasing age. However, a mismatch between structural improvement and functional response was observed in the middle-aged stage, whereas moderate thinning significantly optimized diameter-class distribution, canopy configuration, and stand stability, thereby enhancing productivity and accelerating the convergence of plantations toward near-natural forests [74,75]. This finding highlights that L. gmelinii plantations cannot be left unmanaged once canopy closure occurs; otherwise, excessive density and slenderness will lead to structural–functional mismatches. Scientific management is therefore required during the late young stage to the middle-aged period. Based on the present results, the critical intervention window lies between 10 and 30 years after planting, when trees are typically characterized by DBH less than 25 cm, HDR greater than 10, and TSSI below 0.25. At this stage, the stand structure is not yet fixed, providing the most effective opportunity to achieve structural optimization and functional improvement through management. During this period, stepwise, moderate, and targeted thinning should be implemented to reduce stand density and mitigate slenderness, while promoting increases in mean DBH, crown width, and canopy cover, as well as enhancing species diversity. These measures would synergistically strengthen stand stability and productivity and accelerate the transition from structural optimization to realized quality and functional enhancement [7,45,78,79]. Previous studies and long-term monitoring have confirmed that scientific thinning not only reduces canopy closure and improves understory light availability, but also accelerates the growth of residual trees, increases stand volume and biomass, and enhances carbon sequestration and community stability. Conversely, improper thinning may disrupt structural balance and lead to ecological function degradation [80]. Therefore, future management of plantations should be guided by the regularities of stand-age development, with emphasis on the critical period of 10–30 years. Precision thinning, complemented by targeted underplanting when necessary, should be applied to gradually cultivate near-natural, multi-layered, uneven-aged structures, thereby achieving the coordinated goals of structural optimization, productivity improvement, and ecological function enhancement.

5. Conclusions

Under the “dual-carbon” agenda and warming climate, strengthening the structural stability and productivity of cold-temperate Larix plantations is essential. Using age-gradient and thinning sequences in the Lesser Khingan Mountains, we showed that TSSI/FSSI reliably capture stability, and LBP-GAM fitted tree biomass with very high accuracy (R2 ≈ 0.9996). Along the age gradient, structure and function improved jointly: FSSI rose from 0.22 to 0.42 and BPH from 168.68 to 199.65 t·hm−2, although a mid-age functional lag remained. Two moderate thinnings (20% each) markedly optimized the configuration; T2-D approached or surpassed CK in MDBH, ACW, FSSI, and BPH (229.87 t·hm−2), while the proportion of low-stability trees declined to 42.65%. Mechanistically, DBH, TH, CW, and TSSI were positive drivers, HDR constrained growth; at the stand scale, CD, SR, and MDBH promoted FSSI and BPH, whereas MHDR and SD limited them. An actionable window occurs at DBH < 25 cm, HDR > 10, and TSSI < 0.25 (about 10–30 years post-planting); stepwise, moderate, targeted thinning with necessary underplanting should reduce density and slenderness, increase canopy cover and diameter structure, and enhance diversity. Future work should integrate high-resolution remote sensing and multi-platform LiDAR to extend monitoring and refine structure–function mechanisms for precision, high-quality management.

Author Contributions

Conceptualization, J.L. and S.C.; methodology, J.L. and P.Z.; software, X.H.; validation, J.L., S.C. and X.H.; formal analysis, J.L. and X.H.; investigation, J.L., P.Z., W.L. and D.H.; resources, J.L.; data curation, X.H., P.Z., W.L. and D.H.; writing—original draft preparation, J.L.; writing—review and editing, S.C.; visualization, J.L.; supervision, S.C.; project administration, S.C.; funding acquisition, S.C. All authors have read and agreed to the published version of the manuscript.

Funding

This research was supported by the National Key Research and Development Program of China: Intelligent Multifunctional Management Decision-making Technology for Larch Plantation Forests (No. 2023YFD2200804); the Special Research Program of the National Forestry and Grassland Administration: Macroscopic Ecological and Environmental Situation Analysis for Forest and Grassland Conservation and Development during the 15th Five-Year Plan Period (No. 500102-1779); the Fundamental Research Funds for Central Non-profit Research Institutes: Demonstration Project for the Compilation of the Wuxi Forest Ecological Product Catalogue (No. CAFYBB2024ZA028-3); and the Commissioned Project of Heilongjiang Yichun Forest Industry Group Limited Liability Company: Precision Improvement Service Project for Forest Quality Enhancement in the New Era.

Data Availability Statement

The research data used in this study were collected by the Forest Multi-Objective Management Team of the Institute of Forestry Science and Technology Information, Chinese Academy of Forestry, through in situ surveys conducted in Yichun, Heilongjiang Province, from September 2023 to October 2024, with the cooperation and support of the forestry bureaus of Yichun Forestry Group. The datasets generated and analyzed during the current study are available from the corresponding author upon reasonable request. Due to confidentiality agreements, the data are not publicly accessible.

Acknowledgments

We sincerely thank the researchers and students in our team for their valuable contributions to field sampling and laboratory analysis. We are also grateful to the local institutions for their support and assistance during data collection. In addition, our deep appreciation goes to the editor and anonymous reviewers for their meticulous and professional feedback, which significantly improved the quality of the manuscript.

Conflicts of Interest

The authors declare no conflicts of interest.

References

  1. Pan, Y.; Birdsey, R.A.; Fang, J.; Houghton, R.; Kauppi, P.E.; Kurz, W.A.; Phillips, O.L.; Shvidenko, A.; Lewis, S.L.; Canadell, J.G.; et al. A Large and Persistent Carbon Sink in the World’s Forests. Science 2011, 333, 988–993. [Google Scholar] [CrossRef] [PubMed]
  2. IPCC. Climate Change 2022—Impacts, Adaptation and Vulnerability: Working Group II Contribution to the Sixth Assessment Report of the Intergovernmental Panel on Climate Change; Cambridge University Press: Cambridge, UK, 2023. [Google Scholar]
  3. Zeng, Y.; Gou, M.; Ouyang, S.; Chen, L.; Fang, X.; Zhao, L.; Li, J.; Peng, C.; Xiang, W. The Impact of Secondary Forest Restoration on Multiple Ecosystem Services and Their Trade-Offs. Ecol. Indic. 2019, 104, 248–258. [Google Scholar] [CrossRef]
  4. Cheng, K.; Zhang, Y.; Ren, Y.; Chen, A.; Xiang, T.; Qi, Z.; Huang, G.; Yang, H.; Chen, Y.; Yang, Z.; et al. Natural Forest Restoration Potential to Mitigate Climate Change in China. Earth’s Future 2025, 13, e2024EF005794. [Google Scholar] [CrossRef]
  5. Cheng, K.; Yang, H.; Tao, S.; Su, Y.; Guan, H.; Ren, Y.; Hu, T.; Li, W.; Xu, G.; Chen, M.; et al. Carbon Storage through China’s Planted Forest Expansion. Nat. Commun. 2024, 15, 4106. [Google Scholar] [CrossRef]
  6. Cheng, K.; Zhang, Y.; Yang, H.; Ren, Y.; Xiang, T.; Chen, Y.; Yang, Z.; Chen, M.; Xu, J.; Huang, G.; et al. China’s Naturally Regenerated Forests Currently Have Greater Aboveground Carbon Accumulation Rates than Newly Planted Forests. Commun. Earth Environ. 2025, 6, 345. [Google Scholar] [CrossRef]
  7. Feng, Y.; Schmid, B.; Loreau, M.; Forrester, D.I.; Fei, S.; Zhu, J.; Tang, Z.; Zhu, J.; Hong, P.; Ji, C.; et al. Multispecies Forest Plantations Outyield Monocultures across a Broad Range of Conditions. Science 2022, 376, 865–868. [Google Scholar] [CrossRef]
  8. Hua, F.; Bruijnzeel, L.A.; Meli, P.; Martin, P.A.; Zhang, J.; Nakagawa, S.; Miao, X.; Wang, W.; McEvoy, C.; Peña-Arancibia, J.L.; et al. The Biodiversity and Ecosystem Service Contributions and Trade-Offs of Forest Restoration Approaches. Science 2022, 376, 839–844. [Google Scholar] [CrossRef]
  9. Yu, Z.; You, W.; Agathokleous, E.; Zhou, G.; Liu, S. Forest Management Required for Consistent Carbon Sink in China’s Forest Plantations. For. Ecosyst. 2021, 8, 54. [Google Scholar] [CrossRef]
  10. FAO (Food and Agriculture Organization of the United Nations). Global Forest Resources Assessment 2020; Food and Agricultural Organization of the United Nations: Rome, Italy, 2020. [Google Scholar]
  11. Zhao, X.; Hao, Y.; Wang, T.; Dong, L.; Li, F. Competition Is Critical to the Growth of Larix gmelinii and Betula platyphylla in Secondary Forests in Northeast China under Climate Change. Global Ecol. Conserv. 2024, 51, e02935. [Google Scholar] [CrossRef]
  12. Zhou, G.; Wang, Y.; Jiang, Y.; Yang, Z. Estimating Biomass and Net Primary Production from Forest Inventory Data: A Case Study of China’s Larix Forests. For. Ecol. Manag. 2002, 169, 149–157. [Google Scholar] [CrossRef]
  13. National Forestry and Grassland Administration (NFGA). The Ninth National Forest Resources Inventory (2014–2018); NFGA: Beijing, China, 2019. [Google Scholar]
  14. Ma, W.; Lei, S.; Sun, Y.; Grabosky, J. Forest Succession in Post-Agricultural Larix olgensis Plantations in Northeast China. J. For. Res. 2020, 31, 2495–2505. [Google Scholar] [CrossRef]
  15. Gao, M.; Zhao, G.; Zhang, S.; Wang, Z.; Wen, X.; Liu, L.; Zhang, C.; Tie, N.; Sa, R. Priority Conservation Area of Larix gmelinii under Climate Change: Application of an Ensemble Modeling. Front. Plant Sci. 2023, 14, 1177307. [Google Scholar] [CrossRef] [PubMed]
  16. Duan, B.; Man, X.; Cai, T.; Xiao, R.; Ge, Z. Increasing Soil Organic Carbon and Nitrogen Stocks along with Secondary Forest Succession in Permafrost Region of the Daxing’an Mountains, Northeast China. Glob. Ecol. Conserv. 2020, 24, e01258. [Google Scholar] [CrossRef]
  17. Zhou, C.; Zhang, H.; Lu, J.; Zhang, X. Disturbances and Succession Laws of Main Natural Secondary Forests in Northeast China. For. Res. 2021, 34, 175–183. [Google Scholar] [CrossRef]
  18. Guariguata, M.R.; Ostertag, R. Neotropical Secondary Forest Succession: Changes in Structural and Functional Characteristics. For. Ecol. Manag. 2001, 148, 185–206. [Google Scholar] [CrossRef]
  19. Shorohova, E.; Kuuluvainen, T.; Kangur, A.; Jõgiste, K. Natural Stand Structures, Disturbance Regimes and Successional Dynamics in the Eurasian Boreal Forests: A Review with Special Reference to Russian Studies. Ann. For. Sci. 2009, 66, 201. [Google Scholar] [CrossRef]
  20. Lin, B.; Ge, J. To Harvest or Not to Harvest? Forest Management as a Trade-off between Bioenergy Production and Carbon Sink. J. Clean. Prod. 2020, 268, 122219. [Google Scholar] [CrossRef]
  21. Bravo-Oviedo, A.; Pretzsch, H.; Del Río, M. (Eds.) Dynamics, Silviculture and Management of Mixed Forests; Managing Forest Ecosystems; Springer International Publishing: Cham, Switzerland, 2018; Volume 31, ISBN 978-3-319-91952-2. [Google Scholar]
  22. Forrester, D.I.; Bauhus, J. A Review of Processes Behind Diversity—Productivity Relationships in Forests. Curr. For. Rep. 2016, 2, 45–61. [Google Scholar] [CrossRef]
  23. Schuler, L.J.; Bugmann, H.; Snell, R.S. From Monocultures to Mixed-Species Forests: Is Tree Diversity Key for Providing Ecosystem Services at the Landscape Scale? Landsc. Ecol. 2017, 32, 1499–1516. [Google Scholar] [CrossRef]
  24. Tatsumi, S. Tree Diversity Effects on Forest Productivity Increase through Time Because of Spatial Partitioning. For. Ecosyst. 2020, 7, 24. [Google Scholar] [CrossRef]
  25. Liu, H.; Dong, X.; Qin, S.; Gao, T. Matter-Element Evaluation of Ecological Quality in Gaps of Temperate Secondary Forests. Ecol. Indic. 2025, 175, 113552. [Google Scholar] [CrossRef]
  26. Gandolfi, S.; Joly, C.A.; Rodrigues, R.R. Permeability—Impermeability: Canopy Trees as Biodiversity Filters. Sci. Agric. 2007, 64, 433–438. [Google Scholar] [CrossRef]
  27. Zhang, X.; Wang, Q.; Wang, S.; Sun, Q. Effect of the Close-to-Nature Transformation of Larix Gmelinii Pure Stands on Plant Diversity of Understory Vegetation in Xiaoxing’an Mountains of China. Sci. Silvae Sin. 2011, 47, 6–14. [Google Scholar]
  28. Pelt, R.V.; Franklin, J.F. Influence of Canopy Structure on the Understory Environment in Tall, Old-Growth, Conifer Forests. Can. J. For. Res. 2000, 30, 1231–1245. [Google Scholar] [CrossRef]
  29. Jiang, T.; Wang, H.; Dong, L.; Chen, Y.; Liu, Z. Effects of Different Intermediate Cutting Intensities on the Spatial Structure of Larix gmelinii Forest. J. Northeast. For. Univ. 2018, 46, 9–14. [Google Scholar] [CrossRef]
  30. Blois, J.L.; Williams, J.W.; Fitzpatrick, M.C.; Jackson, S.T.; Ferrier, S. Space Can Substitute for Time in Predicting Climate-Change Effects on Biodiversity. Proc. Natl. Acad. Sci. USA 2013, 110, 9374–9379. [Google Scholar] [CrossRef]
  31. Ruan, F.; Yan, L.; Wang, D. Policy Effects on the Sustainable Development of Resource-Based Cities in China: A Case Study of Yichun City. Resour. Policy 2021, 72, 102145. [Google Scholar] [CrossRef]
  32. Liu, J.; Chen, J.; Chen, S.; Wu, K. Forest Management Type Identification Based on Stacking Ensemble Learning. Forests 2024, 15, 887. [Google Scholar] [CrossRef]
  33. Xu, L.; Yu, H.; Zhong, L. Sustainable Futures for Transformational Forestry Resource-Based City: Linking Landscape Pattern and Administrative Policy. J. Clean. Prod. 2025, 496, 145087. [Google Scholar] [CrossRef]
  34. Stevens, J.T.; Safford, H.D.; North, M.P.; Fried, J.S.; Gray, A.N.; Brown, P.M.; Dolanc, C.R.; Dobrowski, S.Z.; Falk, D.A.; Farris, C.A.; et al. Average Stand Age from Forest Inventory Plots Does Not Describe Historical Fire Regimes in Ponderosa Pine and Mixed-Conifer Forests of Western North America. PLoS ONE 2016, 11, e0147688. [Google Scholar] [CrossRef]
  35. GB/T 38590-2020; Technical Regulations for Continuous Forest Inventory. Standards Press of China: Beijing, China, 2020.
  36. Vargas G., G.; Marcano-Vega, H.; Ruzycki, T.; Wood, T.E.; Anderegg, W.R.L.; Powers, J.S.; Helmer, E.H. Aridity and Forest Age Mediate Landscape Scale Patterns of Tropical Forest Resistance to Cyclonic Storms. J. Ecol. 2025, 113, 53–67. [Google Scholar] [CrossRef]
  37. Lucas-Borja, M.E.; Hedo, J.; Cerdá, A.; Candel-Pérez, D.; Viñegla, B. Unravelling the Importance of Forest Age Stand and Forest Structure Driving Microbiological Soil Properties, Enzymatic Activities and Soil Nutrients Content in Mediterranean Spanish Black Pine (Pinus nigra Ar. ssp. Salzmannii) Forest. Sci. Total Environ. 2016, 562, 145–154. [Google Scholar] [CrossRef]
  38. Wen, G.; Ma, J.; Xu, W.; Wang, J.; He, W.; Wang, Y.; Wang, X.; Li, T.; Ye, M.; Chen, G.; et al. Response of Understory Plant Functional Groups to Changes in Stand Spatial Structure in Masson Pine (Pinus massoniana Lamb.) Plantations Depends on Thinning Mode and Intensity. J. Environ. Manag. 2025, 376, 124441. [Google Scholar] [CrossRef] [PubMed]
  39. Cao, X.; Li, J.; Feng, Y.; Hu, Y.; Zhang, C.; Fang, X.; Deng, C. Analysis and Evaluation of the Stand Spatial Structure of Cunninghamia Lanceolata Ecological Forest. Sci. Silvae Sin. 2015, 51, 37–48. [Google Scholar]
  40. Lin, F.; Wang, W.; Men, X.; Sun, Y.; Li, G.; Liu, D. Spatial Structure Optimal of Larix gmelinii Plantation. J. Beijing For. Univ. 2021, 43, 68–76. [Google Scholar] [CrossRef]
  41. Qing, D.; Zhang, J.; Li, J.; Peng, J.; Liu, S. Research on the Difference of Mingling Degree under Different Selection Schemes of Adjacent Trees. For. Grassl. Resour. Res. 2021, 4, 69–78. [Google Scholar] [CrossRef]
  42. Hu, Y.; Hui, G. How to Describe the Crowding Degree of Trees Based on the Relationship of Neighboring Trees. J. Beijing For. Univ. 2015, 37, 1–8. [Google Scholar]
  43. Lai, M.; Lai, R.; Hu, R.; Ye, W. Analysis and Correlation Study on Spatial Structure Parameters of Artificial Cunninghamia Lanceolata Forest Stand. Ecol. Sci. 2021, 40, 58–63. [Google Scholar] [CrossRef]
  44. Hao, Y.; Wang, J.; Wang, Q.; Sun, P.; Pu, C. Preview of Spatial Structure of Cryptomeria Fortunei Plantation after Stand Improvement. Sci. Silvae Sin. 2006, 42, 8–13. [Google Scholar] [CrossRef]
  45. Zhang, J.; Xu, Z.; Wen, X.; Wang, Q.; Ye, J. Spatial Structure Analysis and Comprehensive Index Evaluation of Fir Plantation Stands. J. Northwest For. Univ. 2024, 39, 10–16. [Google Scholar] [CrossRef]
  46. Sun, Z.; Wang, Y.; Pan, L.; Sun, Y. Hegyi Competition Index Decomposition to Improve Estimation Accuracy of Larix olgensis Crown Radius. Ecol. Indic. 2022, 143, 109322. [Google Scholar] [CrossRef]
  47. Sun, Y.; Liu, S.; Tian, J.; Cheng, F.; Zhao, S.; Wang, S. Establishment of Thinning Models for Larix olgensis Plantation Based on Spatial Structure Optimization. J. Cent. South Univ. For. Technol. 2023, 43, 72–83. [Google Scholar] [CrossRef]
  48. Zhang, J.; Liu, C.; Ge, Z.; Zhang, Z. Stand Spatial Structure and Productivity Based on Random Structural Unit in Larix principis-rupprechtii Forests. Ecosphere 2024, 15, e4824. [Google Scholar] [CrossRef]
  49. Wang, X.; Dallimer, M.; Scott, C.E.; Shi, W.; Gao, J. Tree Species Richness and Diversity Predicts the Magnitude of Urban Heat Island Mitigation Effects of Greenspaces. Sci. Total Environ. 2021, 770, 145211. [Google Scholar] [CrossRef] [PubMed]
  50. Yan, M.; Huang, Q.; Wang, J.; Wang, S. Research on Height to Diameter Ratio of Forest Trees: A Review. World For. Res. 2023, 36, 59–65. [Google Scholar] [CrossRef]
  51. Liu, Z.; Qiang, B.; Zhang, H.; Fu, L.; Guo, J. Influence of Climate and Site Grade on Biomass Estimation of Larix gmelinii Stand. J. Beijing For. Univ. 2025, 47, 22–28. [Google Scholar] [CrossRef]
  52. Luo, Y.; Wang, X.; Ouyang, Z.; Lu, F.; Feng, L.; Tao, J. A Review of Biomass Equations for China’s Tree Species. Earth Syst. Sci. Data 2020, 12, 21–40. [Google Scholar] [CrossRef]
  53. Xu, E.; Guo, Y.; Chen, E.; Li, Z.; Zhao, L.; Liu, Q. An Estimation Model for Regional Forest Canopy Closure Combined with UAV LiDAR and High Spatial Resolution Satellite Remote Sensing Data. Geomat. Inf. Sci. Wuhan Univ. 2022, 47, 1298–1308. [Google Scholar] [CrossRef]
  54. Li, Y.; Zhang, B.; Qin, S.; Li, S.; Huang, X. Review of Research and Application of Forest Canopy Closure and Its Measuring Methods. World For. Res. 2008, 21, 006. [Google Scholar] [CrossRef]
  55. He, W.; Luo, C.; Wang, Y.; Wen, X.; Wang, Y.; Li, T.; Chen, G.; Zhao, K.; Li, X.; Fan, C. Response Strategies of Root System Architecture to Soil Environment: A Case Study of Single-Species Cupressus funebris Plantations. Front. Plant Sci. 2022, 13, 822223. [Google Scholar] [CrossRef]
  56. Moreau, G.; Chagnon, C.; Achim, A.; Caspersen, J.; D’Orangeville, L.; Sánchez-Pinillos, M.; Thiffault, N. Opportunities and Limitations of Thinning to Increase Resistance and Resilience of Trees and Forests to Global Change. For. Int. J. For. Res. 2022, 95, 595–615. [Google Scholar] [CrossRef]
  57. Forrester, D.I.; Pretzsch, H. Tamm Review: On the Strength of Evidence When Comparing Ecosystem Functions of Mixtures with Monocultures. For. Ecol. Manag. 2015, 356, 41–53. [Google Scholar] [CrossRef]
  58. Abbasi, U.A.; Gilani, H.; Hussain, K.; Ali, A. Increasing Stand Stature Weakens the Positive Effects of Tree Richness and Structural Imbalance on Aboveground Biomass in Temperate Forests: The Stand Stature Hypothesis. For. Ecol. Manag. 2023, 539, 121040. [Google Scholar] [CrossRef]
  59. Alexandrov, G.A. Carbon Stock Growth in a Forest Stand: The Power of Age. Carbon Balance Manag. 2007, 2, 4. [Google Scholar] [CrossRef] [PubMed]
  60. Peng, W.; Pukkala, T.; Jin, X.; Li, F. Optimal Management of Larch (Larix olgensis A. Henry) Plantations in Northeast China When Timber Production and Carbon Stock Are Considered. Ann. For. Sci. 2018, 75, 63. [Google Scholar] [CrossRef]
  61. Liu, H.; Chen, Q.; Liu, X.; Xu, Z.; Dai, Y.; Liu, Y.; Chen, Y. Variation Patterns of Plant Composition/Diversity in Dacrydium pectinatum Communities and Their Driving Factors in a Biodiversity Hotspot on Hainan Island, China. Glob. Ecol. Conserv. 2020, 22, e01034. [Google Scholar] [CrossRef]
  62. Yang, S.; Tan, W.; Chen, X.; Tang, J.; Yang, Z.; Wu, Y. Study on Stand Spatial Structure of Typical Pinus massoniana Mixed Forest in Liping County of Guizhou Province. For. Grassl. Resour. Res. 2023, 3, 105–114. [Google Scholar] [CrossRef]
  63. Liu, F.; Tan, C.; Yang, Z.; Li, J.; Xiao, H.; Tong, Y. Regeneration and Growth of Tree Seedlings and Saplings in Created Gaps of Different Sizes in a Subtropical Secondary Forest in Southern China. For. Ecol. Manag. 2022, 511, 120143. [Google Scholar] [CrossRef]
  64. Chai, Z.; Wang, D.; Hao, Y.; Zhang, L.; Zhu, H.; Zhang, C. Succession Dynamics of Larix principis-rupprechtii Plantation in Intermediate Section of Qinling Mountains. Sci. Silvae Sin. 2014, 50, 14–21. [Google Scholar]
  65. Ren, G.; Young, S.S.; Wang, L.; Wang, W.; Long, Y.; Wu, R.; Li, J.; Zhu, J.; Yu, D.W. Effectiveness of China’s National Forest Protection Program and Nature Reserves: Deforestation and Protected Areas in China. Conserv. Biol. 2015, 29, 1368–1377. [Google Scholar] [CrossRef]
  66. Wang, Q.; Yang, K.; Zhang, Q.; Zhou, C.; Su, Y.; Gao, T.; Lu, D.; Zhang, J. Research Progress on the Effects of Stand Age on Carbon Accumulation and Stability in Forest Ecosystems. Chin. J. Soil Sci. 2025, 56, 1189–1200. [Google Scholar] [CrossRef]
  67. Xu, C.; Wu, X.; Tian, Y.; Shi, L.; Qi, Y.; Zhang, J.; Liu, H. Short Lifespan and ‘Prime Period’ of Carbon Sequestration Call for Multi-Ages in Dryland Tree Plantations. For. Ecosyst. 2024, 11, 100224. [Google Scholar] [CrossRef]
  68. Konôpka, B.; Pajtík, J.; Marčiš, P.; Šebeň, V. Aboveground Biomass Productivity Relates to Stand Age in Early-Stage European Beech Plantations, Western Carpathians. Plants 2025, 14, 2992. [Google Scholar] [CrossRef]
  69. Lin, N.; Deng, N.; Lu, D.; Xie, H.; Feng, M.; Chen, S. Short-Term Effects of Thinning on Tree Growth and Soil Nutrients in the Middle-Aged Chinese Fir (Cunninghamia lanceolata (Lamb.) Hook.) Plantations. Forests 2022, 14, 74. [Google Scholar] [CrossRef]
  70. Valinger, E.; Sjögren, H.; Nord, G.; Cedergren, J. Effects on Stem Growth of Scots Pine 33 Years after Thinning and/or Fertilization in Northern Sweden. Scand. J. For. Res. 2019, 34, 33–38. [Google Scholar] [CrossRef]
  71. Hilt, D.E. Diameter Growth of Upland Oaks After Thinning; U.S. Department of Agriculture, Forest Service, Northeastern Forest Experiment Station: Broomall, PA, USA, 1979.
  72. Wang, H.; Liu, W.; Wang, W.; Zu, Y. Influence of Long-term Thinning on the Biomass Carbon and Soil Respiration in a Larch (Larix gmelinii ) Forest in Northeastern China. Sci. World J. 2013, 2013, 865645. [Google Scholar] [CrossRef]
  73. Ma, Y.; Cheng, X.; Kang, F.; Han, H. Effects of Thinning on Soil Aggregation, Organic Carbon and Labile Carbon Component Distribution in Larix principis-rupprechtii Plantations in North China. Ecol. Indic. 2022, 139, 108873. [Google Scholar] [CrossRef]
  74. Sun, C.; Li, L.; Dong, X.; Qin, F.; Yang, Z. Variations and Factors Characterizing Ecological Niches of Understory Herbaceous Species in Plantation Forests. Sustainability 2022, 14, 10719. [Google Scholar] [CrossRef]
  75. Feng, Y.-C.; Zheng, X.-Y.; Wang, Z.-N.; Liu, B.; Lan, S.-R. Niche Characteristics of Plant Populations in Understory Herbaceous Layer of Cunninghamia lanceolata Pure Forest and Mixed Forest. J. Ecol. Rural Environ. 2019, 35, 217–224. [Google Scholar] [CrossRef]
  76. Georgi, L.; Kunz, M.; Fichtner, A.; Reich, K.F.; Bienert, A.; Maas, H.-G.; Von Oheimb, G. Effects of Local Neighbourhood Diversity on Crown Structure and Productivity of Individual Trees in Mature Mixed-Species Forests. For. Ecosyst. 2021, 8, 26. [Google Scholar] [CrossRef]
  77. Jucker, T.; Fischer, F.J.; Chave, J.; Coomes, D.A.; Caspersen, J.; Ali, A.; Loubota Panzou, G.J.; Feldpausch, T.R.; Falster, D.; Usoltsev, V.A.; et al. The Global Spectrum of Tree Crown Architecture. Nat. Commun. 2025, 16, 4876. [Google Scholar] [CrossRef]
  78. Wang, X.; Huang, X.; Wang, Y.; Yu, P.; Guo, J. Impacts of Site Conditions and Stand Structure on the Biomass Allocation of Single Trees in Larch Plantations of Liupan Mountains of Northwest China. Forests 2022, 13, 177. [Google Scholar] [CrossRef]
  79. Li, Y.; Yu, Z.; She, P.; Ma, J.; Jia, B.; Wang, Z. Effects of Stand Density on Understory Plant Diversity of Larix principis-rupprechtii Plantation—A Case Study in Diediegou Small Watershed in Liupan Mountain. J. Gansu Agric. Univ. 2021, 56, 114–120. [Google Scholar] [CrossRef]
  80. Li, Y.; Li, H.; Zhang, W.; Chen, B.; Yang, L.; Li, M.; Zhu, J.; Cai, Q. The Effects of Thinning on Tree Growth and Stand Biomass in a Chronosequence of Pinus tabulaeformis Plantations in the Loess Plateau of China. Forests 2023, 14, 1620. [Google Scholar] [CrossRef]
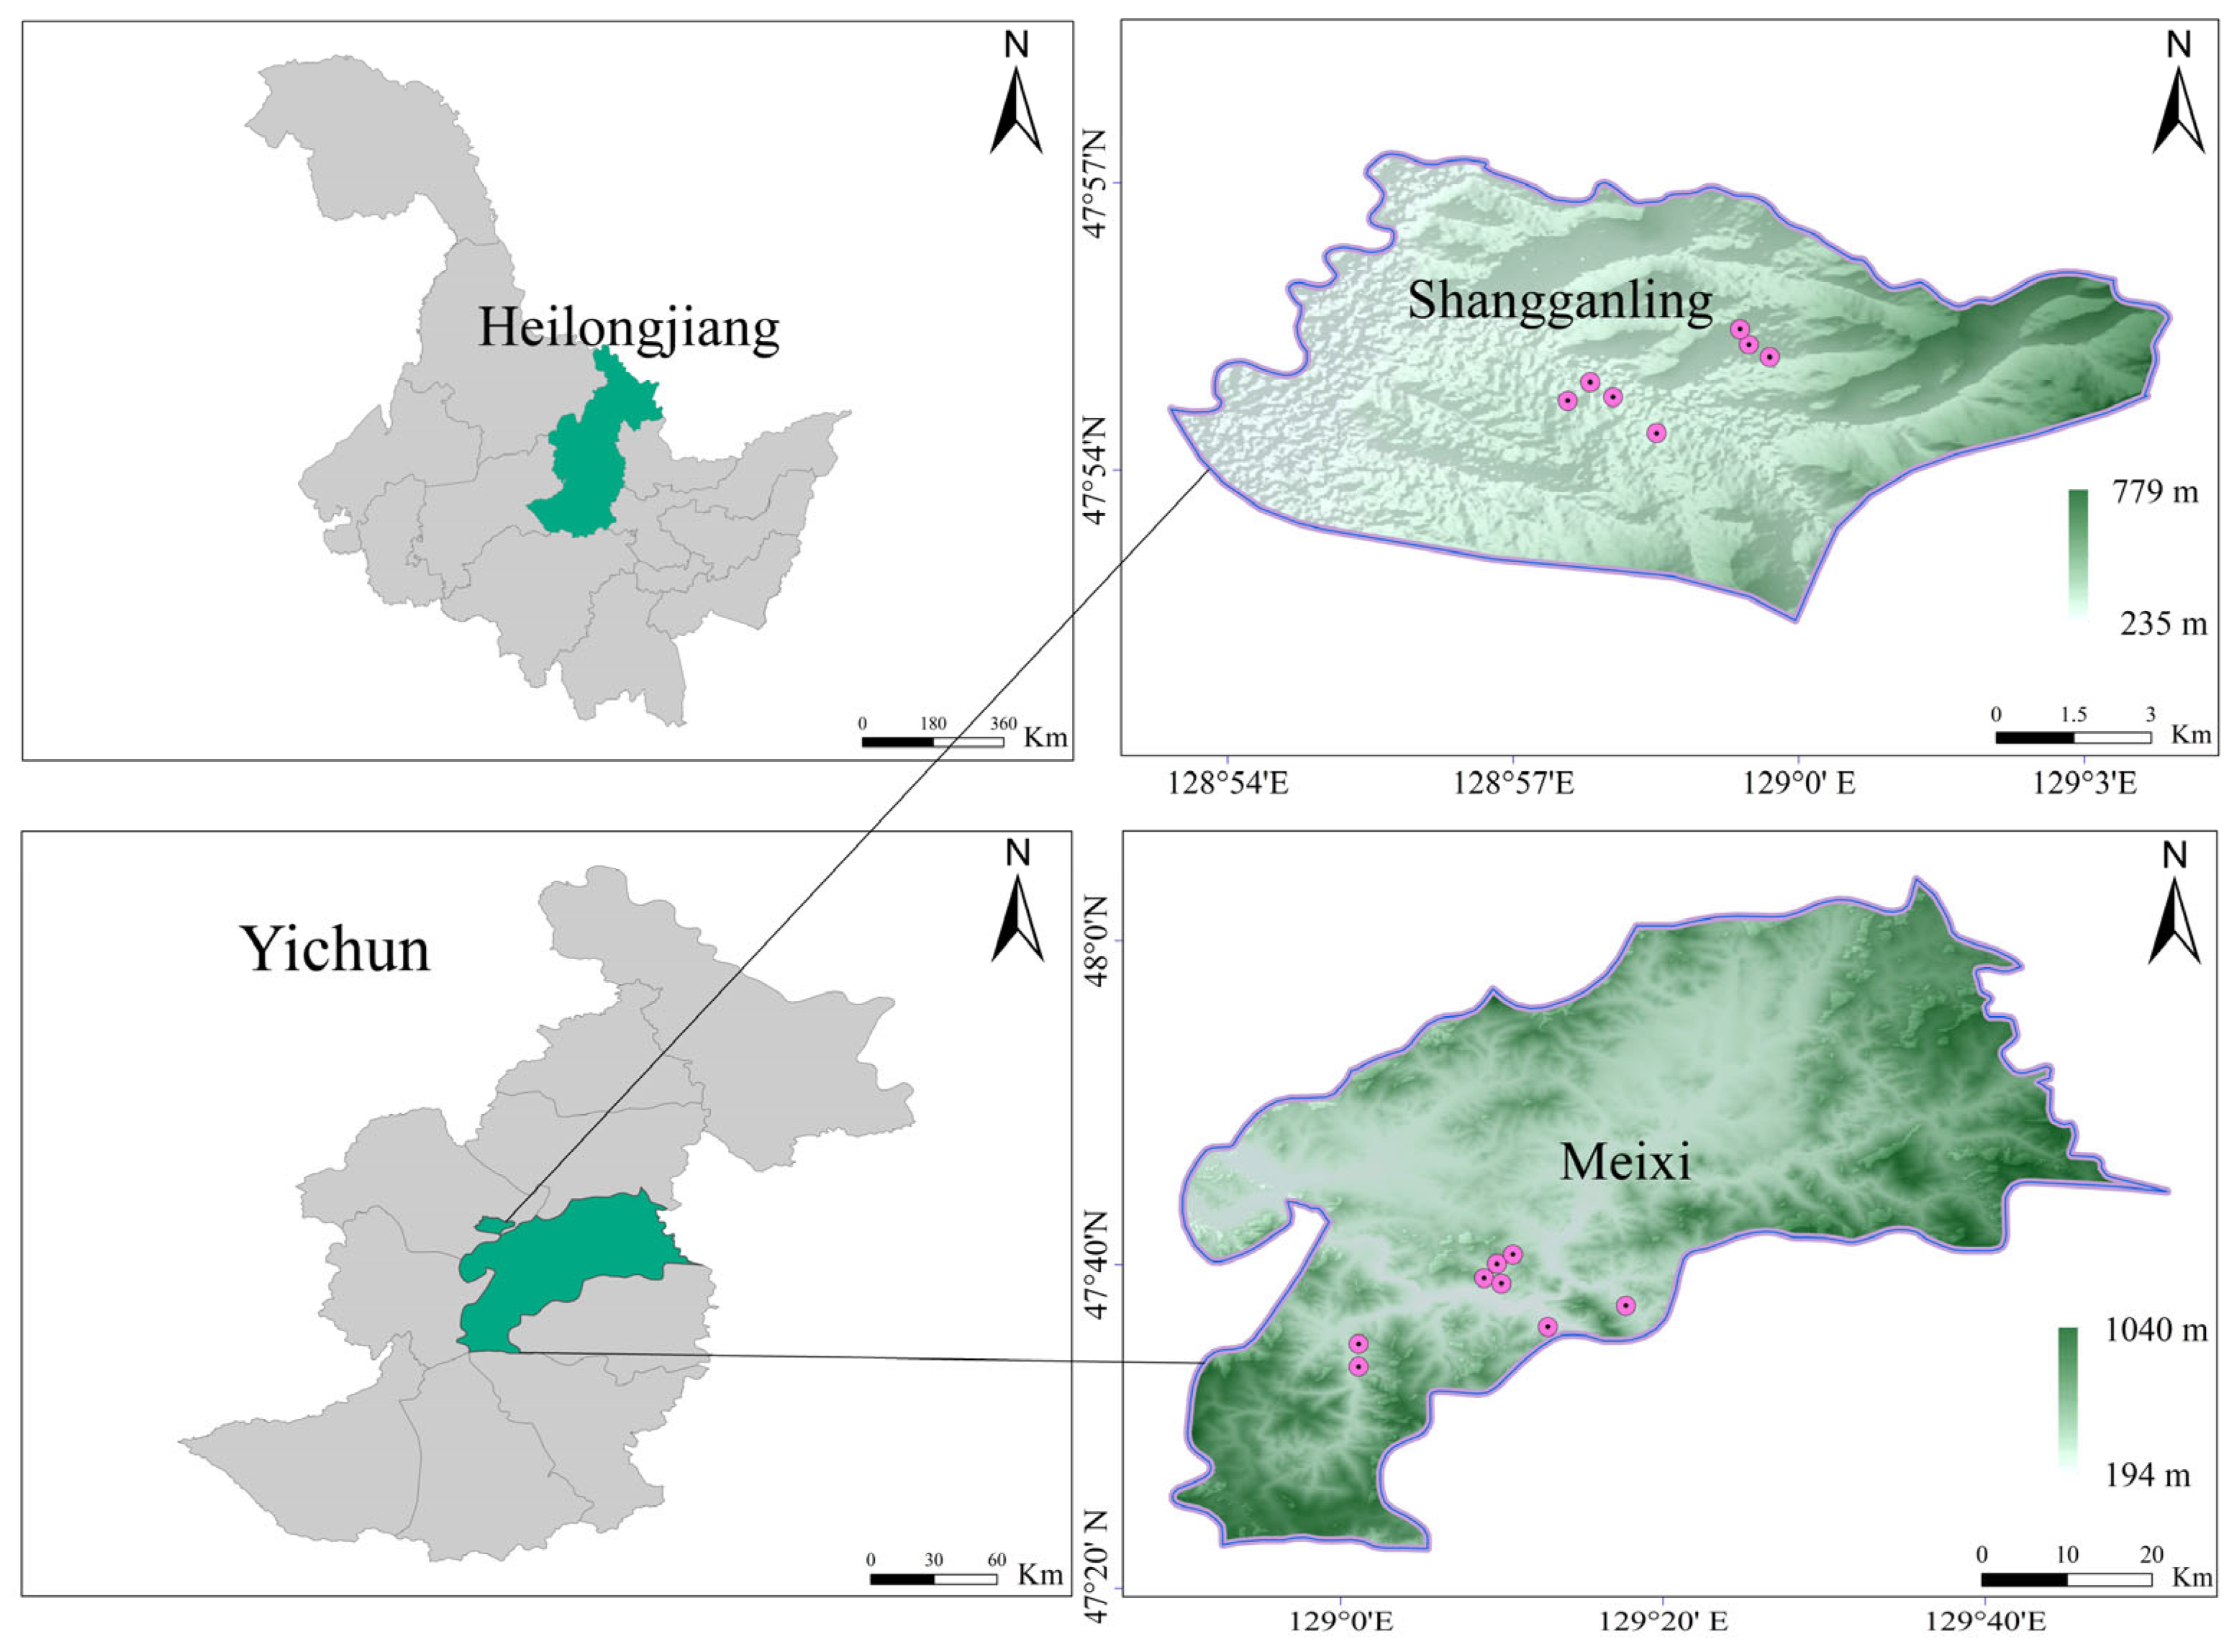
Figure 1. Distribution of sampling plots in the study area.
Forests 16 01552 g001
Figure 2. Distribution of L. gmelinii trees across TSSI stability levels in different groups.
Forests 16 01552 g002
Figure 3. Correlation analysis results across different spatial scales: (a) correlation analysis among tree-level factors, showing frequency distributions (diagonal panels), pairwise correlation coefficients with significance levels (lower-left panels), and scatterplots with fitted ellipses (upper-right panels); (b) correlation analysis among stand-level factors, with the same layout, where color intensity indicates the strength and direction of correlation. Asterisks indicate significance levels (* p < 0.05, ** p < 0.01, *** p < 0.001).
Forests 16 01552 g003
Figure 4. Structural and functional variations in stands across T1, T2, and T3. Panels (ai) show the distributions of MDBH, SMH, ACW, MHDR, CD, SR, SD, FSSI, and BPH, respectively. Different lowercase letters above the violin plots (a, ab, b) indicate significant differences among groups at p < 0.05 based on Tukey’s HSD test. Groups labeled with the same letter (e.g., a and ab) are not significantly different, while those labeled with different letters (e.g., a vs. b) differ significantly. The intermediate label ab means that this group does not differ significantly from either group a or b.
Forests 16 01552 g004
Figure 5. Structural and functional variations in stands across T2, T2-D, and CK. Panels (ai) show the distributions of MDBH, SMH, ACW, MHDR, CD, SR, SD, FSSI, and BPH, respectively. Different lowercase letters above the violin plots (a, ab, b) indicate significant differences among groups at p < 0.05 based on Tukey’s HSD test. Groups labeled with the same letter (e.g., a and ab) are not significantly different, while those labeled with different letters (e.g., a vs. b) differ significantly. The intermediate label ab means that this group does not differ significantly from either group a or b.
Forests 16 01552 g005
Figure 6. Performance of the LBP-GAM model. (a) Relationship between observed and predicted biomass values; (b) Comparison of the means and standard errors between observed and predicted values.
Forests 16 01552 g006
Figure 7. Nonlinear responses of structural variables to tree biomass. (ae) Red lines represent the GAM smoothing curves, with shaded areas indicating the 95% confidence intervals. R2 denotes the coefficient of determination; p-values indicate statistical significance (*** p < 0.001).
Forests 16 01552 g007
Figure 8. Regression analysis results between structural indicators and BPH. Panels (ah) show the linear relationships between each structural variable and BPH. The red dashed lines represent fitted regression lines, and the pink shaded areas indicate 95% confidence intervals. R2 denotes the coefficient of determination, and p represents the significance level (* p < 0.05, ** p < 0.01).
Forests 16 01552 g008
Figure 9. RDA ordination of stand variables and functional indicators.
Forests 16 01552 g009
Figure 10. Comparison of DBH, CW, and productivity of stands under different scenarios. Panels (ac) show the distributions of individual-tree DBH, CW, and TB along the stand-age gradient (T1–T3), while panels (df) illustrate the corresponding distributions under different management treatments (T2, T2-D, and CK).
Forests 16 01552 g010
Table 1. Descriptive statistics of L. gmelinii tree-level parameters.
TypeDBH (cm)TH (m)CW (m)TB (kg)HDRMDODUAICNCCI
Min6.005.900.5013.923.860.000.080.000.000.000.21
Max51.5032.0012.18948.9917.151.000.600.751.001.007.80
Mean20.0018.423.59200.279.990.240.190.470.690.421.83
Standard Deviation9.415.452.01190.162.250.300.080.170.290.351.03
Note: DBH, diameter at breast height (cm); TH, tree height (m); CW, crown width (m); TB, tree biomass (kg); HDR, height–diameter ratio; MD, mingling degree; OD, opening degree; UAI, uniform angle index; C, crowding; NC, neighborhood comparison; CI, competition index. Units are given in column headers where applicable.
Table 2. Summary statistics of spatial structural parameters across different plots.
IDAGAA (a)Species CompositionMDODUAICNCCI
T1-1119Planted L. gmelinii (100%)0.060.140.470.620.492.22
T1-2119Planted L. gmelinii (100%)00.150.460.60.452.08
T1-3119Planted L. gmelinii (70%), Betula platyphylla (30%)0.220.150.460.660.492.27
T2-1226Planted L. gmelinii (90%), Ulmus pumila (10%)0.390.180.480.610.512.33
T2-2226Planted L. gmelinii (80%), Picea asperata (10%), B. platyphylla (10%)0.410.170.470.860.472.19
T2-3223Planted L. gmelinii (60%), B. platyphylla (30%), P. asperata (10%)0.450.190.480.530.492.44
T3-1446Planted L. gmelinii (100%)0.220.210.480.860.471.42
T3-2336Planted L. gmelinii (60%), P. asperata (30%), Pinus koraiensis (10%)0.710.270.460.770.462.12
T3-3456Planted L. gmelinii (70%), P. koraiensis (30%)0.80.330.490.910.482.77
T2-D-1226Planted L. gmelinii (100%)0.390.180.430.690.492.05
T2-D-2226Planted L. gmelinii (70%), B. platyphylla (10%), P. asperata (10%), Fraxinus mandshurica (10%)0.740.250.470.960.481.9
T2-D-3226Planted L. gmelinii (80%), P. koraiensis (20%)0.80.250.470.90.493.06
CK-1263L. gmelinii (50%), U. pumila (20%), F. mandshurica (10%), B. platyphylla (10%), Betula dahurica (10%)0.660.240.510.90.484.68
CK-2264L. gmelinii (30%), B. dahurica (30%), Quercus mongolica (20%), B. platyphylla (20%)0.780.230.480.930.513.05
CK-3266L. gmelinii (70%), B. platyphylla (20%), P. asperata (10%)0.80.320.490.620.442.02
Note: The numerical values represent the proportion of timber volume contributed by each species within the plot. Abbreviations: AG, age group; AA, average age; MD, mingling degree; OD, opening degree; UAI, uniform angle index; C, crowding; NC, neighborhood comparison; CI, competition index. AG is a dimensionless categorical variable indicating the developmental stage of the stand, classified as follows: 1 = young forest, 2 = half-mature forest, 3 = pre-mature forest, and 4 = mature forest. The classification of age groups follows the forestry industry standard “Classification of Age Classes and Age Groups for Major Tree Species” (LY/T 2908—2017).
Table 3. Stand-level structural and functional parameters for different stand types.
GroupMDBH (cm)SMH (m)ACW (m)MHDRCDSRSD (Tree·hm−2)BPH (t·hm−2)
T115.32 ± 1.516.09 ± 0.872.53 ± 0.1410.87 ± 0.50.56 ± 0.091.67 ± 0.581465.0 ± 282.36168.68 ± 31.19
T216.13 ± 2.1716.17 ± 2.393.23 ± 0.7910.43 ± 0.120.62 ± 0.145.33 ± 1.531110.0 ± 211.6161.03 ± 24.01
T325.27 ± 4.4418.84 ± 5.395.36 ± 0.538.05 ± 0.610.77 ± 0.046.67 ± 4.16565.0 ± 121.24199.65 ± 29.34
T2-D23.12 ± 2.3818.57 ± 3.65.2 ± 1.348.78 ± 0.940.77 ± 0.177.33 ± 3.06695.0 ± 99.87229.87 ± 32.45
CK18.16 ± 2.6714.22 ± 0.984.54 ± 0.638.96 ± 1.280.8 ± 0.1910.33 ± 2.08950.0 ± 270.55267.58 ± 125.01
Note: Values are presented as mean ± standard deviation across plots within each group (n = 3). Abbreviations: MDBH, mean diameter at breast height (cm); SMH, stand mean height (m); ACW, average crown width (m); MHDR, mean height–diameter ratio; CD, crown density (0–1); SR, species richness (number of tree species per plot); SD, stand density (trees·hm−2); BPH, biomass per hectare (t·hm−2). Units are given in column headers where applicable.
Table 4. Descriptive statistics of TSSI for the ten most abundant species.
IDSpeciesCountMeanVarianceStandard DeviationMedian
1L. gmelinii5840.280.060.250.20
2P. koraiensis730.390.120.350.28
3B. platyphylla730.310.100.310.22
4U. pumila560.310.110.340.21
5F. mandshurica420.420.120.350.32
6P. asperata290.380.190.440.07
7B. dahurica210.370.140.370.22
8Q. mongolica210.250.100.310.14
9Acer pictum Thunb.120.370.190.430.19
10Phellodendron amurense Rupr.90.440.260.510.03
Table 5. The attributes of L. gmelinii trees across different stability levels.
TSSI LevelDBH (cm)TH (m)CW (m)HDRTSSITB (kg)Number of L. gmelinii Trees
I15.3916.332.8111.040.09117.23293
II20.4518.923.639.710.29196.81152
III27.2221.444.818.280.50326.8670
IV28.3622.474.738.480.68365.3835
V34.2423.826.507.370.94500.6934
Average20.0018.423.599.990.28200.27584
Note: TSSI, tree spatial structure index; DBH, diameter at breast height (cm); TH, tree height (m); CW, crown width (m); HDR, height–diameter ratio; TB, tree biomass (kg). Units are given in column headers where applicable.
Table 6. Descriptive statistics of stand-level FSSI for individual plots.
IDCountMeanVarianceStandard DeviationMedian
T1-11070.170.030.180.12
T1-2760.220.040.20.16
T1-31100.270.040.210.22
T2-1610.290.070.270.22
T2-2720.30.090.30.21
T2-3890.20.050.220.13
T3-1290.320.080.280.26
T3-2390.450.120.350.45
T3-3450.50.150.380.52
T2-D-1520.40.090.30.37
T2-D-2390.450.140.380.38
T2-D-3480.360.140.370.16
CK-1620.320.110.340.19
CK-2820.350.110.340.25
CK-3460.370.140.370.2
Disclaimer/Publisher’s Note: The statements, opinions and data contained in all publications are solely those of the individual author(s) and contributor(s) and not of MDPI and/or the editor(s). MDPI and/or the editor(s) disclaim responsibility for any injury to people or property resulting from any ideas, methods, instructions or products referred to in the content.