Article

Multi-Centennial Disturbance History and Terrestrial Carbon Transfers in a Coastal Forest Watershed Before and During Reservoir Development

1
Natural Resources Canada, Victoria, BC V8Z 1M5, Canada
2
Department of Biology, University of Victoria, Victoria, BC V8W 2Y2, Canada
3
Natural Resources Canada, Edmonton, AB T6H 3S5, Canada
4
Department of Earth and Environmental Sciences, University of British Columbia Okanagan, Kelowna, BC V1V 1V7, Canada
5
Department of Geography, University of Victoria, Victoria, BC V8W 2Y2, Canada
*
Authors to whom correspondence should be addressed.
Forests 2025, 16(10), 1549; https://doi.org/10.3390/f16101549
Submission received: 19 August 2025 / Revised: 2 October 2025 / Accepted: 4 October 2025 / Published: 8 October 2025
(This article belongs to the Special Issue Erosion and Forests: Drivers, Impacts, and Management)

Abstract

Multi-centennial C budgets in forested watersheds require information on forest growth, detritus turnover, and disturbances, as well as the transfer to and fate of terrestrial C in aquatics systems. Here, a sediment gravity core was collected from a drinking water reservoir in Canada, and analyzed for temporal changes in charcoal, magnetic susceptibility, carbon, and nitrogen. These indicators were used to assess disturbance history and terrestrial C sequestration in sediments. During the reservoir development period from 1910 to 2012, charcoal flux and magnetic susceptibility increased ca. 10 years after nearby fire and forest-clearing events associated with reservoir expansion. Total C and δ13C gradually declined during the development period, likely due to increased inputs of mineral soil from human activity. Concurrently, total terrestrial C sequestered in sediments, estimated using three or eight marker compounds, ranged between 3557 and 5145 Mg C/100 yrs, accounting for 11%–17% of DOC exports to the reservoir (30,640 Mg C/100 yrs), as estimated from a previously developed terrestrial carbon budget model. In comparison, mixed-severity fires burned around the reservoir during the pre-development period (pre-1910), as evidenced by stand ages and/or increases in charcoal flux. In general, decreased terrestrial C flux was associated with higher-severity fires that burned between 1870 and 1890 and perhaps around 1790. Further, comparisons show that soil erosion was up to 3× greater in the development versus the pre-development period. Overall, this investigation revealed the impact of land use change and fire on watershed carbon budgets and advanced a previously developed pyGC-MS methodology that demonstrated the amount of terrestrial and aquatic C being buried in sediment. It also identified the fraction of terrestrial C that was exported from the forest to the reservoir and sequestered in the sediment, uncommon data that could inform current and future landscape C budget modelling studies in this region.

1. Introduction

Atmospheric carbon dioxide levels have steadily increased since 1960 (common era herein) [1], driving climate change [2] and ocean acidification [3]. For this reason, considerable research has focused on accurately modelling terrestrial carbon cycles [4,5], including improving methods of quantifying carbon (C) in various systems [6]. However, while anthropogenic greenhouse gas emissions are contributing significantly to the global carbon cycle [7], they are not the only influential factors. For example, other factors such as forest clearing or fire disturbance likewise affect carbon flux.
In the northern hemisphere, forests play a major role in terrestrial carbon budgets and are considered significant sinks of atmospheric carbon [7,8,9]. Forests sequester carbon from the atmosphere through photosynthesis and release it through respiration from the vegetation and/or decomposition of plant detritus. Carbon sinks represent conditions where the balance between the two, known as net ecosystem productivity (NEP), is positive. Net biome productivity (NBP) includes NEP and direct losses of ecosystem C due to disturbances such as fire and tree harvest removals or transfers of terrestrial C to aquatic systems. Fire disturbance or soil erosion can result in increased transport of dissolved and particulate material into downstream waterways, including carbon-rich combustion products like charcoal and dissolved organic carbon (DOC), often increasing pH and turbidity, and elevating nitrogen (N) and phosphorus levels [10]. These various factors can adversely affect drinking water quality, making fires an important issue of concern to water supply and watershed managers.
The Carbon Budget Model—Canadian Forest Sector (CBM-CFS3) is used to report annually on the role of managed forests in Canada’s greenhouse gas inventory. It has also been used to determine landscape-scale carbon budgets for operational areas in Canada and other countries [11]. When preparing a carbon budget, the model must be initiated for several thousand years with repeated cycles of forest growth and disturbance, typically fire, to allow initialization of ecosystem soil and detritus carbon pools (i.e., dead organic matter) [11]. Estimates of fire frequencies for inclusion in the CBM-CFS3 model initiation are typically derived from the literature for certain time periods and locations. However, if this information is absent for a particular study site, then fire frequencies need to be alternatively obtained. One alternate method involves quantifying charcoal in lake sediments [12], providing a record of local fire disturbance that can span centuries to millennia [13].
The CBM-CFS3 model accounts for the transfer of DOC from forests into lakes and streams. By default, the parameter that controls this transfer is set to zero due to the assumption that all DOC transferred to lakes is respired to the atmosphere and that long-term accumulation of terrestrial carbon in aquatic systems does not occur [14]. However, research has shown that lakes and reservoirs are significant carbon sinks [15,16], leading to recommendations that current models that simulate terrestrial carbon budgets be revised to include inland water systems [17]. Although much of the terrestrial DOC is respired to CO2 through bacterial processes [18] or UV degradation [19], some refractory compounds manage to sink to the bottom of lakes and are sequestered in the sediment [20].
To determine if terrestrial carbon sequestration in aquatic sediments is large enough to be significant to the forest carbon cycle, measurements must be obtained. Techniques used to assess terrestrial carbon in lake sediment include measurement of total carbon and nitrogen coupled with their stable isotope ratios, charcoal markers [21], and the identification of organic compounds from different organic matter (OM) sources, derived using time-consuming gas chromatography/mass spectrometry (GC-MS) [22], liquid chromatography [23], or liquid chromatography/mass spectrometry (LC-MS) techniques [18]. Tolu et al. [24], however, developed a pyrolysis-based (py) method for introducing samples into a GC-MS (pyGC-MS) that requires minimal sample preparation and uses very small sample sizes, enabling precise quantification of known compounds, including markers indicative of terrestrial or algal origins. Subsequently, the method was used to examine temporal changes in organic matter in lake sediment cores from two sites in central Sweden, demonstrating differences between natural landscape development and human catchment disturbance in the past 1700 years [25].
Consequently, the objectives of this study are to (1) reconstruct past fire and erosional events within a drinking water supply area during the historic watershed development period (1910 to 2012) using sedimentary charcoal and magnetic susceptibility, with results compared to the spatial distribution of disturbances identified in an existing retrospective carbon budget model [26]; (2) use the pyGC-MS technique to assess and quantify the amount of terrestrial carbon sequestered in the sediment, as a fraction of the terrestrial carbon entering the reservoir estimated from an existing retrospective C budget which incorporated stream DOC measurements [27]; and (3) examine changes in various terrestrial C and disturbance proxies from the sediment record across both the historic development (post-1910) and pre-development (1770–1910) periods, with insights learned from the development period helping interpret the pre-development period.

Study Area

The Sooke Lake Watershed is one of three watersheds that are part of the Greater Victoria Water Supply Area. It contains the 810 ha Sooke Lake Reservoir (SLR), the main water supply for municipalities within the Capital Regional District (CRD), supplying ca. 430,000 people with high-quality drinking water (CRD, 2014) [28]. The reservoir is located within an 8595 ha protected watershed (Figure 1A) on Vancouver Island, British Columbia, Canada, and situated mostly within the very dry maritime subzone (CWHxm) of the Coastal Western Hemlock biogeoclimatic zone (CWH) (Pojar et al. 1991) [29]. Mean annual precipitation is 1640 mm, with warm dry summers, a July average air temperature of 16.7 °C, and winters generally free of extended subzero temperatures, though with snowpack at higher elevations. The forests contain Douglas-fir (Pseudotsuga menziesii (Mirb.) Franco var. menziesii), western hemlock (Tsuga heterophylla (Raf.) Sarg.), and grand fir (Abies grandis (Dougl. Ex D. Don) Lindl.), with areas of western redcedar (Thuja plicata Donn ex D. Don), red alder (Alnus rubra Bong.), and bigleaf maple (Acer macrophyllum Pursh) on richer wetter sites and shore pine (Pinus contorta var. contorta Dougl. ex Loud.) on drier rockier upland sites. Soils in the watershed developed from glacial till. They have thin surface organic–mineral horizons, are generally well drained with soil textures of gravelly to very gravelly sandy loam in the upper horizons, are weakly to moderately podzolized, and have weakly to strongly cemented indurated layers between 70 and 110 cm [30]. On the east side of the watershed duric dystric brunisols predominate at lower elevations (200–300 m), with shallow (50–100 cm) orthic dystric brunisols more prevalent at higher elevations (300–500 m). At the highest elevations at the north end (400–500 m) and steep slopes on the west side of the watershed (300–700 m), shallow (50–100 cm) orthic humo-ferric podzols predominate along with areas of duric humo-ferric podzols [31,32].
As the primary source of drinking water for southern Vancouver Island, approval for the initial development of the SLR occurred in 1910, with construction occurring between 1912 and 1915. Land around the original 370 ha Sooke Lake was cleared and a concrete dam was constructed in 1915, raising the water level by 3.7 m and expanding the lake to 450 ha. Subsequently, the water was transported to the surrounding community through a 44 km concrete aqueduct [28]. The reservoir area was again expanded several times in 1970, 1980, and 2002, reaching 610, 670, and 810 ha, respectively, with a 95 billion litre storage capacity in 2002. Thus, in over 100 yrs, approximately 625 ha of the watershed land area (7.2%) was converted by flooding for the reservoir (5.1%) and associated infrastructure (road, rail, and power; 2.1%; Figure 1A, Table 1).
In addition to these events, forested areas were clearcut and slash-burned or experienced wildfire in the early 1900s and were additionally subjected to sustained yield forestry from the 1950s to 1998. The forests are now managed strictly for water quality purposes [33]. In contrast, prior to 1910 watershed forests developed under natural disturbance regimes (i.e., both surface/low-severity and stand-initializing/high-severity fires), with stand distribution and ages recorded in the forest cover inventories (Figure 1B).

2. Methods and Data

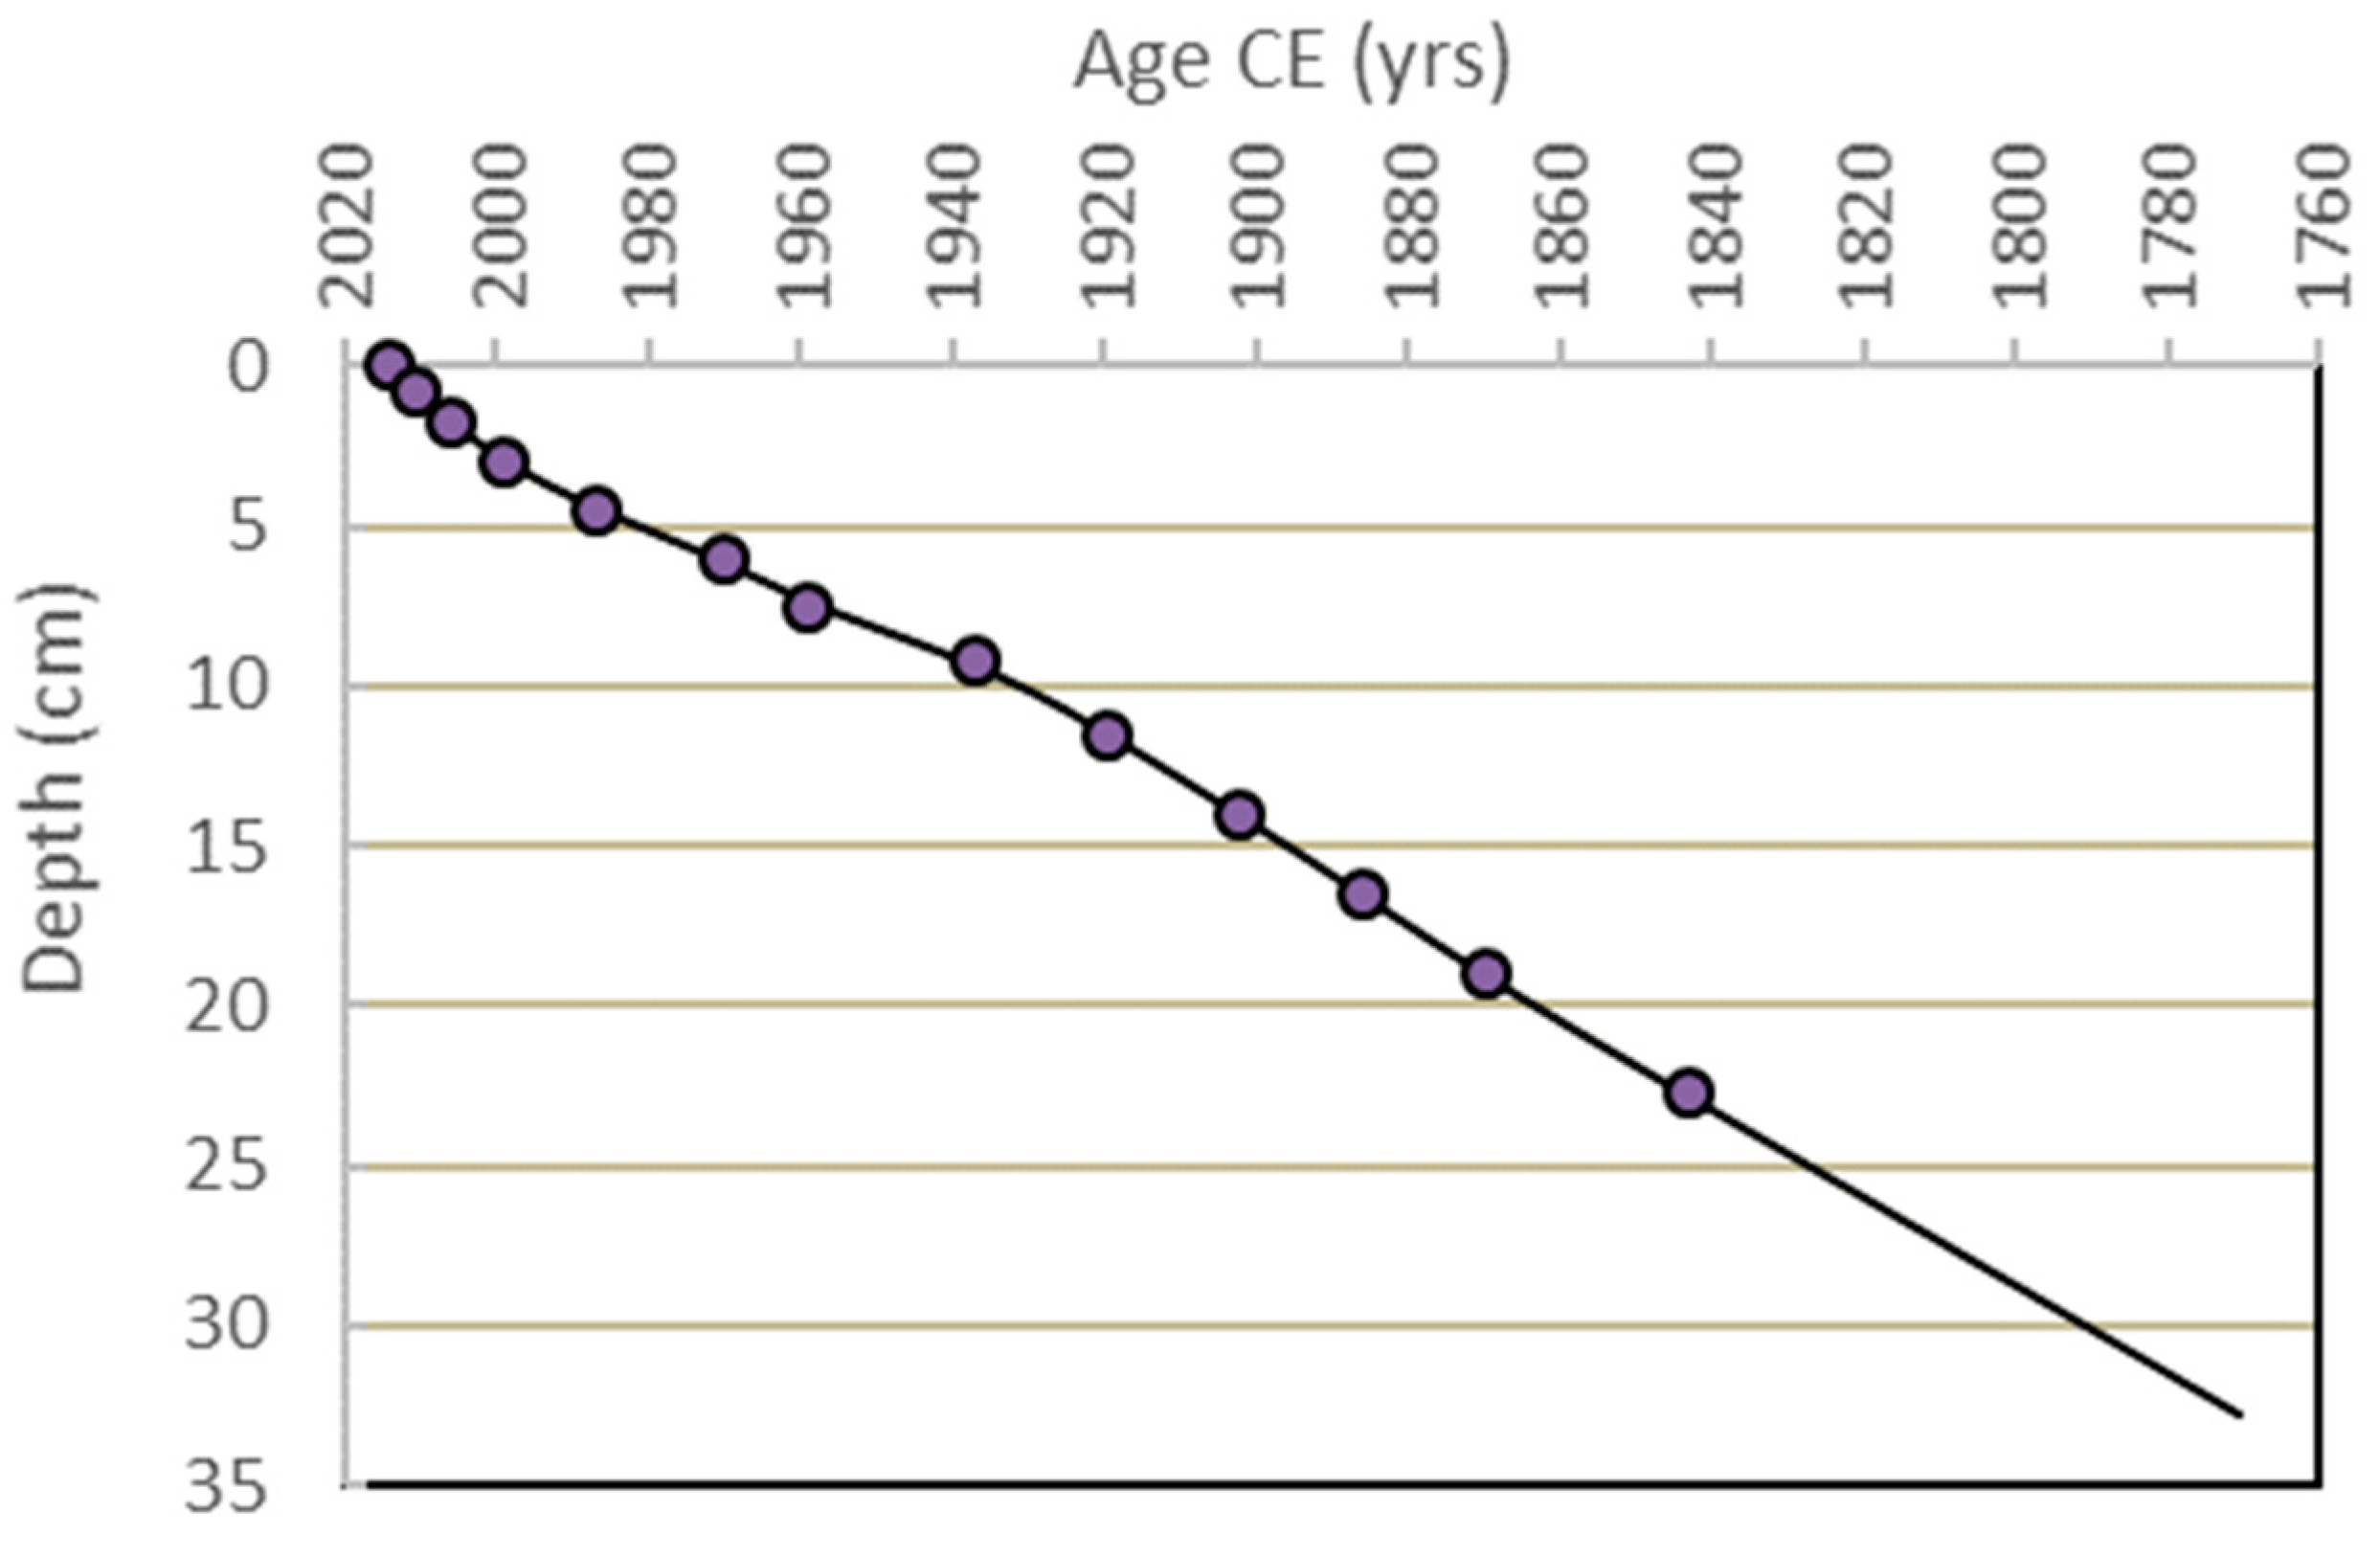
To estimate terrestrial C and signs of landscape fire and disturbances in the reservoir sediment, a sediment gravity core was collected in 2014 from the SLR North Basin (Figure 1A, 48.5649 N, 123.6915 W WGS84) in 72.5 m water. Bulk sediment samples were sent to Flett Research Ltd., Winnipeg, MB, Canada, for Pb-210 age determination. Subsequently, an age–depth model was developed using Clam 2.1 [34] by fitting a smoothing spline to the reported ages, with extrapolation beyond the oldest age (Figure 2), yielding the sediment vertical accretion rate (cm yr−1).
The core was subsampled at 0.5 cm resolution and the wet sediment stored in a refrigerator at 4 °C prior to analysis. Magnetic susceptibility (MS) was measured on the bulk samples using a MS3 meter with an MS2E core logging sensor, sourced from Bartington Instruments, Witney, UK. Bulk density was determined from 1.0 cm3 subsamples that were weighed, oven-dried at 70 °C for 72 h, and dry weighed. For charcoal, 2.0 cm3 subsamples were taken and rinsed through a 150 µm sieve with distilled water. Sieved samples were placed on a gridded Petri dish and examined under a Leica MZ7 dissecting microscope, obtained from Leica Microsystems, Wetzlar, Germany. Charcoal fragments were identified based on colour and structural features (i.e., black, opaque, exhibiting cellular structure) [35]. The area of each charcoal fragment was also measured using Scion Image Capturing Software Version 4.0, Scion Corporation, Frederick, MD, USA. Charcoal fragments (fragments cm−2 yr−1) and area flux (mm2 cm−2 yr−1) were determined by multiplying charcoal fragments and area (fragments cm−3 and mm2 cm−3, respectively) by the vertical accretion rate.
For the chemical characterization of sediment, wet subsamples were oven-dried at 40 °C for 4–7 days and then ground to a fine consistency using a mortar and pestle. To evaluate the relative inputs of carbon from terrestrial and algal OM sources to the aquatic sediment, carbon/nitrogen (C/N) ratios and carbon isotope and nitrogen isotope ratios were examined [18]. Total carbon and nitrogen were established using 10–20 mg samples and a Costech CN elemental analyzer (Costech Analytical Technologies Inc.,Valencia, CA, USA). Final %C and %N were determined for sample mass using a moisture correction factor (105 °C oven-dry mass/wet mass) after oven drying at 105 °C. Total carbon and nitrogen flux (g cm−2 yr−1) were determined by multiplying C and N volumetric concentrations by the vertical mass accumulation rate. Sample carbon and nitrogen isotope ratios were determined using a Delta V Advantage IRMSequipped with a Flash 2000 Organic Elemental Analyzer (Thermo Fisher Scientific, Bremen, Germany) for sample introduction, with enough sediment weighed to ensure that a minimum of 50 μg of nitrogen was present in each sample. The instrumental methods and settings are described in Appendix A.1.
To better distinguish between the two possible OM sources, samples were analyzed on a 7890A GC system with 5975C inert MSD with a Triple-Axis Detector (Agilent Technologies, Santa Clara, CA, USA) and equipped with an EGA/PY-3030D Multi-Shot Pyrolyzer (Frontier Laboratories Ltd., Fukushima, Japan) for sample introduction. After pyrolysis, gas enters the GC column, with individual components exiting at different times. Once these components enter the mass spectrometer, a final spectrum is created based on the mass-to-charge ratio, which can be used for identification along with the GC retention time [36,37]. Raw data were exported to AMDIS (v2.72) for deconvolution and compounds were identified using the NIST 2.2 search tool with the NIST 14 library. For reference, the pyGC-MS conditions are described in [24], which also includes a list of compounds of terrestrial and algal origin. Note that detailed instrumental methods, settings, and data processing are described in Appendix A.2.
As an example, an annotated spectral output signal for a sample from 20 cm depth (Figure 3) shows peaks for the known terrestrial (Tm) and algal (Am) marker compounds, together with other known and unknown compounds. The integrated signal count for each compound was used for further analysis. Terrestrial C concentration was calculated using the integrated signal counts for either all 8 Tm (Tm8) and 3 Am markers or the integrated signal counts normalized for 3 Tm markers using the mean of the integrated counts for all 56 combinations of the 8 choose 3 Tm markers (Tm8c3). Tm C concentrations were calculated using the proportion of Tm counts to Tm + Am counts and the total C volumetric concentration (Equation (1) or Equation (2)). Am C concentrations were calculated from the proportion of Am counts and total C volumetric concentration (Equation (3) or Equation (4)).
Tm8 g C cm−3 = (∑Tm8 counts/(∑Tm8 + ∑Am3 counts)) × Total g C cm−3
Tm8c3 g C cm−3 = (∑Tm8c3 counts/(∑Tm8c3 + ∑Am3 counts)) × Total g C cm−3
Am3 g C cm−3 = (1 − proportion Tm8 counts) × Total g C cm−3
Am8c3 g C cm−3 = (1 − proportion Tm8c3 counts) × Total g C cm−3
Terrestrial and algal carbon flux (g cm−2 yr−1) were determined by multiplying C volumetric concentrations by the vertical mass accumulation rate.
As proxies for fire disturbance and erosion, charcoal fragments and area flux, together with magnetic susceptibility, were used to track disturbances during the historic development period. In particular, increases in these proxies were compared against the timing and locations of known disturbances (Figure 1A, Table 1) documented in the retrospective carbon budget’s forest cover and disturbance geodatabase [26]. Precipitation data from the Sooke Dam weather station from 1914 to 2013 were summarized and analyzed for extreme precipitation events that might have affected charcoal and magnetic susceptibility records. To assess if wind influenced charcoal transport, local Sooke Dam (South Basin), Rithet (North Basin), and 4RW6 (western ridge) 1996–2013 and regional (Victoria Airport) 1953–2014 wind direction and speed data were obtained and summarized. For the pre-development period, forest disturbance years were estimated using stand establishment ages binned into decadal classes, an appropriate resolution given an expected ca. 5-year regeneration delay for natural stands and the error associated with broad forest cover map age classes (Figure 1B).
Following compilation of the proxy indicators preserved in the entire sediment core, the data were standardized and collectively zoned using stratigraphically constrained cluster analyses (CONISS) [38]. Since charcoal fragment flux was included in the CONISS zonation, charcoal area was excluded to avoid overweighting the influence of charcoal in zone partitioning. Similarly, fire events were also excluded since in the pre-development period they are binned and represent the estimated year of stand establishment.

3. Results

The sediment core is 33 cm long and according to the age–depth model spans approximately 244 years (Figure 2), with the top 12.5 cm representing the historic watershed development period from 1911 to 2014 and the lower 20.5 cm spanning the pre-development period from 1770 to 1910.

3.1. Historic Development Period

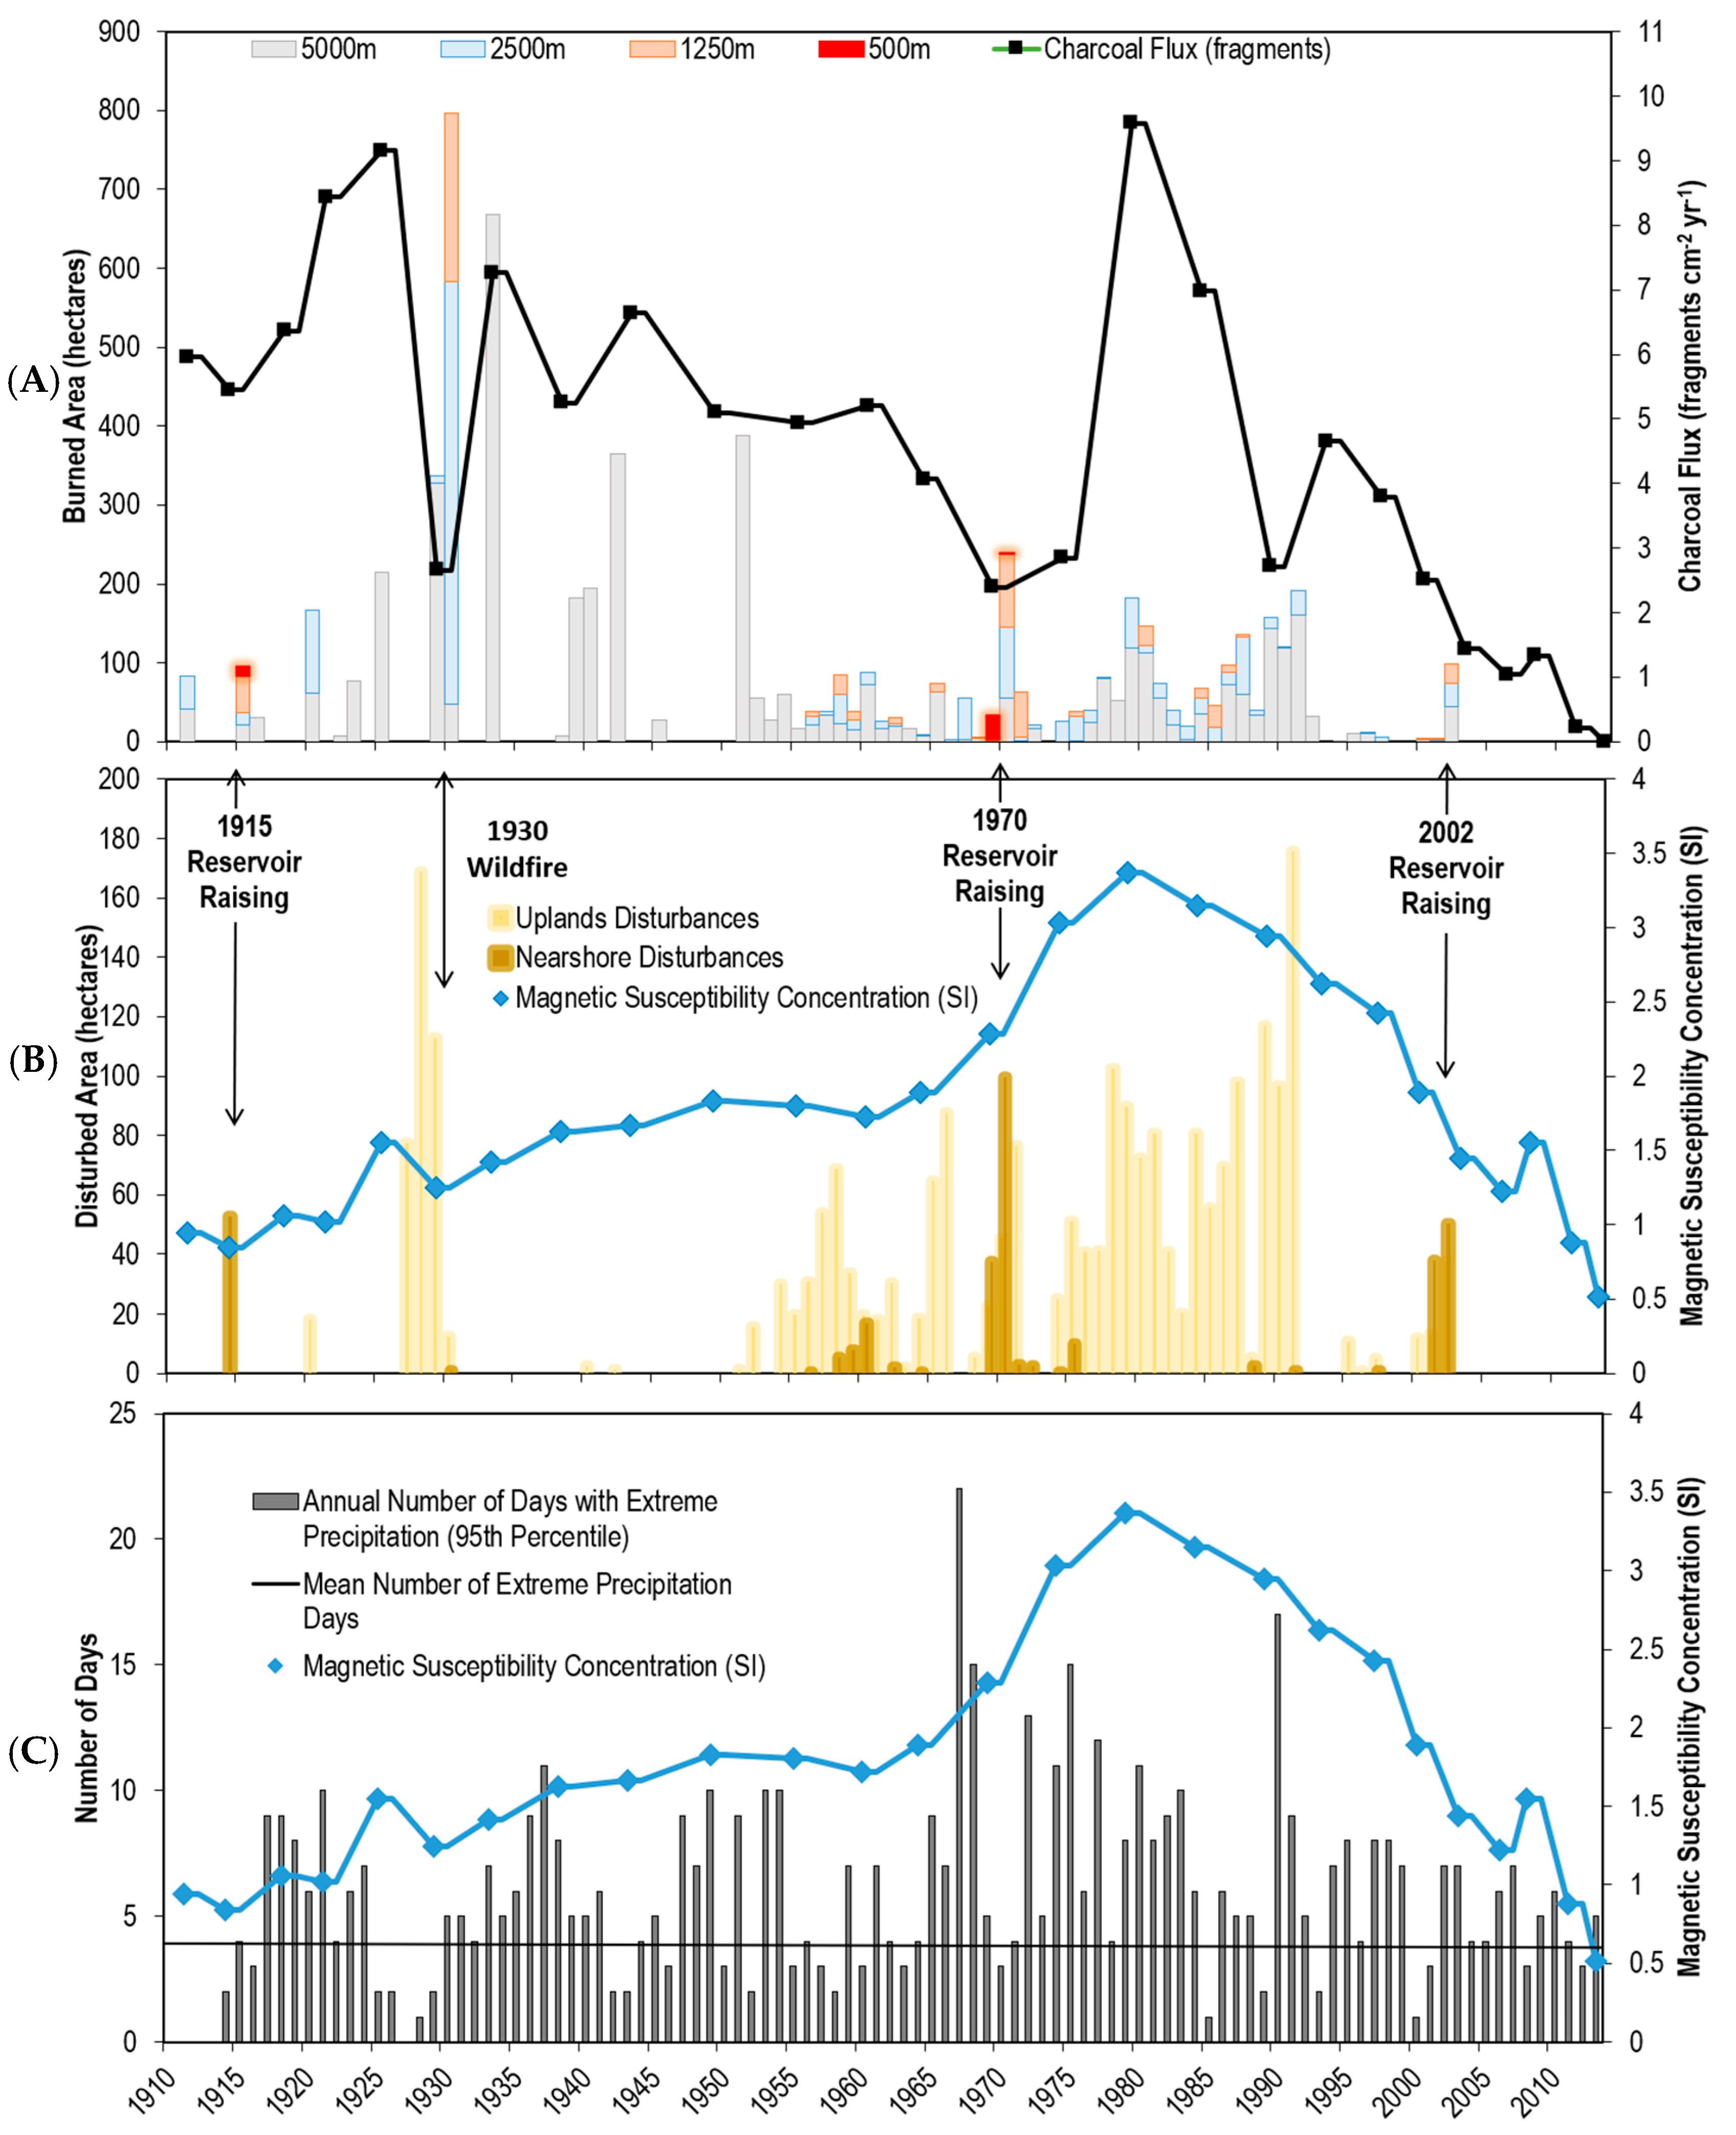
During the historic period, concurrent increases in charcoal count and area flux are evident during the 1920s, mid-1930s, 1980s, and 2000s. Notably, these occur approximately 5–10 years after nearby fire events within 2500 m or less from the coring location (Figure 4A), with the exception of the 1930 wildfire event which burned on the southeast shore of the reservoir (Figure 1A).
Similarly, magnetic susceptibility exhibits peaks ca. 10 years after nearshore clearing for reservoir expansion, as opposed to erosion in upland catchments (Figure 4B), with the largest peak occurring after the 1970 reservoir expansion. In addition to reservoir expansion, other factors like extreme precipitation can also influence the magnetic susceptibility signal by triggering runoff and soil erosion, which can mobilize and transport a suite of materials, including magnetic or iron-bearing minerals, into the basin. However, this effect appears to be weaker compared to reservoir raising (Figure 4C). In contrast, examination of the wind data found no effect, and they were not used for subsequent analyses.
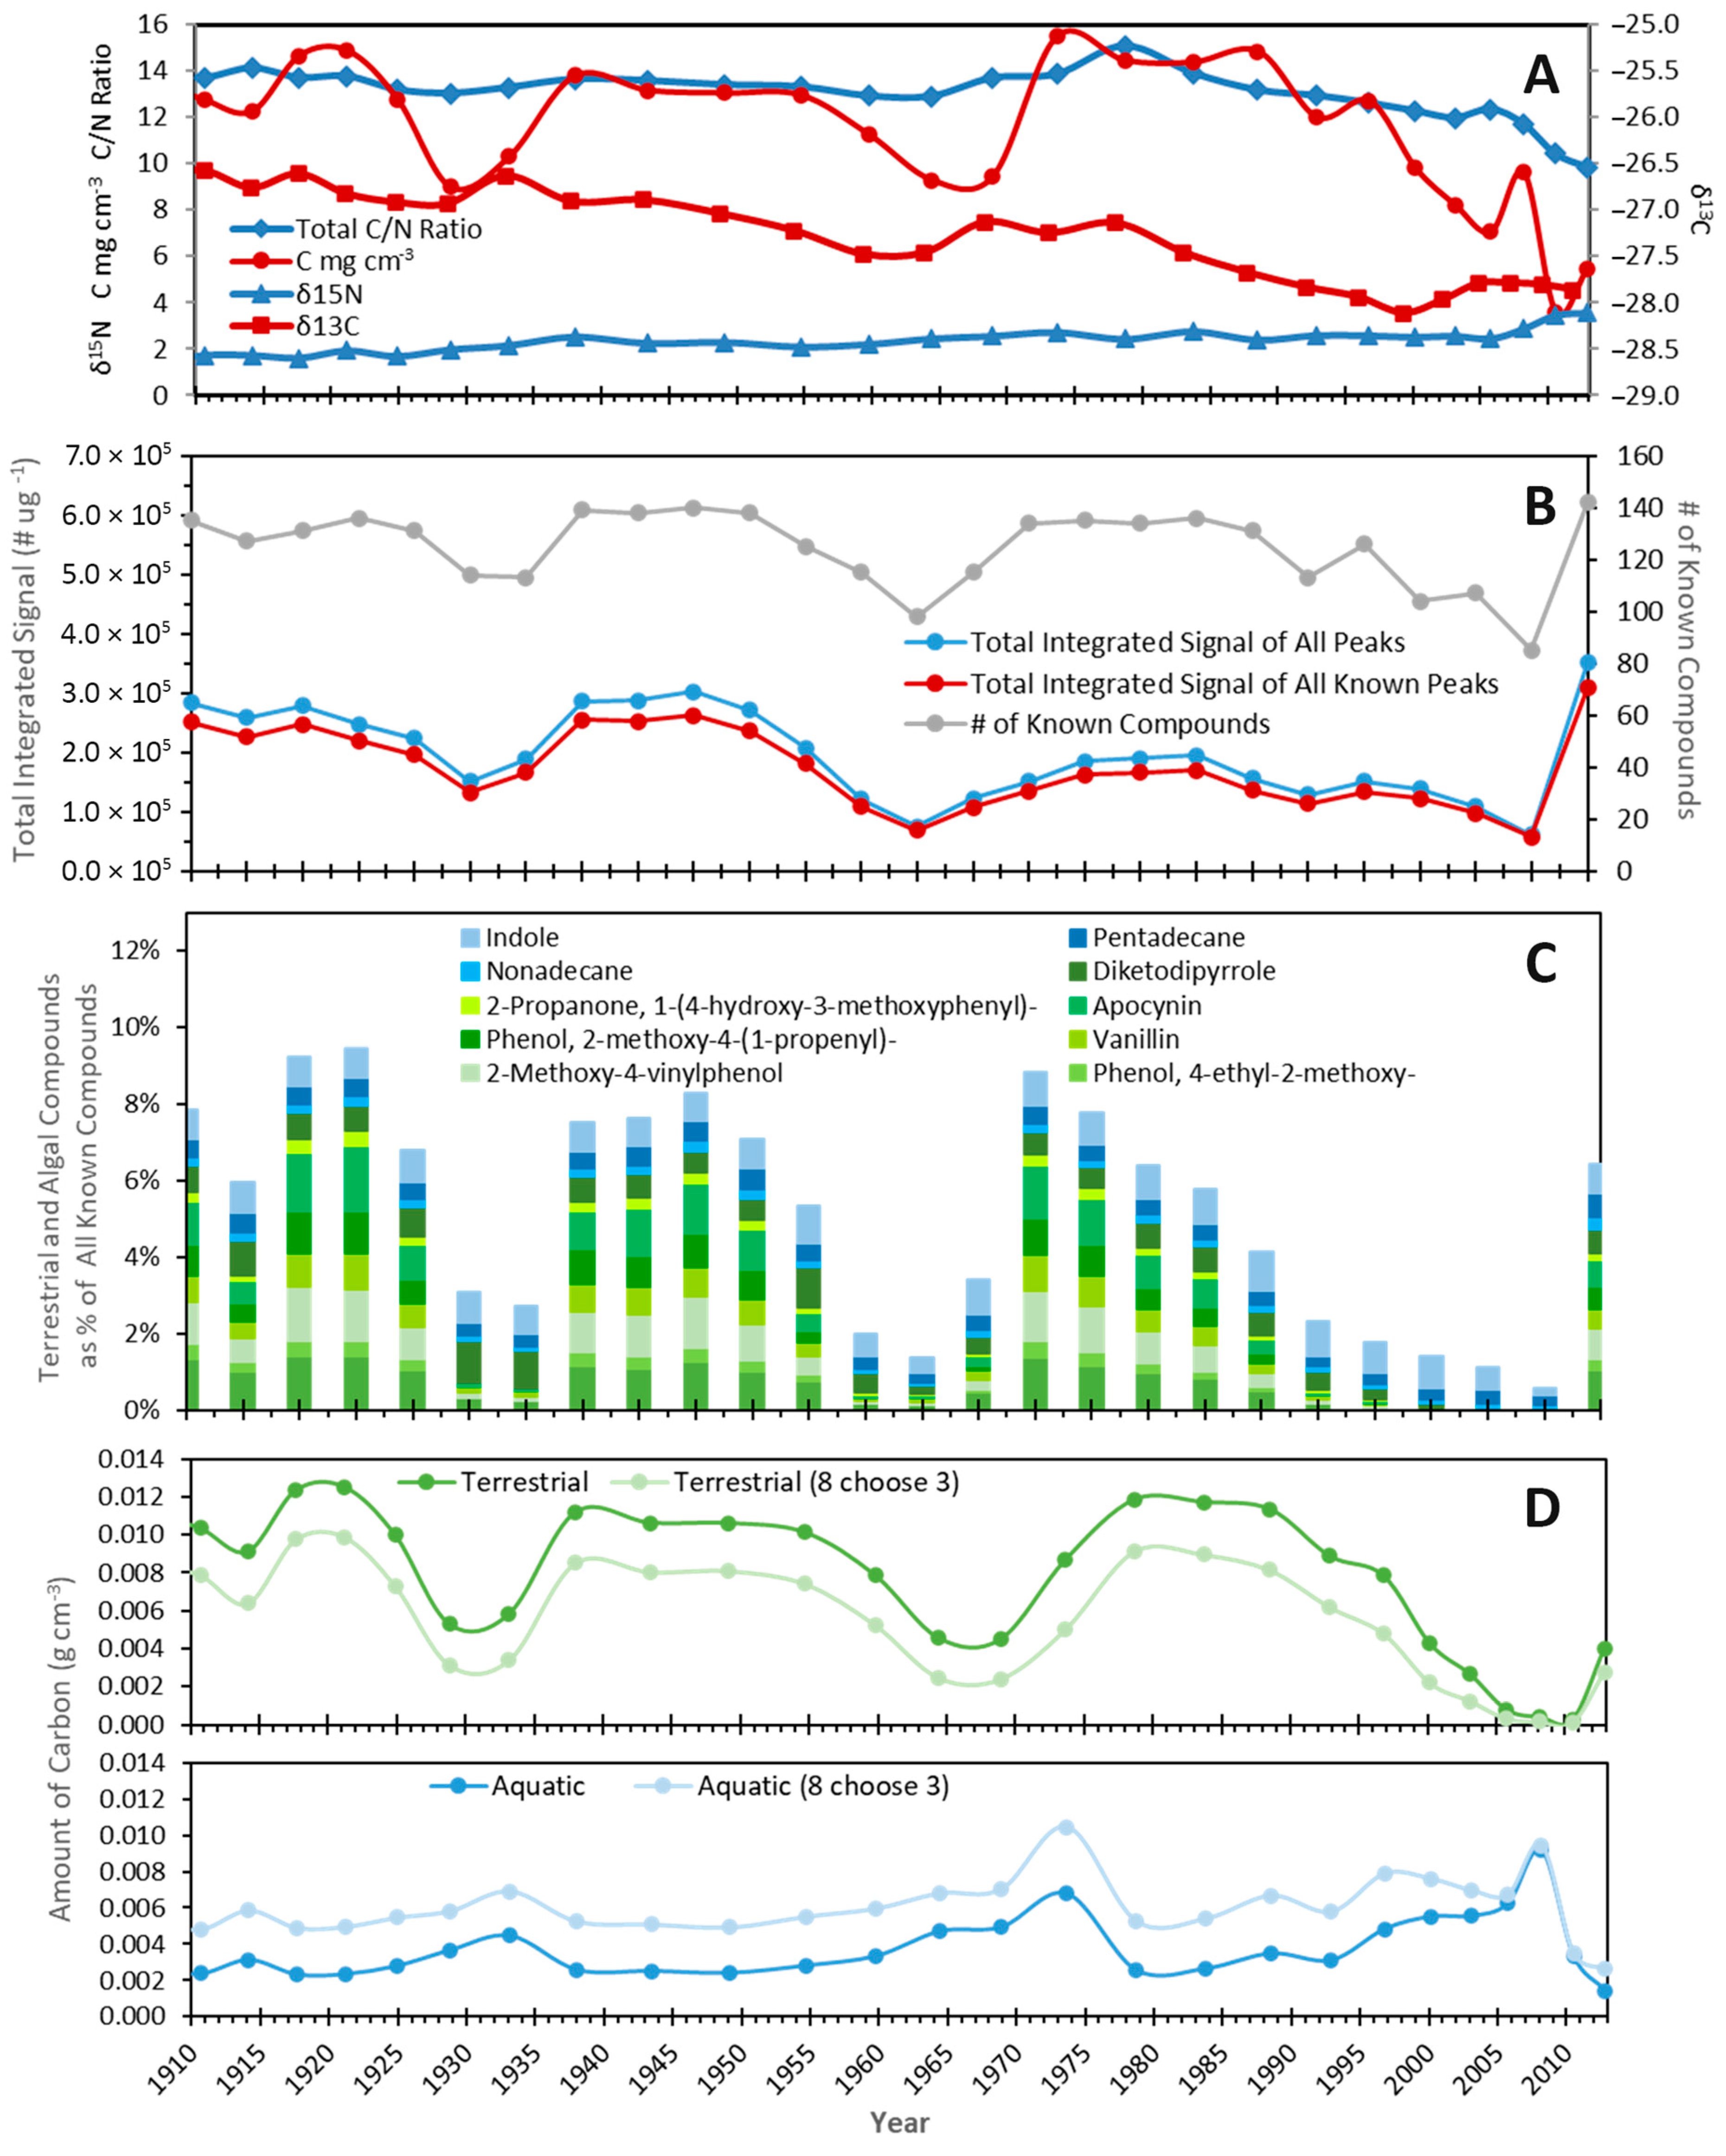
Carbon isotope ratio (δ13C/12C; δ13C ‰ relative to the VPDB standard) and total C volumetric concentration (g C cm−3) declined from 1910 to 2014, though the latter was more variable, with two notable dips preceding a marked decline starting in 1970. C/N ratios were generally level before 1960, peaking in the 1970s and declining thereafter (Figure 5A).
In contrast, the nitrogen isotope ratio (δ 15N/14N; δ15N ‰ relative to atmospheric N2) increased gradually throughout the historic period. In contrast, the number of known compounds (127 of 213 peaks) and integrated signal counts of known or all compounds determined by pyGC-MS showed no trend from 1910 to 2014, though with dips in the 1930s, 1960–70, and 1995–2000 and a recent increase from 2010 to 2013 (Figure 5B). Furthermore, a total of eight terrestrial and three algal markers were found, accounting for up to 6% of the integrated signal knowns, with the variation from 1910 to 2014 like that for the integrated signal for all known peaks (Figure 5C).
The variation in terrestrial C was like that of total C, with two dips prior to an overall decline after 1985. Algal C was initially from 50% (Am8c3 vs. Tm8c3) to 20% (Am3 vs. Tm8) that of terrestrial C and gradually increased from 1910 to 2005. While it exhibited little variation, small peaks are noted following the observed dips in terrestrial C and after 2000, where algal C was equal to (Am3 vs. Tm8) or greater than terrestrial C (Am8c3 vs. Tm8c3; Figure 5D).

3.2. Watershed Evolution 1770–2014

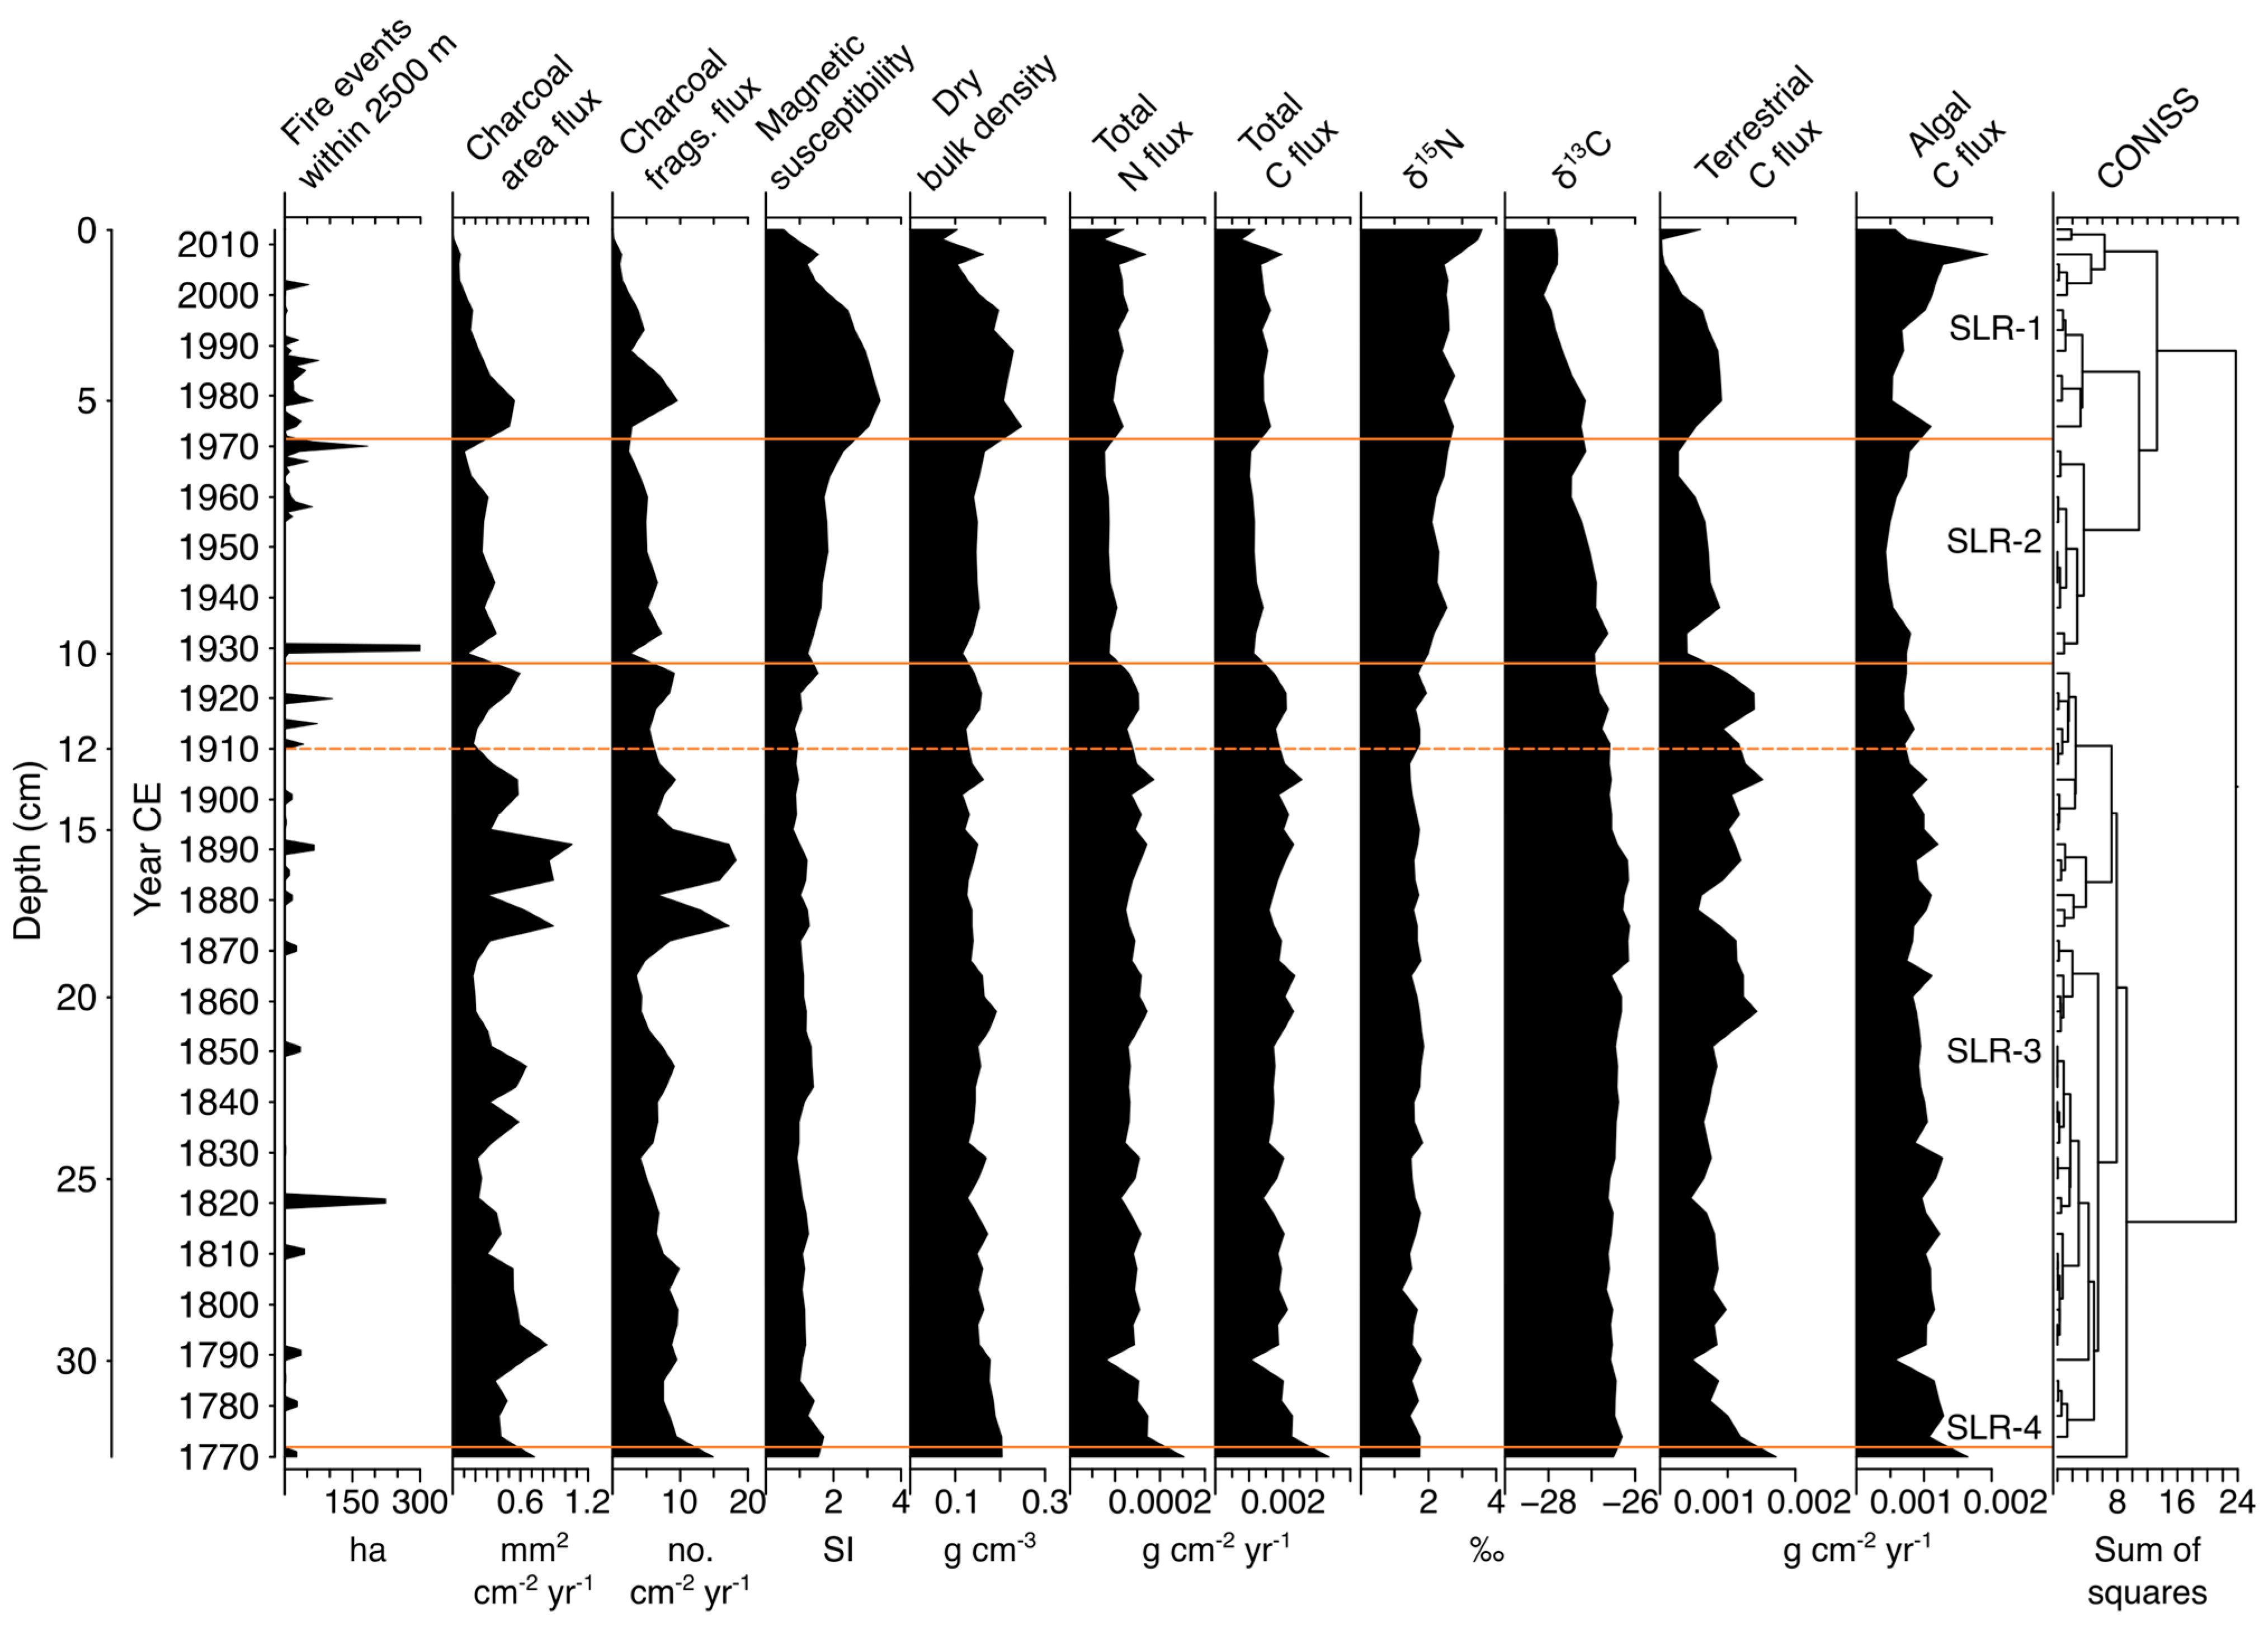
The SLR sediment core spans an interval longer (244 years) than the watershed development period, with four stratigraphic zones (SLR-1 to SLR-4) identified (Figure 6). Zones SLR-1 and 2 generally correspond to the development period, whereas SLR-3 and 4 precede the development period. Dry bulk density ranged from 0.10535 to 0.2019 g cm−3 and magnetic susceptibility ranged from 0.514 to 1.553 SI along the length of the core.
These proxies were highly correlated (R2 = 0.8, p = 0.0009), with both exhibiting maximum values between 1970 and 1990. SLR-1 (2014–1972) contains elevated magnetics (highest in the record) and charcoal from the 1970 reservoir expansion. SLR-2 (1972–1927) begins after charcoal and magnetic peaks from the 1915 reservoir expansion, after which N, C, algal and terrestrial C fluxes, and δ13C decline, while δ15N increases. The number and magnitude of fire events within 2500 m of the coring location were greater in post- than pre-1910 periods. In SLR-3 (1927–1772), other than charcoal and terrestrial C fluxes, most proxies exhibit little variation. Two large charcoal peaks from 1870 to 1890 likely reflect fire events within 2500 m of the reservoir. Terrestrial C fluxes from 1780 to 1840 show little variation and were lower than algal C fluxes. From 1840 to 1910 terrestrial C fluxes increase and are more variable, with a noticeable dip in 1880 corresponding to a dip in charcoal fluxes. SLR-4, represented by the 1770 sample, occurs as all fluxes, bulk density, and magnetics proxies decline through to 1778. This may reflect the aftermath of large fires ca. 1760 (Figure 1B) that burned 307 ha within 2500 m and an additional 860 ha within 5000 m of the core location.

4. Discussion

4.1. Development Period 1911–2014

The charcoal and magnetic susceptibility profiles document post-1910 fire and erosional events within the watershed, though with caveats. Together, they reveal that during the development period, fires were associated with forest clearing and local-scale residue burning immediately prior to reservoir expansion in 1915, 1970, and 2002, generating shoreline erosion. Subsequently, as water levels rose, charcoal previously deposited in the foreshore environment was washed into the reservoir. Thus, the 10-year lag between the timing of the events and the signal age is not surprising, likely reflecting taphonomic processes such as sediment and charcoal transport and focusing. Indeed, a similar depositional lag was noted following wildfires in Yellowstone National Park (YNP), estimated at about 5 yrs in moderate to relatively small lakes [39]. In that instance, charcoal that was aerially deposited on the lake surface during the fire event was subsequently blown from offshore to the littoral zone and in subsequent years resuspended and redeposited into deeper water sediment, creating a stratigraphic charcoal-based signal of fire. It is conceivable that the lag at SLR is longer because the lake is larger and deeper compared to those studied at YNP, requiring more time for the charcoal to accumulate in deeper water sediments. In addition to documenting discrete fire and reservoir raising events, the record also captures a general upward trend in magnetic susceptibility since 1910, likely reflecting increasing erosion resulting from intensifying developmental activity within both nearshore and upland areas. This is particularly apparent from ca. 1960 to 2000 as upland disturbances increased markedly, augmented further by elevated precipitation.
Regarding relative inputs of carbon from terrestrial and algal OM sources to the aquatic sediment, increases in C/N and δ13C suggest an increase in terrestrial OM inputs since terrestrial plants generally have more carbon than algal plants due to the presence of cellulose. Moreover, variations in δ13C are due to the preferential incorporation of 12C or 13C during photosynthesis, such that δ13C in C3 land plant detritus is relatively constant at −28 ‰ while δ13C in freshwater lotic algae ranges from −47 to −12‰ [18,40]. While δ13C values gradually decreased from 1910 to 2012, C/N ratios were generally level from 1910 to 1970, decreasing thereafter (Figure 5). Given this variability, coupled with the fact the observed changes were relatively minor, the changes could not be confidently used to assess how much terrestrial C was entering the sediment. In contrast, δ15N was above 0 for the 1910–2010 interval, indicative of 15N-enriched allochthonous organic matter inputs from the watershed [41]. Overall, δ15N values begin to increase slightly around 1930, followed by a more abrupt increase after 2005. It is important to note, however, that another potential reason for having δ15N values > 0 could be that plankton were utilizing nitrate (NO3) and/or ammonium (NH4+) in the water, as opposed to cyanobacterial uptake through N-fixation, though data are lacking to test for this [42]. The increase in δ15N after 2005 corresponds with an abrupt decrease in C/N, indicating inputs of organic matter with higher N concentrations. Regarding total volumetric C concentration, the dip in 1930 is associated with a nearshore fire whereas the dip in 1965 corresponds with the onset of harvest and burn events (Figure 5). In contrast, the general decline after 1990 is associated with the decline in charcoal and magnetics.

Modelled Terrestrial DOC Exports and Sediment C Accumulations 1911–2012

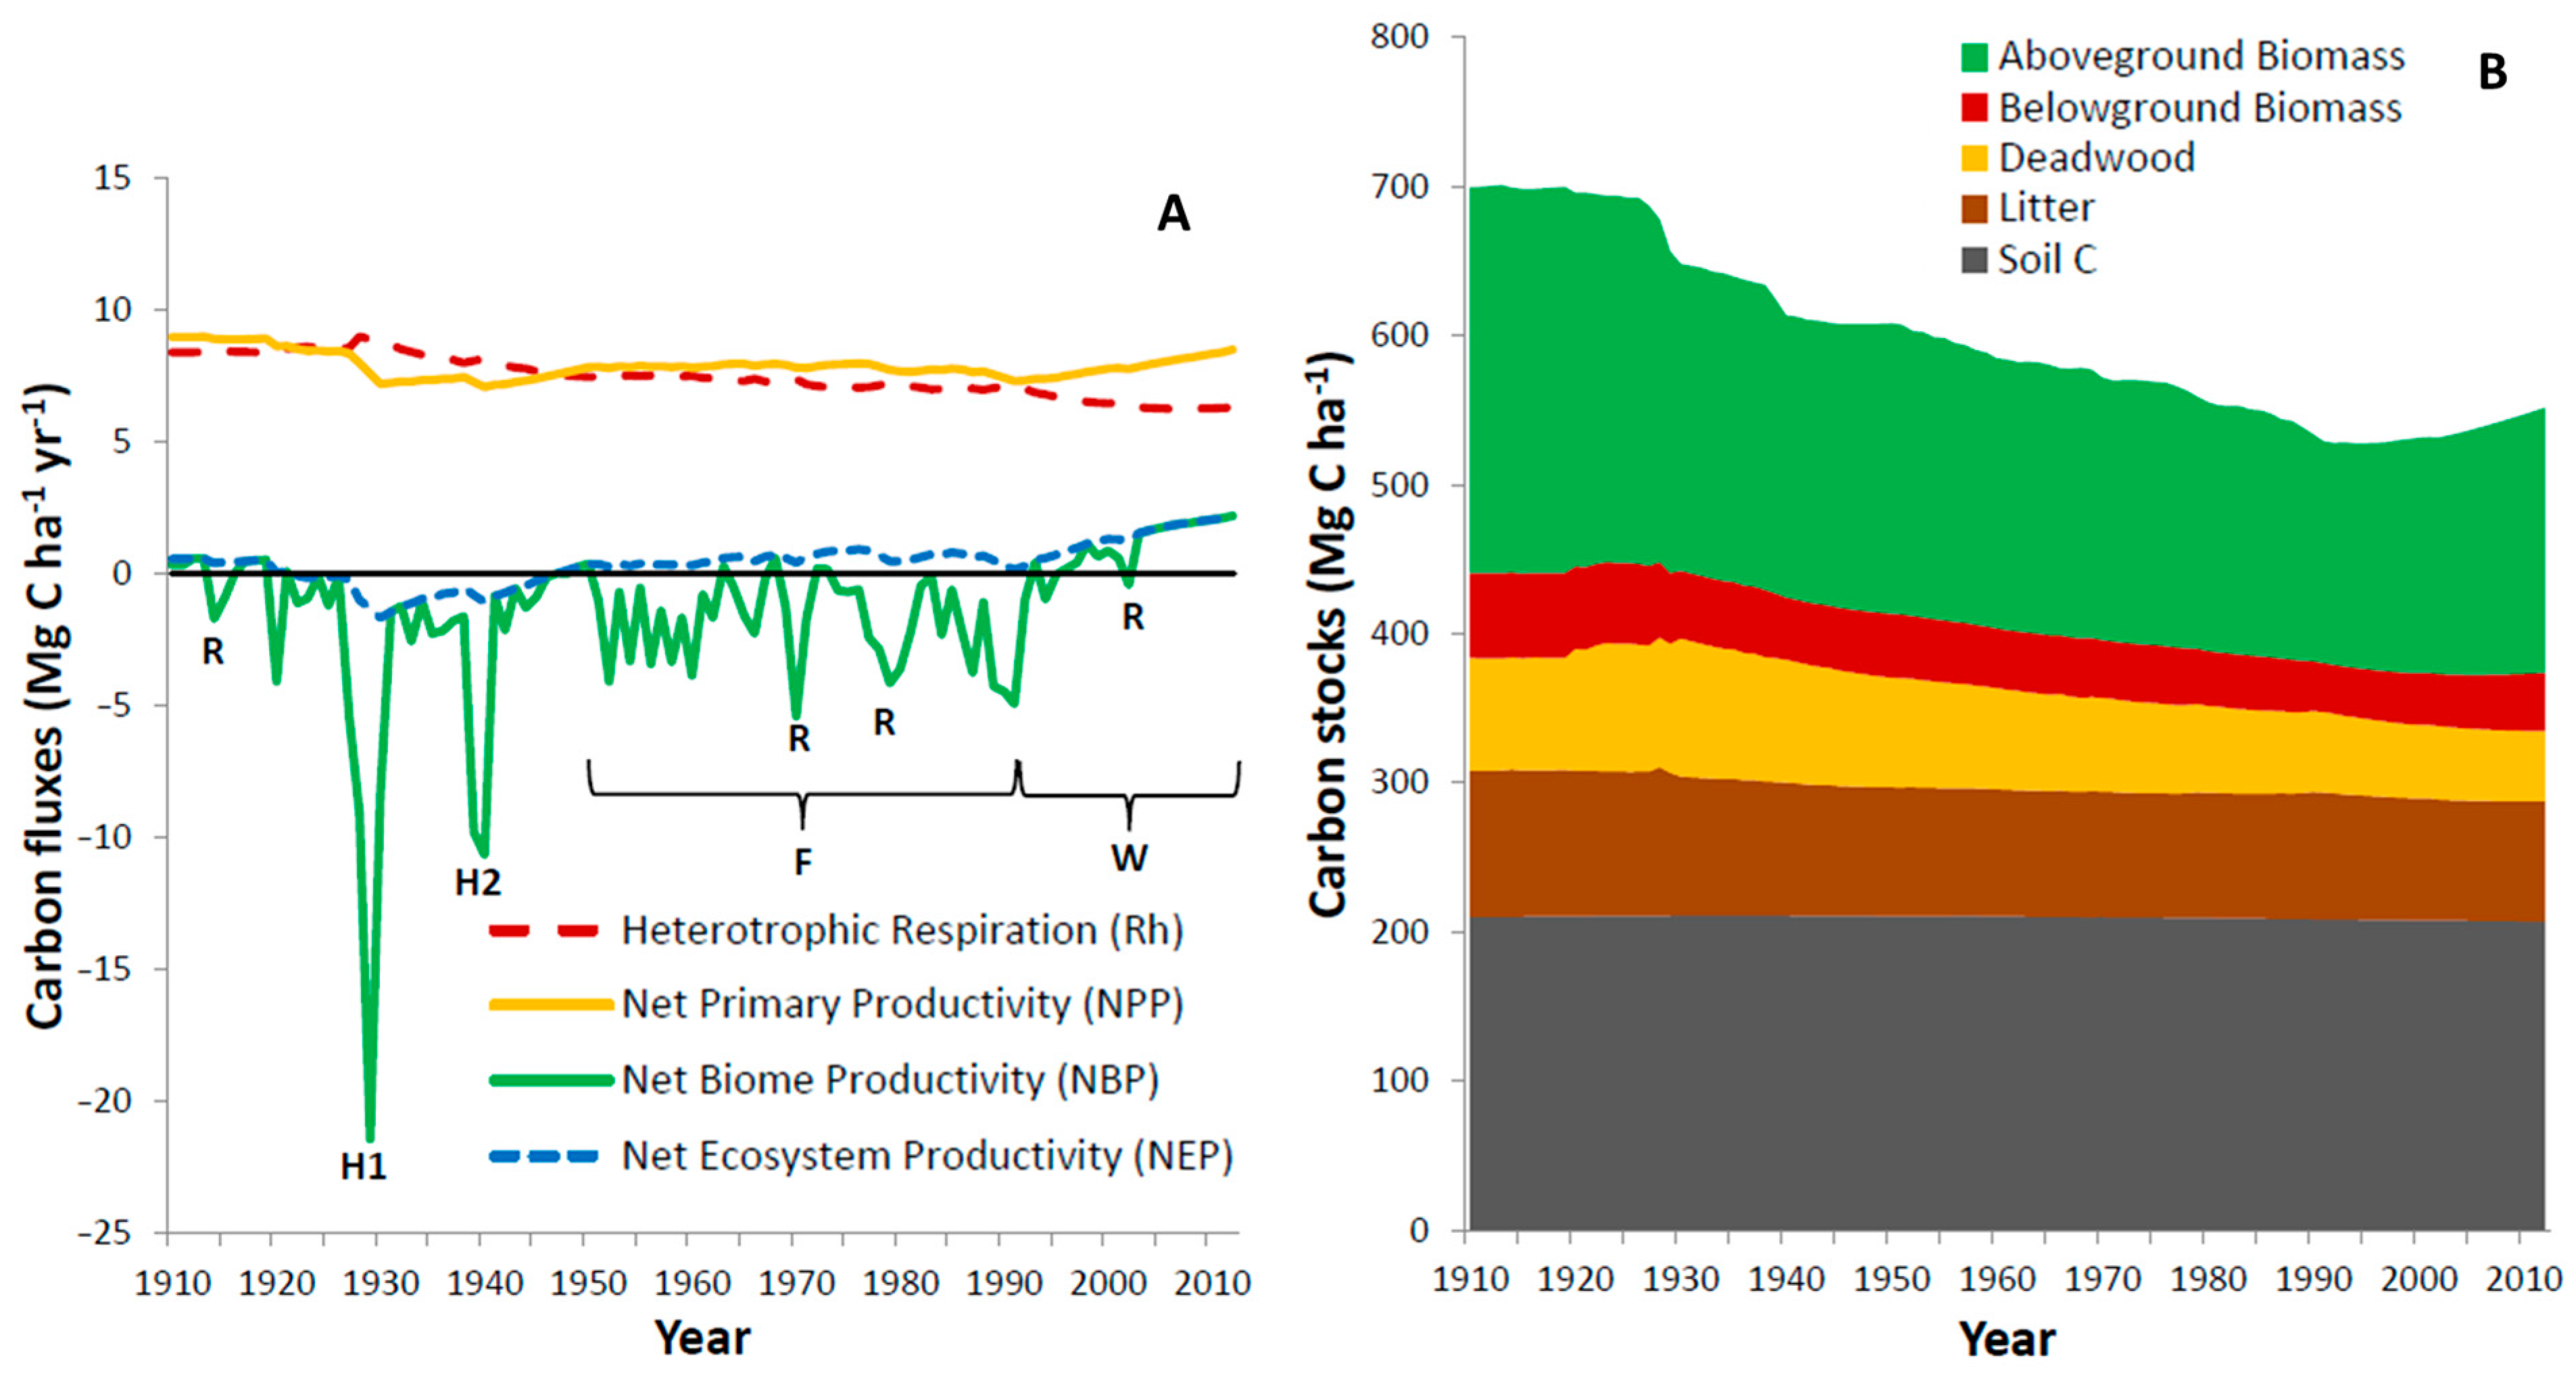
Given the high value placed on the SLR watershed due to the provision of drinking water, the CRD defined a strategic goal to determine the carbon budgets for their managed lands [33]. To address how natural disturbance, forest harvest, and deforestation from reservoir creation affect landscape-level carbon (C) budgets, the CBM-CFS3 [32] was used to generate a retrospective C budget for the SLR watershed from 1910 to 2012 [26] using a 300-year fire return interval for 5000-year carbon pool initiation that is required by the model. Subsequently, four paleofire records from within the water supply area showed that the late-Holocene fire return intervals were 320, 390, and 310 years in eastern and central locations compared to 1080 years in a wetter western location [43,44]. The former intervals, derived from nearby sites east, north, and west of the reservoir core location, provide validation for the fire return interval used in the model, which was 6, 23, and 3% shorter compared to the charcoal-based estimates from nearby sites. Results of the baseline model run [26] show that in 1911 the watershed was dominated by mature Douglas-fir forests with aboveground biomass C (AGB) of 262 Mg C ha−1 (Figure A1B) and net biome production (NBP) of 0.63 Mg C ha−1 yr−1 (Figure A1A), though with values becoming negative during fire, land clearing, and harvest disturbance. In response to such events, AGB and dead biomass C (dead wood, litter, soil C) declined through 1998. Watershed management policy changed in the early 1990s to more strictly protect water quality. With the ending of forest harvesting and after the last reservoir raising, NBP became positive and AGB began to increase (Figure A1A,B).
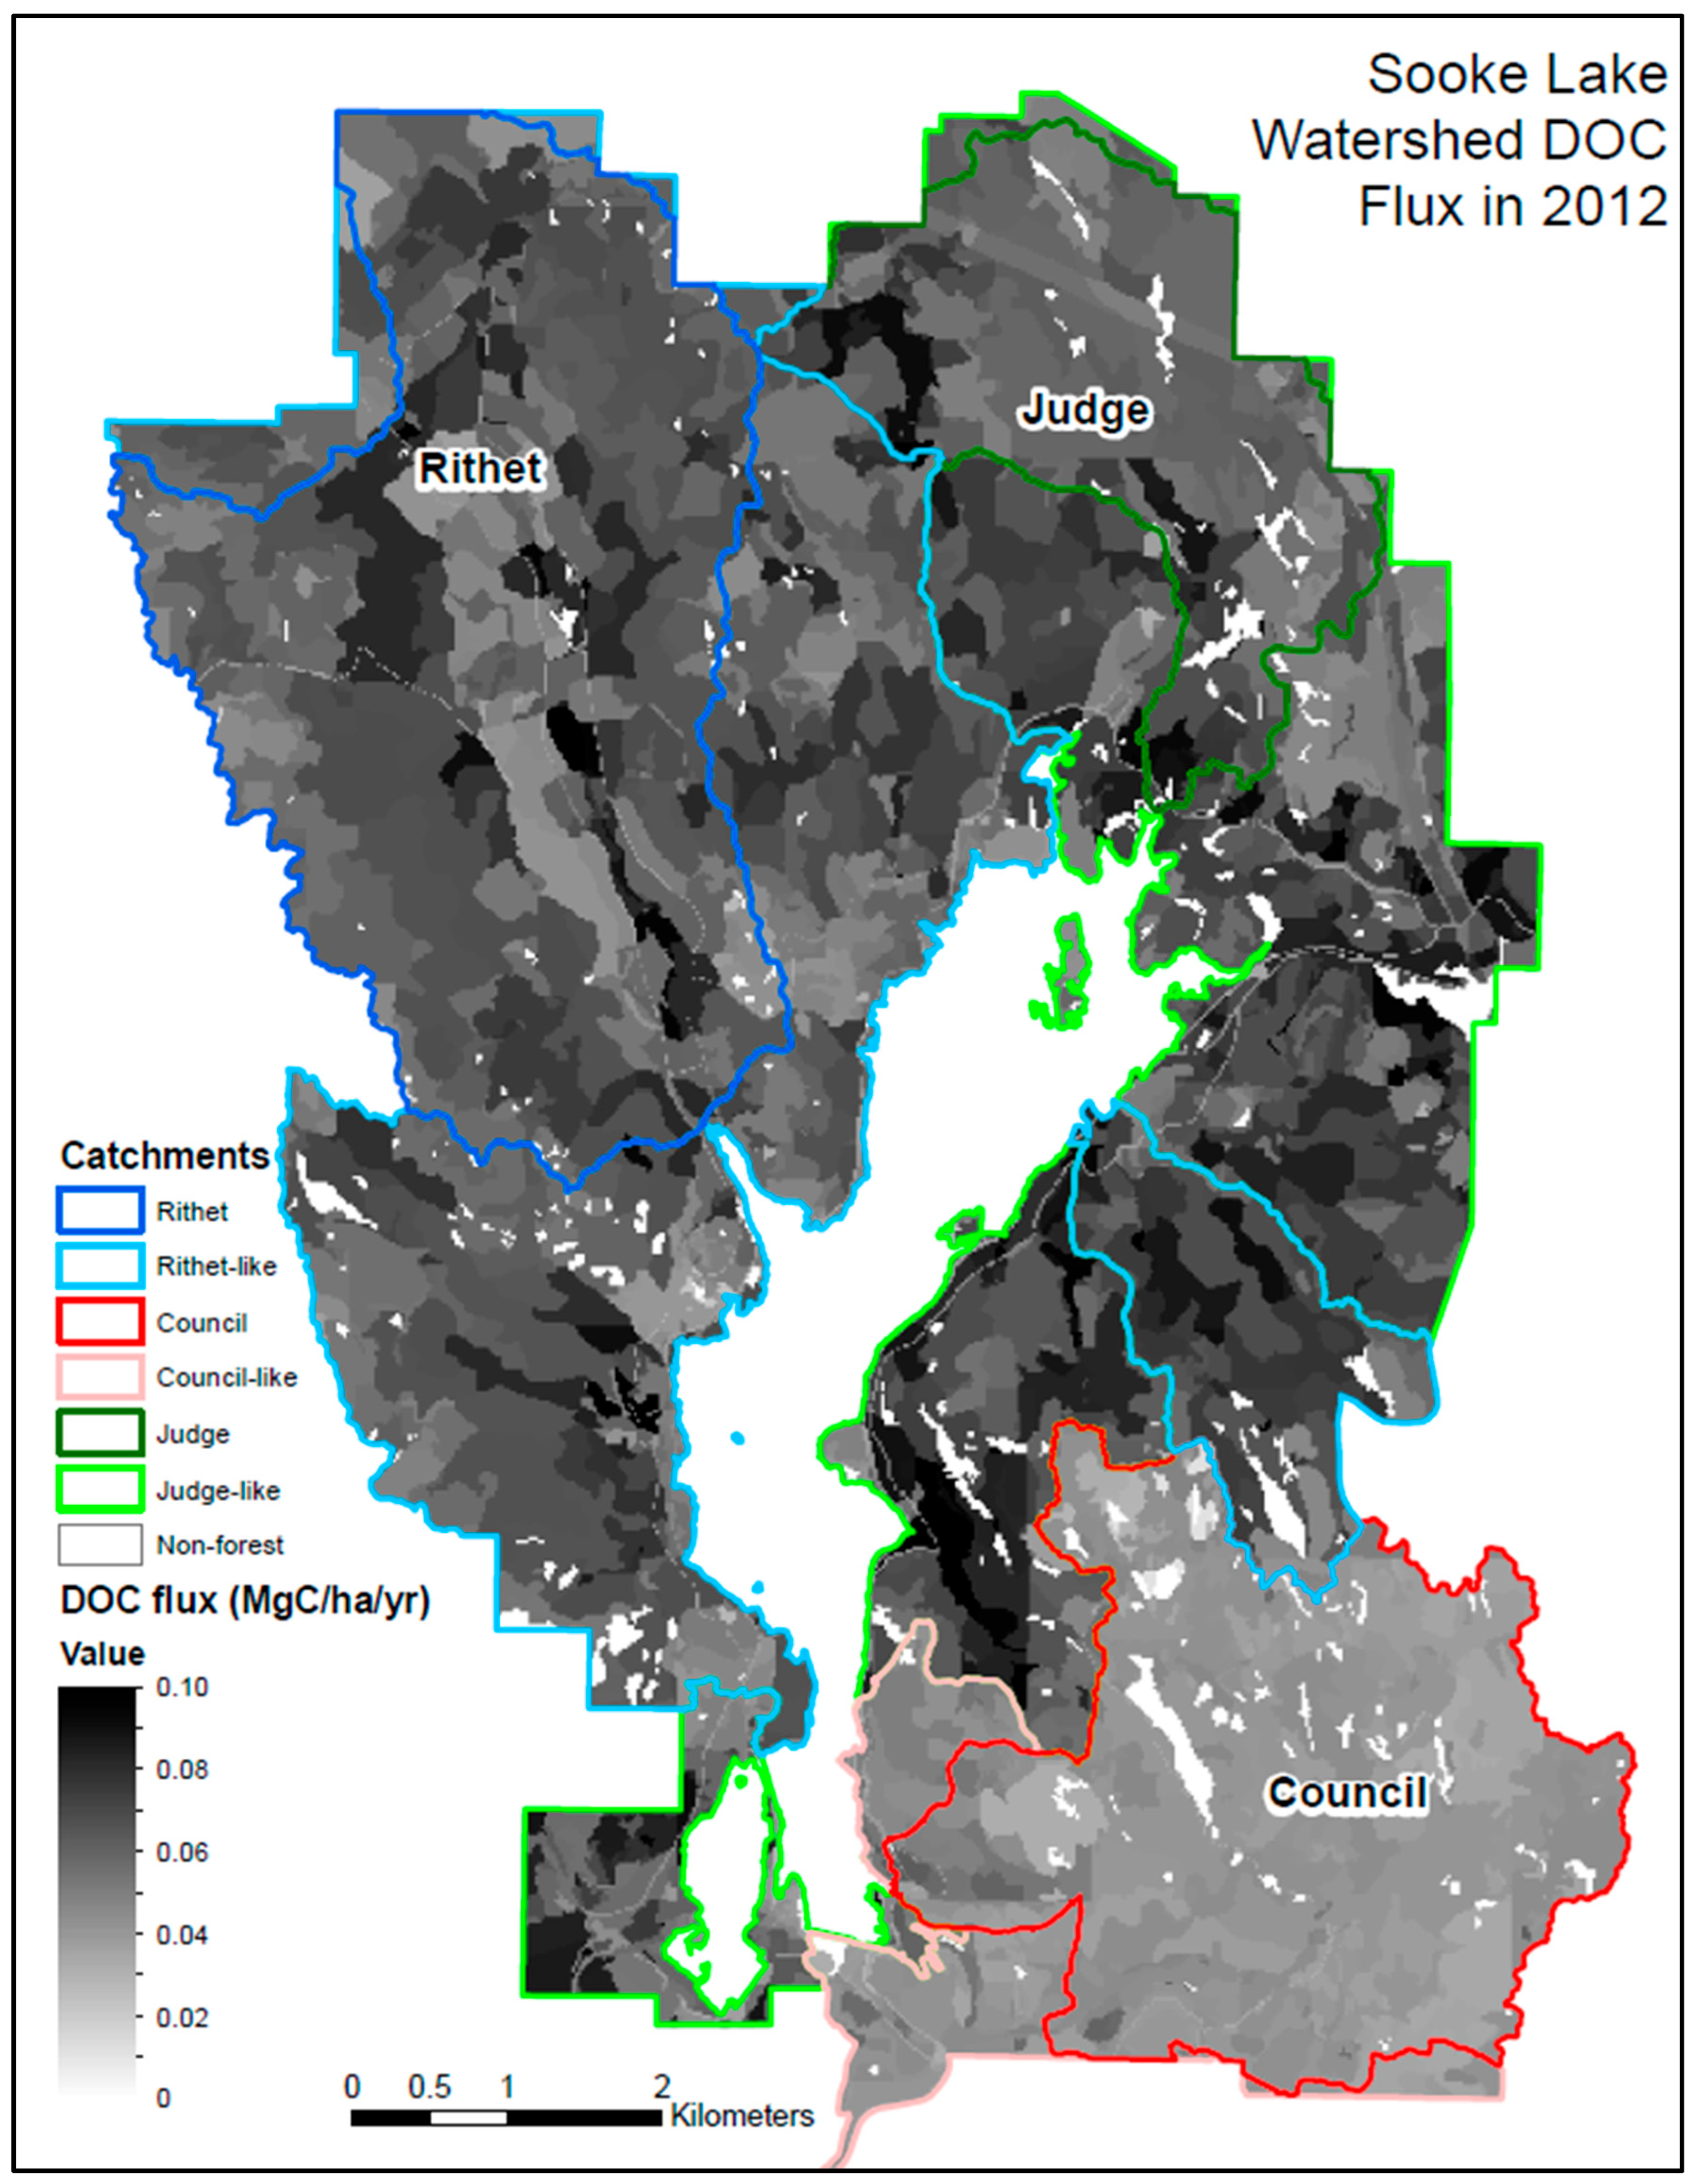
The baseline model run did not account for terrestrial C exports from the watershed to the reservoir, so a second modelling study [27] used daily stream flow and dissolved organic C [DOC] data from 1996 to 2012 for three primary catchments in the watershed (i.e., Rithet, Judge, and Council creeks) as inputs to the USGS rLOADEST program [45]. The Adjusted Maximum Likelihood Estimation (AMLE) option was used to estimate instantaneous DOC load for all observations and summed to determine the annual load. Although the annual DOC load in the three catchments varied among years, no overall trend was observed over the 16-year observation period [27]. Thus, the mean annual DOC load was used to parameterize the model fraction of decay losses from the aboveground and belowground humified slow soil C pools to CO2 and DOC so that the modelled values of annual DOC flux (Mg C ha−1 yr−1) for each catchment fit the estimated mean annual DOC load for that catchment. The decay loss parameters were then applied to all forest stands in the other catchments in the watershed, based on a previous assessment [46] of catchment properties of one of the three measured catchments, to model the total terrestrial C exports from the entire upland forest area (8222.1 ha) of the watershed (Figure A2). Dissolved organic C flux (yield) for the three catchments ranged from 0.017 to 0.057 Mg C ha−1 yr−1 [27], which was at the low end of the range of DOC yields for small coastal watersheds within the entire coastal temperate rainforest region (0.013 to 0.289 Mg C ha−2 yr−1) extending from southeast Alaska to northern California but well within the range of those in seasonal rainforests in this region (0.012 to 0.068 Mg C ha−2 yr−1) [47].
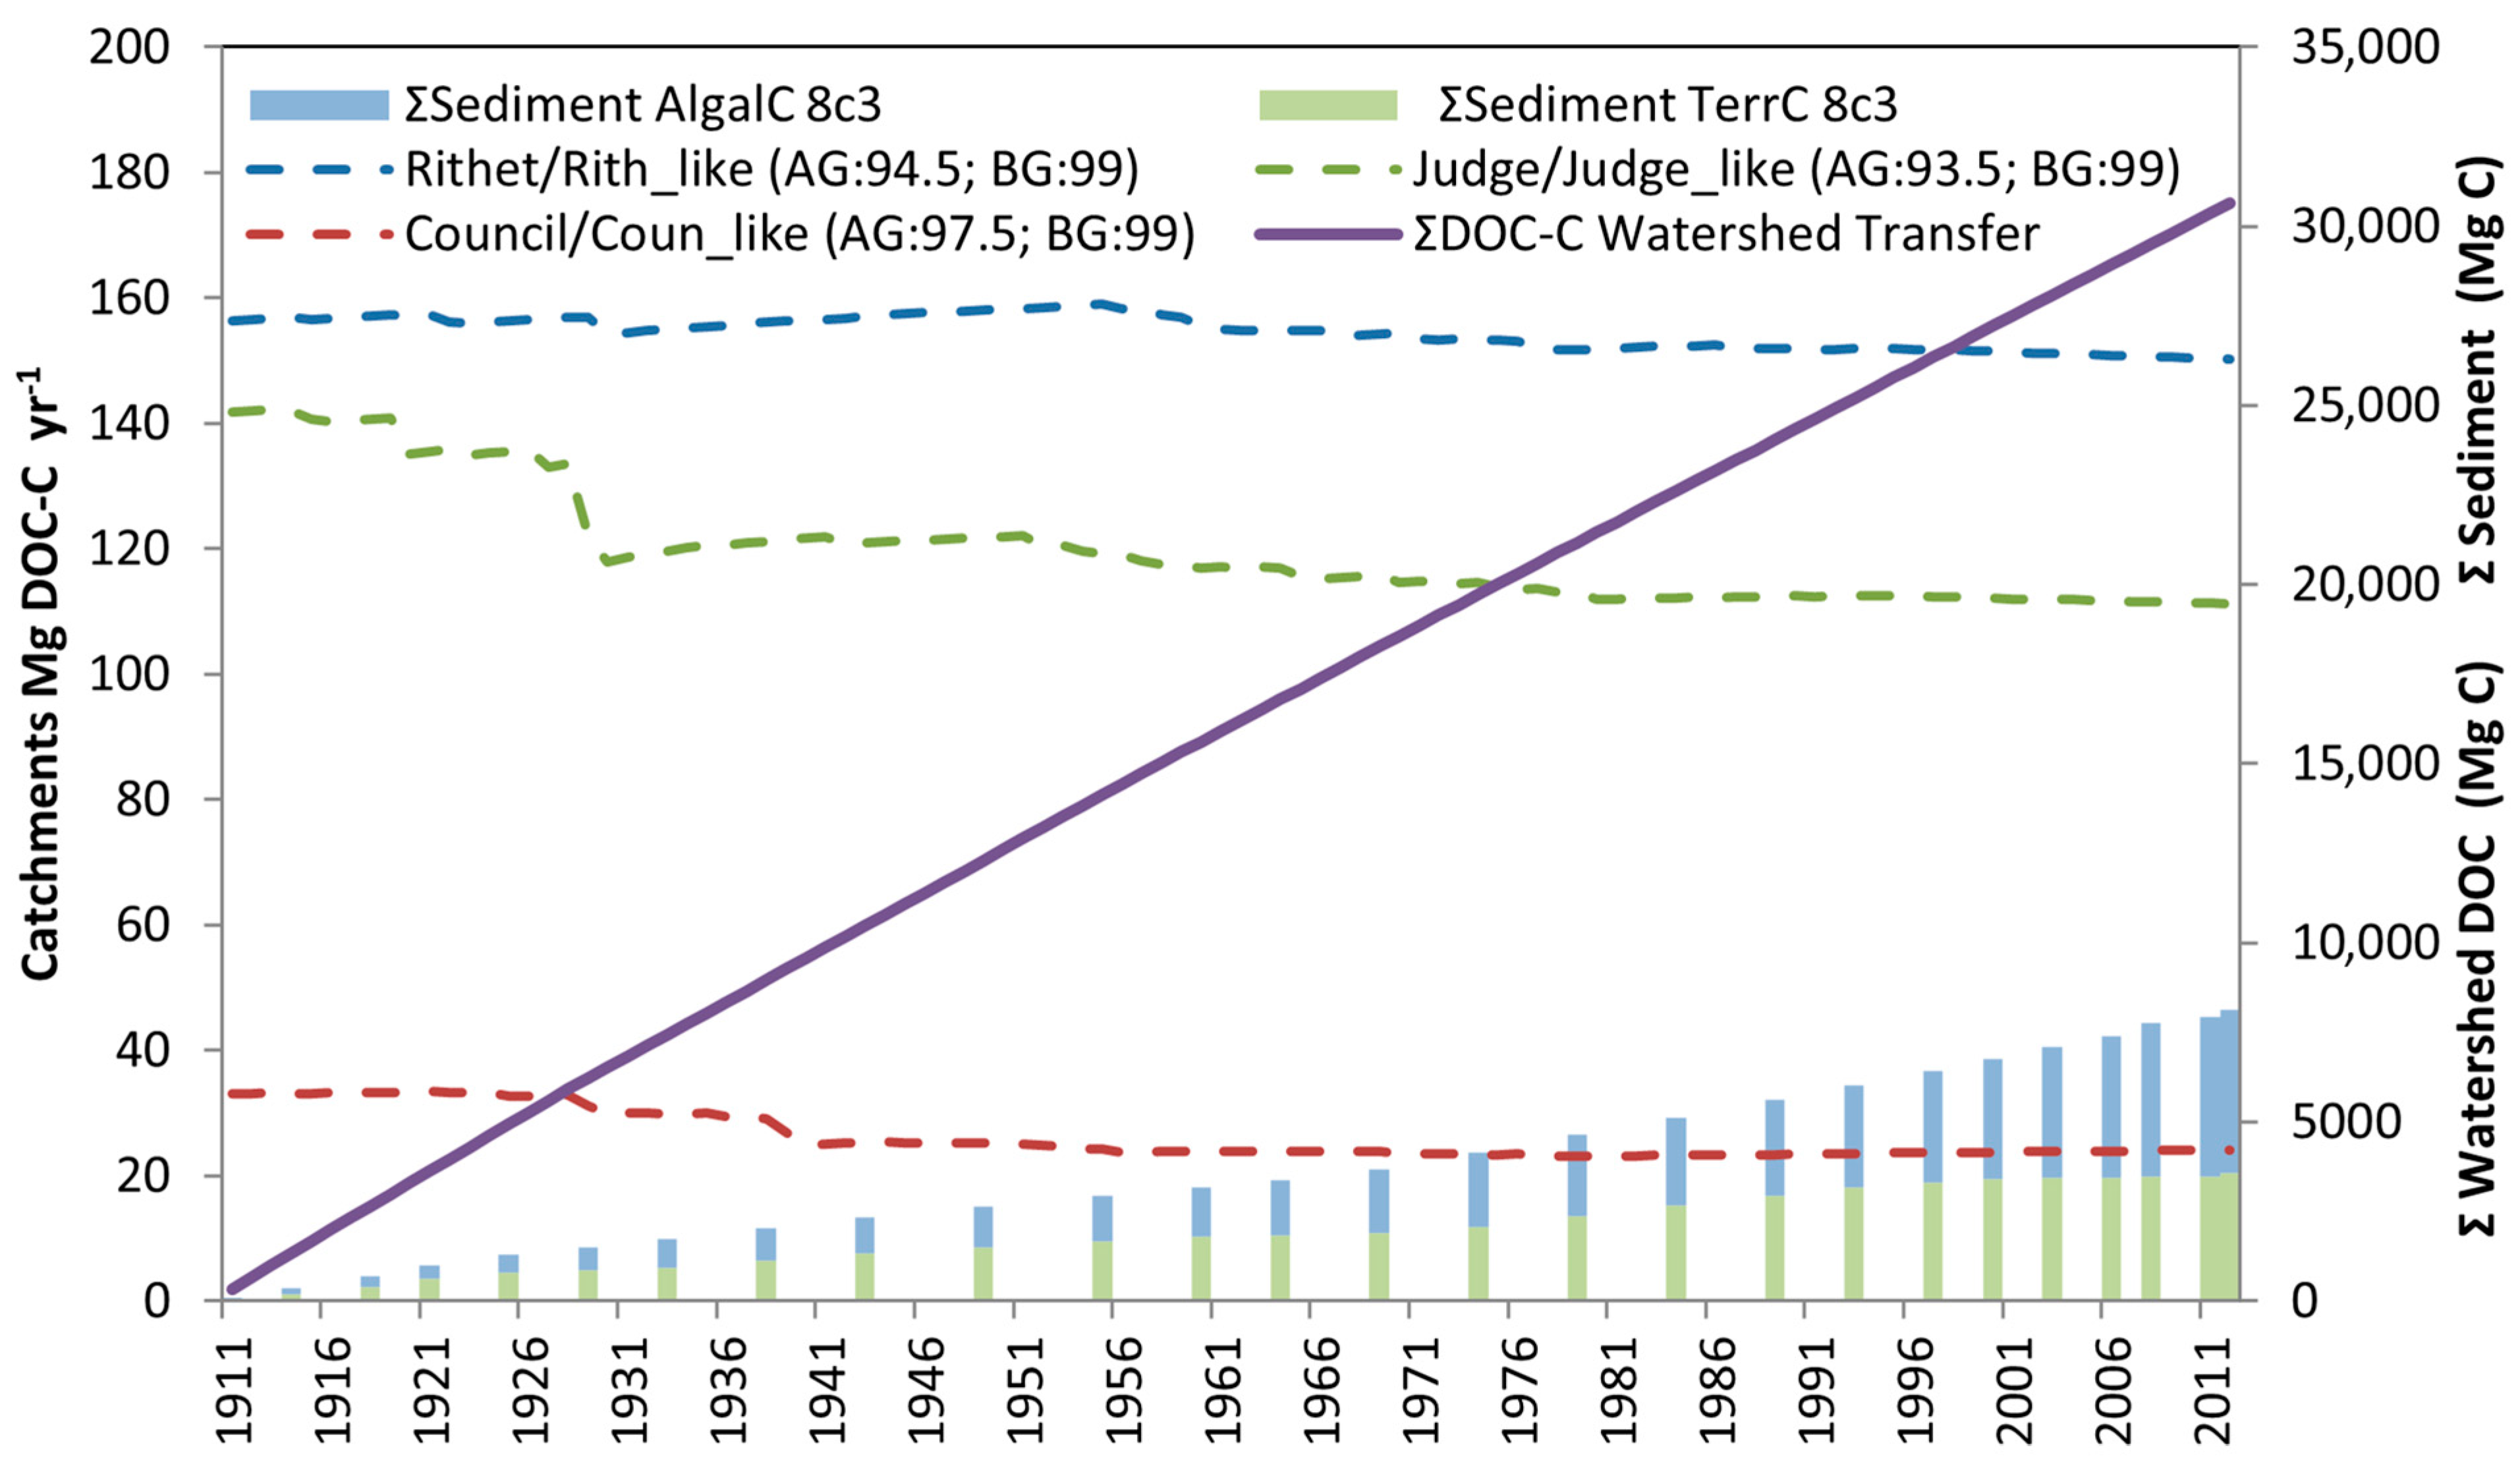
The modelled annual terrestrial C exports from 1911 to 2012 reflect the area of the combined catchments with decadal trends due to the size of the humified slow soil C pools as forest stands grew or were disturbed. For example, annual DOC flux (Figure 7) varied the least over this period for the least disturbed catchments, Rithet and Rithet-like (3926.4 ha), while the DOC flux from the Judge and Judge-like (2822.5 ha) catchments showed large declines from 1911 to 1935, coincident with major areas of harvest and slashburn (Figure 1A). Annual DOC flux in the Council and Council-like (1473.2 ha) catchments show some decline from 1926 to 1941, coincident with the period of major harvest activity (Figure 1A and Figure 7). Nonetheless, assuming that none of the terrestrial DOC transferred from the land was respired to CO2 nearshore, over 100 years up to 30,657 Mg C may have entered the reservoir (Figure 7).
For the period from 1911 to 2012, analysis of sediment C fluxes and reservoir area indicates that 8140 Mg of total organic C accumulated in the sediment. Using the pyGC-MS results, estimated terrestrial C accumulation was 3557 (Tm8c3) to 5145 (Tm8) Mg C, representing 11%–17% of the modelled DOC transfers, while from 4563 (Tm8c3) to 2995 (Tm8) Mg of algal C was estimated to have accumulated over the same period. This suggests that 83%–89% of the DOC entering the reservoir was respired to CO2 in the water column and/or was exported downstream from the reservoir into the Sooke River or into the drinking water system. Degradation of DOC in the water column can be caused by bacterial processing as well as by UV breakdown of compounds [19] and will also depend upon the type of OM compound, such that shorter-chain aquatic alkanes are generally more sensitive to bacterial degradation than terrestrial OM compounds [18].

4.2. Pre-Development Period Before 1910

In the pre-development period (pre-1910), multiple fire events are evident in the record, commensurate with an increase in the abundance of early seral vegetation (i.e., Alnus and Pteridium) [43]. Fires burned a limited area in 1900 (Figure 1B), as recorded by a slight increase in charcoal (Figure 6). The lack of a magnetic signal and change in terrestrial C flux suggests these fires were limited in extent and/or of lower severity. In contrast, inferred stand ages suggest that several fires burned right to the edge of the pre-SLR lake between 1870 and 1895 (Figure 1B and Figure 6). These were characterized by marked increases in charcoal and MS and a decrease in terrestrial carbon, capturing not only the proximity of the fires to the pre-SLR lake but also suggesting that they may have been higher-severity events that consumed vegetation, killed overstory trees, and exposed mineral soil. Stand-age-inferred fires in the 1850s did not produce any stratigraphic record, possibly because they were small with lower severity and located further away from the pre-SLR lake. In the decades prior, several areas, as inferred by stand age distributions, burned near or adjacent to the pre-SLR lake between 1820 and 1830. These events produced lagged (ca. 10 yr) increases in charcoal and MS, similar to the historic period, though with no corresponding decrease in terrestrial C flux, perhaps reflecting moderate-severity fires that burned understory and surface fuels with limited crowning. A smaller area also burned sometime between 1810 and 1820, generating subdued and lagged charcoal and MS signals, though with no corresponding decreases in terrestrial C flux, potentially signifying fires of lower severity. Similarly, several smaller areas which also burned between 1770 and 1800 likewise exhibit lagged charcoal signals together with muted MS signals and variable terrestrial C flux, suggesting that they consisted of both low- and higher-severity fires. From 1770 to 1910, 9799 Mg of total C and 4654 (Tm8c3) to 6880 (Tm8) Mg of terrestrial C were estimated to have accumulated in the pre-SLR lake sediment.
The combination of lower- and higher-severity fires suggests a mixed-severity fire regime prevailed, consistent with understanding of the modern fire regime and the observed variable changes in terrestrial C flux. Fire regimes in the Coastal Douglas-fir (CDF) zone and dry Coastal Western Hemlock (CWHxm) subzone are typified by low-intensity surface fires and medium-to-high-intensity surface and crown fires averaging 5–50 ha with ca. 100–300-year return intervals. Notably, surface fires are more frequent in these drier forests compared to the wetter Coastal Western Hemlock subzones (e.g., CWHvm) [48]. In a study of coastal forest chronosequences on Vancouver Island [49], the low amounts of woody debris, thin litter layers, and presence of brunsolic soils in dry CWHxm subzone old-growth forests were suggested to be due to repeated surface fire consumption which reduced detritus C inputs to the soil organic matter pool, DOC production, and rate of podzolization. This contrasts the high amounts of woody debris, thick litter layers, and presence of humo-ferric podzolic soils in wet CWHvm subzone old-growth forests where fire disturbance is less frequent, which increased detritus C inputs to the soil organic matter pool, DOC production, and rate of podzolization [50].
Regarding immediate post-fire land–water C transfers, low-severity fires in the predominately coniferous forests of fire-prone Yosemite National Park, USA, were associated with enhanced DOC in stream water, whereas higher-severity fires were associated with reduced DOC [51]. In contrast, a multi-lake study from northern coniferous forests in central North America showed that moderate-severity wildfires were generally associated with increased DOC, likely because enough organic material remained in the post-fire environment for transport [52]. These examples highlight how fire severity can variously influence C transport, with factors like soil and vegetation combustion, soil microbial activity, and altered soil properties reducing the production and transport of DOC and post-fire regrowth aiding its recovery [53].
In the future, climate change will undoubtedly alter the fire regime [54,55] within the water supply area, impacting terrestrial carbon transfers. Studies suggest that fire disturbance in the future may be variable across the water supply area, with reduced fuel loading (i.e., more open forests) resulting in lower-severity fires in eastern areas [44] and lower amounts of detrital C. These changes may reduce the overall production of soil organic matter and DOC transfers to the reservoir, reducing terrestrial organic C accumulation in the sediments. However, the CRD manages the forests in the watersheds, allowing them to grow and aggressively suppressing any wildfire. Given these management objectives, it is difficult to predict changes in the amounts of detrital C, soil organic matter, and DOC, necessitating the need for modelling studies.

4.3. Organic C Sources and Accumulation Rates in Lake Sediments

Northern forests are important ecosystems for carbon cycling, with lakes processing and burying large amounts of organic C, representing the net balance of terrestrial C transferred to lakes, autotrophic fixation, mineralization, and downstream export [56]. Studies determining the organic carbon accumulation rate (OCAR) in sediments often report values for total C and may not differentiate what is of terrestrial origin or assume the OCAR is all from terrestrial C.
In the Sooke Lake Reservoir (SLR) the fraction of total sediment C of terrestrial origin varied slightly between periods and was lowest from 1910 to 2020 as recent inputs of algal C were more prevalent and diagenesis in surface sediments was likely incomplete [57]. The values were, however, within the range reported for boreal lake sediments elsewhere in Canada and Sweden (Table 2a, [58,59,60]). The total OCAR in the SLR differed between periods, though OCAR for both was greater than those for eastern boreal [61] and northern North American lakes before 1950 [56], comparable to northern lakes after 1950 and Ontario boreal lakes [57] (i.e., n = 80; 72 remote lakes and 4 lakes heavily impacted and 4 lakes lightly impacted by land clearing and SO2 acid deposition from Sudbury mining smelter operations from 1890 to 1990), and less than those for a Swiss perialpine lake [62] (Table 2b). Studies reporting total OCAR did not appear to differentiate OCAR from terrestrial C. Terrestrial OCAR in the SLR was lower in 1911–2012 than the 1770–1910 period, with both being lower than the terrestrial OCAR reported for surface sediment for Swedish boreal lakes [60] (Table 2c); however, these surface sediments are likely are undergoing diagenesis and may decrease, as observed for total OCAR in the surface versus deep sediments in eastern Quebec boreal lakes [61] (Table 2b). The fraction of terrestrial C transferred from the Sooke Lake Watershed and sequestered in sediment of SLR was lower than that in a headwater [59] and 20 small catchments [63] in the boreal Precambrian shield, Ontario (Table 2d).
This comparison demonstrates how most studies on organic C sources and accumulation rates in sediments focus on boreal forests. Further, it also shows that studies examining the fraction or amount of terrestrial C transferred from watersheds and sequestered in sediment are uncommon [62,64].

5. Conclusions

This study provides a rare long-term perspective on terrestrial C transfers together with fire and erosion history within a drinking water supply area. In addition to using traditional paleoecological approaches to examine fire and erosion history, the study also novelly used pyGC-MS to quantify the amount of terrestrial C persisting in the reservoir sediments. Results showed that reservoir expansions and nearshore disturbances after 1910 had major effects on all measured proxies, with upland fires and other disturbances having less effect. This suggests that sediment charcoal inputs from 1770 to 1910 were mainly due to fires within 2500 m of the reservoir, with a lag of about 10 years often separating the event from the proxy signal. Comparing the pre- and post-development periods, magnetic susceptibility was up to 3× greater in the former, revealing increased erosion associated with land clearing for reservoir expansion and other activities, including development of roads and rights-of-way. The pyGC-MS method was of value in determining the amount of terrestrial C sequestered in sediment during the development period, which ranged from 3557 to 5145 Mg C/100 yr, representing <17% of the DOC transferred to the reservoir from the forested watershed. The remaining 83% was either respired to CO2 in the water column or exported downstream, revealing that reservoirs, and by extension lakes, are both processors and sinks of carbon. In consequence, such environments need to be considered in carbon accounting and carbon budget models.

Author Contributions

Conceptualization, J.A.T. and K.J.B. equally; methodology, K.J.B., J.A.T., D.D. and B.S.; software, B.S., R.D. and K.J.B.; validation, K.J.B., J.A.T. and B.S.; formal analysis, J.A.T., K.J.B., B.S., R.D. and N.H.; investigation, K.J.B., J.A.T., B.S., D.D. and R.D.; resources, D.D. and K.J.B.; data curation, J.A.T., K.J.B., R.D. and D.D.; writing—original draft preparation, J.A.T. and K.J.B. equally, B.S.; writing—review and editing, J.A.T. and K.J.B. equally, B.S., R.D., D.D. and N.H.; visualization, B.S., J.A.T., K.J.B. and N.H.; supervision, J.A.T., K.J.B. and D.D.; project administration, J.A.T., K.J.B. and D.D.; funding acquisition, J.A.T., K.J.B. and D.D. All authors have read and agreed to the published version of the manuscript.

Funding

This research was funded through the Canadian Forest Service- Natural Resources Canada base funding provided to J.A.T., K.J.B. and D.D. as well as through a PFC Director General special project fund.

Data Availability Statement

Data are stored at NRCan and available from the primary authors upon request.

Acknowledgments

PFC staff member Nicholas Conder and U. Victoria COOP student Kiera Smith assisted in core collection, subsampling, and proxy measurements; U. Victoria COOP student Amanda Charpentier assisted with initial pyGC-MS and data preparation; U. Victoria COOP student Owen Petersen assisted in data preparation and graphing of the final pyGC-MS. Julie Tolu kindly provided a copy of her NIS marker catalog and R script to process pyGC-MS output which was modified to run in R on Linux by PFC staff member Ben Rancourt. Pb-210 activity measurements were performed by Flett Research Ltd. (Winnipeg, MB, Canada). Many thanks to CRD-IWS staff members Tobi Gardner for providing 1941–2013 Sooke Dam weather station precipitation data, Rob Walker and Kelly Edwards for the hourly wind speed and direction data from 1995 to 2014 for three fire weather stations around the Sooke Lake Reservoir, and especially Joel Ussery for funding and in-kind support throughout this project. We also thank Caroline Preston for suggestions to use pyGC-MS to characterize charcoal and terrestrial C in lake sediments. We acknowledge the traditional territories of the T’Sou-ke First Nation whose relationship with the lands where the research area for this study was located continues to this day.

Conflicts of Interest

The authors declare no conflicts of interest.

Appendix A

Appendix A.1. Carbon and Nitrogen Totals and Isotope Ratios: Detailed Methods

Total carbon and nitrogen determination was performed on a Costech ECS 4010 elemental analyzer using the following instrument conditions: the left furnace, which contained a reactor column of chromium oxide, cobaltous oxide, and quartz wool, was held at 1020 °C; the right furnace, which contained a reduction column of copper wires and quartz wool, was held at 650 °C; and the GC oven was held at 70 °C. A total of 10–20 mg of dry sediment was measured into a tin capsule and then run along with standards of varying weights. Standard curves of instrument response vs. amount of carbon and amount of nitrogen (mg) were used to determine the total carbon and nitrogen in the samples. The final % carbon value was obtained by dividing the amount of carbon in the sample by the mass of sample analyzed (mass of sample analyzed was corrected by applying a moisture factor after the samples (which had previously been dried at 40 °C) were dried at 105 °C).
Carbon and nitrogen isotope ratio samples were weighed into tin capsules and analyzed with a Delta V Advantage IRMS equipped with a Flash 2000 HT Organic Elemental Analyzer (Thermo Fisher Scientific, Bremen, Germany)for sample introduction. Samples were combusted at 1020 °C under elevated levels of oxygen (O2 flow rate: 175 mL/min), and then the gaseous products were carried by helium gas (flow rate: 120 mL/min) into a reactor column containing chromium oxide, copper wire, and silvered cobaltous/ic oxide. Before entering the IRMS, water was removed by a magnesium perchlorate water trap and the CO2 and N2 gases were separated on a GC column (temperature: 50 °C). Samples were calibrated against a reference gas (flow rate: 120 mL/min) that was introduced three times at the beginning of each run and three times at the end to obtain an isotope ratio. Secondary standards with known isotope ratios were also calibrated against the reference gas and the actual ratio and the measured ratio were plotted against one another; the measured isotope ratios of the samples were then corrected using the linear regression of the secondary standards.

Appendix A.2. Pyrolysis-Gas Chromatography-Mass Spectrometry (pyGC-MS): Detailed Methods
Briefly, this method involves pyrolysis, or decomposition by high heat of the sample, which is then carried through the GC column, with individual components exiting at different times. Once these components individually enter the MS, they are fragmented and ionized in a predictable pattern, and a final spectrum is created based on the mass-to-charge ratio of the generated fragments. The spectrum is compared to known spectra in the NIST MS library for possible compound identification [36,37]. Samples were weighed into a sample cup and then topped with quartz wool, then dropped into the pyrolyzer at the beginning of each run and remained in the pyrolyzer for the duration of the run. Pyrolysis conditions were as follows: The mode was single shot, with a temperature of 450 °C, a time of 0.2 min, and an interface temp of 320 °C. The oven program started at 40 °C with a 0 min hold, 10 °C/min from 40 °C to 320 °C, and a 2 min hold at 320 °C, for a total time of 31 min. The GC column used was a Frontier Ultra-Alloy-5 (30 m × 0.25 mm, with a 0.25 µm film thickness; 5% phenyl, 95% Dimethylpolysiloxane) with a maximum temperature of 380 °C. Back inlet conditions were set with a pressure of 5.8704 psi, temperature of 320 °C, flow rate of 0.9 mL/min, and split of 16:1, and no solvent delay. Mass spectrometer conditions were m/z 30–500 amu, 3.09 scans/s, sampling rate of 2, and MS source temperature of 230 °C.
An initial analysis of the sediment samples in 2015 had limited success as many samples, especially those from the top 12 cm of the core, had signal values just above background. The pyGC-MS analyses of all samples were repeated in 2016 with the same instrumental conditions but with analytical sample size range from 460 to 570 µg to ensure a minimum amount of total C.
The output from all samples was processed at the same time through R-Script provided by Tolu [4]. The script makes use of a multivariate curve resolution by alternate regression, after smoothing and alignment of the spectra input, to provide an output of identified peaks including retention times and with area values beneath each peak [4]. To identify the peaks and assign a compound name to each, NIST MS Search 2.2 was first used on the spectrum file outputted from the R-Script using just the compounds contained in the Tolu library, a list of compounds that were assigned “terrestrial”, “aquatic”, or “unknown” labels [4]. MS Search outputs include the compound name and two matching methods, an “R.Match” value and a percent probability value. The top three compounds using each of these methods was recorded. The generally accepted lower threshold for R.Match values is 750 [4]; identified compounds that fell below this value were labelled as unknown, as were peaks where the top R.Match and top probability did not match. Because the top R.Match is frequently a poor overall match, using a combination of the two values results in a more reliable identification. The peaks identified in this previous step were then re-run through MS Search, this time using the NIST library in addition to Tolu’s. Here, the R.Match value was used as the main guide, though each match’s spectra were compared and examined visually to ensure a good match. Thus, the final selection was the top R.Match with a reasonable spectrum compared to the unknown spectra. In some cases, the top match (and in some, the top 3+) were from the Tolu library, and these were retained, despite their initial rejection, due to low R.Match and poor visual similarity between the unknown and even the top NIST compound. Compounds that still had a value below 750 or were identified as a duplicate to a compound with a higher R.Match value were labelled as unknown and were effectively ignored for subsequent steps. To further sort and focus only on those compounds that are most relevant, a threshold for peak area was established for each sample. Compounds with a very small peak, while not exactly “background noise” (this is accounted/corrected for during the initial processing), are not as relevant, and do not contribute much to the further calculations; thus, they are removed. This lower threshold value was found by looking at spectra charts for individual samples. Areas were found for weak peaks, determined by their general shape and form relative to background and unidentified peaks and spectra. From the areas of these weak peaks, a determination of a threshold was made (generally just above the value of the weak peaks) and was then applied to previously calculated peak areas for each compound. If the area value fell below the threshold, the area value became 0 and the name became “unknown”. Though they are real peaks, with possibly accurate identifications, the “unknown” label was still used to make future sorting and classification easier. Values and names that did not fall below the threshold were left unchanged, as the threshold value does not indicate background noise, just the value where the peak becomes significant.
Figure A1. CBM-CFS3-generated (A) carbon fluxes (Mg C ha−1 yr−1) and (B) carbon stocks (Mg C ha−1) from a retrospective forest C budget for the Sooke Lake Watershed developed for the historic development period, 1910–2012. Disturbance letter codes: R—Reservoir raising events, F—Forestry Sustained Yield, W—Water Quality Management, H1—Lot 87 Harvest, H2—Council Harvest/Fire. (Reproduced with permission from Smiley et al., Figures 12a and 13a Applied Geography (2016) 74:109–122, doi: 10.1016/j.apgeog.2016.06.011. Published by Elsevier, 2016) [26].
Forests 16 01549 g0a1
Figure A2. CBM-CFS3-generated spatial distribution of terrestrial dissolved organic carbon transfers (Mg C ha−1 yr−1) in 2012 to the reservoir from each forest cover polygon in the Sooke Lake Watershed. Small non-forest polygons within the catchments were excluded and not modelled. (Reproduced from Smiley and Trofymow, Figure 4, Carbon Balance and Management (2017) 12:15 DOI 10.1186/s13021-017-0083-z. http://creativecommons.org/licenses/by/4.0/ (accessed on 10 July 2025) [27].
Forests 16 01549 g0a2

References

  1. Tans, P.; Keeling, R. Trends in Atmospheric Carbon Dioxide. ESRL Global Monitoring Division—Global Greenhouse Gas Reference Network. 2015. Available online: http://www.esrl.noaa.gov/gmd/ccgg/trends/index.html (accessed on 7 September 2015).
  2. Solomon, S.; Plattner, G.K.; Knutti, R.; Friedlingstein, P. Irreversible climate change due to carbon dioxide emissions. Proc. Natl. Acad. Sci. USA 2009, 106, 1704–1709. [Google Scholar] [CrossRef]
  3. Cao, L.; Caldeira, K.; Jain, A.K. Effects of carbon dioxide and climate change on ocean acidification and carbonate mineral saturation. Geophys. Res. Lett. 2007, 34, 2006GL028605. [Google Scholar] [CrossRef]
  4. Luo, Y.; Keenan, T.F.; Smith, M. Predictability of the terrestrial carbon cycle. Glob. Change Biol. 2014, 21, 1737–1751. [Google Scholar] [CrossRef]
  5. Zhao, J.; Liu, D.; Zhu, Y.; Peng, H.; Xie, H. A review of forest carbon cycle models on spatiotemporal scales. J. Clean. Prod. 2022, 339, 130692. [Google Scholar] [CrossRef]
  6. IPCC. Good Practice Guidance for Land Use, Land-Use Change and Forestry; Penman, J., Gytarsky, M., Hiraishi, T., Krug, T., Kruger, D., Pipatti, R., Buendia, L., Miwa, K., Ngara, T., Tanabe, K., et al., Eds.; IGES: Kanagawa, Japan, 2003; Available online: https://www.ipcc-nggip.iges.or.jp/public/gpglulucf/gpglulucf_contents.html (accessed on 25 August 2025).
  7. IPCC. Climate Change 2014: Synthesis Report. Contribution of Working Groups I, II and III to the Fifth Assessment Report of the Intergovernmental Panel on Climate Change; Core Writing Team, Pachauri, R.K., Meyer, L.A., Eds.; IPCC: Geneva, Switzerland, 2014; Volume 151, pp. 2–54. [Google Scholar]
  8. Goodale, C.L.; Apps, M.J.; Birdsey, R.A.; Field, C.B.; Heath, L.S.; Houghtton, R.A.; Jenkins, J.C.; Kohlamier, G.H.; Kurz, W.; Liu, S.; et al. Forest carbon sinks in the northern hemisphere. Ecol. Appl. 2002, 12, 891–899. [Google Scholar] [CrossRef]
  9. Pan, Y.; Birdsey, R.A.; Fang, J.; Houghton, R.; Kauppi, P.E.; Kurz, W.A.; Phillips, O.L.; Shvidenko, A.; Lewis, S.L.; Canadell, J.G.; et al. A large and persistent carbon sink in the world’s forests. Science 2011, 333, 988–993. [Google Scholar] [CrossRef] [PubMed]
  10. Smith, H.G.; Sheridan, G.J.; Lane, P.N.; Nyman, P.; Haydon, S. Wildfire effects on water quality in forest catchments: A review with implications for water supply. J. Hydrol. 2011, 396, 170–192. [Google Scholar] [CrossRef]
  11. Kull, S.J.; Rampley, G.J.; Morken, S.; Metsaranta, J.; Neilson, E.T.; Kurz, W.A. Operational-Scale Carbon Budget Model of the Canadian Forest Sector (CBM-CFS3) Version 1.2: User’s Guide; Canadian Forest Service; Northern Forestry Centre: Edmonton, AB, Canada, 2014. [Google Scholar]
  12. Iglesias, V.; Yospin, G.I.; Whitlock, C. Reconstruction of fire regimes through integrated paleoecological proxy data and ecological modeling. Front. Plant Sci. 2014, 5, 785. [Google Scholar] [CrossRef]
  13. Higuera, P.E.; Gavin, D.G.; Bartlein, P.J.; Hallett, D.J. Peak detection in sediment-charcoal records: Impacts of alternative data analysis methods on fire-history interpretations. Int. J. Wildland Fire 2010, 19, 996–1014. [Google Scholar] [CrossRef]
  14. Kurz, W.A.; Dymond, C.C.; White, T.M.; Stinson, G.; Shaw, C.H.; Rampley, G.J.; Smyth, C.; Simpson, B.N.; Neilson, E.T.; Trofymow, J.A.; et al. CBM-CFS3: A model of carbon-dynamics in forestry and land-use change implementing IPCC standards. Ecol. Model. 2009, 220, 480–504. [Google Scholar] [CrossRef]
  15. Dean, W.; Gorham, E. Magnitude and significance of carbon burial in lakes, reservoirs and peatlands. Geology 1998, 26, 535–538. [Google Scholar] [CrossRef]
  16. Regnier, P.; Friedlingstein, P.; Ciais, P.; Mackenzie, F.T.; Gruber, N.; Janssens, I.A.; Laruelle, G.G.; Lauerwald, R.; Luyssaert, S.; Andersson, A.J.; et al. Anthropogenic perturbation of the carbon fluxes from land to ocean. Nat. Geosci. 2013, 6, 597–607. [Google Scholar] [CrossRef]
  17. Cole, J.J.; Prairie, Y.T.; Caraco, N.F.; McDowell, W.H.; Tranvik, L.J.; Striegel, R.G.; Duarte, G.M.; Kortelainen, P.; Downing, J.A.; Middelburg, J.J.; et al. Plumbing the global carbon cycle: Integrating inland waters into the terrestrial carbon budget. Ecosystems 2007, 10, 171–184. [Google Scholar] [CrossRef]
  18. Meyers, P.A.; Ishiwatari, R. Lacustrine organic geochemistry—An overview of indicators of organic matter sources and diagenesis in lake sediments. Org. Geochem. 1993, 20, 867–900. [Google Scholar] [CrossRef]
  19. Koehler, B.; Landelius, T.; Weyhenmeyer, G.A.; Machida, N.; Tranvik, L.J. Sunlight-induced carbon dioxide emissions from inland waters. Glob. Biogeochem. Cycles 2014, 28, 696–711. [Google Scholar] [CrossRef]
  20. Hansell, D.A.; Carlson, C.A.; Repeta, D.J.; Schlitzer, R. Dissolved organic matter in the ocean: New insights stimulated by a controversy. Oceanography 2009, 22, 202–211. [Google Scholar] [CrossRef]
  21. Kirchgeorg, T.; Schüpbach, S.; Kehrwald, N.; McWethy, D.B.; Barbante, C. Method for the determination of specific molecular markers of biomass burning in lake sediments. Org. Geochem. 2014, 71, 1–6. [Google Scholar] [CrossRef]
  22. Stein, S.E. An integrated method for spectrum extraction and compound identification from gas chromatography/mass spectrometry data. J. Am. Soc. Mass Spectrom. 1999, 10, 770–781. [Google Scholar] [CrossRef]
  23. Denis, E.H.; Toney, J.L.; Tarozo, R.; Anderson, R.S.; Roach, L.D.; Huang, Y. Polycyclic aromatic hydrocarbons (PAHs) in lake sediments record historic fire events: Validation using HPLC-fluorescence detection. Org. Geochem. 2012, 45, 7–17. [Google Scholar] [CrossRef]
  24. Tolu, J.; Gerber, L.; Boily, J.; Bindler, R. High-throughput characterization of sediment organic matter by pyrolysis-gas chromatography/mass spectrometry and multivariate curve resolution: A promising analytical tool in (paleo) limnology. Anal. Chim. Acta 2015, 880, 93–102. [Google Scholar] [CrossRef]
  25. Ninnes, S.; Tolu, J.; Meyer-Jacob, C.; Mighall, T.M.; Bindler, R. Investigating molecular changes in organic matter composition in two Holocene lake-sediment records from central Sweden using pyrolysis-GC/MS. J. Geophys. Res. Biogeosci. 2017, 122, 1423–1438. [Google Scholar] [CrossRef]
  26. Smiley, B.; Trofymow, J.A.; Niemann, J.A. Spatially-explicit reconstruction of 100 years of forest disturbance on a coastal Douglas-fir-dominated landscape: Implications for watershed-scale carbon budgets. Appl. Geogr. 2016, 74, 109–122. [Google Scholar] [CrossRef]
  27. Smiley, B.; Trofymow, J.A. Historical effects of dissolved organic carbon export and land management decisions on the watershed-scale forest carbon budget of a coastal British Columbia Douglas-fir-dominated landscape. Carbon Balance Manag. 2017, 12, 15. [Google Scholar] [CrossRef] [PubMed]
  28. CRD Facts and Figures: Greater Victoria Water Supply Area. 2014. Available online: https://www.crd.bc.ca/service/public-tours/watershed-tours/facts-figures (accessed on 28 August 2015).
  29. Pojar, J.; Klinka, K.; Demarchi, D.A. Coastal Western Hemlock zone. In Ecosystems of British Columbia. BC Special Report Series No. 6; Meidinger, D., Pojar, J., Eds.; BC Ministry of Forests: Victoria, BC, Canada, 1991; Chapter 6. [Google Scholar]
  30. Jungen, J.R. Soils of Southern Vancouver Island. British Columbia Soil Survey Report 44, MOE Technical Report 17; BC Ministry of Forests: Victoria, BC, Canada, 1985. Available online: https://www.env.gov.bc.ca/esd/distdata/ecosystems/Soils_Reports/bc44_report.pdf (accessed on 5 September 2025).
  31. Jungen, J.R. Soils of Southern Vancouver Island. B.C. Soil Survey Report 44, Map Sheet 1. 1986. Available online: https://sis.agr.gc.ca/cansis/publications/surveys/bc/bc44/bc44_map_1.jpg (accessed on 5 September 2025).
  32. Soil Classification Working Group. The Canadian System of Soil Classification, 3rd ed.; Agriculture and Agri-Food Canada Publication 1646: Ottawa, ON, Canada, 1998; 187p, Available online: https://sis.agr.gc.ca/cansis/publications/manuals/1998-cssc-ed3/index.html (accessed on 5 September 2025).
  33. CRD 2012 Strategic Plan for the Greater Victoria Water Supply System, Final Report; Capital Regional District; Victoria, BC, Canada, April 2012; Section 7.
  34. Blaauw, M. Methods and code for ‘classical’ age-modelling of radiocarbon sequences. Quat. Geochronol. 2010, 5, 512–513. [Google Scholar] [CrossRef]
  35. Sander, P.M.; Gee, C.T. Fossil charcoal: Techniques and applications. Rev. Palaeobot. Palynol. 1990, 63, 269–279. [Google Scholar] [CrossRef]
  36. Jones, M. Gas Chromatography-Mass Spectrometry: A National Historic Chemical Landmark. American Chemical Society. 2019. Available online: https://www.acs.org/content/acs/en/education/whatischemistry/landmarks/gas-chromatography-mass-spectrometry.html (accessed on 8 June 2019).
  37. Xie, C.; Yu, J.; Huang, S.; Gao, W.; Tang, K.A. Novel approach of matching mass-to-charge ratio for compound identification in gas chromatography-mass spectrometry. J AOAC Int. Mar. 2019, 102, 638–645. [Google Scholar] [CrossRef] [PubMed]
  38. Grimm, E.C. CONISS: A FORTRAN 77 program for stratigraphically constrained cluster analysis by the method of incremental sum of squares. Comput. Geosci. 1987, 13, 13–35. [Google Scholar] [CrossRef]
  39. Whitlock, C.; Millspaugh, S.H. Testing the assumptions of fire history studies: An examination of modern charcoal accumulation in Yellowstone National Park, USA. Holocene 1996, 6, 7–15. [Google Scholar] [CrossRef]
  40. Finlay, J.C.; Power, M.E.; Cabana, G. Effects of water velocity on algal carbon isotope ratios: Implications for river food web studies. Limnol. Oceanogr. 1999, 44, 1198–1203. [Google Scholar] [CrossRef]
  41. Teranes, J.L.; Bernasconi, S.M. The record of nitrate utilization and productivity limitation provided by δ15N values in lake organic matter—A study of sediment trap and core sediments from Baldeggersee, Switzerland. Limnol. Oceanogr. 2000, 45, 801–813. [Google Scholar] [CrossRef]
  42. Wetzel, R.G. Limnology, 3rd ed.; Academic Press: San Diego, CA, USA, 2001; 1006p. [Google Scholar]
  43. Brown, K.; Hebda, N.; Schoups, G.; Conder, N.; Smith, K.; Trofymow, J.A. Long-term climate, vegetation and fire regime change in a managed municipal water supply area, British Columbia. Canada. Holocene 2019, 29, 1411–1424. [Google Scholar] [CrossRef]
  44. Horrelt, D.R. Fire Regime Change in High-Value Temperate Forested Watersheds: A Paleoecological Investigation in the Greater Victoria Water Supply Area (GVWSA) on Southern Vancouver Island, British Columbia. Master’s Thesis, University of Victoria, Victoria, BC, Canada, 2024; p. 98. Available online: https://dspace.library.uvic.ca/items/07675e14-9c1c-4db0-92ef-ba9e55672211 (accessed on 25 August 2025).
  45. Runkel, R.L.; Crawford, C.G.; Cohn, T.A. Load Estimator (LOADEST): A FORTRAN Program for Estimating Constituent Loads in Streams and Rivers; United States Geological Survey: Reston, VA, USA, 2004. [Google Scholar]
  46. Barraclough, C.L. Sooke Reservoir Sediment Study Final Report; Greater Victoria Water District and BC Environment, Lands and Parks, Water Quality Branch: Victoria, BC, Canada, 1995. [Google Scholar]
  47. McNicol, G.; Hood, E.; Butman, D.E.; Tank, S.E.; Giesbrecht, I.J.W.; Floyd, W.; D’Amore, D.; Fellman, J.; Cebulski, A.; Lally, A.; et al. Small, coastal temperate rainforest watersheds dominate dissolved organic carbon transport to the northeast Pacific Ocean. Geophys. Res. Lett. 2023, 50, e2023GL103024. [Google Scholar] [CrossRef]
  48. Parminter, J. Typical historic pattern of wildfire disturbance by biogeoclimatic zone. In Old-Growth Forests: Problem Analysis; Research Branch, B.C. Ministry of Forests: Victoria, BC, Canada, 1990. [Google Scholar]
  49. Trofymow, J.A.; Porter, G.L.; Blackwell, B.A.; Arksey, R.; Marshall, V.; Pollard, D. Chronosequences for Research into the Effects of Converting Coastal British Columbia Old-Growth Forests to Managed Forests: An Establishment Report; Information Report BC-X-374; Natural Resources Canada, Canadian Forest Service, Pacific Forestry Centre: Victoria, BC, Canada, 1997; 137p. [Google Scholar]
  50. Trofymow, J.A.; Blackwell, B.A. Changes in ecosystem mass and carbon distributions in coastal forest chronosequences. Northwest Sci. 1998, 72, 40–42. [Google Scholar]
  51. Santos, F.; Wymore, A.S.; Jackson, B.K.; Sullivan, S.M.P.; McDowell, W.H.; Berhe, A.A. Fire severity, time since fire, and site-level characteristics influence streamwater chemistry at baseflow conditions in catchments of the Sierra Nevada, California, USA. Fire Ecol. 2019, 15, 3. [Google Scholar] [CrossRef]
  52. Bélair, M.; McCullough, I.M.; Filstrup, C.T.; Brentrup, J.A.; Lapierre, J.F. Wildfires mediate carbon transfer from land to lakes across boreal and temperate regions. Commun. Earth Env. 2025, 6, 94. [Google Scholar] [CrossRef]
  53. Wei, X.; Hayes, D.J.; Fernandez, I. Fire reduces riverine DOC concentration draining a watershed and alters post-fire DOC recovery patterns. Environ. Res. Lett. 2021, 16, 024022. [Google Scholar] [CrossRef]
  54. Metsaranta, J.M.; Kurz, W.A.; Neilson, E.T.; Stinson, G. Implications of future disturbance regimes on the carbon balance of Canada’s managed forest (2010–2100). Tellus B 2010, 62, 719–728. [Google Scholar] [CrossRef]
  55. Dye, A.W.; Reilly, M.J.; McEvoy, A.; Lemons, R.; Riley, K.L.; Kim, J.B.; Kerns, B.K. Simulated future in wildfire regimes in moist forests of Pacific Northwest, USA. J. Geophys. Res. Biogeosci. 2024, 129, e2023JG007722. [Google Scholar] [CrossRef]
  56. Heathcote, A.A.; Anderwson, N.J.; Prairie, Y.T.; Engstrom, D.R.; del Giorgio, P.A. Large increases in carbon burial in northern lakes during the Anthropocene. Nature 2015, 6, 10016. [Google Scholar] [CrossRef]
  57. Meyer-Jacob, C.; Labaj, A.L.; Paterson, A.M.; Layton-Matthews Smol, J.P. Impacts of acid deposition and lake browning on long-term organic carbon storage in Canadian northern forest lakes. J. Paleolimnol. 2004, 71, 153–173. [Google Scholar] [CrossRef]
  58. Gudasz, C.; Ruppenthal, M.; Kalbitz, K.; Cerli, C.; Fiedler, S.; Oelmann, Y.; Andersson, A.; Karlsson, J. Contributions of terrestrial organic carbon to northern lake sediments. Limnol. Oceanogr. Lett. 2017, 2, 218–227. [Google Scholar] [CrossRef]
  59. Hall, B.C.; Hesslein, R.H.; Emmerton, C.A.; Higgins, S.N.; Ramlal, P.; Paterson, M.J. Multidecadal carbon sequestration in a headwater boreal lake. Limnol. Oceanogr. 2019, 64, S150–S165. [Google Scholar] [CrossRef]
  60. von Wachenfeldt, E.; Tranvik, L.J. Sedimentation in boreal lakes—The role of flocculation of allochthonous dissolved organic matter in the water column. Ecosystems 2008, 11, 803–814. [Google Scholar] [CrossRef]
  61. Ferland, M.-E.; Prairie, Y.T.; Teodoru, C.; del Giorgio, P. A Linking organic carbon sedimentation, burial efficiency, and long-term accumulation in boreal lakes. J. Geophys. Res. Biogeosci. 2014, 119, 836–847. [Google Scholar] [CrossRef]
  62. De Jonge, C.; Dubois, N.; Ladd, S.N.; Deng, L.; Gajendra, N.; Haghipour, N.; Schubert, C.J.; Lever, M.J. Holocene environmental change in Rotsee and its impact on sedimentary carbon storage. J. Paleolimnol. 2025, 73, 311–327. [Google Scholar] [CrossRef] [PubMed]
  63. Molot, L.A.; Dillon, P.J. Storage of terrestrial carbon in boreal lake sediments and evasion to the atmosphere. Globa Geochem. Cycles 1996, 10, 483–492. [Google Scholar] [CrossRef]
  64. McGowan, S.; Anderson, N.J.; Edwards, M.E.; Langdon, P.G.; Jones, V.J.; Turner, S.; van Hardenbroek, M.; Whiteford, E.; Wiik, E. Long-term perspectives on terrestrial and aquatic carbon cycling from palaeolimnology. Water 2016, 3, 211–234. [Google Scholar] [CrossRef]
Figure 1. (A): As the watershed was developed it was disturbed by harvest–slashburn, wildfire, and land clearing. Lake levels were raised 3 times. The influence of fire and erosional disturbances at varying distances from the location of the sediment core was examined. (B): Stands established during the watershed pre-development period, presumably after fire, occur at varying distances from the sediment core location.
Forests 16 01549 g001aForests 16 01549 g001b
Figure 2. Pb-210 age–depth relationship determined using a constant rate of supply model (dots) and a smoothing spline (line).
Forests 16 01549 g002
Figure 3. Chromatogram from (a) a 20.0 cm depth sample over (b) a blank chromatogram, with compounds of interest. Terrestrial marker compounds (green): (1) 2-methoxyphenol, (2) 3-ethyl-2-methoxyphenol, (4) 2-methoxy-4-vinylphenol, (5) vanillin, (6) 2-methoxy-4-(1-propenyl)-phenol, (7) apocynin, (9) 1-(4-hydroxy-3-methoxyphenyl)-2-propane, and (10) diketodipyrrole. Algal marker compounds (blue): (3) indole, (8) pentadecane, and (11) nonadecane.
Forests 16 01549 g003
Figure 4. Variations in (A) charcoal fragment flux and fire events area (ha) at different distances from the core location, (B) magnetics and land-clearing area (ha) near- and far-shore events, and (C) magnetics and precipitation events during watershed development from 1910 to 2012.
Forests 16 01549 g004
Figure 5. Variations during watershed development from 1910 to 2012 in (A) C/N, δ15N, δ13C, and volumetric total carbon (C) concentrations from 1910 to 2014, (B) pyGC-MS integrated signal counts for all and known C compounds and number (#) of known compounds, (C) terrestrial and algal markers as % of known compounds’ integrated signal counts, and (D) terrestrial (upper panel) and algal (lower panel) volumetric C concentrations (g C cm−3) using 8 (Tm8) or 3 (Tm8c3) terrestrial markers.
Forests 16 01549 g005
Figure 6. Fire events (ha), charcoal total area flux (mm2 cm−2 yr−1), charcoal fragments flux (number cm−2 yr−1), magnetic susceptibility (SI), dry bulk density (B.D.) (g cm−3 ), total N flux (g cm−2 yr−1), total C flux (g cm−2 yr−1 ), δ15N, δ13C, terrestrial (three marker Tm8c3) C flux (g cm−2 yr−1), and algal C flux (g cm−2 yr−1) from 1770 to 2012, the period spanning the entire core record. Solid lines denote the 4 major zones from CONISS which did not include fire events and charcoal area in the analysis. The dashed line at 1910 denotes the onset of watershed development disturbances. Fire events in the pre-development period, 1770–1910, are denoted with triangles, with width indicating the range in possible years of origin and height indicating the area of stands originating during a period.
Forests 16 01549 g006
Figure 7. CBM-CFS3-generated annual DOC fluxes (Mg C yr−1) from three combined catchments (dashed lines), cumulative total DOC transfers from the entire watershed (Mg C) (solid line), and estimates of cumulative terrestrial (three marker Tm8c3) and algal (three marker Am8c3) carbon fluxes (Mg C) (bars) in reservoir sediments over the 1910–2014 period. The values in brackets after each combined catchment indicate the percentages of the aboveground (AG) and belowground (BG) decaying humified soil organic C that is emitted as CO2 to the atmosphere, with the rest exported as DOC.
Forests 16 01549 g007
Table 1. Descriptions of disturbance groups associated with fire, erosion, or fire and erosion listed in Figure 1A and used in the CBM-CFS3 model.
DisturbanceDescriptionAgent
WildfireHuman-caused fireFire
WildfireWildfireFire
WildfirePre-1910 stand establishment presumed after fireFire
SlashburnResidual pile burn post-loggingFire
SlashburnBroadcast (slash) burn post-loggingFire
SlashburnPile burn and ash trucked outFire
Partial BurnPartial burnFire
Land ClearingClearcut logging for transmission lineErosion
Land ClearingLand-clearing loggingErosion
Land ClearingLand-clearing logging with biomass exportErosion
Land ClearingLand-clearing logging with pile burnFire and Erosion
Land ClearingLand-clearing logging for road or rail right-of-wayFire and Erosion
Land ClearingLand-clearing logging with broadcast (slash) burnFire and Erosion
Table 2. Comparisons by location and sediment sequence period of (a) percentages of sediment total organic C that is terrestrial C, (b) total organic carbon accumulation rates (OCARs) in sediment, (c) terrestrial OCARs in sediment, and (d) percentages of watershed C transferred to lake sequestered in sediment. No.—number of lakes or watersheds sampled.
Location and PeriodNo. ValueDescriptionReference
(a) Terrestrial C % of Total C
SLR 1911–2012143 (Tm8c3) to 63 (Tm8)Coastal Pacific reservoirThis study
SLR 1990–2012127 (Tm8c3) to 43 (Tm8)Coastal Pacific reservoirThis study
SLR 1770–1910148 (Tm8c3) to 70 (Tm8)Coastal Pacific lake 1This study
Sweden 2015 1 cm and 5 cm1266 (range 46–80)Boreal lowland, arctic lakes[58]
Canada, Ontario 1971–2010192Boreal headwater lake[59]
Sweden, 2004–20051250 to 70Boreal lake surface sediment[60]
(b) Total OCAR gC m−2 yr−1
SLR 1911–2012113.08Coastal Pacific reservoirThis study
SLR 1770–1910118.9Coastal Pacific lakeThis study
Canada, east Quebec115.29 (range 1.09–19.71)Boreal lake surface sediments[61]
Canada, east Quebec113.92 (range 1.15–8.02)Boreal lake deeper sediments[61]
Switzerland, 1921–2012185Perialpine lake soil erosion [62]
Switzerland, 1950–19701150Perialpine lake eutrophication[62]
Switzerland, ca. 834–1100125Perialpine low impact[62]
N. America, <19001019.5 ± 0.5101 northern lakes[56]
N. America, 1900–195010112.4 ± 0.8101 northern lakes[56]
N. America, 1950–201510115.0 ± 0.8101 northern lakes[56]
Canada, Ontario 1890–2005805 to 40Boreal remote or impacted lakes[57]
(c) Terrestrial OCAR gC m−2 yr−1
SLR 1911–201215.77 (Tm8c3) to 8.34 (Tm8)Coastal Pacific reservoirThis study
SLR 1770–191018.97 (Tm8c3) to 13.2 (Tm8)Coastal Pacific lakeThis study
Sweden, 2004–2005 1255 ± 44Boreal lake surface sediment[60]
(d) Watershed C transferred % sequestered in sediment
SLR 1911–2012111 (Tm8c3) to 17 (Tm8)Coastal Pacific watershedThis study
Canada, Ontario 1971–2010137 (wDOC) 2Boreal headwater[59]
Canada, Ontario 12 yr < 19962027 to 47 Boreal catchments[63]
Note: 1 Reflects the natural lake that existed prior to development of the reservoir; 2 wDOC = % DOC input to lake that is terrestrial runoff (92% ± 1%) × % lake DOC buried in sediment (40% ± 3%).
Disclaimer/Publisher’s Note: The statements, opinions and data contained in all publications are solely those of the individual author(s) and contributor(s) and not of MDPI and/or the editor(s). MDPI and/or the editor(s) disclaim responsibility for any injury to people or property resulting from any ideas, methods, instructions or products referred to in the content.