Article

The Climate–Fire–Carbon Nexus in Tropical Asian Forests: Fire Behavior as a Mediator and Forest Type-Specific Responses

1
Guangdong Academy of Forestry, Guangzhou 510520, China
2
Zhangzhou Institute of Technology, Zhangzhou 363000, China
3
College of Visual Arts, Changchun Sci-Tech University, Changchun 130600, China
*
Author to whom correspondence should be addressed.
These authors contributed equally to this work.
Forests 2025, 16(10), 1544; https://doi.org/10.3390/f16101544
Submission received: 28 August 2025 / Revised: 28 September 2025 / Accepted: 3 October 2025 / Published: 6 October 2025
(This article belongs to the Section Natural Hazards and Risk Management)

Abstract

Forest fires significantly impact the global climate through carbon emissions, yet the multi-scale coupling mechanisms among meteorological factors, fire behavior, and emissions remain uncertain. Focusing on tropical Asia, this study integrated satellite-based fire behavior products, meteorological datasets, and emission factors, and employed machine learning together with structural equation modeling (SEM) to explore the mediating role of fire behavior in the meteorological regulation of carbon emissions. The results revealed significant differences among vegetation types in both carbon emission intensity and sensitivity to meteorological drivers. For example, average gas emissions (GEs) and particle emissions (PEs) in mixed forests (MF, 323.68 g/m2/year for GE and 0.73 g/m2/year for PE) were approximately 172% and 151% higher, respectively, than those in evergreen broadleaf forests (EBF, 118.92 g/m2/year for GE and 0.29 g/m2/year for PE), which exhibited the lowest emission intensity. Mixed forests and deciduous broadleaf forests exhibited stronger meteorological regulation effects, whereas evergreen broadleaf forests were comparatively stable. Temperature and vapor pressure deficit emerged as the core drivers of fire behavior and carbon emissions, exerting indirect control through fire behavior. Overall, the findings highlight fire behavior as a critical link between meteorological conditions and carbon emissions, with ecosystem-specific differences determining the responsiveness of carbon emissions to meteorological drivers. These insights provide theoretical support for improving the accuracy of wildfire emission simulations in climate models and for developing vegetation-specific fire management and climate adaptation strategies.

1. Introduction

Forest fires are pivotal disturbances in global ecosystems and a significant component of the carbon cycle, affecting both the structure and function of regional ecosystems, while also contributing to global climate change through carbon emissions [1,2]. In recent years, escalating global warming and an increased frequency of extreme climatic events have led to a marked rise in forest fire frequency and intensity [3,4]. According to the Global Fire Emissions Database (GFED4s), from 1997 to 2016, global fires emitted approximately 2.2 (1.8–3.0) Pg C per year, making them a significant source of anthropogenic and natural disturbances in the global carbon cycle [5]. The ecological impacts, extent of forest fire-affected area, and associated carbon emissions are highly variable, influenced by diverse biophysical factors and vegetation types [6].
The quantification of fire emissions typically relies on dynamic characterization of fire intensity, forest fuel load, combustion efficiency, and other parameters [7,8,9]. Among these factors, fire behavior is a key mediator between meteorological conditions and carbon emissions, describing dynamic processes such as flame geometry (e.g., flame height, length, and angle) and fire spread rate [10,11,12]. Fire intensity and fire severity are two important indicators of fire behavior. While sophisticated fire spread models exist for virtual environments and risk assessment [13,14], a comprehensive empirical understanding of the multi-scale driving mechanisms of real-world fire behavior, particularly how meteorological factors modulate these behaviors to influence carbon emissions, remain largely underexplored within an integrated ecological framework [15].
Previous studies have shown that meteorological factors play an important role in the occurrence and spread of fires, mainly by altering processes such as fuel moisture content and wind speed/direction within forests, which influence fire development and behavior [16,17,18,19,20]. For example, rising temperatures reduce fuel moisture, accelerating fire spread; vapor pressure and relative humidity primarily affect combustion duration and efficiency; and drought severity and solar radiation reflect fuel flammability and energy input, which are key variables for assessing fire intensity in relation to environmental conditions [20,21,22]. Despite these foundational understandings, existing research often adopts simplified approaches, such as relying on empirical correlations, or focus on specific regional contexts, thereby potentially overlooking the complex, non-linear interactions and critical mediating pathways [1,23,24,25]. More critically, a comprehensive and integrated understanding of the multi-scale coupling mechanisms among meteorological factors, fire behavior, and carbon emissions remains largely elusive, particularly regarding their variability across diverse tropical forest types. Specifically, a significant research gap lies in the lack of studies that comprehensively integrate meteorological drivers, fire behavior as a mediating factors, and subsequent carbon emissions into a unified framework to assess their direct and indirect impacts, especially considering the distinct heterogeneity among tropical forest types. Furthermore, existing models often simplify the complex non-linear relationships between meteorological factors and fire behavior and largely overlook the crucial mediating role of fire behavior in the process of meteorologically driven emissions. The critical importance of ecosystem-specific responses is increasingly recognized. A recent global carbon emission inventory, for instance, explicitly confirmed that forest types such as evergreen broadleaf, deciduous and mixed forests display unique emission patterns, underscoring the necessity of treating them distinctly in emission estimations [9]. However, while such studies confirm that these patterns differ, their analysis often does not extend to a quantitative evaluation of the full meteorological-fire-emission cascade [26]. Similarly, detailed mechanistic studies are frequently confined to single ecosystem types or specific regions [24]. Consequently, a robust, quantitative evaluation of the intensity and sensitivity of these meteorological–fire–emission relationships across a spectrum of tropical forest types is conspicuously absent in the literature [1,9].
This deficiency presents a significant research gap. Without a nuanced, integrated understanding of these coupled mechanisms and their ecosystem-specific heterogeneity, current fire emission models may lack accuracy, undermining effective fire management and robust climate change mitigation strategies, particularly in highly vulnerable tropical regions. Our study aims to fill this critical gap by systematically investigating the intricate relationships among meteorological factors, fire behavior, and carbon emissions across various tropical forest types in tropical Asia, a region characterized by diverse climatic conditions and vegetation highly susceptible to fire. This clarification is essential for improving fire risk management and formulating scientific strategies to cope with climate change.
Building on the aforementioned background, this study addresses two central scientific questions: (a) What are the key meteorological factors influencing fire behavior and subsequent carbon emissions, and how does fire behavior mediate these meteorological effects across tropical forest types? (b) How do the intensity and sensitivity of these meteorological–fire–emission relationships vary among different tropical forest types, and what implications do these variations have?
To answer these questions, we focus on tropical Asia, integrating MODIS fire behavior products (Fire Radiative Power, FRP; Brightness Temperature, BRI), Climatic Research Unit gridded Time Series (CRU TS) high-resolution meteorological data, and emission factor data (GFED4.1s). We employ a robust analytical framework combining Random Forest modeling for identifying key meteorological drivers, Local Sensitivity Analysis for assessing response variations, and Structural Equation Modeling (SEM) to disentangle the direct and indirect (mediated by fire behavior) effects of meteorological factors on carbon emissions. This multi-method approach allows for a comprehensive evaluation of the coupled mechanisms and response heterogeneity across different tropical forest types. The ultimate goal of this study is to quantify these complex relationships, deepen the theoretical understanding of tropical fire ecology, and emphasize the unique response patterns of different vegetation types to climate change and fires, particularly highlighting the crucial mediating role of fire behavior.

2. Materials and Methods

2.1. Study Area

Tropical Asia represents one of the most significant global hotspots for biodiversity and carbon sequestration. The study area was delineated using the Köppen–Geiger climate classification [27] and the Intact Forest Landscapes dataset (Figure 1). This delineation focuses on intact tropical forest ecosystems that are both climatically homogeneous and ecologically significant. The region is characterized by an equatorial rainforest climate, with mean annual precipitation generally exceeding 2000 mm, mean monthly temperatures remaining above 18 °C throughout the year, and the absence of a clearly defined dry season [27].
Forest fires—particularly peatland fires during El Niño years—exert a substantial influence on the regional carbon budget. For example, during the 1997–1998 El Niño event, approximately 24,400 km2 of peatlands in Indonesia were burned, releasing an estimated 0.81–2.57 Gt of carbon, equivalent to 13%–40% of global fossil fuel emissions in that year [28]. In September–October 2015, widespread fires across Southeast Asia released approximately 289 Tg of carbon [29]. These emissions not only contribute substantially to the regional carbon balance but also drive transboundary haze pollution events with profound societal impacts.
Beyond their contribution to carbon emissions, these fires also pose severe threats to air quality and public health. During the peatland fire episodes in Indonesia in 2019, nearly one million individuals were diagnosed with acute respiratory infections, coinciding with sharp increases in PM2.5 concentrations and elevated hospitalization rates in urban areas [30].
The intersection of climate variability, anthropogenic ignition, and land-use change renders Tropical Asia a complex and high-risk region in terms of carbon emissions, air pollution, and ecosystem degradation. Consequently, elucidating the meteorological factors–fire behavior–emission nexus in this region is essential for anticipating forest carbon dynamics and informing effective fire management and climate adaptation strategies.

2.2. Data Sources

2.2.1. Vegetation Type Data

The vegetation type data were obtained from the ERA5 reanalysis dataset provided by the Copernicus Climate Data Store (CDS) (https://cds.climate.copernicus.eu/ (accessed on 10 May 2025)). This parameter indicates the dominant high-vegetation type as defined by the ECMWF Integrated Forecasting System and remains temporally invariant. In this study, the tropical Asian region was considered, where four vegetation categories were identified: deciduous broadleaf forest (DBF, code 5), evergreen broadleaf forest (EBF, code 6), mixed forest/woodland (MF, code 18), and interrupted forest (IF, code 19). These vegetation classes are commonly applied in modeling surface energy balance, snow albedo, and related land–atmosphere interactions.

2.2.2. Meteorological Data

Taking into account the influence of climatic conditions on atmospheric pollution transport processes and wildfire dynamics, we incorporated several key meteorological indicators, including mean annual temperature (TMP), mean annual diurnal temperature range (DTR), Palmer Drought Severity Index (PDSI), vapor pressure (VAP), surface solar radiation (SSR), wind speed (WS), cloud cover (CLD), and relative humidity (RHair) [3,31].
In this study, monthly TMP, DTR, CLD, and VAP data were obtained from the Climatic Research Unit gridded Time Series (CRU TS) with a spatial resolution of 0.5° from 2003 to 2022. Monthly SSR and WS data were extracted from the ERA5 reanalysis dataset, while RHair was derived from the HADCM3 dataset. To ensure temporal consistency, all monthly datasets were aggregated into annual raster layers using the Cell Statistics tool in ArcGIS 10.8. The basic information of these datasets is summarized in Table 1.
To quantify drought conditions, we employed the Palmer Drought Severity Index (PDSI), which integrates precipitation (P) and potential evapotranspiration (PET) to characterize long-term soil moisture anomalies. Following Wells et al. [32], the PDSI was calculated using the R package scPDSI (version 4.4.2). In this procedure, monthly moisture deficit (MD) was defined as the difference between P and PET (MD = P − PET), and the cumulative deficit (MD_total) was calculated as the sum of the current month and the previous month’s deficit. The index was then standardized using a calibration coefficient (k = 0.05), as recommended in previous studies [32], ensuring comparability across regions. To facilitate interpretation, the PDSI values were further normalized to a range of −4 to 4, consistent with conventional classification schemes for drought severity [33]. Finally, the resulting annual PDSI values were generated for spatial analysis.

2.2.3. Fire Behavior Data

In this study, FRP and BRI produced by active fires are used to represent fire intensity and fire severity. Paudel and his colleagues used the FRP and BRI of active fire production to characterize fire intensity and fire severity [34]. These active fire products were derived from the MOD14 and MYD14 datasets, which have a spatial resolution of 1 km and are, respectively, provided by the Aqua and Terra satellites [35,36]. The MODIS Fire and Thermal Anomalies products (MOD14/MYD14) identify active fires based on their emitted thermal radiation. FRP is derived by integrating the radiance observed in the 4 µm channel (channel 21/22) over the area of the fire, accounting for atmospheric attenuation and background radiation. BRI is the Plank-equivalent temperature of detected thermal anomalies in the relevant infrared channels. To ensure that the data met the research requirements and accuracy standards, we screened the fire points from the active fire products for the study period (2017–2022) and further confirmed the global fire points used to generate the FRP and BT raster data based on the conditions “confidence > 30” (i.e., medium and high confidence fire points) [36] and “type = 0” (vegetation fire type) [7]. We then applied inverse distance weighting (IDW) interpolation to generate two sets (based on Aqua and Terra) of raster data with a spatial resolution of 0.05° for the FRP and BRI data. IDW was chosen because it is a local interpolation method that is particularly suitable for handling local hotspot data, such as active fires. Following existing studies, we set the interpolation parameters to a search radius of 12 pixels and a weight exponent of 2, which balances local hotspots and regional trends and better reflects the impact of local hotspots [37]. Finally, we averaged the interpolation results based on Aqua and Terra to obtain annual-scale FRP and BRI raster data for 2017–2022 and extracted these data to the sample points. These operations were performed in ArcGIS.

2.2.4. Fire Emission Dataset

In this study, we utilized the global fire emission data provided by the GFED4.1s (https://www.globalfiredata.org/ (accessed on 5 December 2024)). This data is based on the Carnegie–Ames–Stanford Approach (CASA) biogeochemical model, which integrates satellite observations of burned area, vegetation type, meteorological data, and combustion completeness [5]. It offers global fire emission data at 3-hourly, daily, and monthly time resolutions, with a spatial resolution of 0.25°, available since 1997. GFED is one of the most widely used fire emission datasets in global fire emission research over the past decade [36,38]. Nonetheless, the GFED notes that data from 2017 onwards, which included small fire burned areas, are overall more reliable than data before 2016, reflecting actual fire emissions [5]. We first obtained the dry matter combustion (DM) raster data from the GFED4.1s dataset (unit: kg/m2/month); subsequently, we obtained the corresponding emission factors from the “GFED4_Emission_Factors” file. These factors provide emission data for CO2, CO, CH4, NMHCs, OC, and BC according to different ecosystems (such as savannas, boreal forests, peatlands, etc.). Then, we converted the dry matter burned into the emission quantities of various emission factors (in g species/kg dry matter burned) using the following calculation method:
Especies (x, y, year) = EFspecies × DM (x, y, year) × Contr (x, y, year)
where Especies is the emission quantity; EFspecies is the emission factor; DM is the dry matter burned; Contr represents the contribution from different sources (such as grassland fires, peatland fires, etc.); x and y represent the longitude and latitude coordinates; and year represents the year.
Finally, we converted the GFED data from raster format to point data and spatially clipped it according to the vector data of the study area to extract sample points within it. Subsequently, we extracted the annual-scale emission data to these sample points, providing a reliable data foundation for subsequent analysis of fire emission characteristics. To facilitate integrated analysis and ensure spatial comparability, all heterogeneous datasets used in this study were carefully harmonized to a consistent spatial resolution. Specifically, data from various native resolutions, including CRU (0.5°), ERA5 (0.25°), MODIS (1 km for fire products), and GFED (0.25°), were re-sampled to a common grid of 0.1° × 0.1°. Van der Werf et al. [5], when estimating fuel carbon consumption using the GFED4.1s dataset, summed the emission factors of CO2, CO, and CH4 to estimate total fuel carbon loss. This provides a methodological basis for our approach of aggregating the gaseous components (CO2, CO, CH4, NMHC) to assess total gaseous carbon emissions. In addition, other studies have explicitly defined total carbon emissions as the sum of CO2, CO, CH4, OC, and BC, thereby providing theoretical support for the aggregation method applied to particulate carbon [38].

2.3. Statistical Analysis

2.3.1. Correlation Analysis

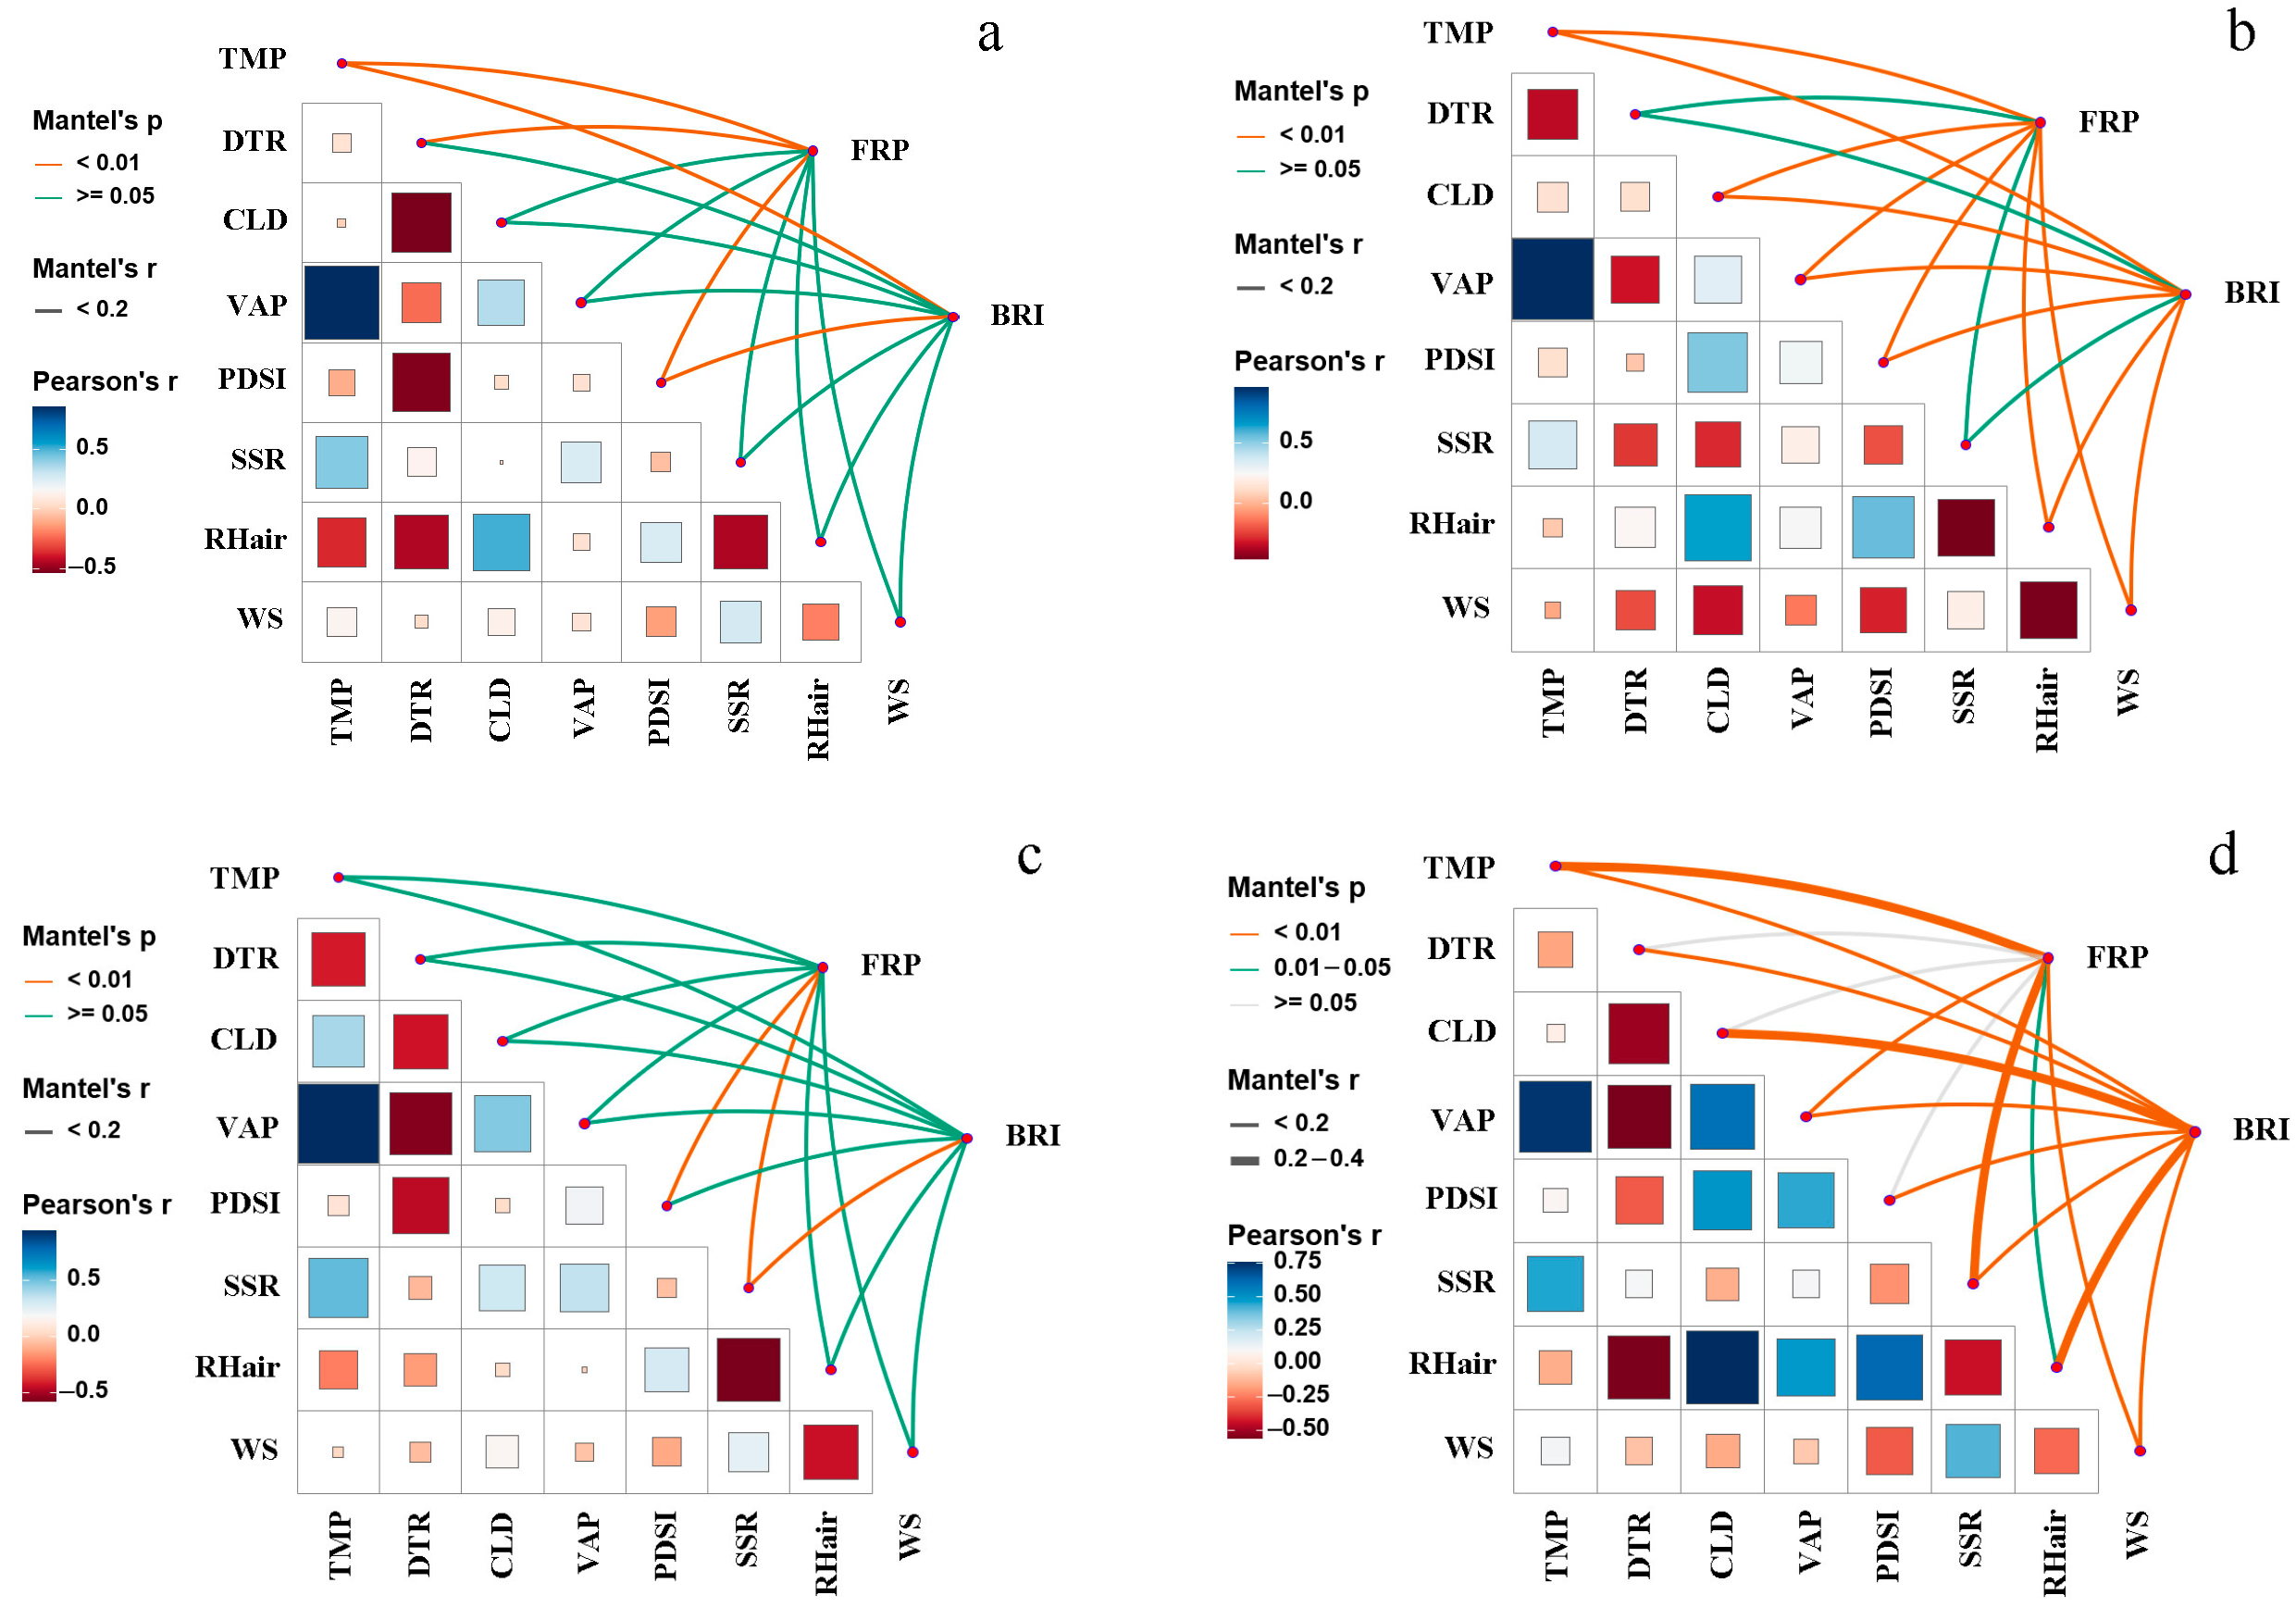
To assess the spatial correlation between fire behavior indices and meteorological factors, the Mantel test was employed. The Mantel test is a permutation-based, non-parametric method commonly used in ecological studies to evaluate the correlation between two distance matrices, thereby revealing the spatial structure of the relationship between environmental gradients and response variables. Specifically, fire behavior data and meteorological data were first transformed into distance matrices. The Mantel function in the vegan package in R was then used to compute the correlation between the two matrices, and significance was tested using permutation tests. This method provides a comprehensive evaluation of the relationship between fire behavior and meteorological factors, along with statistical reliability.

2.3.2. One-Way ANOVA

To examine whether differences in carbon emissions among vegetation types were statistically significant, one-way analysis of variance (ANOVA) was conducted, with a significance threshold set at p < 0.05. ANOVA was performed using the aov() function in the R program, and post hoc pairwise comparisons were conducted using the LSD method to further identify which vegetation types exhibited significant differences in carbon emissions.

2.3.3. Random Forest

To identify key meteorological factors affecting forest fire carbon emissions and assess their relative importance, a regression model was constructed using the Random Forest (RF) algorithm. RF is a non-parametric ensemble learning method that effectively handles multivariate non-linear relationships and multicollinearity among variables. It is widely used in fire behavior modeling and ecological variable selection [37,39].
In this study, the response variables were the gas emissions (GE) and particle emissions (PE) from fire carbon emissions, with meteorological factors including TMP, DTR, CLD, VAP, PDSI, SSR, RHair, and WS as explanatory variables. The model was built in the R program using the randomForest package (ntree = 2000) (version 4.4.2), with the variable importance output set to importance = TRUE. The varImpPlot() function was used to visualize the contribution of each variable to the emission levels.
To further assess the statistical significance of variable importance, the rfPermute package was used to conduct permutation tests. Specifically, the explanatory variables and response variables were randomly shuffled, and the RF model was retrained 100 repetitions (nrep = 100). For each permutation, the “%IncMSE” value was computed for each variable under random conditions. The significance of each variable was evaluated by comparing its observed importance to its permutation distribution, calculating the p-value to determine whether its importance was statistically higher than the random level.
Models were constructed separately for gas and particle emissions, with parallel computing (using doParallel and makeCluster) employed to improve computational efficiency. The results not only identify the primary driving factors but also provide a basis for variable selection in sensitivity analysis, enhancing the model’s interpretability and statistical robustness.

2.3.4. Local Sensitivity Analysis

To further evaluate the response sensitivity of the fire emission system to meteorological factors, a local sensitivity analysis (LSA) was conducted based on Random Forest modeling. LSA quantifies the impact of perturbations to key driving factors on fire carbon emissions, thereby identifying sensitive components of the system in response to climate disturbances [40,41].
The sensitivity analysis was based on variables that were significantly important (p < 0.05) in the RF model after permutation testing. A One-At-a-Time (OAT) method was used for local simulation. Specifically, each meteorological variable was perturbed by ±10% while keeping other variables constant, and the changes in predicted emissions before and after the perturbation were recorded. The sensitivity coefficient (S) was defined as
S = Δ Y / Y Δ X / X
where ΔY is the relative change in predicted emissions after the perturbation, and ΔX is the perturbation magnitude (±10%) of the input variable. A higher S value indicates greater control of the meteorological factor over fire carbon emissions.
To explore potential asymmetries in the perturbation direction, sensitivity coefficients were calculated for both +10% and −10% perturbations, and the results were visualized using bar plots.

2.3.5. Structural Equation Model

We employed SEM to examine the indirect effects of meteorological factors on fire emissions through fire behavior and to identify differences in path effects across vegetation types. SEM allows for the simultaneous analysis of multiple causal relationships and the interactions between observed and latent variables, thereby disentangling direct and indirect linkages within complex ecological systems. It has been widely applied in fields such as climate change, ecological processes, and carbon cycling [37,42,43].
To ensure the scientific and interpretable nature of the path structure, this study prioritized meteorological driving factors that had significant contributions to fire behavior and carbon emissions (p < 0.05) based on the results of the previous Random Forest analysis and permutation tests. These factors were combined with sensitivity analysis to determine their perturbation sensitivity and used as exogenous variables in the SEM. Fire behavior indices (FRP, BRI) were set as mediator variables, and fire carbon emissions (GE and PE) were treated as endogenous variables, representing the coupled relationship between meteorological factors–fire behavior–carbon emissions. The hypothesized paths included direct effects of the selected meteorological factors on fire behavior (FRP, BRI), and effects of fire behavior (FRP, BRI) on carbon emissions (GE, PE). Consequently, the indirect effects of meteorological factors on carbon emissions were estimated through the mediating roles of FRP and BRI.
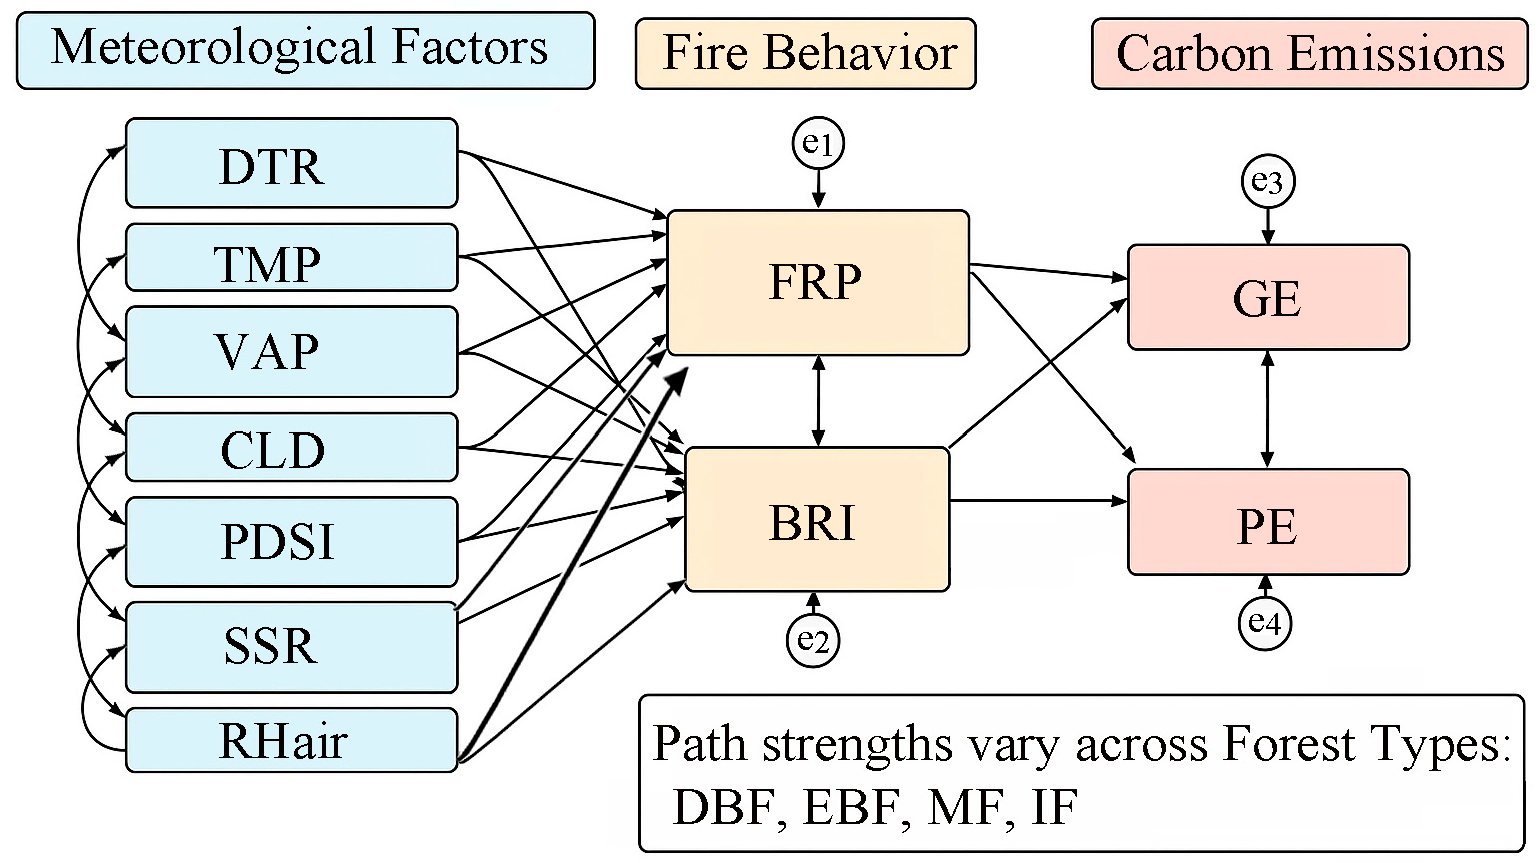
Model construction and fitting were performed in the R program using the lavaan and semPlot packages (version 4.4.2). Maximum likelihood estimation (MLE) was used for parameter estimation, and the root mean square error of approximation (RMSEA < 0.05), standardized root mean square residual (SRMR < 0.08), goodness-of-fit index (GFI > 0.90), comparative fit index (CFI > 0.90), and non-normed fit index (NNFI > 0.90) were used for model fitting evaluation [37]. To compare differences in the path strengths and moderating effects of meteorological drivers, fire behavior responses, and carbon emissions across different ecosystems, multiple SEMs were constructed based on vegetation type to reveal the heterogeneity of the mechanisms. A conceptual diagram illustrating the hypothesized paths and variable relationships within the SEM is presented in Figure 2.

3. Results

3.1. Correlation Between Fire Behavior and Meteorological Factors

We analyzed the correlations between fire behavior (FRP and BRI) and meteorological factors across four different vegetation types in tropical Asia, revealing the varying responses of wildfire behavior to meteorological changes in each forest type (Figure 3, Tables S1–S4). The results indicate that, in DBF, both FRP and BRI showed significant positive correlations with TMP (r = 0.084, p < 0.01), PDSI (r = 0.174, p < 0.01), and DTR (r = 0.044, p < 0.01). In EBF, FRP and BRI were not significantly correlated with DTR or SSR (p > 0.05), but both were positively correlated with other meteorological factors (p < 0.01). In MF, FRP was positively correlated with PDSI (r = 0.038, p < 0.01) and SSR (r = 0.046, p < 0.01), while BRI showed a significant positive correlation with SSR (r = 0.035, p < 0.01). In IF, both FRP and BRI were significantly positively correlated with TMP (r = 0.214, p < 0.01), VAP (r = 0.123, p < 0.01), SSR (r = 0.215, p < 0.01), RHair (r = 0.012, p < 0.05), and WS (r = 0.050, p < 0.01).
These findings suggest that TMP exhibits a significant positive correlation with fire behavior in DBF, EBF, and IF, with particularly strong effects in DBF and IF. PDSI shows a significant positive correlation with wildfire behavior in both DBF and EBF, although this relationship weakens in MF. Overall, the influence of meteorological factors on fire behavior varies significantly across vegetation types, reflecting strong structural dependence.

3.2. Impact of Fire Behavior on Carbon Emissions Across Different Vegetation Types

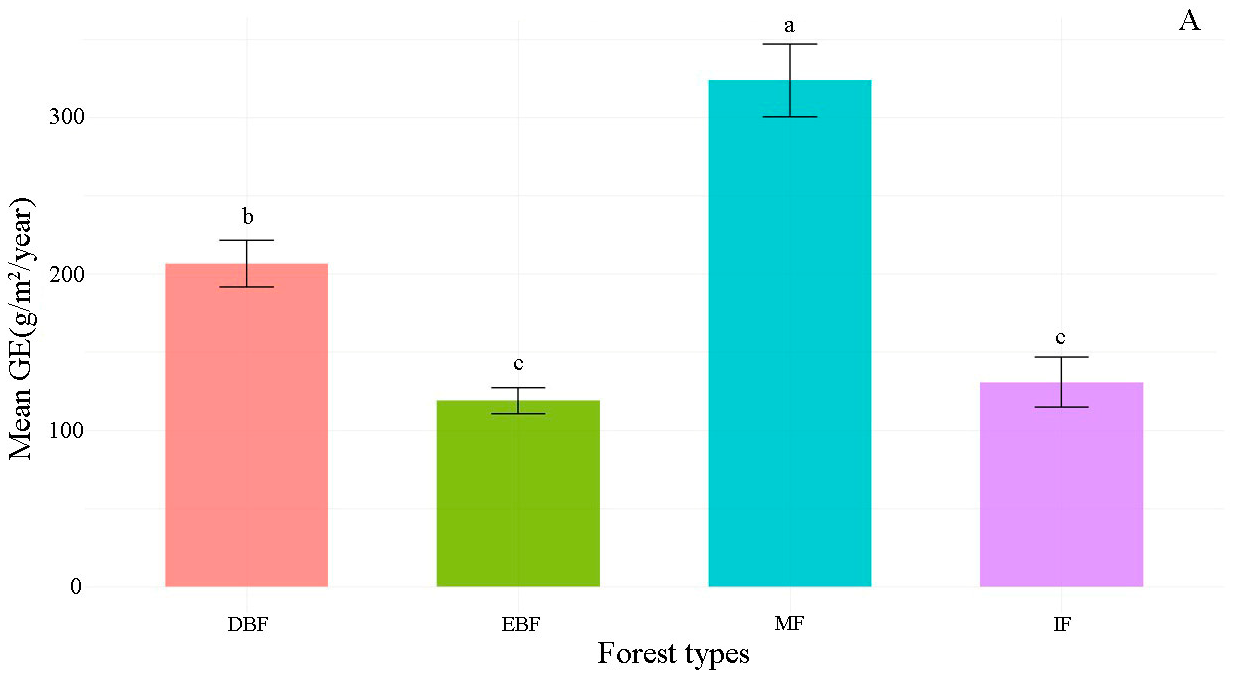
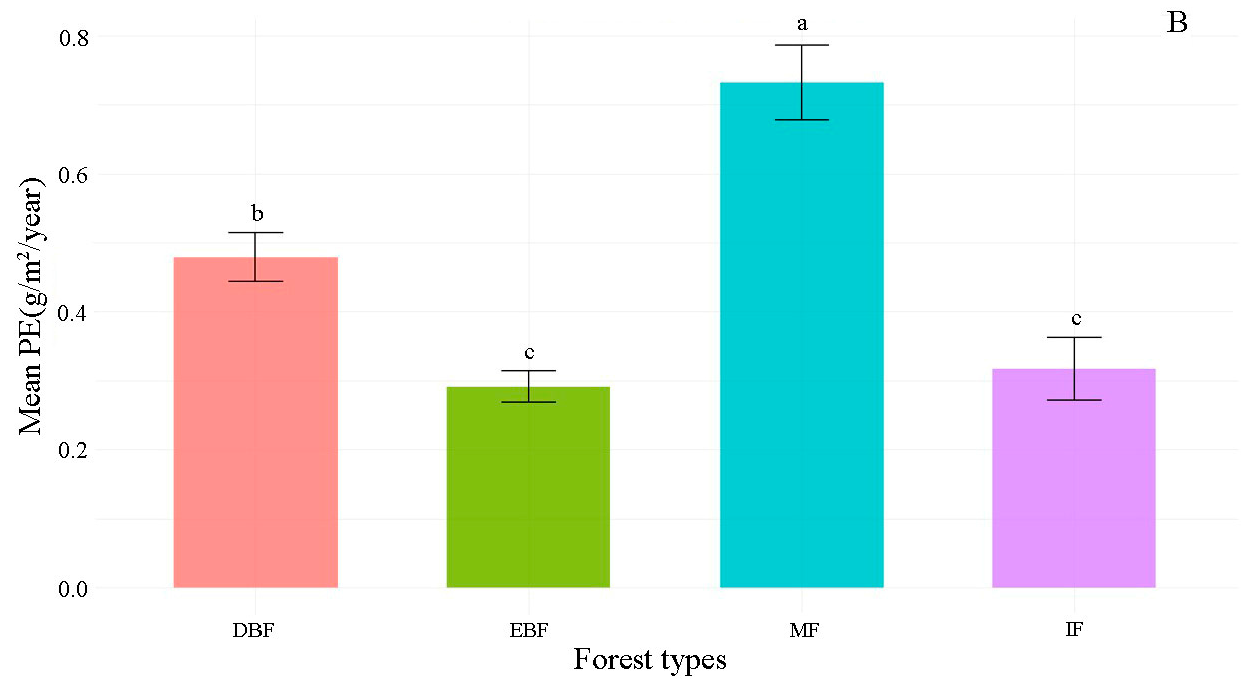
There were highly significant differences in GE and PE across the four vegetation types (p < 0.01), indicating a high degree of heterogeneity on the impact of fire behavior on carbon emissions. Analysis of variance (Figure 4) revealed that the emission intensity of GE and PE was consistent across vegetation types, with the highest emissions observed in MF (GE: 323.68 g/m2/year; PE: 0.73 g/m2/year), followed by DBF (GE: 206.46 g/m2/year; PE: 0.48 g/m2/year), IF (GE: 130.66 g/m2/year; PE: 0.32 g/m2/year), and EBF (GE: 118.92 g/m2/year; PE: 0.29 g/m2/year). This pattern suggests that the differences in carbon emissions are primarily driven by the complexity of the combustibility and chemical properties of the vegetation, the sufficiency of combustion conditions, and the microclimate regulation within each forest type.

3.3. Variable Selection Using RF

RF analysis highlighted distinct differences in the relative importance of meteorological variables for GE and PE across the four vegetation types (Figure 5). In DBF, GE was primarily influenced by TMP, VAP, CLD, and PDSI, whereas PE was mainly driven by TMP, DTR, PDSI, RHair, VAP, and CLD. In EBF, GE was most affected by DTR and CLD, and PE was also strongly influenced by DTR. In MF, RHair emerged as the most important predictor for both GE and PE, whereas SSR was the dominant factor in IF.
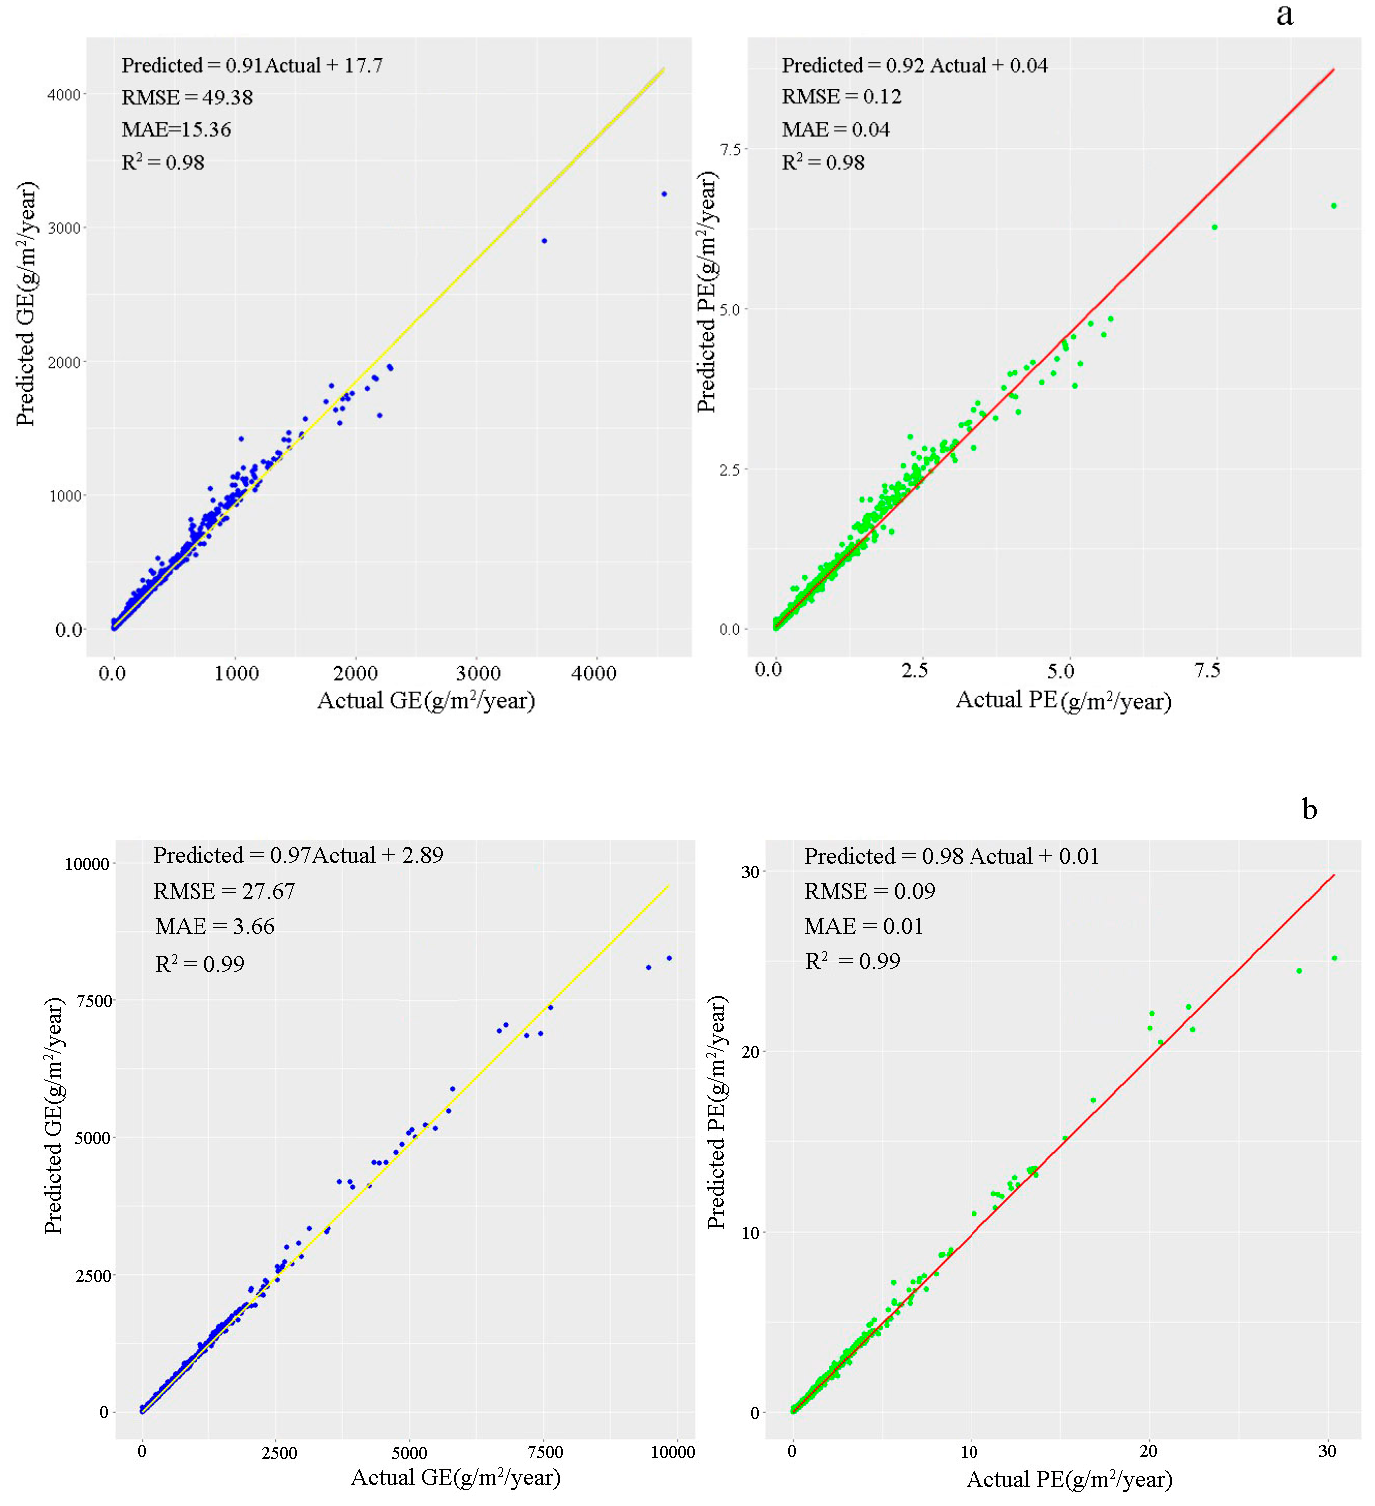
The model fitting results (Figure 6) further demonstrate high predictive accuracy across all vegetation types. In DBF, the predictions of GE and PE achieved R2 values of 0.95 and 0.98, respectively, with low RMSE values (49.38 g/m2/year and 0.12 g/m2/year). In EBF, both GE and PE reached R2 values of 0.99, with low RMSE values (27.67 g/m2/year and 0.09 g/m2/year). MF also performed well (R2 = 0.99, RMSE = 48.63 for GE and 0.13 for PE), while in IF, the predictions of both GE and PE exceeded R2 = 0.99, with low RMSE values (51.33 g/m2/year and 0.13 g/m2/year). Residuals remained small across all vegetation types, further supporting the robustness of the model.
Overall, these results indicate that RF provides stable and accurate predictions of GE and PE, while revealing substantial differences in the climatic drivers across forest types.

3.4. Sensitivity Analysis

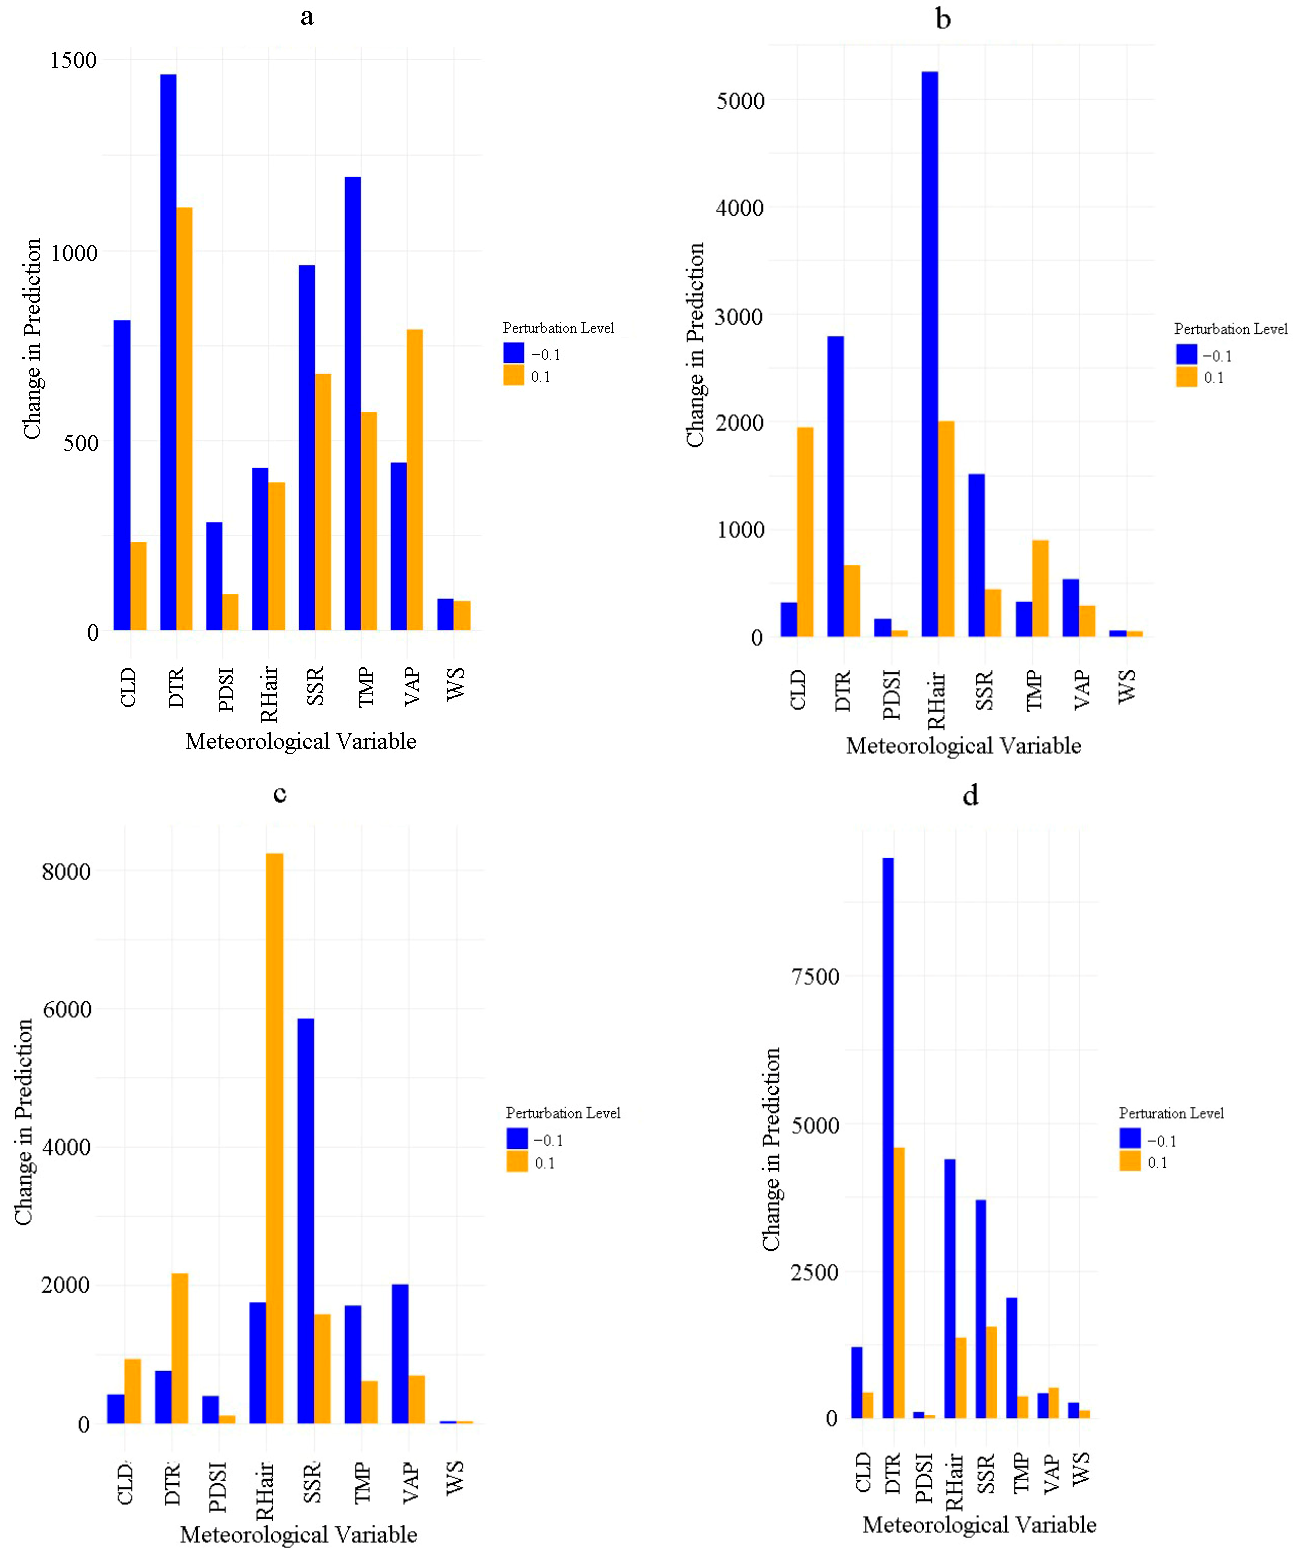
To further assess the stability of the model, a sensitivity analysis was conducted to quantify the response of GE and PE to changes in meteorological factors (Figure 7). In DBF, GE was most sensitive to variations in TMP, DTR, and PDSI, while PE exhibited the strongest response to changes in TMP and RHair, particularly under disturbances of ±0.1. In EBF, GE showed high sensitivity to changes in RHair and CLD, while PE was most strongly affected by changes in RHair and VAP. In MF, GE was most sensitive to variations in SSR and RHair, while PE was primarily influenced by SSR and TMP. In IF, GE was most sensitive to changes in SSR and DTR, whereas PE was mainly driven by changes in CLD and TMP.
Overall, the sensitivity analysis confirmed that the influence of different meteorological variables varied significantly across vegetation types and emission types.

3.5. Relationships Between Fire Behavior and Emissions

3.5.1. SEM Fitting Results

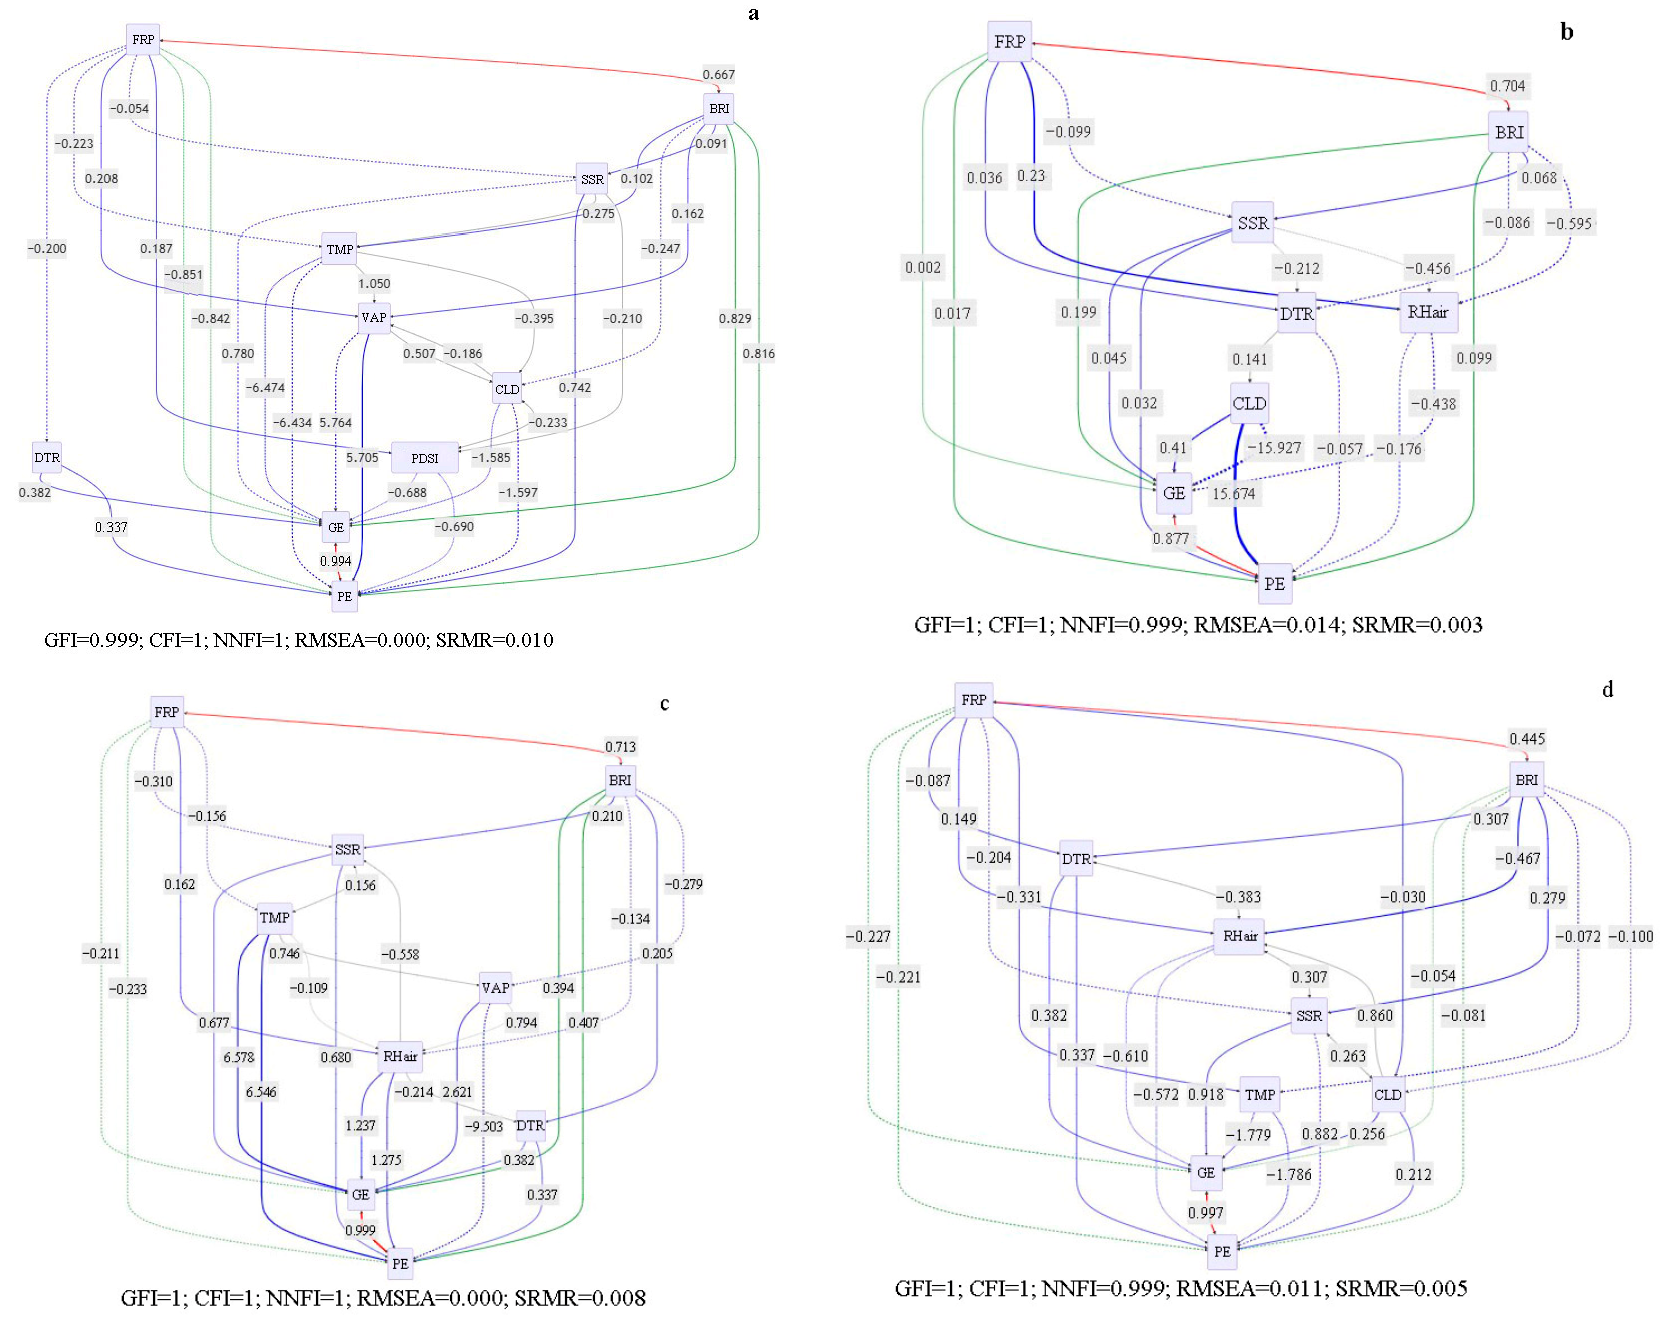
SEM incorporating both direct and indirect pathways achieved excellent fit (GFI and CFI = 1; RMSEA ≈ 0; SRMR < 0.01). Path coefficients highlighted vegetation-specific differences in how meteorological factors influenced GE and PE via fire behavior indicators.

3.5.2. Multidimensional Effects of FRP and BRI on Emissions

SEM partitioning of direct, indirect, and total effects (Figure 8) revealed contrasting roles of FRP and BRI. In DBF, FRP exerted strong negative total effects on GE (−0.853) and PE (−0.832), whereas BRI had strong positive effects (1.566 and 1.546). In EBF, FRP total effects were negative (−0.163 and −0.029), whereas BRI total effects were positive (0.463 and 0.211). In MF, FRP effects were negative (−1.754 and −1.772), whereas BRI exerted strong positive total effects (4.154 and 4.185). In IF, both FRP and BRI exerted negative direct effects on GE and PE, but positive indirect effects. In terms of total effects, FRP had effects of 0.139 on GE and 0.162 on PE, while BRI had effects of 0.369 on GE and 0.318 on PE.

3.5.3. Exploring the Mediating Effects of GE and PE in Fire Behavior

SEM revealed distinct pathways through which FRP and BRI influenced GE and PE across vegetation types (Table 2, Table 3, Table 4 and Table 5). In DBF, the effects of FRP and BRI on GE and PE were dominated by direct pathways. FRP had strong negative total effects on GE (−0.853) and PE (−0.832), almost all of which were attributable to direct effects (>99%). Although several meteorological variables were involved, the opposite mediating effects of TMP and VAP largely offset one another, resulting in near-zero net indirect effects. By contrast, BRI exerted strong positive effects on both GE (1.566) and PE (1.546), with indirect effects contributing nearly half of the total. Among the mediators, VAP accounted for about 60% of the indirect effect, indicating its dominant role in mediating BRI’s influence. In EBF, indirect effects mediated through climatic factors predominated. FRP exerted almost no direct influence on GE or PE, but its indirect effects were mainly transmitted through RHair, with SSR providing additional contribution. Similarly, BRI effects were also largely mediated, with RHair consistently emerging as the key mediator. In MF, both FRP and BRI acted primarily through indirect pathways. FRP showed strong negative total effects on GE (−1.754) and PE (−1.772), more than 85% of which were mediated by meteorological factors, with TMP accounting for the largest share. Conversely, BRI exerted strong positive effects on GE (4.154) and PE (4.185), and these were overwhelmingly mediated by VAP, which explained about 63% of the total effect. In IF, indirect effects also dominated for both FRP and BRI, while direct effects were weak or even negative. FRP showed small positive total effects on GE (0.139) and PE (0.162), mainly transmitted through TMP and SSR. BRI displayed slightly stronger total effects on GE (0.369) and PE (0.318), mediated chiefly by RHair and SSR.
Taken together, these results demonstrate that FRP and BRI affected fire emissions via markedly different pathways depending on vegetation types. TMP and VAP mediated the key effects in DBF; RHair dominated in EBF; TMP and VAP were central in MF; TMP, SSR, and RHair jointly played critical roles in IF.

4. Discussion

4.1. Vegetation-Type Regulation of the Relationships Between Fire Behavior and Carbon Emissions

The relationships between fire behavior and carbon emissions varied substantially across vegetation types, with particularly pronounced contrasts between MF and DBF. As highlighted by Wang et al. [44], differences in fuel structure and fuel moisture content are the primary drivers of fire behavior variation across vegetation types. In this study, we observed significant differences in both GE and PE among the four vegetation types, with the highest emission intensity in MF and the lowest in EBF (Figure 4). These results are consistent with earlier findings [2,9]. EBF exhibited relatively “stable” carbon emission characteristics, primarily reflected in their lower average emission intensity and reduced sensitivity to typical fire-risk meteorological fluctuations. The elevated emissions in MF can be attributed to their complex stand structures, which combine both broadleaf and coniferous traits. High canopy bulk density reduces canopy ventilation, while ladder fuels facilitate crown fire development. Such conditions enhance combustion efficiency, accelerate fire spread, and consequently amplify GE and PE release [1,18]. By contrast, evergreen broadleaf forests, with their longer leaf longevity and relatively stable water status, exhibit weaker fire behavior and the lowest carbon emissions.
Vegetation types also exerted strong regulatory effects on the causal pathways linking fire behavior (FRP and BRI) to carbon emissions (GE and PE) (Figure 8; Table 2, Table 3, Table 4 and Table 5). In EBF, MF, and DBF, both direct and indirect effects of fire behavior on emissions were significant, reflecting the combined contributions of fire intensity and persistence. This may be explained by the diverse fuel compositions, structural heterogeneity, and microclimatic regulation within these forest types. In contrast, in IF, fire behavior influenced carbon emissions mainly through indirect pathways mediated by meteorological factors, highlighting the complexity of interactions and the dominant role of indirect mechanisms in this forest type. Furthermore, differences in fuel load, fuel moisture, and the spatial distribution of fuels were found to be decisive in shaping fire behavior [10,13,14]. For instance, the higher fuel moisture content and denser canopy structure of EBF tend to suppress fire spread rates, thereby reducing direct carbon emissions. Liu and Shi [9] similarly reported that in forests with canopy cover exceeding 85%, fire occurrence was generally reduced, leading to lower emissions. However, in MF, the coexistence of coniferous and broadleaf species creates a vertically stratified fuel structure. The presence of ladder fuels facilitates the ignition and spread of crown fire, making these forests more susceptible to severe carbon emissions [45,46]. Little et al. [17] further demonstrated that spatial heterogeneity in fuel moisture exerts significant control over fire behavior simulations, with fire spread rate varying considerably (23%–80%) in response to fuel moisture content.
From an ecosystem functioning perspective, vegetation type influences not only the immediate fire–emission relationship but also the long-term trajectories of post-fire succession, species composition, biomass recovery, and carbon balance, thereby altering the ecosystem’s carbon sink capacity [47]. Under the ongoing context of global warming, these vegetation-specific differences in fire–emission relationships should be given particular attention in order to design more targeted forest management and vegetation restoration strategies.

4.2. The Modulatory Role of Meteorological Factors in the Relationship Between Fire Behavior and Carbon Emissions

This study found that the regulatory effects of meteorological factors on the relationship between fire behavior (FRP, BRI) and carbon emissions (GE, PE) varied significantly across different vegetation types. Notably, in MF, the sensitivity of carbon emissions to RHair and SSR was the most pronounced (Figure 5 and Figure 7). This result aligns with findings from other biomes, such as Wiggins et al. [48] who highlighted that vapor pressure deficit (VPD) and temperature are key drivers of fire behavior and CO and CH4 emissions in boreal forests. Previous studies have shown that precipitation, temperature, and wind speed are critical meteorological factors influencing forest fire occurrence and development. High temperatures, low humidity, and strong winds enhance combustion efficiency and fire spread, thereby significantly increasing carbon emission flux [49,50,51,52].
In DBF and MF, TMP and VAP exhibited strong mediating effects, significantly enhancing the positive impact of fire behavior on GE and PE. This is primarily due to the fact that higher temperatures and vapor pressure deficit reduce fuel moisture content, increasing combustibility, which in turn intensifies the combustion process and promotes the generation of gaseous emissions. Conversely, in EBF, the mediating role of RHair was especially significant. This does not indicate emission instability but rather reflects its high sensitivity to changes in humidity conditions. As tropical EBFs typically maintain high relative humidity, their fire risk is generally low. However, once environmental humidity conditions decline due to meteorological changes (e.g., triggered by extreme drought), the sensitivity of EBF to RHair becomes prominent, leading to a more drastic increase in fire spread and intensity. Therefore, the “stability” of their emissions is contingent upon the sustained presence of high humidity, rather than a general insensitivity to humidity fluctuations. Higher relative humidity slows the spread of fires and reduces fire intensity, thus decreasing instantaneous carbon emissions and mitigating the risk of carbon loss from fires.
In IF, the synergistic regulatory effect of TMP, SSR, and RHair was found to be more complex. Due to the open terrain and abundant sunlight, surface temperature and radiation flux are highly influenced by daily variations, further altering fire behavior dynamics. This multi-meteorological-factor control mechanism suggests that carbon emissions during forest fires are not only influenced by fire behavior itself but are also highly constrained by the micro-environment within the forest. The regulatory role of meteorological factors exhibits cumulative effects over different time scales, shifting from short-term regulation to long-term driving forces, thereby becoming a critical component of the carbon emission feedback mechanism after forest fires [52,53].

4.3. Interactive Effects of Meteorological Factors and Vegetation Types on Fire Behavior and Carbon Emissions

Fire behavior, meteorological conditions, and carbon emissions form a typical coupled feedback system with profound implications for the carbon balance of forest ecosystems [50,54]. In this study, SEM revealed that FRP and BRI exerted distinct influences on GE and PE across different vegetation types, indicating that the impacts of fire on carbon emissions are jointly shaped by fire behavior characteristics, climatic conditions, and vegetation structure. High temperature and low humidity environments tend to increase the probability of extreme fire behavior, which not only accelerates combustion and elevates the proportion of gaseous emissions but may also shorten fire duration, thereby affecting both the temporal distribution and the magnitude of carbon emissions. In contrast, elevated BRI reflects more prolonged and persistent burning, often leading to larger-scale carbon losses and higher risks of carbon release from soils and litter layers.
These mechanisms carry long-term implications for ecosystem recovery and carbon storage. Fire carbon emissions are not limited to immediate release but may continue to rise through soil respiration, delayed vegetation regeneration, and litter decomposition. The increased fire frequency and intensity may further suppress the carbon sink capacity of forests and, in some cases, shift ecosystems from carbon sinks to carbon sources [43]. Importantly, the synergistic effects of fire behavior and meteorological factors are of particular concern under global climate change. The increasing frequency of extreme weather events, such as heatwaves and droughts, amplifies the influence of fire behavior on carbon emissions, creating positive feedback loops that destabilize the global carbon cycle. For EBF, despite their inherent characteristics providing relatively low fire risk and emission stability under current climatic conditions, increasingly frequent and severe extreme drought and heat events under global warming may push them beyond their ecological thresholds. Once their stable high-humidity environment is disrupted, their sensitivity to RHair will expose them to unprecedented fire risks, potentially leading to a shift from a “stable” low-carbon emission state to a high-emission state, or even the loss of their carbon sink function. Therefore, climate change poses a new challenge to this forest type, traditionally considered “fire-resistant.”
Overall, a deeper understanding of the complex interactions among fire behavior, meteorological drivers, and vegetation types is essential for accurately assessing the long-term impacts of wildfires on the climate system. Such insights can provide valuable scientific evidence to inform forest management, climate mitigation, and adaptation strategies in fire-prone ecosystems.

4.4. Theoretical Implications

This study quantitatively assessed the indirect effects of meteorological factors on carbon emissions through fire behavior (FRP and BRI) in tropical forests of Asia using SEM. This finding goes beyond the traditional perspective that directly links meteorology with carbon emissions, highlighting the critical mediating role of fire behavior in regulating the climate–emission relationship, and providing a new theoretical perspective for understanding the contribution of wildfires to regional carbon cycling. Moreover, our research further suggests the unique intensity and sensitivity patterns of different tropical forest types (DBF, EBF, MF, IF) in the meteorological–fire behavior–carbon emission relationship. For instance, we found that DBF is more sensitive to fluctuations in TMP and VAP, leading to more intense fire behavior and emission responses, whereas EBF appears to show stronger resistance. These findings expand fire ecology theory, indicating that a single fire-driven model may not adequately capture regional heterogeneity in complex tropical ecosystems. They also highlight the theoretical foundation for developing refined fire management strategies in different vegetation contexts.

4.5. Management Implications

The findings of this study provide several important implications for forest fire management and carbon emission control: (a) Vegetation-specific fire prevention strategies should be developed, taking into account the distinct fire behavior and emission patterns across vegetation types. Particular attention should be given to MF and DBF, which exhibited higher fire intensity and carbon emissions. Optimizing stand structure and fuel load management in these forest types may help to mitigate fire risks and reduce carbon emission potential. (b) Meteorological early-warning systems for fire-related emissions should be constructed by incorporating the dominant climatic drivers identified in this study, such as TMP, VAP, RHair, DTR, and SSR. Such regionally tailored forecasting models can improve dynamic prediction of fire behavior and associated carbon emissions under varying climatic conditions. (c) In the context of climate warming, it is crucial to strengthen monitoring and emergency response to the elevated risks of high carbon emission fires triggered by extreme meteorological events (e.g., heatwaves, droughts, and enhanced evapotranspiration). This will help to minimize the potential threats of wildfire–induced carbon losses to regional carbon neutrality goals.

4.6. Limitations and Future Perspectives

While this study integrates multi-source datasets and diverse statistical approaches to evaluate the effects of fire behavior on carbon emissions across tropical Asia forest types, several limitations should be acknowledged. First, although key variables related to meteorological conditions, fire behavior, and carbon emissions were considered, some potentially important drivers, such as anthropogenic disturbances, fuel moisture content, and fuel load characteristics (including spatial distribution), were not incorporated. This omission may limit a more comprehensive mechanistic interpretation of fire–emission dynamics. Second, the temporal scope of the analysis was restricted to 2017–2022, a relatively short period that constrains the assessment of long-term stability and trends in the relationship between fire behavior and carbon emissions under changing climate conditions. Third, we acknowledge that the detection of active fires and the accurate retrieval of FRP and BRI can be challenging in dense canopy forests. The MODIS sensor may be obstructed by thick tree canopies when detecting understory fires or small-scale surface fires. This obstruction may lead to an underestimation of the actual fire frequency, spatial extent, and intensity. Therefore, the fire behavior indicators based on FRP and BRI estimated in this study may not fully capture the true intensity of all fire events, especially those occurring as low-intensity fires below the canopy. Future research could consider combining synthetic aperture radar (SAR) data or other high-resolution remote sensing technologies to improve fire detection accuracy in complex vegetation structures.

5. Conclusions

This study systematically analyzed the coupled relationships among meteorological factors, fire behavior, and fire carbon emissions across four forest types in tropical Asia. The results highlight several key findings. Vegetation type was found to significantly influence the intensity of carbon emissions, with MF showing the highest carbon emissions, while EBF exhibited the lowest. These differences are mainly due to the variations in fuel structure and microclimate within the different forest types.
Meteorological factors, such as TMP, VAP, RHair, DTR, and SSR, play a differential role in driving fire behavior and carbon emissions. These variables exert distinct effects across forest types, underlining the importance of regional climatic differences in emission regulation. The study also revealed that FRP and BRI influence carbon emissions through different pathways. Specifically, the direct effect of BRI on emissions was generally stronger than that of FRP, which contributed mainly through indirect pathways, especially in MF and IF.
Meteorological factors, particularly TMP and VAP, acted as key mediators in the fire–emission relationship, demonstrating significant moderating effects in DBF and MF. This indicates that these factors enhance fire-induced emissions under specific climatic conditions.
The findings of this study enrich the theoretical understanding of fire–emission dynamics across different forest types and provide a scientific basis for the development of meteorology-based rapid prediction models for fire emissions. Future research could integrate high-resolution satellite remote sensing, atmospheric transport models, and machine learning approaches to further improve the monitoring, forecasting, and assessment of wildfire carbon emissions, improving their accuracy and applicability for environmental impact assessments.

Supplementary Materials

The following supporting information can be downloaded at: https://www.mdpi.com/article/10.3390/f16101544/s1. Supplementary Table S1. Mantel Test Results for Fire Behavior (FRP and BRI) and Meteorological Factors for DBF. Supplementary Table S2. Mantel Test Results for Fire Behavior (FRP and BRI) and Meteorological Factors for EBF. Supplementary Table S3. Mantel Test Results for Fire Behavior (FRP and BRI) and Meteorological Factors for MF. Supplementary Table S4. Mantel Test Results for Fire Behavior (FRP and BRI) and Meteorological Factors for IF.

Author Contributions

Conceptualization, S.L. and Z.S.; methodology, S.L.; data curation, S.W. and Y.Z. (Yufei Zhou); formal analysis, S.L. and Z.S.; writing—original draft preparation, S.L., Z.S., and Y.Z. (Yingxia Zhong); writing—review and editing, Y.C., X.L. and Y.L.; supervision, S.W.; funding acquisition, Z.W. All authors have read and agreed to the published version of the manuscript.

Funding

This research was funded by the General Program of the 76 Batch of the China Postdoctoral Science Foundation (grant number 2024M760460); the Young and Middle-Aged Teacher Education Research Project of Fujian Province (grant number JAT220690); the Zhangzhou Institute of Technology Doctoral Research Start-Up Fund Project in 2023 (grant number ZZYB2305); and the Key Technologies for UAV-Assisted Early Forest Fire Management Research (grant number 2025KJCX005).

Data Availability Statement

All data are available on reasonable request to the corresponding authors.

Acknowledgments

We would like to thank the editor and anonymous reviewers for their useful advice that helped to improve the manuscript.

Conflicts of Interest

The authors declare no conflicts of interest.

References

  1. Bowman, D.M.; Balch, J.K.; Artaxo, P.; Bond, W.J.; Carlson, J.M.; Cochrane, M.A.; d’Antonio, C.M.; DeFries, R.S.; Doyle, J.C.; Harrison, S.P.; et al. Fire in the Earth system. Science 2009, 324, 481–484. [Google Scholar] [CrossRef]
  2. Van der Werf, G.R.; Randerson, J.T.; Giglio, L.; Collatz, G.J.; Mu, M.; Kasibhatla, P.S.; Morton, D.C.; DeFries, R.S.; Jin, Y.V.; van Leeuwen, T.T. Global fire emissions and the contribution of deforestation, savanna, forest, agricultural, and peat fires (1997–2009). Atmos. Chem. Phys. 2010, 10, 11707–11735. [Google Scholar] [CrossRef]
  3. Demetillo, M.A.G.; Anderson, J.F.; Geddes, J.A.; Yang, X.; Najacht, E.Y.; Herrera, S.A.; Kabasares, K.M.; Kotsakis, A.E.; Lerdau, M.T.; Pusede, S.E. Observing severe drought influences on ozone air pollution in California. Environ. Sci. Technol. 2019, 53, 4695–4706. [Google Scholar] [CrossRef] [PubMed]
  4. Gerberding, K.; Schirpke, U. Mapping the probability of forest fire hazard across the European Alps under climate change scenarios. J. Environ. Manag. 2025, 377, 124600. [Google Scholar] [CrossRef]
  5. Van Der Werf, G.R.; Randerson, J.T.; Giglio, L.; Van Leeuwen, T.T.; Chen, Y.; Rogers, B.M.; Mu, M.; Van Marle, M.J.; Morton, D.C.; Collatz, G.J.; et al. Global fire emissions estimates during 1997–2016. Earth Syst. Sci. Data 2017, 9, 697–720. [Google Scholar] [CrossRef]
  6. van Wees, D.; van der Werf, G.R.; Randerson, J.T.; Rogers, B.M.; Chen, Y.; Veraverbeke, S.; Giglio, L.; Morton, D.C. Global biomass burning fuel consumption and emissions at 500-m spatial resolution based on the Global Fire Emissions Database (GFED). Geosci. Model Dev. Discuss. 2022, 15, 8411–8437. [Google Scholar] [CrossRef]
  7. Giglio, L.; Randerson, J.T.; van der Werf, G.R. Analysis of daily, monthly, and annual burned area using the fourth-generation global fire emissions database (GFED4). J. Geophys. Res. Biogeosciences 2018, 123, 1175–1197. [Google Scholar] [CrossRef]
  8. Filizzola, C.; Falconieri, A.; Lacava, T.; Marchese, F.; Masiello, G.; Mazzeo, G.; Pergola, N.; Pietrapertosa, C.; Serio, C.; Tramutoli, V. Fire Characterization by Using an Original RST-Based Approach for Fire Radiative Power (FRP) Computation. Fire 2023, 6, 48. [Google Scholar] [CrossRef]
  9. Liu, Y.; Shi, Y. Estimates of Global Forest Fire Carbon Emissions Using FY-3 Active Fires Product. Atmosphere 2023, 14, 1575. [Google Scholar] [CrossRef]
  10. Mendes-Lopes, J.M.; Ventura, J.M.; Amaral, J.M. Flame characteristics, temperature–time curves, and rate of spread in fires propagating in a bed of Pinus pinaster needles. Int. J. Wildland Fire 2003, 12, 67–84. [Google Scholar] [CrossRef]
  11. de Groot, W.J.; Hanes, C.C.; Wang, Y. Crown fuel consumption in Canadian boreal forest fires. Int. J. Wildland Fire 2022, 31, 255–276. [Google Scholar] [CrossRef]
  12. Zylstra, P.; Wardell-Johnson, G.; Falster, D.; Howe, M.; McQuoid, N.; Neville, S. Mechanisms by which growth and succession limit the impact of fire in a south-western Australian forested ecosystem. Funct. Ecol. 2023, 37, 1350–1365. [Google Scholar] [CrossRef]
  13. Meng, Q.; Lu, H.; Huai, Y.; Xu, H.; Yang, S. Forest Fire Spread Simulation and Fire Extinguishing Visualization Research. Forests 2023, 14, 1371. [Google Scholar] [CrossRef]
  14. Jin, P.X.; Cheng, P.; Liu, X.D.; Huang, Y. From smoke to fire: A forest fire early warning and risk assessment model fusing multimodal data. Eng. Appl. Artif. Intell. 2025, 152, 110848. [Google Scholar] [CrossRef]
  15. Hantson, S.; Hamilton, D.S.; Burton, C. Changing fire regimes: Ecosystem impacts in a shifting climate. One Earth 2024, 7, 942–945. [Google Scholar] [CrossRef]
  16. Neumann, M.; Vilà-Vilardell, L.; Müller, M.M.; Vacik, H. Fuel loads and fuel structure in Austrian coniferous forests. Int. J. Wildland Fire 2022, 31, 693–707. [Google Scholar] [CrossRef]
  17. Little, K.; Kettridge, N.; Belcher, C.M.; Graham, L.J.; Stoof, C.R.; Ivison, K.; Cardil, A. Cross-landscape fuel moisture differences impact simulated fire behaviour. Int. J. Wildland Fire 2024, 33, WF24019. [Google Scholar] [CrossRef]
  18. Phelps, N.; Beverly, J.L. Classification of forest fuels in selected fire-prone ecosystems of Alberta, Canada—Implications for crown fire behaviour prediction and fuel management. Ann. For. Sci. 2022, 79, 40. [Google Scholar] [CrossRef]
  19. Hou, X.; Wu, Z.W.; Zhu, S.H.; Li, Z.J.; Li, S. Comparative Analysis of Machine Learning-Based Predictive Models for Fine Dead Fuel Moisture of Subtropical Forest in China. Forests 2024, 15, 736. [Google Scholar] [CrossRef]
  20. Tedim, F.; Leone, V.; Amraoui, M.; Bouillo, C.; Coughlan, M.R.; Delogu, G.M.; Fernandes, P.M.; Ferreira, C.; McCaffrey, S.; McGee, T.K.; et al. Defining Extreme Wildfire Events: Difficulties, Challenges, and Impacts. Fire 2018, 1, 9. [Google Scholar] [CrossRef]
  21. Cawson, J.G.; Duff, T.J.; Tolhurst, K.G.; Baillie, C.C.; Penman, T.D.; Mattews, S. Dead fuel moisture research: 1991–2012. Int. J. Wildland Fire 2014, 23, 78–92. [Google Scholar] [CrossRef]
  22. Cawson, J.G.; Duff, T.J.; Tolhurst, K.G.; Baillie, C.C.; Penman, T.D. Fuel moisture in Mountain Ash forests with contrasting fire histories. For. Ecol. Manag. 2017, 400, 568–577. [Google Scholar] [CrossRef]
  23. Singh, H.; Ang, L.M.; Paudyal, D.; Acuna, M.; Srivastava, P.K.; Srivastava, S.K. A comprehensive review of empirical and dynamic wildfire simulators and machine learing techniques used for the prediction of wildfire in Australia. Technol. Knowl. Learn. 2025, 30, 935–968. [Google Scholar] [CrossRef]
  24. Pickering, B.J.; Kultaev, D.; Holyland, B.; Ababei, D.; Penman, T.D. The changing risk of fire to human and environmental assets under climate induced altered fire regimes in south-east Australia. Int. J. Disaster Risk Reduct. 2025, 127, 105668. [Google Scholar] [CrossRef]
  25. Martin, R.S.; Ottlé, C.; Sörensson, A. Fires in the South American Chaco, from dry forests to wetlands: Response to climate depends on land cover. Fire Ecol. 2023, 19, 57. [Google Scholar] [CrossRef]
  26. Mustaphi, C.J.; Rucina, S.M.; Marchant, R. Late Pleistocene montane forest fire return interval estimates from Mount Kenya. J. Quat. Sci. 2023, 38, 146–159. [Google Scholar] [CrossRef]
  27. Peel, M.C.; Finlayson, B.L.; McMahon, T.A. Updated world map of the Köppen-Geiger climate classification. Hydrol. Earth Syst. Sci. 2007, 11, 1633–1644. [Google Scholar] [CrossRef]
  28. Page, S.E.; Siegert, F.; Rieley, J.O.; Boehm, H.D.V.; Jaya, A.; Limin, S. The amount of carbon released from peat and forest fires in Indonesia during 1997. Nature 2002, 420, 61–65. [Google Scholar] [CrossRef]
  29. Huijnen, V.; Wooster, M.J.; Kaiser, J.W.; Gaveau, D.L.; Flemming, J.; Parrington, M.; Inness, A.; Murdiyarso, D.; Main, B.; van Weele, M. Fire carbon emissions over maritime southeast Asia in 2015 largest since 1997. Sci. Rep. 2016, 6, 26886. [Google Scholar] [CrossRef]
  30. Crippa, P.; Castruccio, S.; Archer-Nicholls, S.; Lebron, G.B.; Kuwata, M.; Thota, A.; Sumin, S.; Butt, E.; Wiedinmyer, C.; Spracklen, D.V. Population exposure to hazardous air quality due to the 2015 fires in Equatorial Asia. Sci. Rep. 2016, 6, 37074. [Google Scholar] [CrossRef]
  31. Berg, A.; McColl, K.A. No projected global drylands expansion under greenhouse warming. Nat. Clim. Chang. 2021, 11, 331–337. [Google Scholar] [CrossRef]
  32. Wells, N.; Goddard, S.; Hayes, M.J. A self-calibrating Palmer drought severity index. J. Clim. 2004, 17, 2335–2351. [Google Scholar] [CrossRef]
  33. Dai, A. Drought under global warming: A review. Wiley Interdiscip. Rev. Clim. Chang. 2011, 2, 45–65. [Google Scholar] [CrossRef]
  34. Paudel, J. Short-run environmental effects of COVID-19: Evidence from forest fires. World Dev. 2021, 137, 105120. [Google Scholar] [CrossRef] [PubMed]
  35. Andela, N.; Van Der Werf, G.R.; Kaiser, J.W.; Van Leeuwen, T.T.; Wooster, M.J.; Lehmann, C.E. Biomass burning fuel consumption dynamics in the tropics and subtropics assessed from satellite. Biogeosciences 2016, 13, 3717–3734. [Google Scholar] [CrossRef]
  36. Wimberly, M.C.; Wanyama, D.; Doughty, R.; Peiro, H.; Crowell, S. Increasing fire activity in African tropical forests is associated with deforestation and climate change. Geophys. Res. Lett. 2024, 51, e2023GL106240. [Google Scholar] [CrossRef]
  37. Su, Z.; Xu, Z.; Lin, L.; Chen, Y.; Hu, H.; Wei, S.; Luo, S. Exploration of the Contribution of Fire Carbon Emissions to PM2.5 and Their Influencing Factors in Laotian Tropical Rainforests. Remote Sens. 2022, 14, 4052. [Google Scholar] [CrossRef]
  38. Wiggins, E.B.; Anderson, B.E.; Brown, M.D.; Campuzano-Jost, P.; Chen, G.; Crawford, J.; Crosbie, E.C.; Dibb, J.; DiGangi, J.P.; Diskin, G.S.; et al. Reconciling assumptions in bottom-up and top-down approaches for estimating aerosol emission rates from wildland fires using observations from FIREX-AQ. J. Geophys. Res. Atmos. 2021, 126, e2021JD035692. [Google Scholar] [CrossRef]
  39. Vega Escobar, A.; Girard, F.; Valeria, O. Quantifying Missed Opportunities for Cumulative Forest Road Carbon Storage over the Past 50 Years in the Boreal Forest of Eastern Canada. Forests 2025, 16, 688. [Google Scholar] [CrossRef]
  40. Hamby, D.M. A review of techniques for parameter sensitivity analysis of environmental models. Environ. Monit. Assess. 1994, 32, 135–154. [Google Scholar] [CrossRef]
  41. Pianosi, F.; Beven, K.; Freer, J.; Hall, J.W.; Rougier, J.; Stephenson, D.B.; Wagener, T. Sensitivity analysis of environmental models: A systematic review with practical workflow. Environ. Model. Softw. 2016, 79, 214–232. [Google Scholar] [CrossRef]
  42. Fan, Y.; Chen, J.; Shirkey, G.; John, R.; Wu, S.R.; Park, H.; Shao, C. Applications of structural equation modeling (SEM) in ecological studies: An updated review. Ecol. Process. 2016, 5, 19. [Google Scholar] [CrossRef]
  43. Zhang, S.; Liu, C.; Chen, Y.; Liang, J.; Ma, Y. Research on the Impact of Climate Change Perceptions on the Carbon Offset Behavior of Visitors to Wuyi Mountain Forestry Heritage Site. Forests 2025, 16, 693. [Google Scholar] [CrossRef]
  44. Wang, W.; Wang, X.; Flannigan, M.D.; Guindon, L.; Swystun, T.; Castellanos-Acuna, D.; Wu, W.; Wang, G. Canadian forests are more conducive to high-severity fires in recent decades. Science 2025, 387, 91–97. [Google Scholar] [CrossRef]
  45. Van Wagner, C.E. Conditions for the start and spread of crown fire. Can. J. For. Res. 1977, 7, 23–34. [Google Scholar] [CrossRef]
  46. Kreye, J.K.; Kobziar, L.N. The effect of mastication on surface fire behaviour, fuels consumption and tree mortality in pine flatwoods of Florida, USA. Int. J. Wildland Fire 2015, 24, 573–579. [Google Scholar] [CrossRef]
  47. Fischer, R. The long-term consequences of forest fires on the carbon fluxes of a tropical forest in Africa. Appl. Sci. 2021, 11, 4696. [Google Scholar] [CrossRef]
  48. Wiggins, E.B.; Veraverbeke, S.; Henderson, J.M.; Karion, A.; Miller, J.B.; Lindaas, J.; Commane, R.; Sweeney, C.; Luus, K.A.; Tosca, M.G.; et al. The influence of daily meteorology on boreal fire emissions and regional trace gas variability. J. Geophys. Res. Biogeosciences 2016, 121, 2793–2810. [Google Scholar] [CrossRef]
  49. Zumbrunnen, T.; Pezzatti, G.B.; Menéndez, P.; Bugmann, H.; Bürgi, M.; Conedera, M. Weather and human impacts on forest fires: 100 years of fire history in two climatic regions of Switzerland. For. Ecol. Manag. 2011, 261, 2188–2199. [Google Scholar] [CrossRef]
  50. Bowman, D.M.; Williamson, G.J.; Price, O.F.; Ndalila, M.N.; Bradstock, R.A. Australian forests, megafires and the risk of dwindling carbon stocks. Plant Cell Environ. 2021, 44, 347–355. [Google Scholar] [CrossRef]
  51. Liu, Y.Q.; Goodrick, S.L.; Stanturf, J.A. Future US wildfire potential trends projected using a dynamically downscaled climate change scenario. For. Ecol. Manag. 2013, 294, 120–135. [Google Scholar] [CrossRef]
  52. Liu, Y.; Goodrick, S.; Heilman, W. Wildland fire emissions, carbon, and climate: Wildfire–climate interactions. For. Ecol. Manag. 2014, 317, 80–96. [Google Scholar] [CrossRef]
  53. Prichard, S.J.; Salter, R.B.; Hessburg, P.F.; Povak, N.A.; Gray, R.W. The REBURN model: Simulating system-level forest succession and wildfire dynamics. Fire Ecol. 2023, 19, 38. [Google Scholar] [CrossRef]
  54. Walker, X.J.; Baltzer, J.L.; Cumming, S.G.; Day, N.J.; Ebert, C.; Goetz, S.; Johnstone, J.F.; Potter, S.; Rogers, B.M.; Schuur, E.A.; et al. Increasing wildfires threaten historic carbon sink of boreal forest soils. Nature 2019, 572, 520–523. [Google Scholar] [CrossRef]
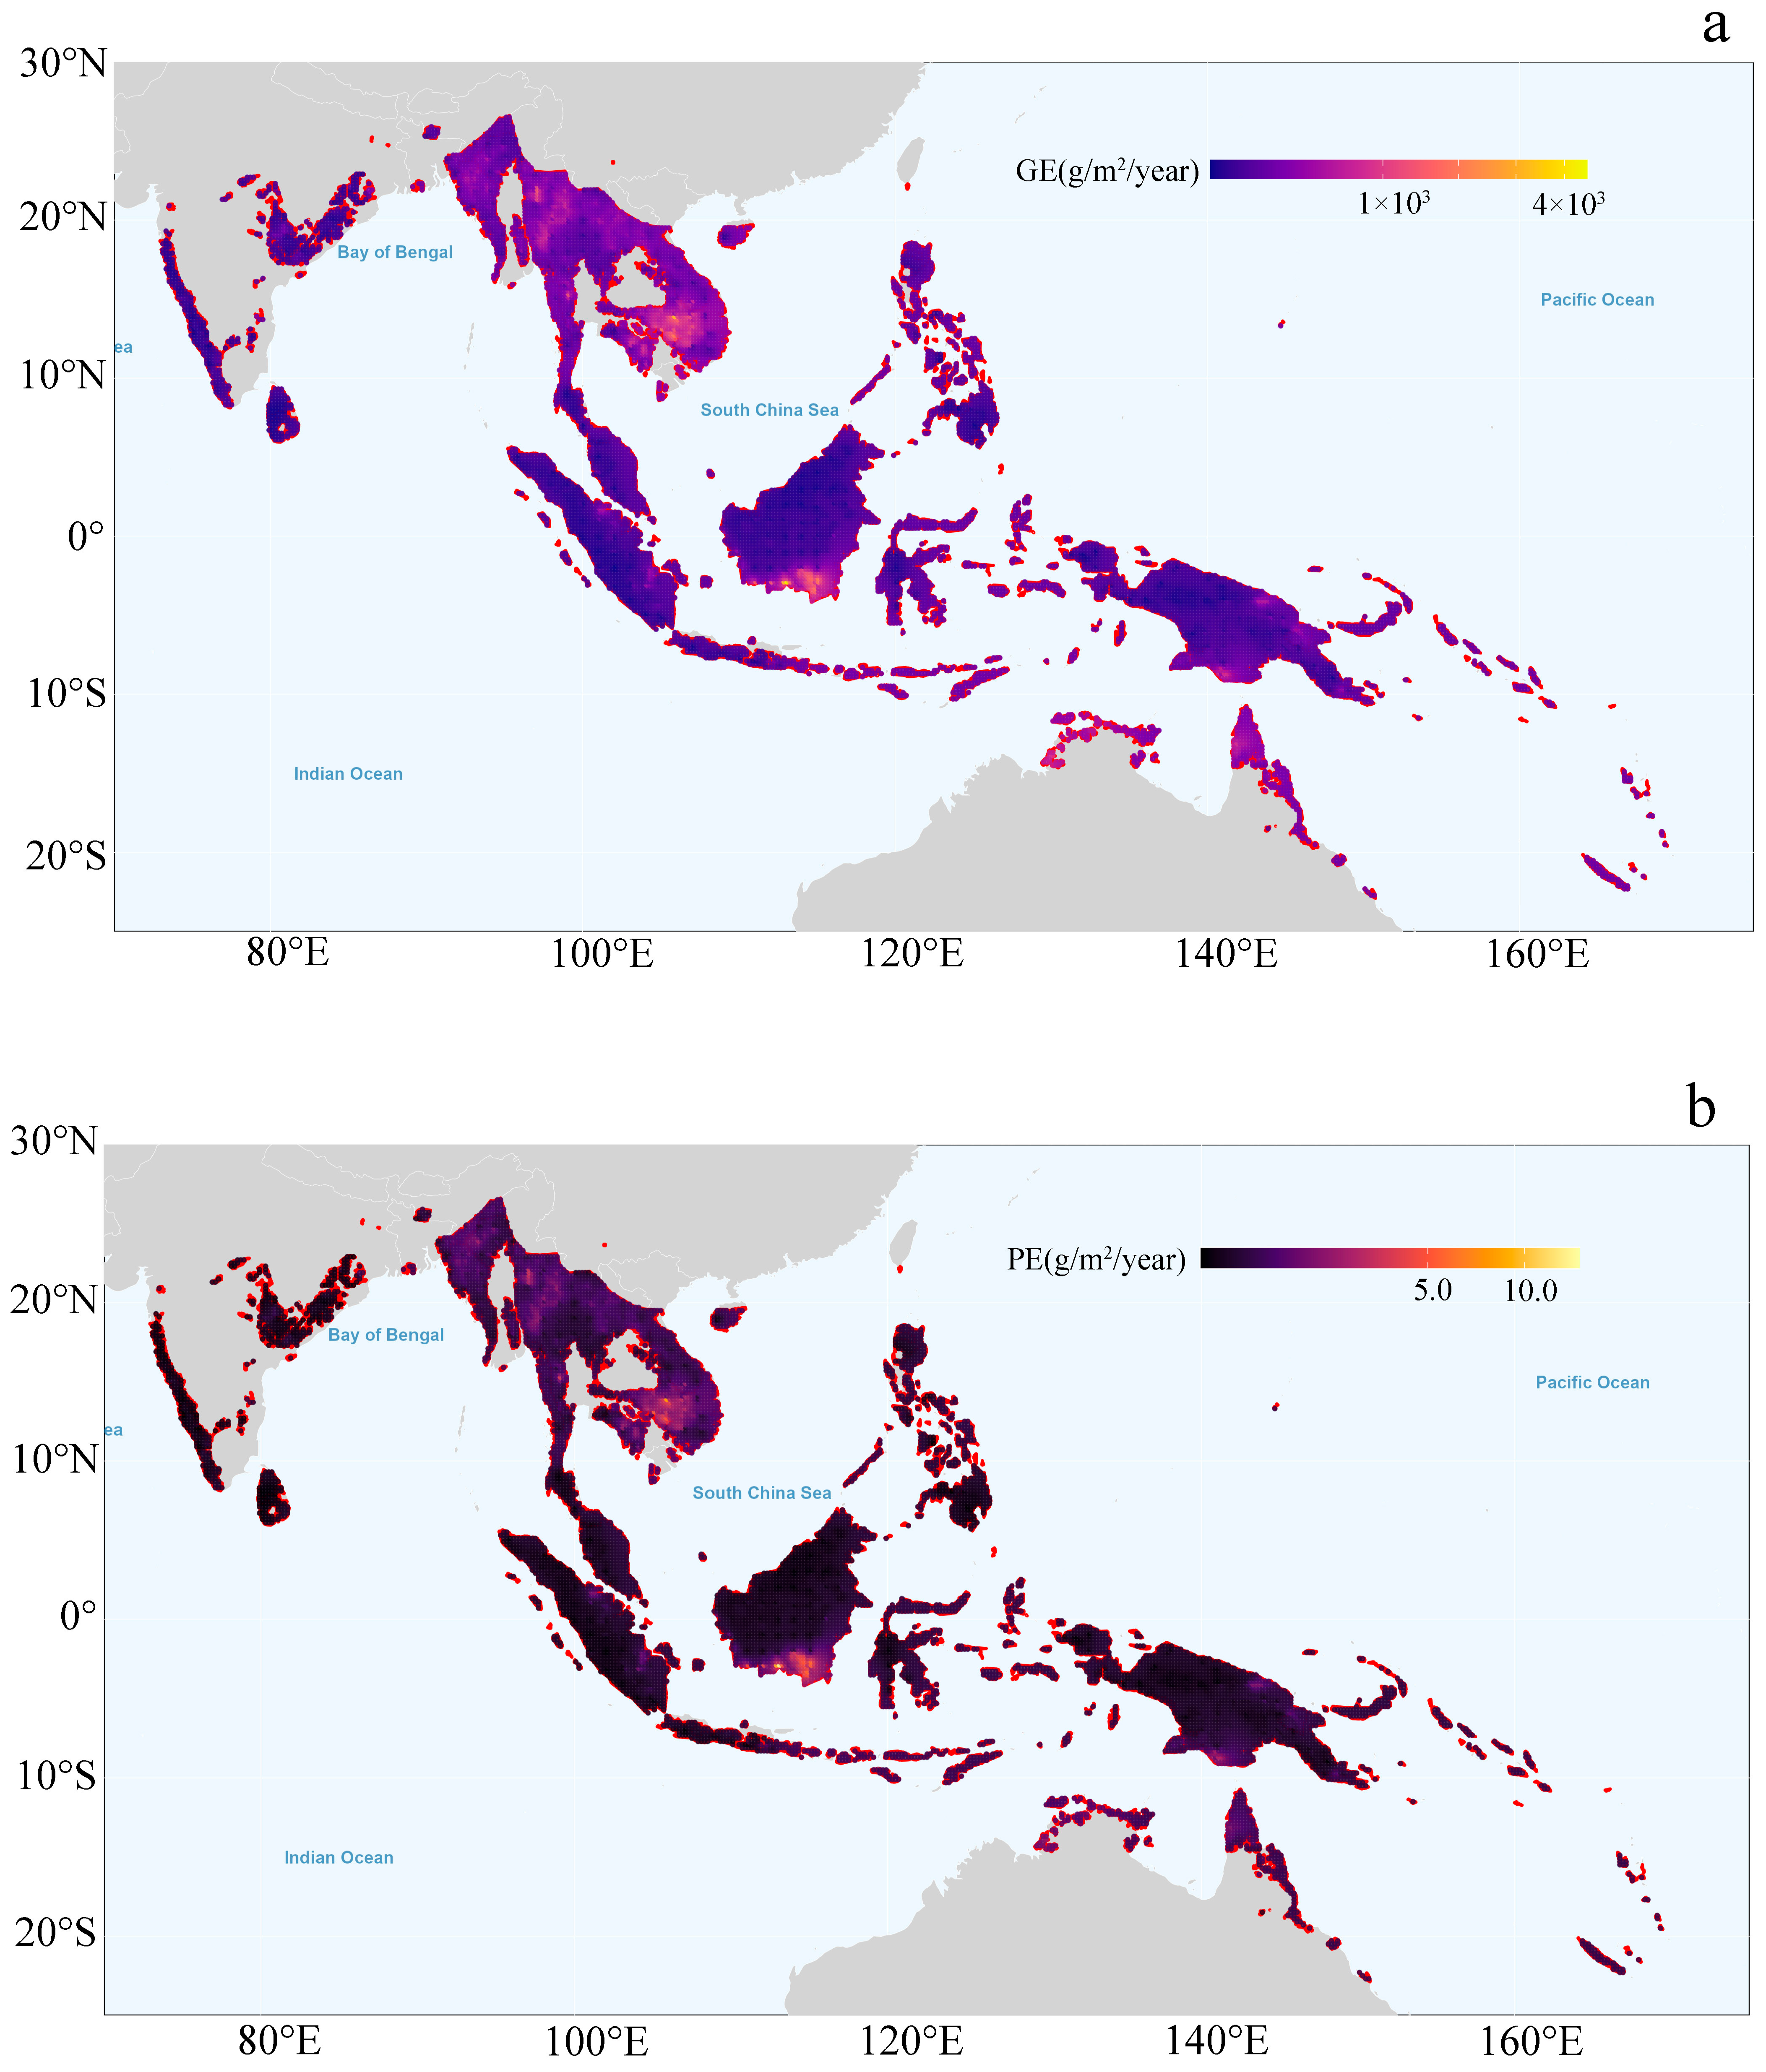
Figure 1. Location map of the study area. (a) represents the spatial distribution of GE, and (b) represents the spatial distribution of PE.
Forests 16 01544 g001
Figure 2. Conceptual diagram of the SEM.Single-headed arrows indicate causal paths; curved double-headed arrows denote correlations. Error terms of the four endogenous variables are labelled e1–e4. Variables are classified by color: meteorological factors in blue, fire behavior in red, and carbon emissions in green. Path coefficients vary across forest types (Deciduous broadleaf forest, (DBF); evergreen broadleaf forest (EBF); mixed forest/woodland (MF), interrupted forest (IF)).
Forests 16 01544 g002
Figure 3. Mantel test results of fire behavior and meteorological factors across different vegetation types. (a) Deciduous broadleaf forest (DBF); (b) evergreen broadleaf forest (EBF); (c) mixed forest/woodland (MF); (d) interrupted forest (IF).
Forests 16 01544 g003
Figure 4. Mean values of GE and PE with 95% confidence intervals derived from ANOVA. Different lowercase letters denote significant differences among vegetation types (p < 0.05). (A) represents GE, and (B) represents PE. The colors represent different forest types: red for Deciduous broadleaf forest (DBF), green for evergreen broadleaf forest (EBF), blue for mixed forest/woodland (MF), and purple for interrupted forest (IF).
Forests 16 01544 g004aForests 16 01544 g004b
Figure 5. Variable importance ranking of GE and PE under different vegetation types based on RF. * Indicates that the variable importance is statistically significant according to the permutation test (p < 0.05), and ** indicates (p < 0.01). (a) Deciduous broadleaf forest (DBF); (b) evergreen broadleaf forest (EBF); (c) mixed forest/woodland (MF); (d) interrupted forest (IF).
Forests 16 01544 g005aForests 16 01544 g005b
Figure 6. The fitting accuracy of GE and PE based on RF. (a) Deciduous broadleaf forest (DBF); (b) evergreen broadleaf forest (EBF); (c) mixed forest/woodland (MF); (d) interrupted forest (IF). The blue dots represent the fit for GE predictions, while the green dots represent the fit for PE predictions.
Forests 16 01544 g006aForests 16 01544 g006b
Figure 7. Sensitivity analysis results of GE and PE for different vegetation types. (a) Deciduous broadleaf forest (DBF); (b) evergreen broadleaf forest (EBF); (c) mixed forest/woodland (MF); (d) interrupted forest (IF).
Forests 16 01544 g007
Figure 8. Path analysis diagram of the impact of meteorological factors on GE and PE for different vegetation types based on SEM. The green lines represent the direct impacts of FRP and BRI on GE and PE, the blue lines represent the indirect impacts of FRP and BRI on GE and PE through intermediate factors, and the red lines represent the total effects between FRP and BRI, and GE and PE. The dashed lines represent the negative effects, while the solid lines represent the positive effects. (a) Deciduous broadleaf forest (DBF); (b) evergreen broadleaf forest (EBF); (c) mixed forest/woodland (MF); (d) interrupted forest (IF).
Forests 16 01544 g008
Table 1. Statistical summary of data on vegetation in tropical Asia from 2017 to 2022 (units in parentheses represent the measurement units for each variable).
VariableMinQ1MedianMeanQ3Max
CO2 (g/m2/year)0.0344.44124.758142.849126.72711,172.000
CO (g/m2/year)0.0010.2001.1487.2455.8911155.970
CH4 (g/m2/year)0.0000.0080.0480.3740.247106.587
NMHC (g/m2/year)0.0000.0090.0500.2470.24812.416
OC (g/m2/year)0.0000.0080.0490.3240.27836.332
BC (g/m2/year)0.0000.0010.0060.0360.0332.330
TMP (°C)15.43324.15825.96725.39427.13329.050
DTR (°C)6.0259.12510.37510.33511.34218.967
CLD (%)33.94256.50864.43363.24870.25882.233
VAP (hPa)13.80022.18325.07524.76927.98332.150
PDSI
(dimensionless)
−3.900−2.296−1.606−1.567−0.9394.000
SSR (W/m2)11,586,90016,373,95017,102,50017,040,722.86117,793,90022,417,300
FRP (MW)5.49013.36417.95925.80026.8441030.430
BRI (K)303.574315.908319.393320.419323.725389.772
RHair (%)51.69577.22481.69080.87585.77892.390
WS (m/s)0.0010.1640.2960.3670.4952.932
GE (g/m2/year)0.0364.66725.982150.715133.36112,446.973
PE (g/m2/year)0.0000.0090.0560.3600.31337.452
Table 2. Mediating effects of fire emissions on GE and PE via FRP and BRI in DBF.
Fire
Behavior
Fire
Emissions
Total
Effect
Direct
Effect
Total Indirect EffectMediating FactorIndirect Effect of Mediating FactorMediating Effect RatioDirect Effect Ratio
FRPGE−0.853−0.851−0.002DTR−0.0760.0890.998
TMP1.441−1.6890.998
VAP−1.1971.4030.998
SSR−0.0420.0490.998
PDSI−0.1280.1500.998
BRIGE1.5660.8290.737TMP−0.661−0.4220.529
CLD0.3910.2500.529
VAP0.9360.5980.529
SSR0.0710.0450.529
FRPPE−0.832−0.8420.010DTR−0.0670.0811.012
TMP1.432−1.7211.012
SSR−1.1851.4241.012
PDSI−0.1290.1551.012
BRIPE1.5460.8160.731TMP−0.061−0.0390.528
CLD0.3910.2530.528
VAP0.9360.6050.528
SSR0.0710.0460.528
Table 3. Mediating effects of fire emissions on GE and PE via FRP and BRI in EBF.
Fire
Behavior
Fire
Emissions
Total
Effect
Direct
Effect
Total Indirect EffectMediating FactorIndirect Effect of Mediating FactorMediating Effect RatioDirect Effect Ratio
FRPGE−0.1630.002−0.165CLD−0.060−0.368−0.012
RHair−0.101−0.620−0.012
SSR−0.004−0.025−0.012
BRIGE0.4630.1990.264RHair0.2610.5640.430
SSR0.0030.0060.430
FRPPE−0.0290.017−0.046DTR−0.0020.069−0.586
RHair−0.0411.414−0.586
SSR−0.0030.103−0.586
BRIPE0.2110.0990.112DTR0.0050.0240.469
RHair0.1050.4980.469
SSR0.0020.0090.469
Table 4. Mediating effects of fire emissions on GE and PE via FRP and BRI in MF.
Fire
Behavior
Fire
Emissions
Total
Effect
Direct
Effect
Total Indirect EffectMediating FactorIndirect Effect of Mediating FactorMediating Effect RatioDirect Effect Ratio
FRPGE−1.754−0.211−1.543RHair0.200−0.1140.120
SSR−0.2100.1200.120
DTR−0.5070.2890.120
TMP−1.0270.5860.120
BRIGE4.1540.3943.760RHair−0.166−0.0400.095
SSR0.1420.0340.095
DTR0.5420.1300.095
VAP2.6320.6340.095
TMP0.6100.1470.095
FRPPE−1.772−0.233−1.539RHair0.207−0.1170.131
SSR−0.2110.1190.131
DTR−0.5130.2900.131
TMP−1.0220.5770.131
BRIPE4.1850.4073.779RHair−0.171−0.0410.097
SSR0.1430.0340.097
DTR0.5490.1310.097
VAP2.6510.6330.097
TMP0.6070.1450.097
Table 5. Mediating effects of fire emissions on GE and PE via FRP and BRI in IF.
Fire
Behavior
Fire
Emissions
Total
Effect
Direct
Effect
Total Indirect EffectMediating FactorIndirect Effect of Mediating FactorMediating Effect RatioDirect Effect Ratio
FRPGE0.139−0.2270.366DTR0.0620.446−1.633
RHair−0.091−0.655−1.633
SSR−0.187−1.345−1.633
TMP0.5904.245−1.633
CLD−0.008−0.058−1.633
BRIGE0.369−0.0540.424DTR−0.220−0.596−0.146
RHair0.2850.772−0.146
SSR0.2560.694−0.146
TMP0.1280.347−0.146
CLD−0.026−0.070−0.146
FRPPE0.162−0.2210.383DTR0.0620.383−1.364
RHair−0.085−0.525−1.364
SSR−0.180−1.111−1.364
TMP0.5923.654−1.364
CLD−0.006−0.037−1.364
BRIPE0.318−0.0810.399DTR−0.222−0.698−0.255
RHair0.2670.840−0.255
SSR0.2460.774−0.255
TMP0.1290.406−0.255
Disclaimer/Publisher’s Note: The statements, opinions and data contained in all publications are solely those of the individual author(s) and contributor(s) and not of MDPI and/or the editor(s). MDPI and/or the editor(s) disclaim responsibility for any injury to people or property resulting from any ideas, methods, instructions or products referred to in the content.