Article

MRV-YOLO: A Multi-Channel Remote Sensing Object Detection Method for Identifying Reclaimed Vegetation in Hilly and Mountainous Mining Areas

1
Jiangxi Provincial Key Laboratory of Water Ecological Conservation in Headwater Regions, Jiangxi University of Science and Technology, Ganzhou 341000, China
2
Institute of Mineral Resources, Chinese Academy of Geological Sciences, Beijing 100037, China
3
Geographic Information Engineering Group, Jiangxi Geological Bureau, Nanchang 330000, China
*
Authors to whom correspondence should be addressed.
Forests 2025, 16(10), 1536; https://doi.org/10.3390/f16101536
Submission received: 9 September 2025 / Revised: 24 September 2025 / Accepted: 1 October 2025 / Published: 2 October 2025
(This article belongs to the Section Forest Inventory, Modeling and Remote Sensing)

Abstract

Leaching mining of ion-adsorption rare earths degrades soil organic matter and hampers vegetation recovery. High-resolution UAV remote sensing enables large-scale monitoring of reclamation, yet vegetation detection accuracy is constrained by key challenges. Conventional three-channel detection struggles with terrain complexity, illumination variation, and shadow effects. Fixed UAV altitude and missing topographic data further cause resolution inconsistencies, posing major challenges for accurate vegetation detection in reclaimed land. To enhance multi-spectral vegetation detection, the model input is expanded from the traditional three channels to six channels, enabling full utilization of multi-spectral information. Furthermore, the Channel Attention and Global Pooling SPPF (CAGP-SPPF) module is introduced for multi-scale feature extraction, integrating global pooling and channel attention to capture multi-channel semantic information. In addition, the C2f_DynamicConv module replaces conventional convolutions in the neck network to strengthen high-dimensional feature transmission and reduce information loss, thereby improving detection accuracy. On the self-constructed reclaimed vegetation dataset, MRV-YOLO outperformed YOLOv8, with mAP@0.5 and mAP@0.5:0.95 increasing by 4.6% and 10.8%, respectively. Compared with RT-DETR, YOLOv3, YOLOv5, YOLOv6, YOLOv7, yolov7-tiny, YOLOv8-AS, YOLOv10, and YOLOv11, mAP@0.5 improved by 6.8%, 9.7%, 5.3%, 6.5%, 6.4%, 8.9%, 4.6%, 2.1%, and 5.4%, respectively. The results demonstrate that multichannel inputs incorporating near-infrared and dual red-edge bands significantly enhance detection accuracy for reclaimed vegetation in rare earth mining areas, providing technical support for ecological restoration monitoring.

1. Introduction

Rare earth resources are extensively utilized in high-tech industries owing to their unique physical and chemical properties [1,2]. However, large-scale mining operations have inflicted severe damage on ecosystems in rare earth mining regions, resulting in soil erosion, water contamination, heavy metal pollution, and vegetation degradation [3,4]. Reclamation is a vital strategy for ecological restoration in mining areas, significantly enhancing the local ecological environment [5,6,7,8,9,10]. The accurate detection of artificially reclaimed vegetation is essential for assessing restoration effectiveness and plays a crucial role in achieving intelligent ecological management in mining regions.
Multispectral remote sensing images, characterized by their rich spectral information, have demonstrated notable advantages in target detection tasks, particularly in monitoring ecological restoration within mining areas [11,12,13]. However, the environment in rare earth mining areas is complex and presents numerous challenges. These include restrictions imposed by a fixed flight altitude during data collection, a lack of high-precision elevation data, variations in image resolution due to undulating hills at different altitudes, and the effects of light and shadow. Such factors significantly complicate the detection of reclaimed vegetation. With the rapid advancement of high-resolution unmanned aerial vehicle (UAV) remote sensing and deep learning technologies, the integrated application of multispectral data in ecological monitoring has become increasingly sophisticated. In contrast, traditional RGB three-band imagery is constrained by limited spectral dimensions, making it challenging to effectively differentiate reclaimed vegetation from background elements in complex terrains such as hilly and mountainous regions, and it is also susceptible to terrain variations and uneven illumination, resulting in reduced recognition accuracy [14,15,16]. Introducing red-edge and near-infrared bands enhances the model’s capability to express the semantic features of reclaimed vegetation. These features represent high-level characteristics learned by the model from multispectral reflectance data, which reflect the physiological and structural states of vegetation, thereby aiding in the accurate identification of reclaimed vegetation in complex mining area environments. Previous studies have demonstrated that the red-edge band is highly sensitive to variations in chlorophyll concentration and reliably reflects vegetation physiological status [17,18], while the NIR band exploits reflectance contrasts between healthy vegetation and bare soil, providing robust discrimination even under low-light conditions [19,20,21,22]. Meanwhile, Li et al. [8] further validated the spectral differences in reclaimed vegetation in the NIR and red-edge bands through wavelet analysis in their 2024 study, underscoring the significance of these differences for chlorophyll estimation and reclamation quality assessment. Additionally, Wu et al. [23] combined multispectral imagery with deep learning models to achieve high-precision detection of characteristic features in rare earth mining areas, confirming the potential of multispectral data to enhance detection robustness and accuracy. It can be seen that by incorporating red-edge and NIR bands, multispectral remote sensing images substantially broaden the model’s sensitivity to vegetation’s physiological and spectral attributes, providing more reliable technical support for identifying reclaimed vegetation in complex mining environments.
In recent years, deep learning has been extensively applied in vegetation detection. For instance, Mouret et al. [24] combined Sentinel-2 multispectral data, ResNet architecture, vegetation indices, and principal component analysis methods to achieve pixel-level classification of different tree species. Additionally, the LiDAR point cloud classification model developed by Morales-Martin et al. [25] effectively categorizes forests into ground, low, medium, and high vegetation grades. Weakly supervised multimodal methods integrate historical data with partial annotations to facilitate tree species classification while reducing the need for extensive annotations [26]. Despite these advancements, existing methods predominantly rely on limited spectral bands, hindering the full utilization of multispectral information. This limitation restricts the accuracy and adaptability of vegetation detection in complex mining areas. Therefore, further research into object detection models capable of efficiently fusing multispectral data remains essential. Currently, multi-channel target detection algorithms based on multispectral remote sensing images primarily utilize multimodal data fusion techniques for model training. The YOLO (You Only Look Once) series, a class of single-stage object detection algorithms, offers an efficient framework for target detection. The advancements of the YOLO series primarily follow two technical approaches. The first approach involves constructing a dual-stream processing architecture. For instance, algorithms such as MOD-YOLO [27], GMD-YOLO [28], TF-YOLO [29], IGT [30], and the palm tree detection algorithm [31] employ dual-channel parallel processing to fuse aligned data from visible and infrared bands, thereby enhancing target detection performance in low-visibility scenarios. Results indicate that incorporating near-infrared band information can significantly improve the model’s detection effectiveness. The second approach entails designing a band selection mechanism, exemplified by the MS-YOLO algorithm proposed by Wang et al. [32], which employs a function-based selection mechanism to identify the optimal three bands for model training. Although both methods integrate near-infrared band information, they utilize three bands as the input units for the models. This limitation diminishes the models’ ability to autonomously discriminate feature weights across multiple bands, particularly for red-edge and near-infrared band features that are sensitive to reclaimed vegetation. Additionally, it disrupts the nonlinear correlations between bands, leading to reduced efficiency in utilizing spectral information. These bottlenecks constrain the improvement of multispectral detection models’ adaptability in complex rare earth mining environments. The application of the YOLO series in vegetation detection primarily focuses on enhancing the traditional three-band model. For instance, Ma et al. [33] optimized YOLOv5 to successfully detect small targets in mangrove ecosystems. Wang et al. [34] employed an object detection algorithm to identify Ghaf trees in visible light images, while Wang et al. [35] developed a specialized detection model for dead trees. Furthermore, Xu et al. [36] utilized YOLOv4 and YOLOv7 for tree detection along trans-mission lines. Their findings indicated that different combinations of spectral bands significantly influenced detection performance. Additionally, Li et al. [37] constructed the YOLOv8-AS vegetation detection model tailored for reclamation in rare earth mining areas. To address the complexities of the mining area environment and meet the demands for ecological restoration and forest land management assessment, it is essential to conduct research on the detection of reclaimed vegetation utilizing multispectral remote sensing. This study aims to enhance the model’s recognition accuracy for reclaimed vegetation and its environmental adaptability, thereby providing technical support for ecological restoration and forest resource management in mining regions.
In response to the above problems, this study focuses on the learning and expression ability of deep learning models for multispectral information during the training process and explores how the models can conduct effective feature extraction and fusion in multispectral data. Combining multispectral remote sensing image data with the YOLOv8 target detection algorithm, a new method for detecting reclaimed vegetation in rare earth mining areas is explored. By optimizing the architecture of the deep learning model, the insitu high-dimensional features of multispectral data are fully utilized to alleviate the dependence of spatial features in the recognition of reclaimed vegetation in hilly and mountainous areas, enhance the adaptability of the model in complex hilly and mountainous environments, and provide more accurate and efficient technical means for the intelligent monitoring of reclaimed vegetation in rare earth mining areas. Based on YOLOv8, we expanded the model’s input channels and incorporated a redesigned Channel Attention and Global Pooling SPPF (CAGP-SPPF) Module for enhanced multispectral feature extraction. Additionally, we introduced the optimized DynamicConv for Convolution Replacement in the C2f Botternet module, facilitating dynamic feature convolution. This approach fully leverages the in situ high-dimensional features of multispectral data, thereby reducing the reliance of vegetation recognition in hilly and mountainous reclamation areas on spatial features. Consequently, the model’s adaptability in complex hilly and mountainous environments is enhanced, providing more precise and efficient technical means for the intelligent monitoring of reclamation vegetation in rare earth mining regions.

2. Materials and Methods

2.1. Introduction to YOLOv8

As a landmark advancement in single-stage object detection, YOLOv8 achieves a synergistic optimization of accuracy, speed, and efficiency through innovative architectural designs [38]. While significantly enhancing inference efficiency, the model further improves its detection capabilities and real-time performance through an optimized backbone network, the incorporation of multi-scale feature fusion technology, and refinements to the loss function [39]. The algorithm is structured into three primary components: the backbone, which extracts multi-scale features from input samples; the neck, which employs a Path Aggregation Network (PAN) to strengthen feature information transmission; and the head, which utilizes a decoupled structure to enhance the precision of classification and localization, ultimately outputting prediction results [40]. Moreover, the algorithm introduces data preprocessing strategies, such as mosaic augmentation and adaptive anchoring, to bolster its generalization ability, enabling it to adapt to complex application scenarios. To accommodate the demands of diverse computational environments, the model offers five variants of varying sizes: n, s, l, m, and x. YOLOv8n, designed for lightweight and efficient detection, is suitable for resource-constrained devices. In summary, YOLOv8 combines high accuracy, low latency, and broad applicability, rendering it highly valuable for applications in the field of object detection.

2.2. Introduction to MRV-YOLO

While YOLOv8 offers significant advantages in traditional three-channel (RGB) object detection, its architecture is primarily designed for three-channel feature extraction and struggles to adapt to the in situ multi-band characteristics of multispectral remote sensing imagery. Directly applying this model to multi-channel reclaimed vegetation datasets in rare earth mining areas may lead to critical channel information loss and insufficient extraction of multi-channel features, ultimately affecting detection accuracy. Moreover, rare earth mining areas are often situated in complex hilly regions, resulting in reclaimed vegetation exhibiting uneven growth, shape, and spatial distribution in UAV remote sensing images. To address these challenges, this study enhances the Fast Spatial Pyramid Pooling (SPPF) module in YOLOv8 and the C2f module in the neck network structure. We propose an improved multi-channel reclaimed vegetation detection method, MRV-YOLO, aimed at enhancing the model’s capability to extract and utilize multi-channel features, thereby improving detection performance on multi-channel reclaimed vegetation datasets. The structure of the enhanced model is illustrated in Figure 1.

2.2.1. CAGP-SPPF for Channel Attention and Global Pooling SPPF Module

In the YOLOv8 architecture, the SPPF module aggregates multi-scale features through cascaded max-pooling operations. It samples input feature maps to a fixed dimension and concatenates them to enhance the model’s adaptability to scale variations. However, in the context of reclaimed vegetation detection in rare earth mining areas, the original SPPF design, while preserving feature diversity and capturing target information at different scales, struggles to effectively extract global feature information due to the uneven distribution and complex global features of reclaimed vegetation. To address this, we previously proposed a multi-scale feature extraction method tailored to the spatial distribution characteristics of reclaimed vegetation in rare earth mining areas [37]. Although this method improved global spatial feature extraction on traditional three-band datasets, it did not resolve the issue of band-specific feature extraction in multispectral data. Therefore, this study introduces the Channel Attention and Global Pooling-Spatial Pyramid Pooling Fast (CAGP-SPPF) model. By incorporating channel attention mechanisms, this model enhances channel information extraction, optimizes feature representation and detection performance on multi-channel datasets, and improves the extraction of multi-channel features at different scales. This leads to better integration of multi-channel data. Overall, the model enhances robustness and stability against complex interferences such as illumination changes, occlusion, and noise by combining channel attention mechanisms with global multi-scale feature extraction. This effectively mitigates the impact of topographic undulations and shadows on reclaimed vegetation detection in hilly and mountainous areas.
The proposed module utilizes a channel attention mechanism to facilitate adaptive learning and extract key information from multi-channel features. As a pivotal technology for channel feature extraction and weight optimization, the channel attention mechanism not only enhances the representation of features in neural networks but also effectively assigns weights to channel features [41,42]. This mechanism operates by aggregating information from feature maps through average and max pooling operations, followed by the learning of importance weights for each channel using fully connected or convolutional layers. These weights are then multiplied with the original feature maps to reweight them, thereby emphasizing critical features and diminishing the influence of less significant ones. The computational process is illustrated in (1), and the model structure is depicted in Figure 2.
F = σ M L P A v g P o o l F + M L P M a x P o o l F = σ W 1 W 0 F a v g c + W 1 W 0 F max c
Here, F and F’ represent the input and output feature maps, respectively. The symbol σ(·) denotes the Sigmoid function. This function is used to normalize the attention weight of each channel to the (0,1) interval, thereby achieving weighted adjustment of the features of different channels; W0 and W1 are the weights of the multilayer perceptron (MLP), where W0 ∈ ℝC/r×C, W1 ∈ ℝC×C/r, and C is the number of channels, and r is the reduction ratio. F a v g c and F max c represent the global average pooling features and the global max pooling features, respectively.
Figure 2. Channel Attention Mechanism. In this figure, Input feature F and Output feature F’ denote the input feature map and the output feature map, respectively. Conv indicates the convolution module, while MaxPool refers to the maximum feature pooling module and the average pooling module. The term Shared MLP represents the shared multi-layer perceptron and add signifies feature concatenation. Lastly, Sigmoid denotes the activation function.
Forests 16 01536 g002
Next, the feature maps F’ are input into a standard convolution with a 1 × 1 kernel size, as shown in (2).
X out = SiLU B N Conv F , k = 1 , s = 1
Here, Xout represents the final output feature result; BN denotes batch normalization; Conv is the convolution function (with F’ as the input feature, k as the kernel size, and s as the stride); and SiLU is the activation function.
Based on the preliminary feature processing results, we simultaneously perform Global Average Pooling (GAP), Global Max Pooling (GMP), and three consecutive Max Pooling (MP) operations are performed simultaneously. Define the i-th output of pooling as Ci (where Xout = C0 is the initial feature map), the padding value p is used to maintain the feature map size (edge padding is achieved through the zero layer), Fgmp and Fgap denote the output layers of convolutional feature maps processed by GMP and GAP, respectively, and the output size parameter o = 1 corresponds to the adaptive pooling compression of the arbitrary input size to 1 × 1. The calculations for these pooling operations are shown in (3) and (4).
C i = M a x P o o l C i 1 , k = 5 , p = 2
F g m p = A d a p t i v e M a x P o o l ( C 0 , o = 1 ) F g a p = A d a p t i v e A v P o o l ( C 0 , o = 1 )
Subsequently, all feature results are concatenated along the channel dimension using the Concat function, and the concatenated feature map f is calculated as shown in (5).
f = C o n c a t ( X o u t , C 1 , C 2 , C 3 , F g m p , F g a p )
Finally, convolve the feature map f obtained in the previous step and apply the corresponding activation function to calculate the final output feature map. Suppose c is the serial number of the output channel; Cin represents the number of channels in the feature map; W(c)[0, 0, c’] is the element of the weight matrix of the c-th output channel, corresponding to the position of the input channel c’. f [h, w, c’] is the value of the feature map obtained in the previous step at the corresponding position; B[c] is the bias term of the output channel c; It can be obtained that Z[h, w, c] is the intermediate result after the convolution operation on the feature map f, with the values at the height position h, width position w, and output channel c. Y[h, w, c] represents the values of the feature map at the height position h, width position w, and channel c after output. The calculation formula can be obtained as (6):
Z [ h , w , c ] = c C i n W ( c ) 0 , 0 , c × f h , w , c + B c Y [ h , w , c ] = S i L U ( Z h , w , c ) C i n = c × 6 + c 2
The CAGP-SPPF structure, which is based on the SPPF architecture and incorporates Channel Attention mechanisms, Global Average Pooling, and Global Max Pooling, is illustrated in Figure 3.

2.2.2. DynamicConv for Convolution Replacement in C2f Botternet

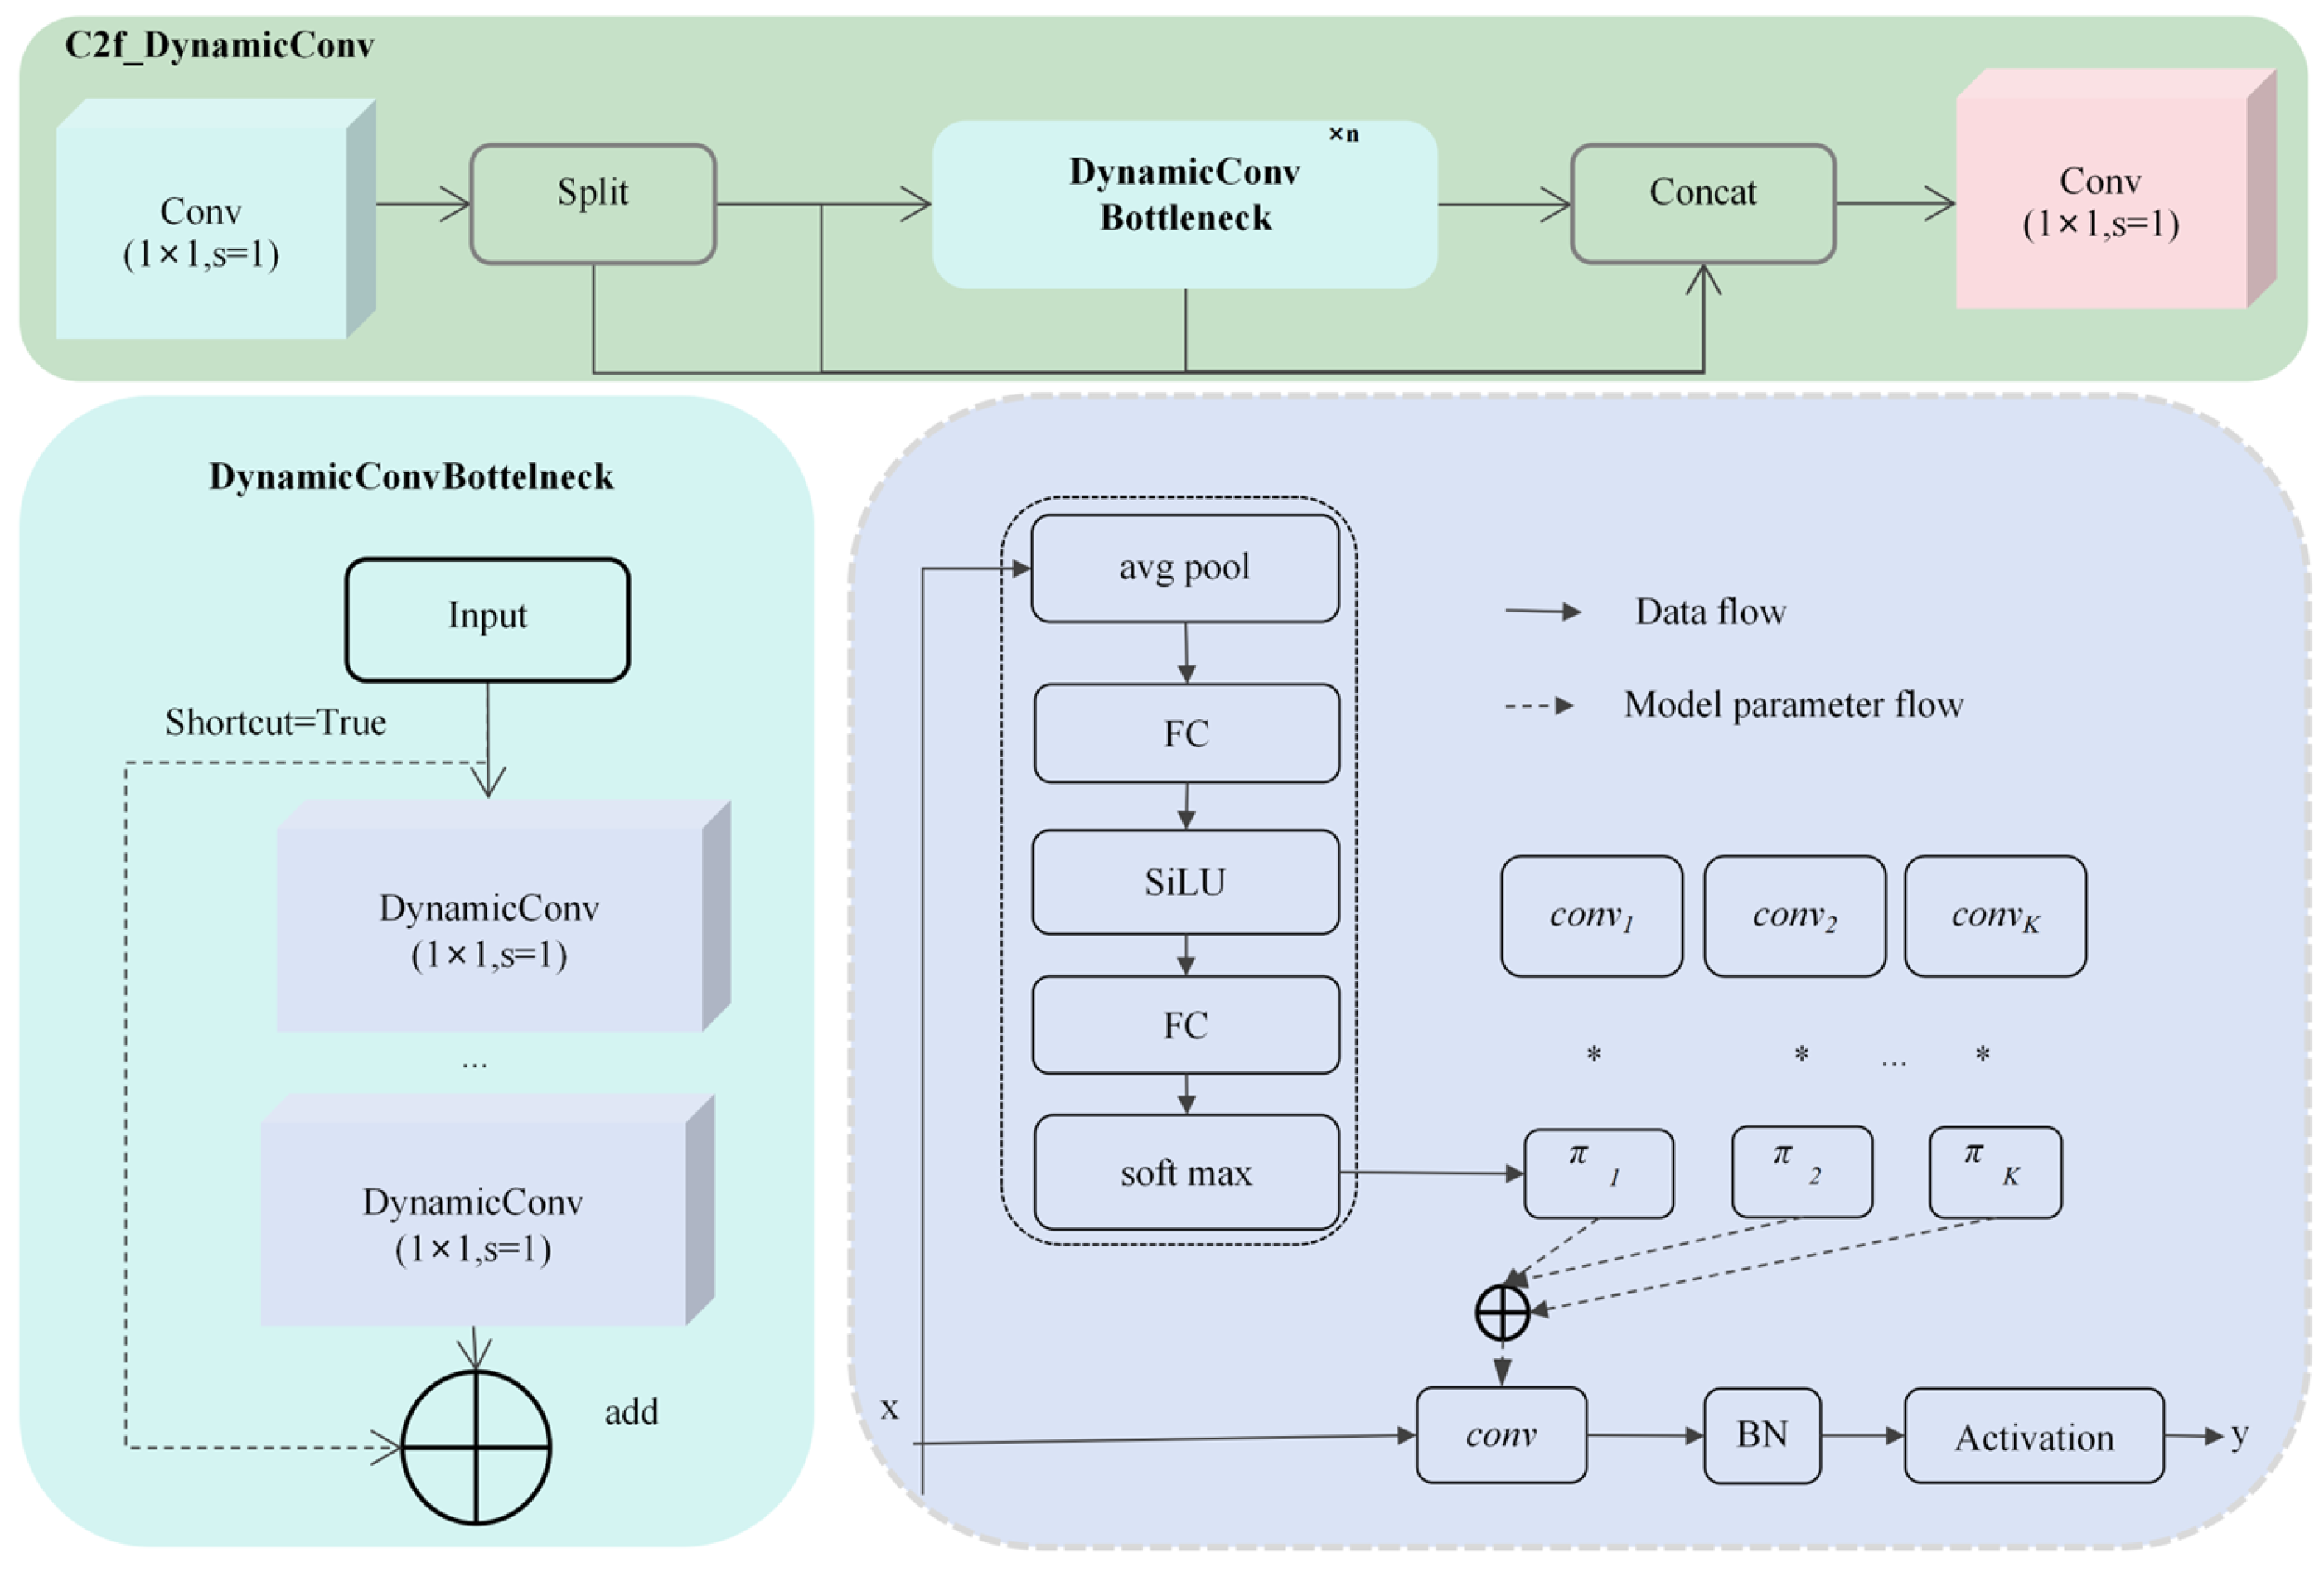
To enhance the model’s ability to capture complex spectral-spatial features in multi-channel reclaimed vegetation data, this study adaptively improves the C2f module within the neck network of YOLOv8. By optimizing the cross-channel feature interaction mechanism and the multi-scale information fusion strategy, the model’s representation capability for nonlinear associations among multi-spectral bands is significantly enhanced, thereby strengthening feature representation in multi-channel reclaimed vegetation detection tasks. The neck network of the YOLOv8 model utilizes the C2f module for feature extraction and fusion. This module comprises three main components: two 1 × 1 convolutional layers responsible for transforming feature dimensions; a Split operation that divides features and feeds them into multi-level Bottleneck modules for deep feature extraction; and a Concat operation that integrates features across multiple scales. Specifically, the original Bottleneck module employs a dual 3 × 3 fixed convolutional kernel structure. Its static weight parameters struggle to adapt to the spectral-spatial distribution of input data, resulting in inflexibility and computational redundancy in multi-spectral vegetation feature extraction. Therefore, optimizing the Bottleneck’s dynamic feature extraction capability is crucial for enhancing the efficiency of multi-channel reclaimed vegetation detection. This study improves the C2f module in YOLOv8’s neck network by proposing the C2f_DynamicConv module. The core enhancement involves replacing the standard convolution in the original Bottleneck structure with an optimized Dynamic Convolution (Dynamic Conv), thereby forming a DynamicConv Bottleneck unit. Based on the dynamic weight adjustment mechanism introduced by Cheng et al. [43], dynamic convolution employs attention mechanisms to adaptively adjust kernel parameters according to the input. This enables the model to generate kernel weights dynamically based on sample features, thereby enhancing the extraction of complex features in multi-channel reclaimed vegetation. To accommodate multi-spectral data, this study optimizes Dynamic Conv. Specifically, the original ReLU function in DynamicConv is replaced with a SiLU activation function [44], which, due to its continuous differentiability, improves the model’s capacity to represent nonlinear spectral features. The optimized DynamicConv structure comprises an average pooling layer, two Fully Connected (FC) layers, a SiLU activation function, a softmax activation function, K dynamic convolutional kernels, a convolutional operation, batch normalization (BN), and an activation function layer. The workflow consists of two primary steps: generating dynamic convolutional kernels and applying them for feature convolution. Kernel generation extracts global feature information from the input feature x via global average pooling, fuses it into a vector, and maps it through fully connected layers. After the SiLU activation introduces nonlinearity, another fully connected layer projects it into a K-dimensional space. Softmax normalization subsequently generates dynamic attention weights, which combine with convolutional kernels and biases to yield K dynamic kernels. Each kernel adjusts its weight dynamically based on the input data for fusion. The second step employs these dynamic kernels to perform convolution on the input features, followed by normalization and activation to produce the output feature y. The working principle of DynamicConv, analogous to traditional or static perceptrons, is illustrated in (7).
y = g W ˜ T x x b ˜ x W ˜ x = k = 1 k π k x W ˜ k , b ˜ x = k = 1 k π k x b ˜ k s . t . 0 π k x 1 , k = 1 k π k x = 1
In the equation, x denotes the input, and y denotes the output. W, b, and g represent the weights, bias, and activation function, respectively. πk(x) represents the attention weight coefficient of the k-th linear function.
The optimized C2f_DynamicConv module processes features through a systematic approach. Initially, input features undergo transformation via a standard convolutional layer, followed by a Split operation that divides them into two branches along the channel dimension. The main branch feeds into several cascaded DynamicConv Bottleneck modules, each utilizing optimized dynamic convolution (DynamicConv) to adaptively extract deep spectral-spatial features. In contrast, the bypass branch preserves the original shallow features. After multi-level dynamic feature extraction, deep features from the main branch and shallow features from the bypass branch are fused across levels using a Concat operation. The resulting fused features are then channel-compressed, and their representation is optimized through a subsequent standard convolutional layer, leading to enhanced multi-scale feature maps. Overall, this module achieves a balance between feature richness and computational efficiency by employing a dynamic convolution mechanism combined with cross-level feature fusion. It effectively addresses the challenges of low detection accuracy in reclaimed vegetation, which arise from fixed-height flight restrictions and the absence of precise terrain data at varying altitudes. To rigorously validate the effectiveness of DynamicConv over the standard convolution, the kernel size and the number of dynamic convolution kernels are kept identical to those of the original convolution layer. Specifically, the kernel size is set to 1 × 1, and the number of kernels (n) is fixed at 4. Furthermore, the dynamic mechanism adjusts the spectral weights, thereby enhancing the contribution of near-infrared and dual red-edge bands to the detection accuracy of reclaimed vegetation. The complete architecture of the module is illustrated in Figure 4.

3. Experiments and Setups

3.1. Study Area and Dataset

3.1.1. Study Area Overview

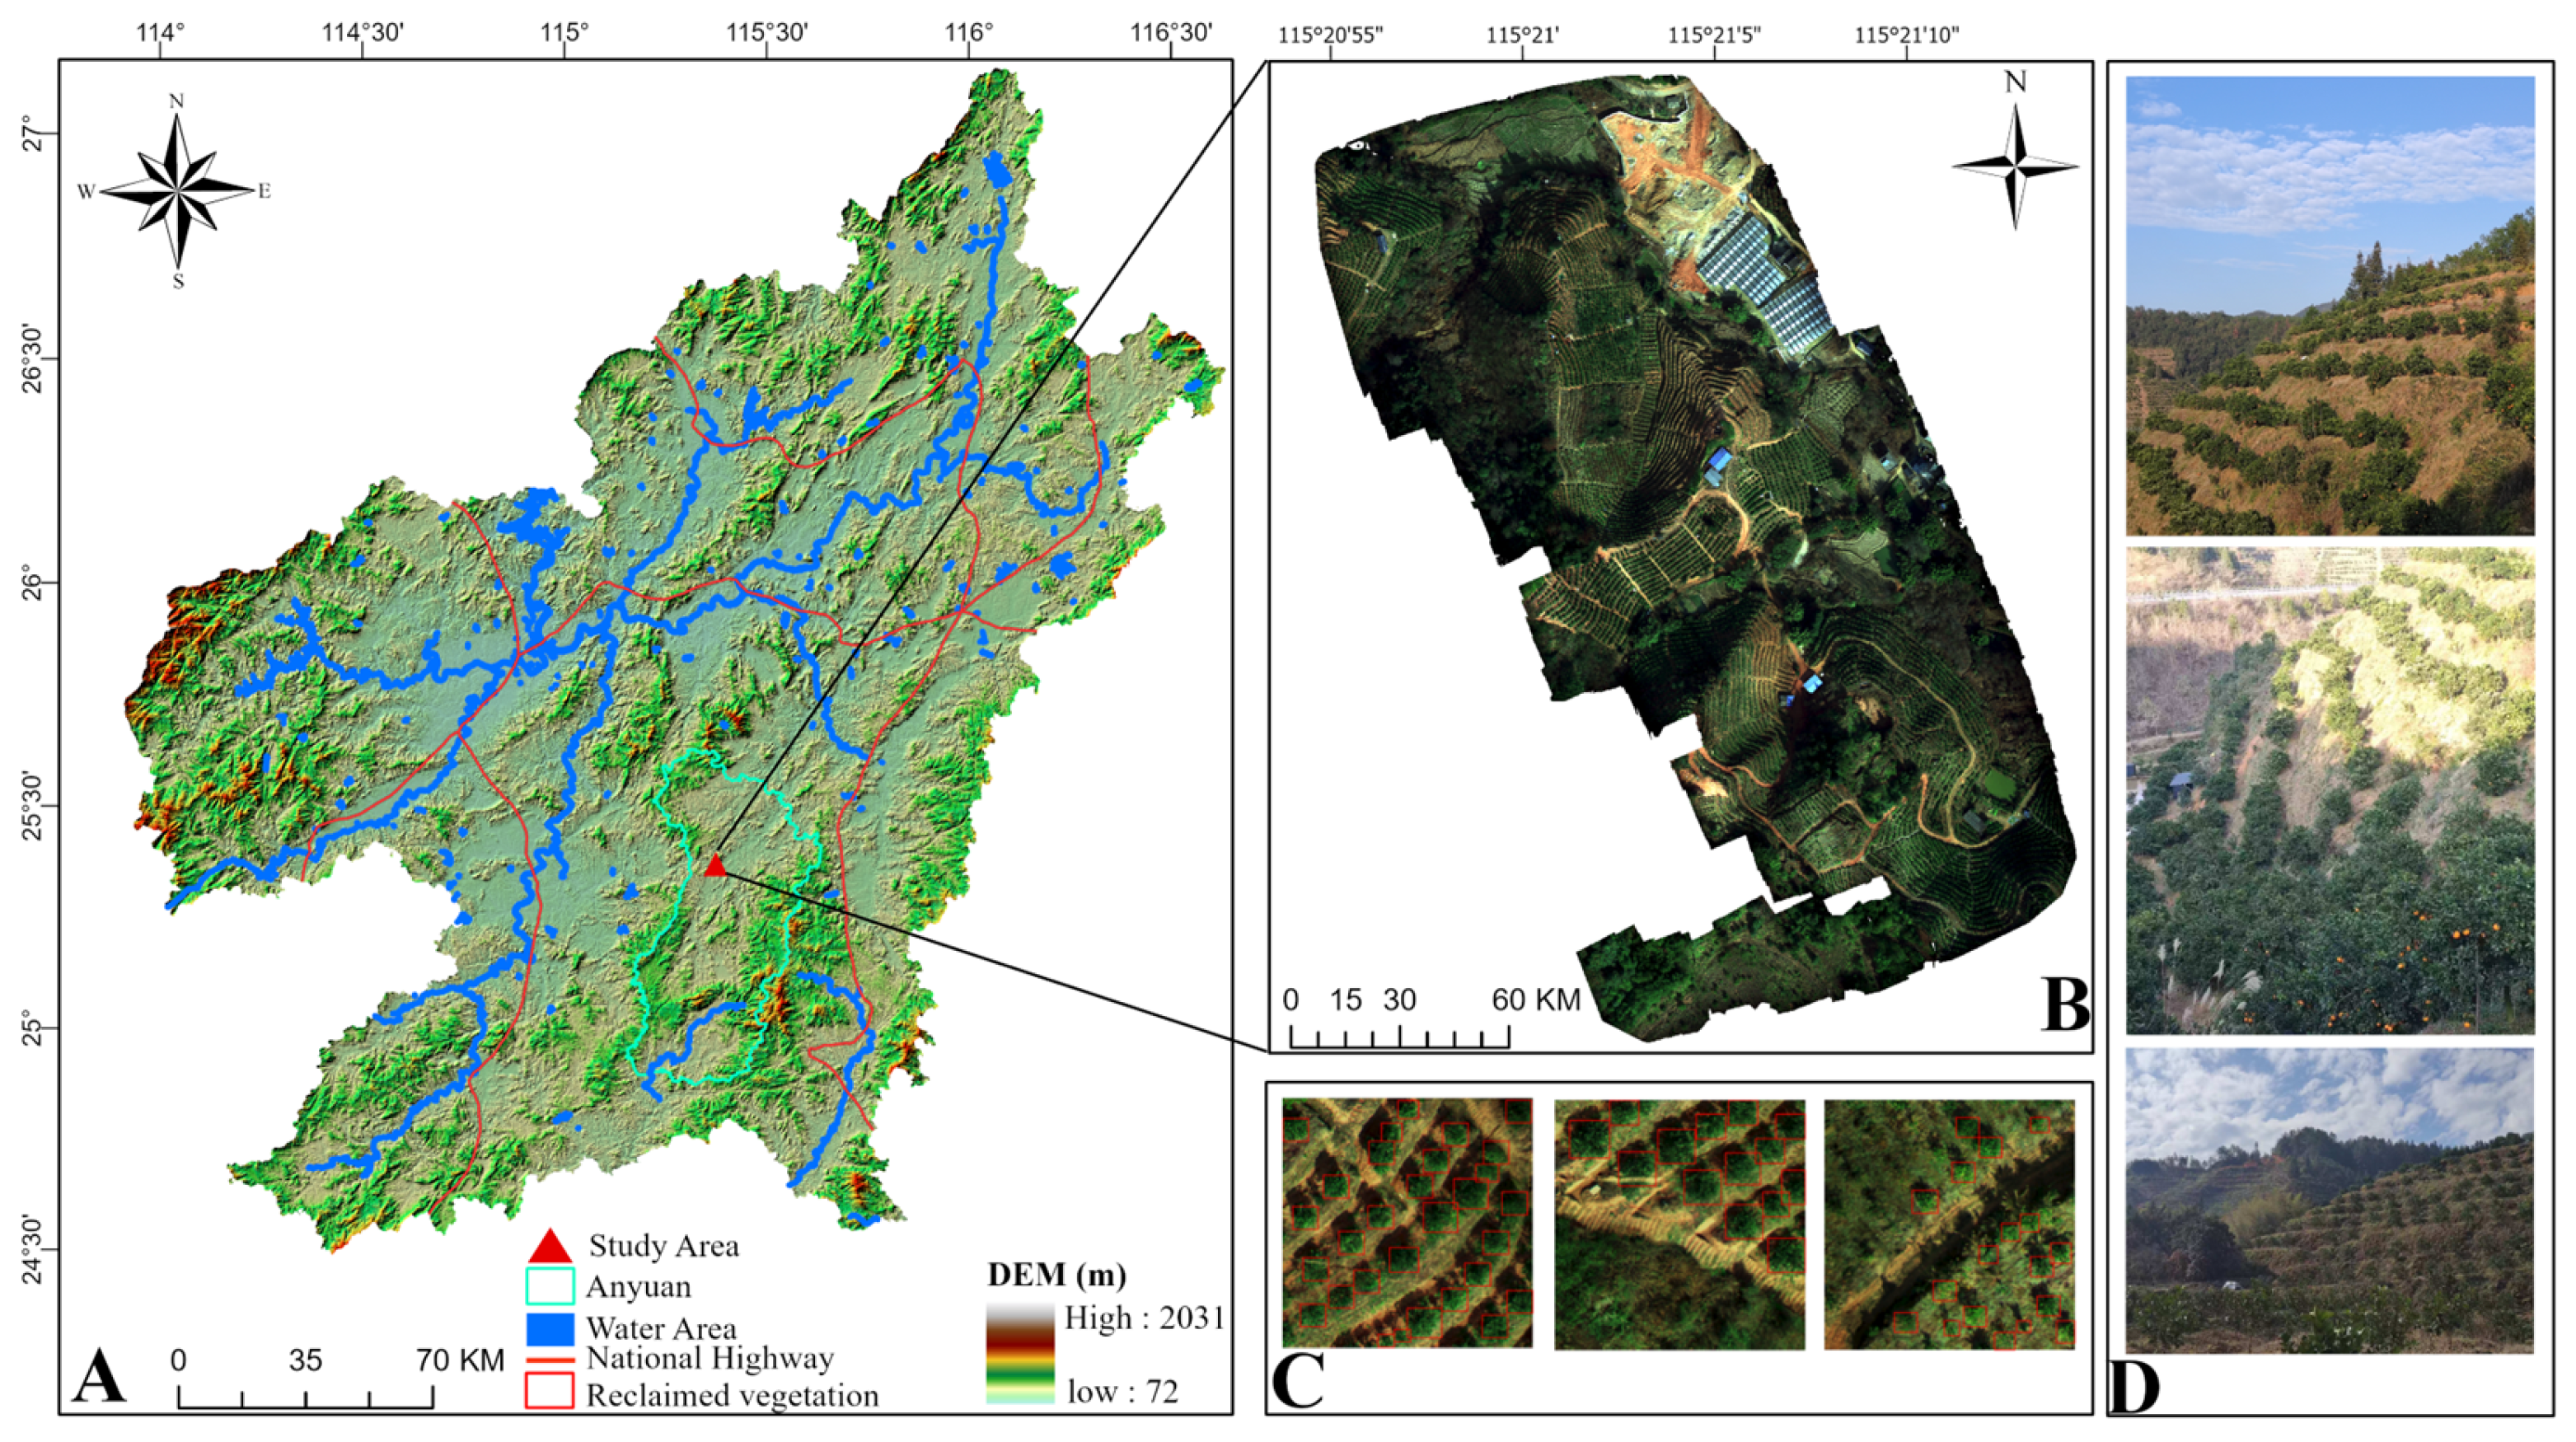
This study focuses on the ecological restoration needs of rare earth mining areas, selecting a typical mining area in Huangkeng Village, Anyuan County, Ganzhou City, China (115°20′55″ E–115°21′15″ E, 25°7′ N–25°7′25″ N) as the study object. The aim is to develop a multi-channel reclaimed vegetation detection method suitable for complex mining environments. After years of rare earth mining, the area has ceased production and is currently in the artificial ecological reclamation stage. However, soil structural damage and heavy metal pollution resulting from long-term mining [7] have led to slow growth and fragmented distribution of reclaimed vegetation. Coupled with the area’s significant topographic undulations and background noise, these factors present severe challenges for the development of intelligent monitoring technologies. The overview of the study area is shown in Figure 5.

3.1.2. Data Processing and Dataset Descriptions

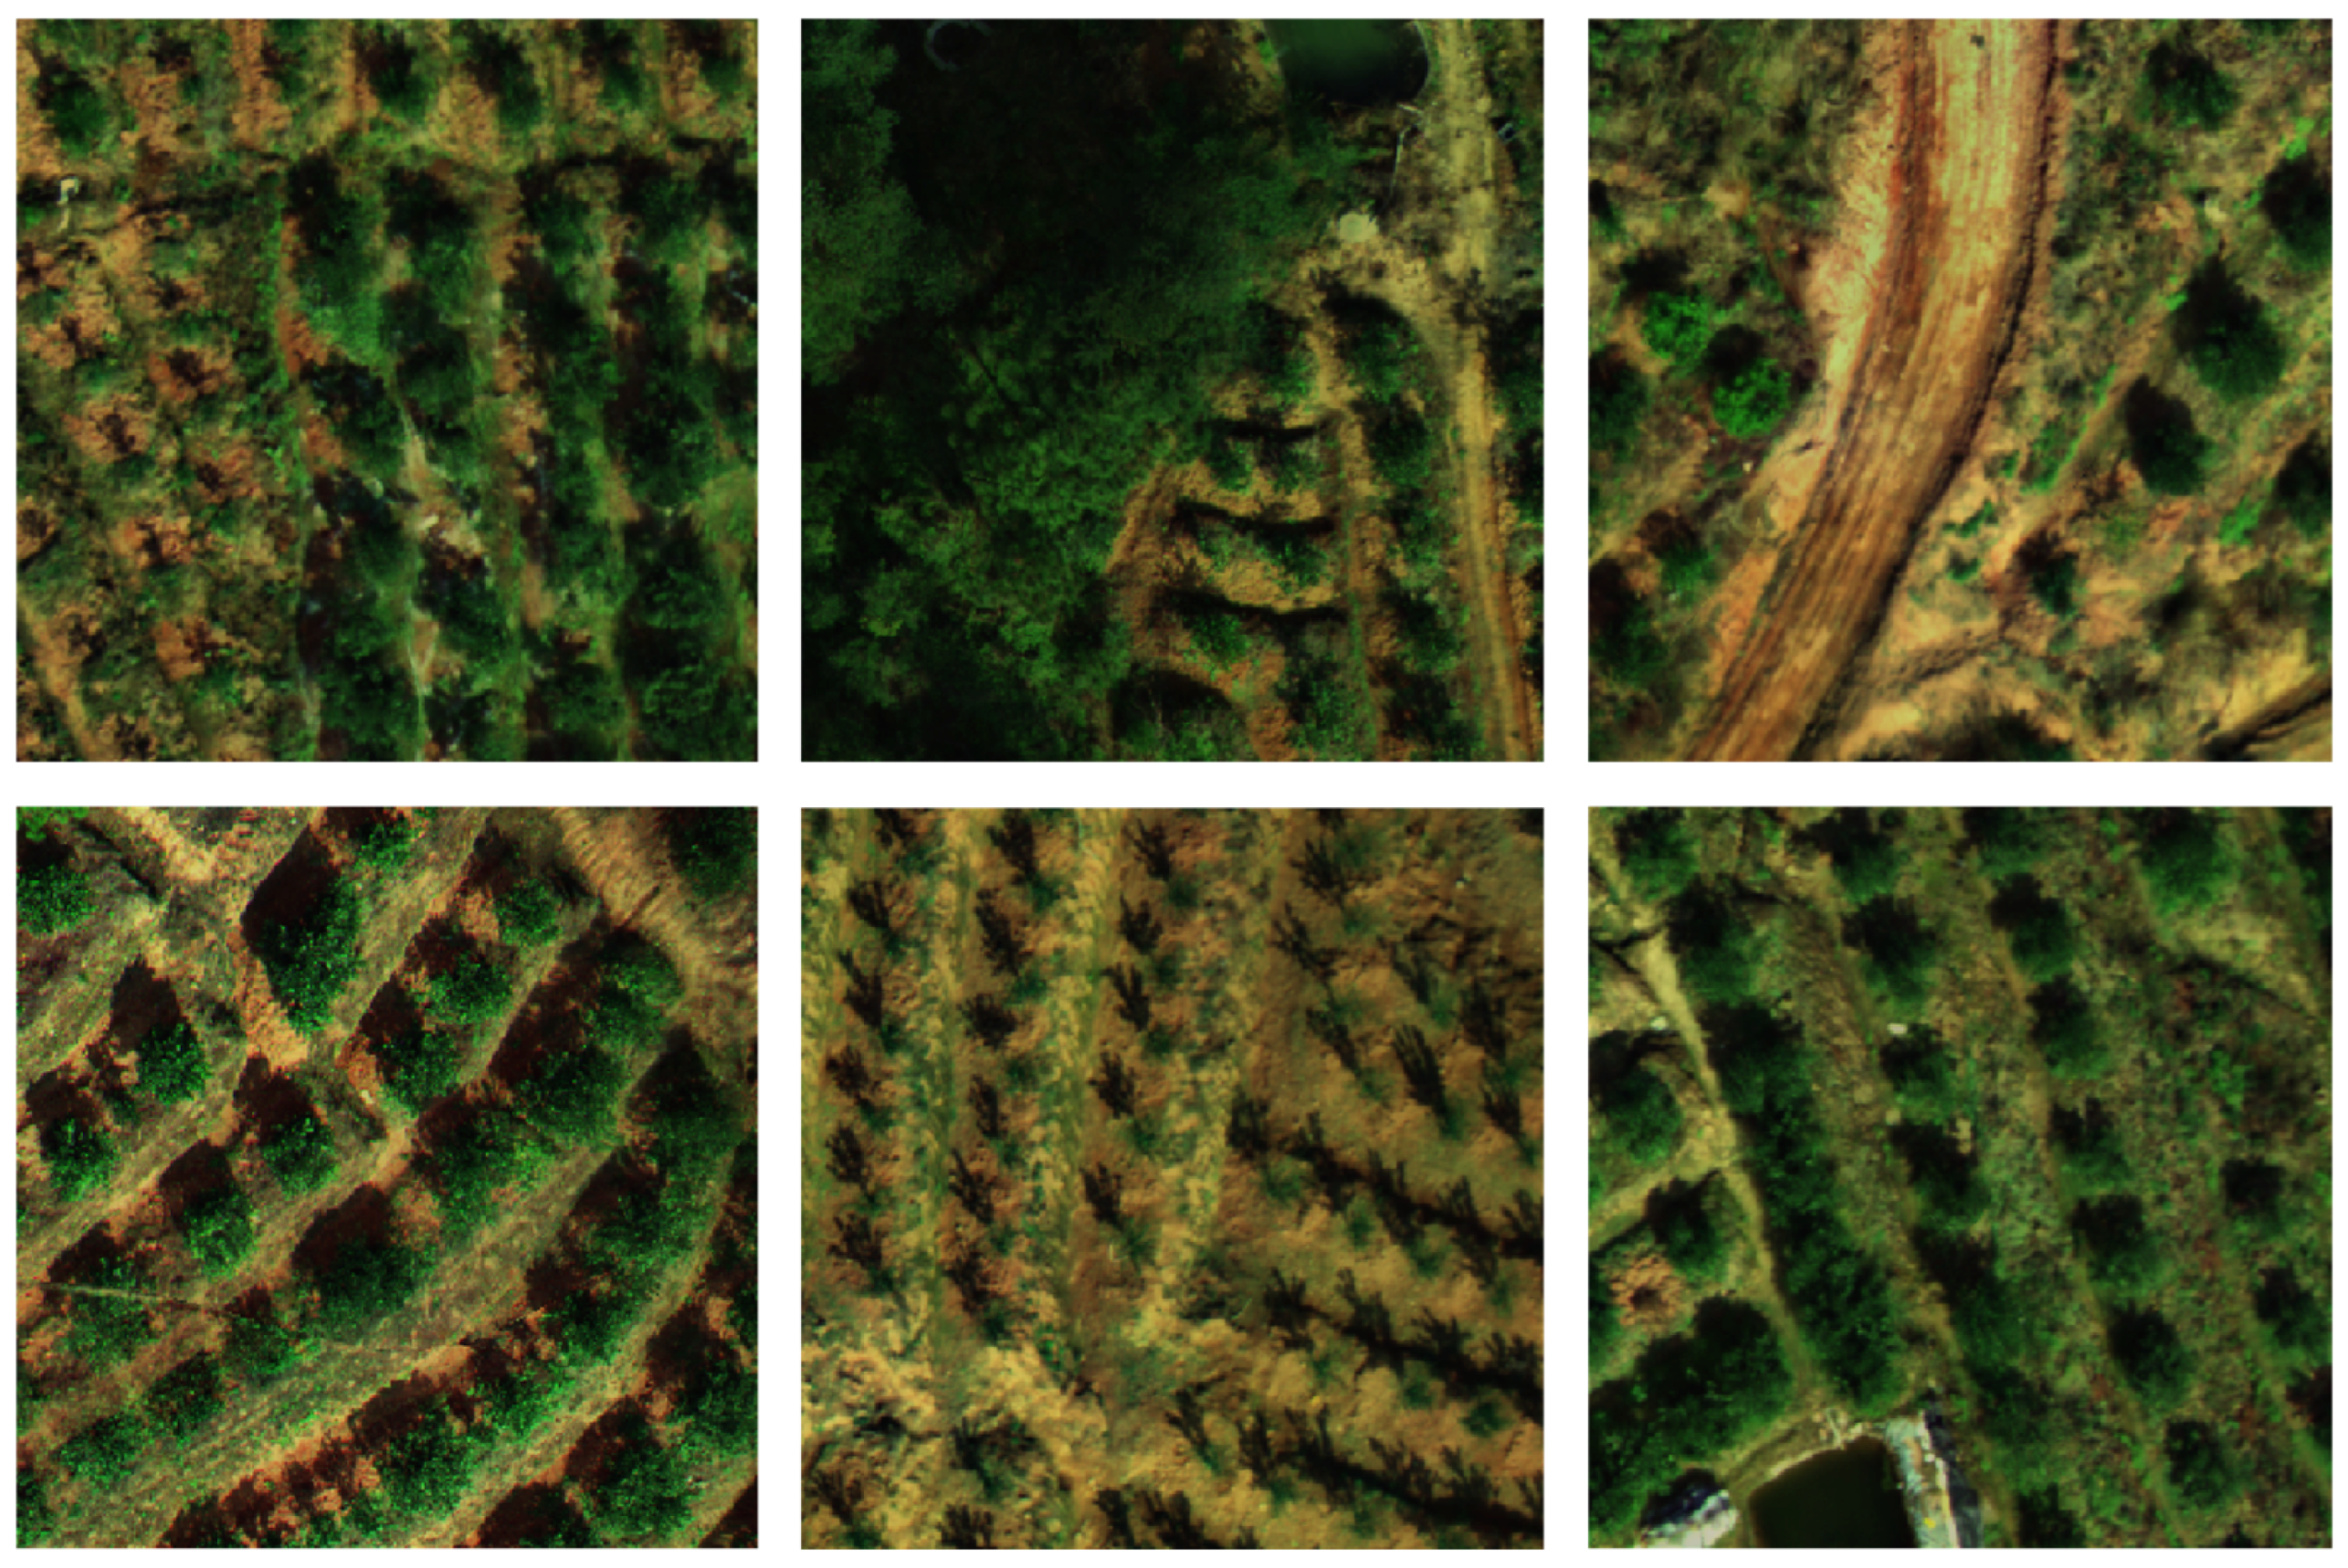
To address the limitations of traditional three-channel target detection models in the complex task of hilly and mountainous reclaimed vegetation detection, it is essential to develop a multi-channel target detection model tailored for identifying reclaimed vegetation in rare earth mining areas. This study utilized a high-precision multi-spectral imaging system mounted on the MS 600 PRO UAV (Yusense, Qingdao, China), employing a flight scheme at an altitude of 120 m with 75% heading and side overlap to collect remote sensing image data from the study area. This approach resulted in a multi-spectral image with a spatial resolution of 0.04 m, comprising 9112 × 11,669 pixels. The spectral information parameters of the multi-spectral remote sensing data are presented in Table 1. During the sample production process, we employed code to segment the preprocessed multispectral images, resulting in aligned RGB and six-band multispectral data. The annotation of reclaimed vegetation was conducted through manual visual interpretation and on-site investigation. In the remote sensing images, we identified the reclaimed vegetation based on canopy morphology, spatial distribution characteristics of the plants, and the spectral responses of the red edges and near-infrared bands. This study specifically focused on detecting the types of reclaimed vegetation in the mining area; therefore, only the reclaimed vegetation was marked during the manual labeling process and subsequently verified on-site. All annotation results are saved in TXT format and maintained consistently across RGB and multispectral images to ensure data consistency and comparability. To accurately characterize the multispectral bands in situ, we constructed a reclaimed vegetation dataset from the acquired multispectral remote sensing images, which includes 1356 images with 8344 labeled reclaimed plants. The dataset was subsequently divided into a training set and a verification set in a 9:1 ratio, with images resized to 320 × 320 pixels for model training. The remote sensing dataset of reclamation vegetation in rare earth mining areas constructed in this study has significant characteristics of scene complexity and target diversity. Overall, there are significant differences in the spatial distribution of reclaimed vegetation. It includes both areas with high survival rates and good growth conditions, as well as a large number of areas that have been reclaimed multiple times in the later stage and have poor growth conditions. Meanwhile, the background is often accompanied by complex situations such as exposed ground surfaces, weeds, shrubs and human interference elements, and the distinction between the target and the background is relatively low. Some areas are also affected by undulating terrain and strong shadows, resulting in significant differences in the form, scale and texture of the reclaimed vegetation throughout the region, blurred target edges, high mixing with the surrounding non-vegetation areas, and difficulty in simple feature separation, further increasing the difficulty of detection. Some samples are shown in Figure 6.

3.2. Evaluation Metrics

To verify the effectiveness of the algorithm, this paper employs metrics such as precision, recall, average precision, and F1 score to evaluate its detection performance [38]. Precision, which indicates the reliability of the model’s positive predictions, is defined as the proportion of actual positive instances among all instances predicted as positive. The calculation process for precision is referenced in (8).
P = N T P N T P + N F P
In this context, True Positives (TP) refer to the instances that the model accurately identifies as positive, while False Positives (FP) denote the instances that are incorrectly classified as positive.
Recall, defined as the proportion of actual positives correctly detected by the model, serves as a measure of its effectiveness in identifying true targets. A higher recall signifies a reduced likelihood of overlooking actual positives. Assuming False Negatives (FN) represent the actual targets that the model fails to detect, the calculation is presented in (9).
R = N T P N T P + N F N
The Mean Average Precision (mAP) metric integrates both precision and recall, providing a comprehensive assessment of model performance. It is commonly employed to compare the efficacy of different algorithmic models and to fine-tune model hyperparameters. A higher mAP value indicates improved detection accuracy and stability on the test set. The calculation is referenced as shown in (10), where N represents the total number of categories in the target detection task, and AP denotes the average accuracy of a single category. Since this paper focuses on a single category, mAP and AP are equivalent. Furthermore, it is important to note that mAP@0.5 signifies the average precision when the Intersection over Union (IoU) between the predicted box and the ground truth box is 0.5. In contrast, mAP@0.5:0.95 represents the mean average precision calculated across the IoU range of 0.5 to 0.95, in increments of 0.05.
f m A P = 1 N i = 1 N f A P
The F1-score is the weighted harmonic mean of Precision (P) and Recall (R). Its calculation is referenced in (11).
F 1 S core = 2 × P × R P + R

3.3. Experimental Environment Settings

The experimental setup for this study comprises both hardware and software configurations. The hardware configuration includes an Intel(R) Core(TM) i5-13400 processor operating at 2.50 GHz with 16 GB of RAM (Santa Clara, CA, USA), and an NVIDIA GeForce GTX 1660 GPU with 6 GB of VRAM (Santa Clara, CA, USA). The software configuration consists of Windows 10 operating system, Python 3.9, PyTorch 2.2.0, and CUDA 11.8. During model training, input images are resized to 320 × 320 pixels. The AdamW optimizer, which employs an adaptive learning rate, is initialized at 0.002 with a momentum of 0.9. The batch size is set to 16, and the training is conducted over 100 epochs. All other hyperparameters are maintained at their default values.

4. Results Analysis and Discussion

4.1. Structural Analysis of Experiments Comparing Different Target Detection Models

To verify the validity of the model, we conducted a comparative experiment between the MRV-YOLO algorithm and several common object detection algorithms, including RT-DETR, YOLOv3, YOLOv5, YOLOv6, YOLOv7, YOLOv7-Tiny, YOLOv8, YOLOv8-AS, YOLOv10, and YOLOv11, all under the same conditions.
As can be seen from Table 2, the detection results of the multi-channel are superior to those of the traditional three-channel, and the average accuracy difference between the multi-channel and three-channel of 11 models is 5.68% when the IOU intersection ratio is 0.5. At the same time, multi-channel feature input can further enhance the generalization ability of the model and further make the detection effect of multi-spectrum better than the traditional RGB three-channel. The three-channel and multi-channel mAP@0.5 of this article algorithm reach 87.6% and 91.6%, respectively, which are 4.9% and 4.6% higher than that of the original model YOLOv8. Similarly, compared with the previous YOLOv8-AS model proposed by us [36], the three-channel and multi-channel mAP@0.5 are also increased by 2.8% and 2.1%, respectively. In addition, in the detection task of reclaimed vegetation in rare earth mining areas, although YOLOv10 and YOLOv11 are both optimized and improved based on YOLOv8, the monitoring accuracy of YOLOv8 is 7.6% and 5.4% higher than that of YOLOv10’s three-channel and multi-channel mAP@0.5, respectively. Compared with YOLOv11, they increased by 9.5% and 6.2%, respectively. This result may be caused by the poor adaptability of the targeted improvement of the two models in the detection task of reclaimed vegetation in the complex environment of hills and mountains.
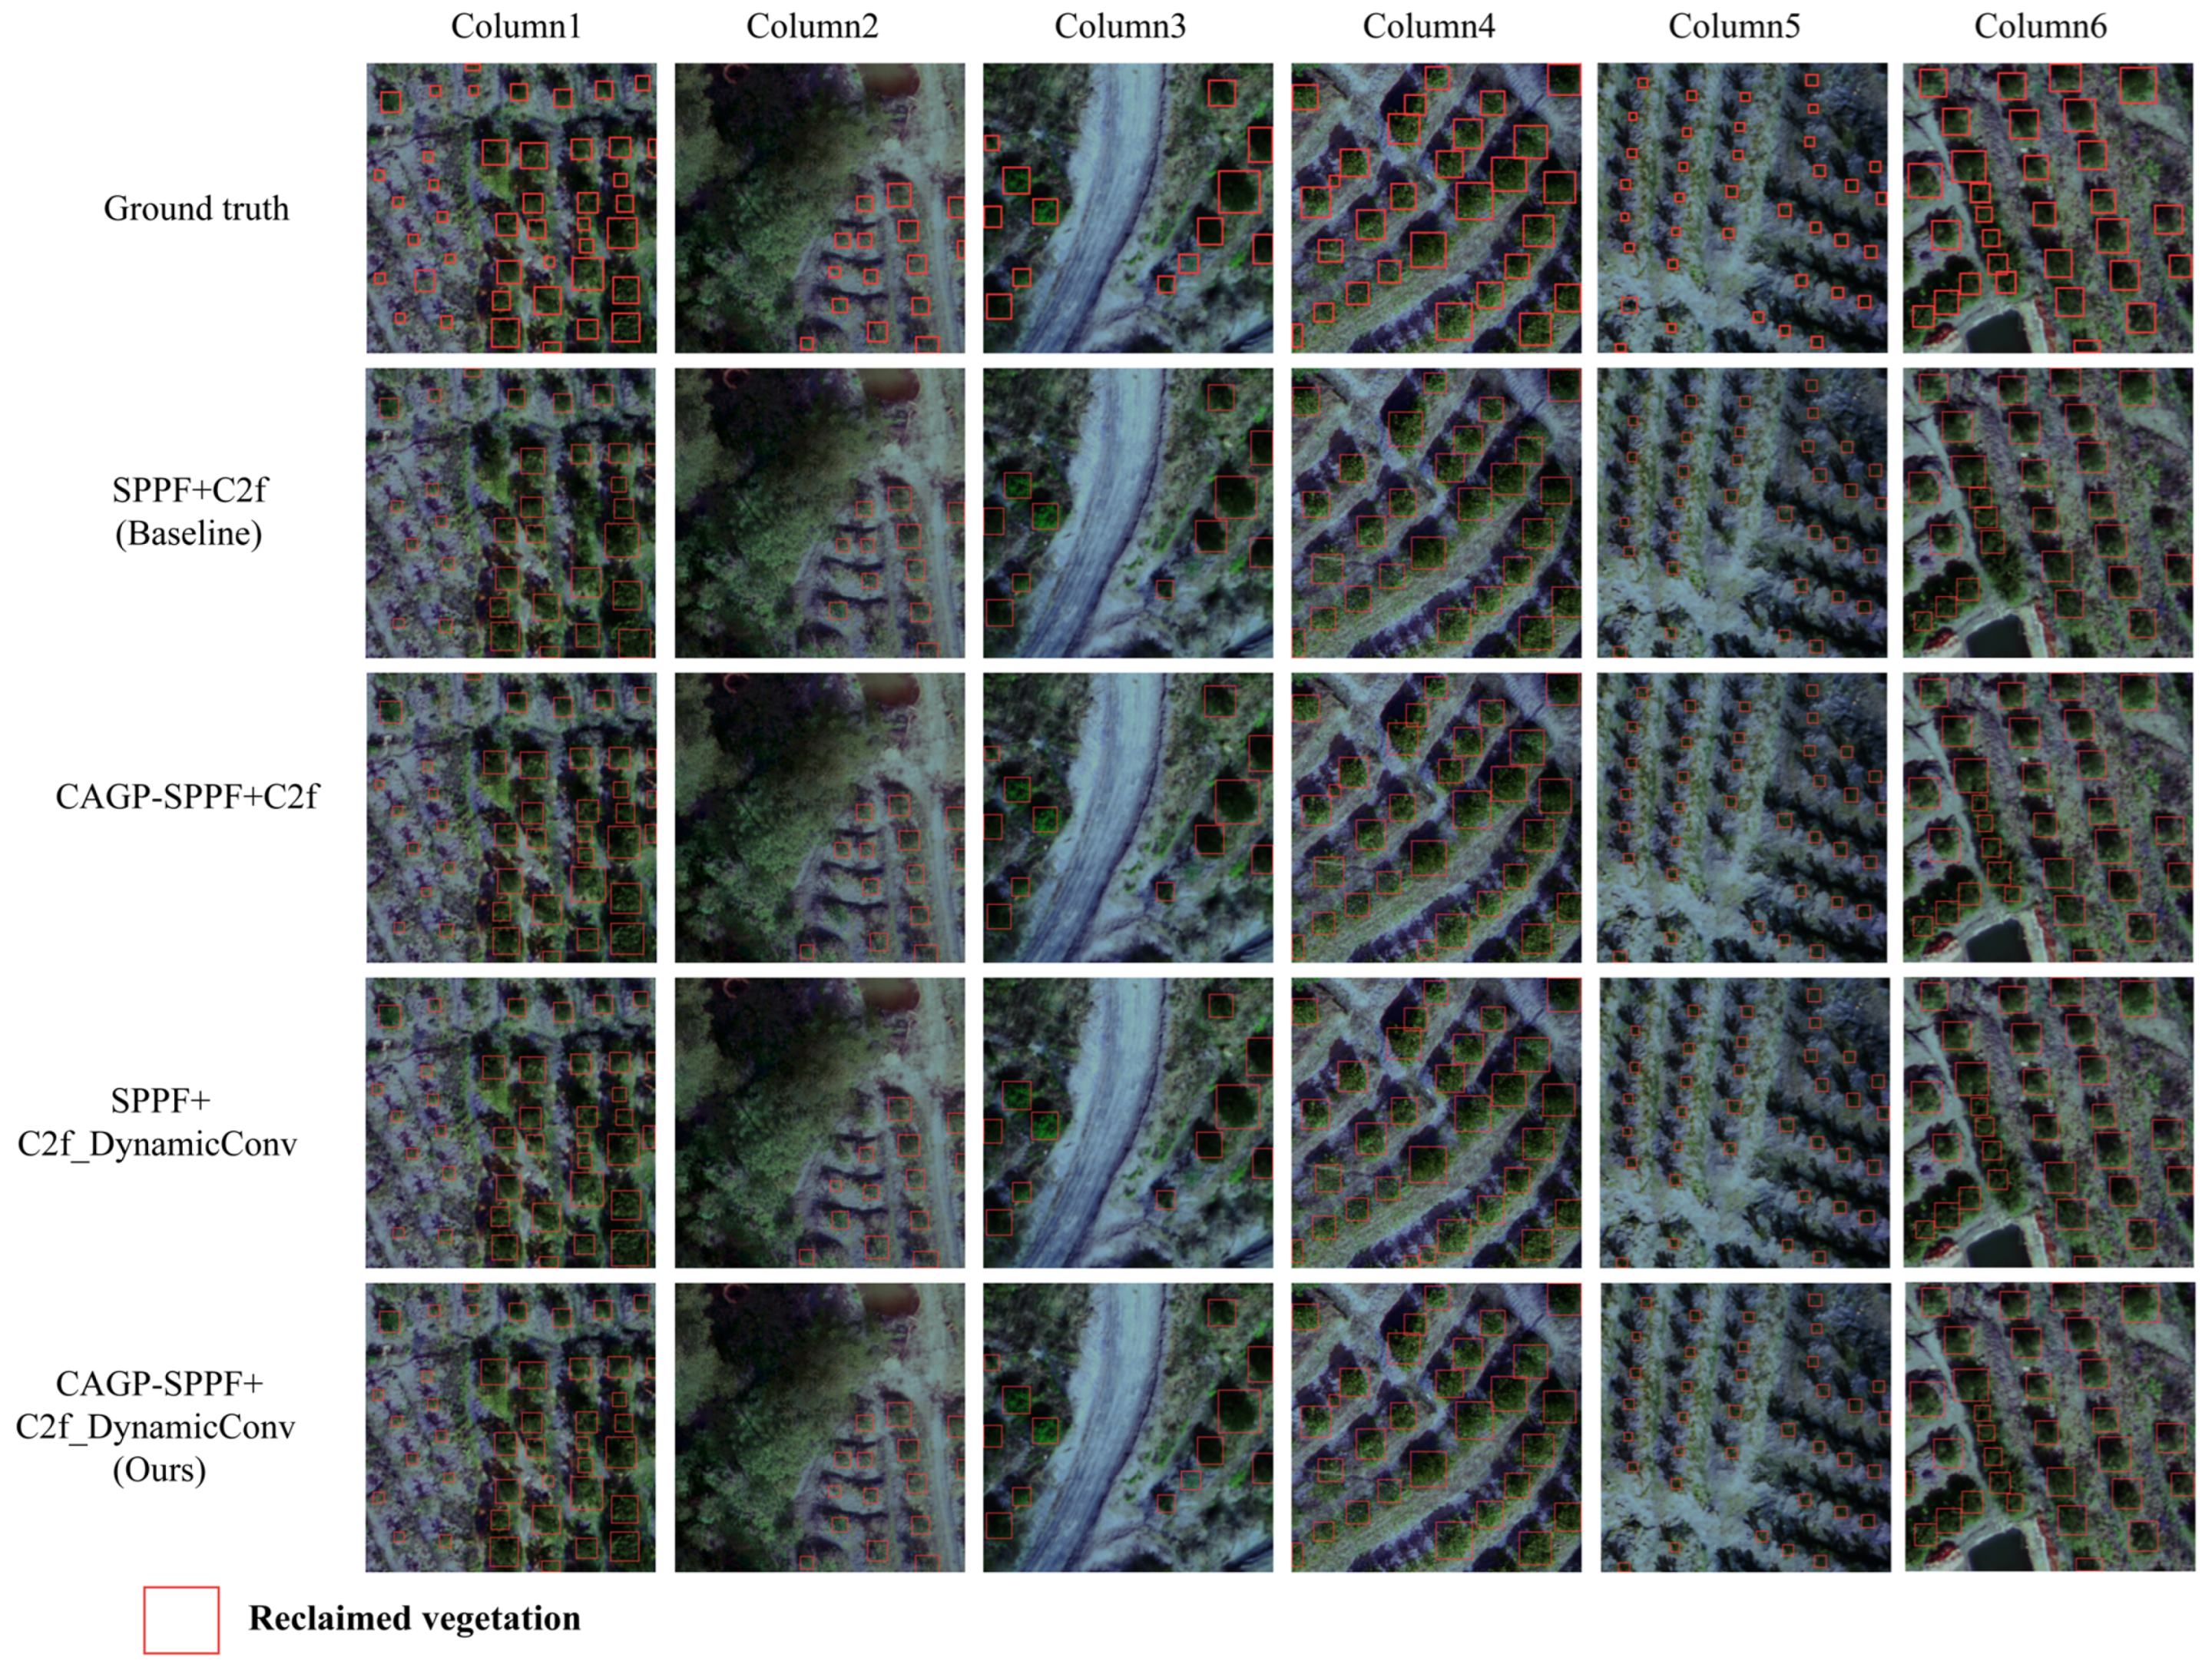
To further validate the effectiveness of the proposed algorithm in practical detection scenarios, we conducted a comparative analysis with the detection results of other models. As illustrated in Figure 7, our algorithm demonstrates a significant advantage over alternative models when detecting reclaimed vegetation of varying sizes and shapes. Notably, when the growth of reclaimed vegetation is robust and its distribution is uniform, the overall detection performance of all models improves. However, for targets exhibiting poor growth and small image dimensions, our algorithm effectively mitigates instances of missed detections, thereby enhancing the accuracy of reclaimed vegetation detection. Additionally, in scenarios where shadows overlap in the images, our model shows a marked improvement in detection performance. Furthermore, the visual comparison results of the proposed algorithm across both three-channel and multi-channel analyses provide compelling evidence that our approach reduces the interference caused by topographic relief and shadow overlap in the multi-channel detection task. This capability allows for the optimal utilization of spectral feature information, significantly reducing the occurrence of missed detections in reclaimed vegetation.

4.2. Analysis of Ablation Experiments

In order to further verify the effectiveness of the two module improvements in the proposed algorithm, we conducted ablation experiments on the improved method and the original module. It can be seen from Table 3 that mAP@0.5 and mAP@0.5:0.95% of the three-channel detection results of the CAGP-SPPF module reach 87.4% and 45.5%, respectively, while the six-channel detection results reach 90.8% and 59.2%. Compared with the original SPPF module, the three-channel and multi-channel mAP@0.5 increased by 4.3% and 3.8%, respectively, indicating that the CAGP-SPPF module can fully extract multi-scale multi-spectral band features and multi-scale global spatial feature information. The model can further improve the extraction and fusion ability of spectral features of reclaimed vegetation in the complex natural environment of rare earth mining areas. Secondly, the three-channel and multi-channel mAP@0.5 of C2f_DynamicConv module are increased by 3.8% and 3.5% compared with C2f module, indicating that C2f_DynamicConv module can replace C2f module to learn, express and transmit multi-spectral feature information flexibly and efficiently. It can further ensure the detection accuracy of reclaimed vegetation. In summary, the improved method proposed in this paper can effectively use channel feature information, significantly improve the detection accuracy of reclamation vegetation in rare earth mining areas caused by terrain relief, shadow overlap and image quality differences, and provide a new multi-channel target detection method for the recognition of reclaimed vegetation in hilly and mountainous areas. In addition, the visual comparison of the prediction results of the improved module and the original module in Figure 8 shows that the former significantly reduces the missed and false detection of reclaimed vegetation compared with the latter, reduces various complex background interference, and can well ensure the effectiveness of channel information and improve the utilization rate of channel information, so as to achieve better detection results with relatively few samples.
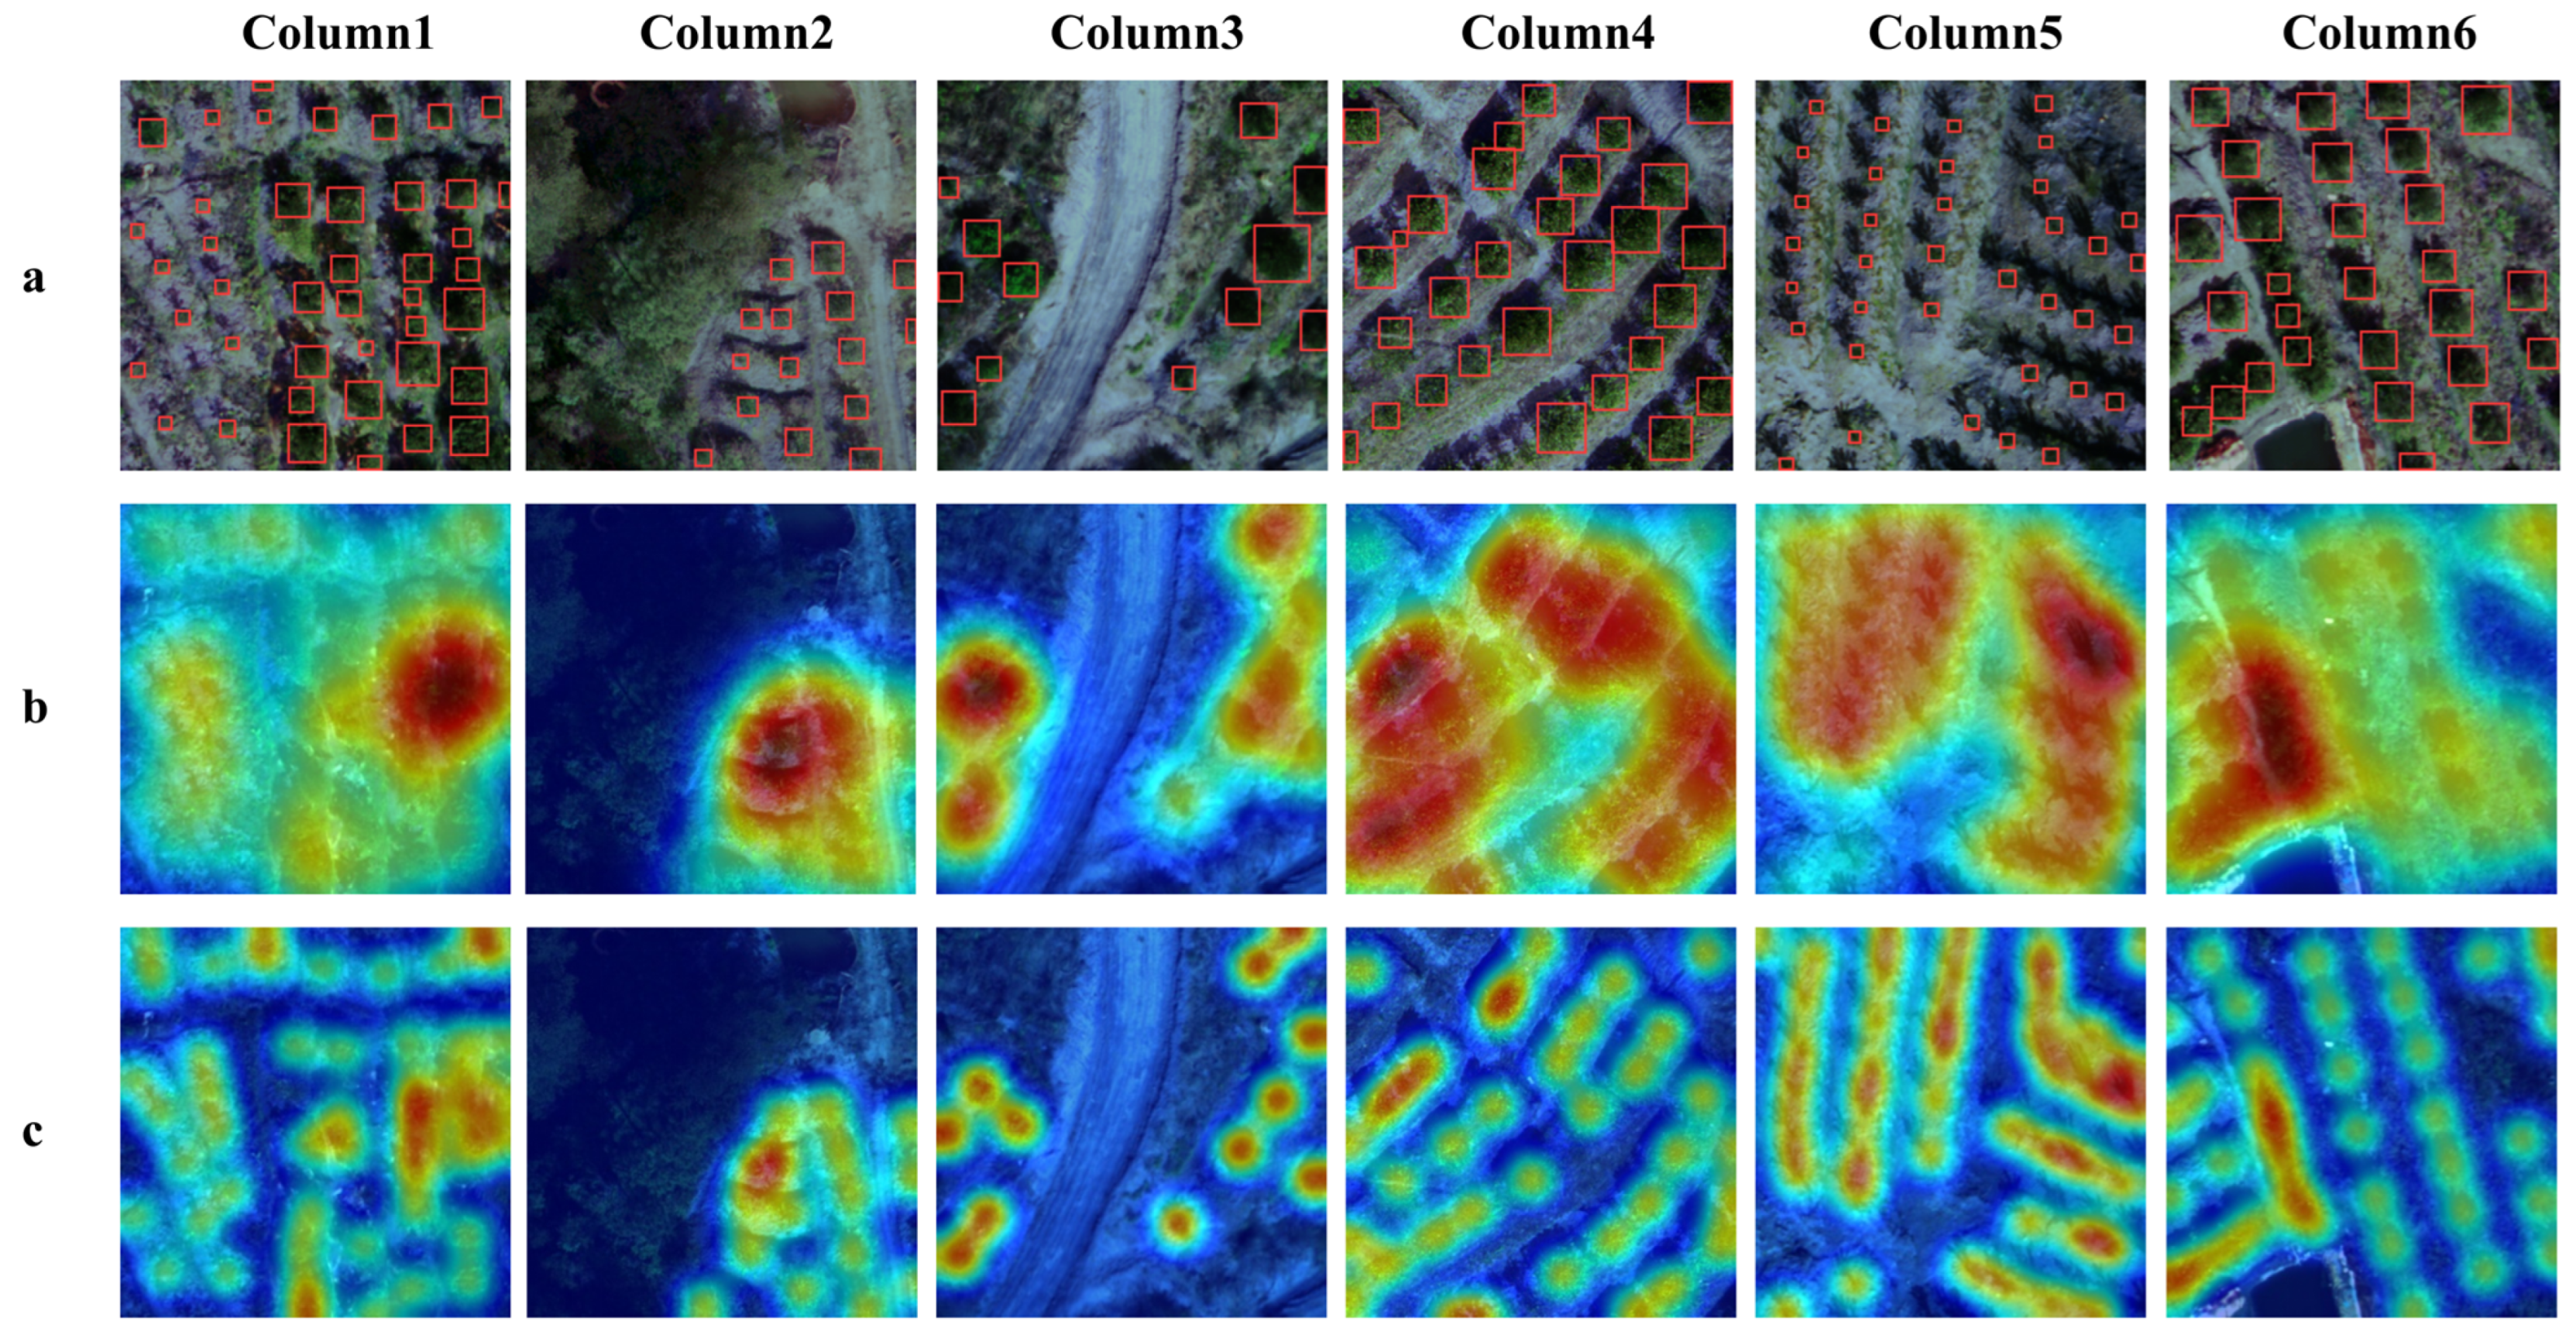
To verify the effectiveness of multi-scale and global features in the task of reclamation vegetation detection, this study conducted a visual comparative analysis of feature responses between the original SPPF module and the improved CAGP-SPPF module in the backbone network based on the Grad-CAM method [45]. The experimental results are shown in Figure 9. The experimental results show that the original SPPF has problems such as scattered attention distribution and insufficient response in key areas when dealing with targets with significant scale differences or blurred edges. In contrast, the CAGP-SPPF module effectively enhances the model’s perception ability for multi-scale targets and the focusing ability on key areas by introducing the channel attention mechanism and global pooling operation and demonstrates stronger feature discrimination ability and robustness in complex backgrounds. This module significantly enhances the model’s adaptability to the spatial heterogeneity of reclaimed vegetation while maintaining computational efficiency, verifying the application potential of multi-scale and global feature pooling strategies in this type of task.

4.3. Model Discussion

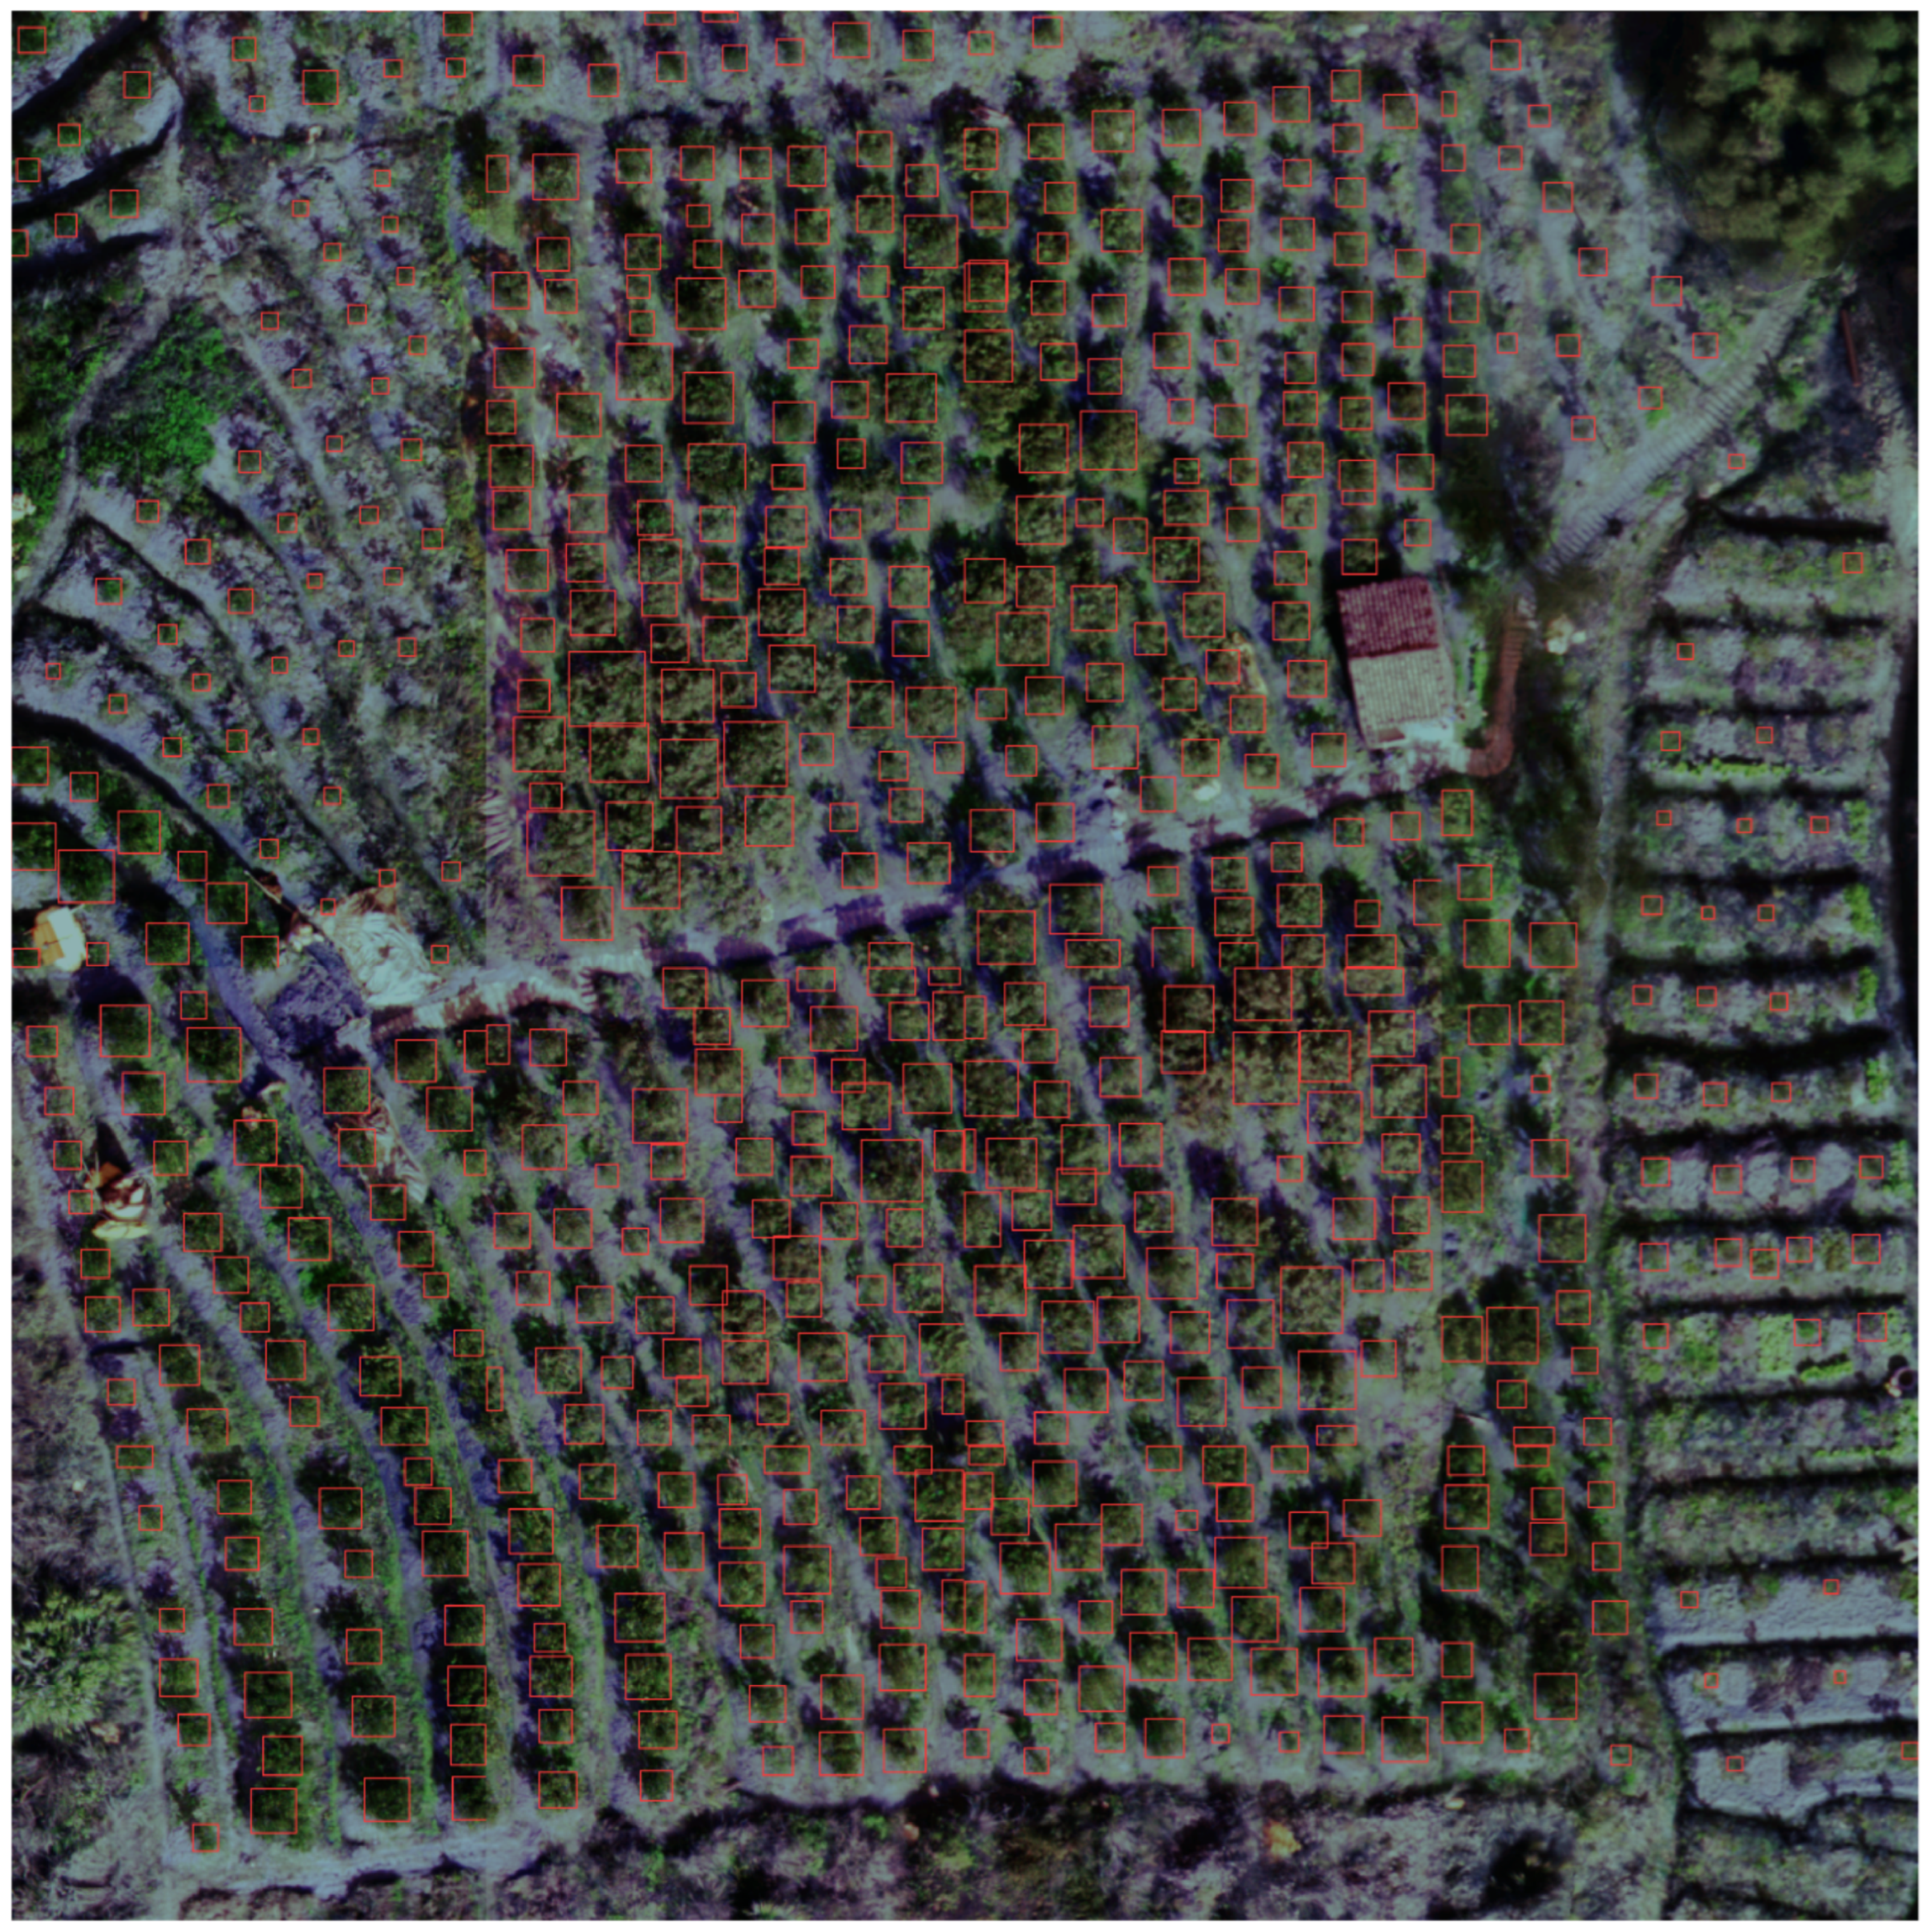
This study proposes MRV-YOLO, a multi-channel reclaimed vegetation detection model for rare earth mining areas, based on YOLOv8. By integrating multi-channel features, the model demonstrates significant potential for application in complex hilly and mountainous terrains. The study performed object detection using multispectral remote sensing imagery from selected mining zones, with results illustrated in Figure 10. The CAGP-SPPF module effectively extracts and fuses global and spectral features across various scales, thereby enhancing detection accuracy and reducing missed detections caused by poor illumination, uneven growth, and terrain undulations. Additionally, the C2f_DynamicConv module in the neck network optimizes feature transmission through dynamic convolution, minimizing spectral feature loss and preserving the integrity of spectral information via adaptive feature fusion. Comparative experiments further confirmed that, in contrast to the traditional RGB three-channel approach, the introduction of multi-channel data, including double red edge bands and near-infrared bands, significantly enhances the detection accuracy of reclaimed vegetation in rare earth mining areas. This improvement is likely due to these bands enhancing the spectral differences between vegetation and background, while maintaining stable detection under varying terrain and lighting conditions [8,9]. In this comparative experiment, we further distinguished the models trained on three-band RGB data and six-band multispectral data. The number of input bands was flexibly controlled through the channel parameter to ensure comparability across different models regarding input dimensions. The experimental results indicate that the incorporation of multi-channel data significantly enhances the detection accuracy of reclaimed vegetation. This improvement primarily arises from the supplementation and integration of spectral features: the red-edge band is particularly sensitive to variations in chlorophyll concentration and effectively reflects the physiological state of vegetation. Additionally, the near-infrared band generates a more pronounced reflection difference between vegetation and bare land, thereby increasing the model’s robustness under complex lighting and terrain conditions. These findings suggest that multi-channel input not only enhances the model’s feature expression capabilities but also provides more reliable technical support for the precise monitoring of reclaimed vegetation.
YOLOv8 demonstrates superior performance compared to YOLOv10 and YOLOv11 in detecting reclaimed vegetation within rare earth mining areas. YOLOv10 [46], which is optimized for large-target detection, encounters challenges when dealing with small and uneven vegetation. Its C2k3 module lacks the spatial detail sensitivity found in C2f, making it more difficult to differentiate vegetation from background noise. Although YOLOv11 [47] demonstrates superior efficiency compared to YOLOv8, it is susceptible to the loss of critical features during the extraction of deep spectral information. This limitation hinders the model’s ability to fully leverage the available effective information. In contrast, YOLOv8 achieves enhanced detection performance with an equivalent volume of reclaimed vegetation sample data, making its marginally higher parameter count justifiable. In comparison to its predecessors, YOLOv8 exhibits enhanced flexibility and a broader range of applications, making it suitable for diverse scenarios. It demonstrates exceptional detection performance even in complex environments and is particularly well-adapted to multi-spectral data and the intricate natural conditions found in rare earth mining areas. Meanwhile, we further analyzed the total time cost of different models in the training and prediction phases to evaluate their efficiency performance in practical applications. As shown in Table 4, overall, the time cost is positively correlated with the number of model parameters; however, there are also certain differences. Taking the method proposed in this paper as an example, although the number of parameters is not the smallest, the total time cost is only 0.247 h, which is superior to many models with smaller parameters. For example, the parameter numbers of YOLOv7, YOLOv8-AS and YOLOv10 are all less than those of the model in this paper, but the total time consumed for their training and prediction is 0.366 h, 0.254 h and 0.259 h, respectively, all higher than those of the method in this paper. This indicates that the model proposed in this paper considers both feature expression ability and operational efficiency in its design, resulting in higher cost performance in actual deployment. More importantly, at a lower time cost, the detection accuracy mAP@0.5 of multi-channel reclaimed vegetation by the method proposed in this paper has improved by 6.4%, 2.1% and 5.4%, respectively, compared with YOLOv7, YOLOv8-AS and YOLOv10. It can be seen from this that the model in this paper has achieved a good balance among “accuracy—parameter quantity—time cost” and has strong practical application potential.
A comparison with YOLOv8-AS reveals that the proposed model significantly enhances key metrics such as precision, recall, average precision, and F1 score, achieving a 2.1% increase in mAP@0.5. This improvement indicates a better utilization of multispectral information and an enhanced capability for target recognition, thereby providing technical support for subsequent research. Nevertheless, while the proposed model is effective for detecting vegetation in rare earth mining areas, it necessitates a more diverse set of data samples to improve generalization and broaden its applicability across different mining contexts. Furthermore, it is essential to conduct in-depth research on the influence of various multispectral data preprocessing methods on the performance of multi-channel models, as well as the effects of different spectral bands on model efficacy. We fully recognize the significance of cross-scenario validation in evaluating the generalization ability of models. However, most of the currently publicly available remote sensing datasets only provide three-channel (RGB) images, and there is still a lack of multi-spectral (six-channel) data formats that match this study, which limits the feasibility of direct verification. Future research will focus on collecting or constructing more representative and diverse multi-channel remote sensing datasets to further evaluate the adaptability and robustness of the model in different regions, sensors, and task scenarios, thereby more comprehensively verifying its generalization ability. Additionally, it is important to explore strategies for constructing a more lightweight model that can achieve high-precision detection of reclaimed vegetation in mining areas, thereby effectively reducing time costs. In addition to methodological innovation, it is essential to consider the ecological significance of reclaimed vegetation in rare earth mining areas. Reclaimed vegetation plays a crucial role in soil stabilization, nutrient cycling, water management, and biodiversity restoration, thereby promoting the long-term sustainability of damaged ecosystems. Enhancing the detection accuracy of reclaimed vegetation not only improves technical monitoring capabilities but also offers a new perspective for evaluating the effectiveness of ecological restoration efforts. Future research should further integrate biological and ecological indicators with remote sensing methods to achieve a more comprehensive assessment of ecosystem restoration.

5. Conclusions

Based on the YOLOv8 framework, this study addresses the technical challenges of insufficient detection accuracy and poor adaptability to complex terrain in the detection of reclaimed vegetation in rare earth mining areas. We propose a reclaimed vegetation target detection model for multispectral remote sensing images, termed MRV-YOLO. This model optimizes the input channels to accommodate multi-band data and integrates an improved multi-scale feature extraction module along with a feature transfer network structure. While maintaining model efficiency, MRV-YOLO significantly enhances the multi-scale perception and feature expression capabilities for complex vegetation targets, thereby markedly improving detection accuracy and robustness.
The experimental results indicate that the overall performance of MRV-YOLO surpasses that of mainstream object detection algorithms, including RT-DETR and the YOLO series from YOLOv3 to YOLOv11. Furthermore, it outperforms existing reclaimed vegetation detection models in specific tasks. Under three-channel input conditions, MRV-YOLO achieved mean Average Precision (mAP) values of 87.6% and 52.6% at thresholds of 0.5 and 0.5–0.95, respectively, which are improvements of 4.9% and 8.9% over the YOLOv8 baseline model. The introduction of multi-channel data, incorporating near-infrared and dual red-edge bands, further enhanced performance to 91.6% and 54.9%, representing increases of 4.6% and 10.8% compared to YOLOv8. The near-infrared and dual red-edge bands utilized in this study exhibit higher spectral sensitivity for monitoring chlorophyll content in vegetation and for distinguishing its growth status. They effectively differentiate reclaimed vegetation from background categories such as bare land and weeds. Particularly in hilly and mountainous environments characterized by significant light variability and complex terrain undulations, these bands demonstrate superior discrimination capability and stability.
Meanwhile, MRV-YOLO demonstrates an adaptive processing capability for combining multispectral channels through the introduction of a dynamic convolution mechanism. This mechanism automatically adjusts the weight distribution based on the spectral characteristics of the input data, thereby enhancing the model’s expressive capacity and generalization performance for heterogeneous remote sensing data sources. Furthermore, compared to the YOLOv8-AS model proposed by Li et al. [37], MRV-YOLO exhibits superior performance on the multi-channel dataset of reclaimed vegetation in self-built rare earth mining areas, with improvements in mAP@0.5, mAP@0.5:0.95, and F1 scores of 2.1%, 2.7%, and 2.0%, respectively. The practical application value of the model in specific task scenarios has been further substantiated.
Overall, MRV-YOLO not only achieves a commendable balance between accuracy and efficiency; it also has the potential for deployment on mobile terminals or edge computing platforms. Its stable performance in large-scale heterogeneous scenarios provides robust technical support for the precise monitoring, dynamic assessment, and ecological restoration of reclamation vegetation in rare earth mining areas. Furthermore, this method can furnish data support for tracking vegetation restoration processes, monitoring biodiversity, and planning ecological restoration, which is conducive to the sustainable management of mining areas and degraded land, and offers valuable references for related ecological engineering practices.

Author Contributions

Conceptualization, G.W.; methodology, and review and editing, H.L.; resources and review of the thesis content, J.D.; experiment construction, method implementation, software, and writing—original draft, X.L.; result calibration, S.N.; investigation, K.L.; data curation, Z.Z. All authors have read and agreed to the published version of the manuscript.

Funding

This work was supported in part by the National Natural Science Foundation of China, grant number 42161057 and Jiangxi Province Natural Science Foundation Key Project, grant number 20232ACB203025.

Data Availability Statement

The original contributions presented in the study are included in the article; further inquiries can be directed to the corresponding author.

Conflicts of Interest

The authors declare no conflicts of interest.

References

  1. Bai, J.; Xu, X.; Duan, Y.; Zhang, G.; Wang, Z.; Wang, L.; Zheng, C. Evaluation of resource and environmental carrying capacity in rare earth mining areas in China. Sci. Rep. 2022, 12, 6105. [Google Scholar] [CrossRef]
  2. Nie, S.; Li, H.; Li, Z.; Tao, H.; Wang, G.; Zhou, Y. Advancing ecological restoration: A novel 3D interpolation method for assessing ammonia-nitrogen pollution in rare earth mining areas. Expert. Syst. Appl. 2025, 276, 127192. [Google Scholar] [CrossRef]
  3. Li, H.; Xu, F.; Li, Q. Remote sensing monitoring of land damage and restoration in rare earth mining areas in 6 counties in southern Jiangxi based on multisource sequential images. J. Environ. Manage 2020, 267, 110653. [Google Scholar]
  4. Zhu, C.; Chen, Y.; Wan, Z.; Chen, Z.; Lin, J.; Chen, Z.; Sun, W.; Yuan, H.; Zhang, Y. Cross-sensitivity analysis of land use transition and ecological service values in rare earth mining areas in southern China. Sci. Rep. 2023, 13, 22817. [Google Scholar] [CrossRef]
  5. Wu, Z.; Li, H.; Wang, Y. Mapping annual land disturbance and reclamation in rare-earth mining disturbance region using temporal trajectory segmentation. Environ. Sci. Pollut. Res. 2021, 28, 69112–69128. [Google Scholar] [CrossRef] [PubMed]
  6. Lei, M.; Wang, Y.; Liu, G.; Meng, L.; Chen, X. Analysis of vegetation dynamics from 2001 to 2020 in China‘s Ganzhou rare earth mining area using time series remote sensing and SHAP-enhanced machine learning. Ecol. Inform. 2024, 84, 102887. [Google Scholar]
  7. Zhou, B.; Li, H.; Xu, F. Analysis and discrimination of hyperspectral characteristics of typical vegetation leaves in a rare earth reclamation mining area. Ecol. Eng. 2022, 174, 106465. [Google Scholar] [CrossRef]
  8. Li, C.; Li, H.; Liu, K.; Wang, X.; Fan, X. Spectral Variations of Reclamation Vegetation in Rare Earth Mining Areas Using Continuous–Discrete Wavelets and Their Impact on Chlorophyll Estimation. Forests 2024, 15, 1885. [Google Scholar] [CrossRef]
  9. Li, C.; Li, H.; Zhou, Y.; Wang, X. Detailed Land Use Classification in a Rare Earth Mining Area Using Hyperspectral Remote Sensing Data for Sustainable Agricultural Development. Sustainability 2024, 16, 33582. [Google Scholar] [CrossRef]
  10. Wang, T.; Liu, Y.; Ye, J.; Xu, S.; Cai, Q.; Li, Y.; Wu, L.; Yao, C.; Ge, G. Integrated strategies enhance soil fertility restoration effectiveness in ion-adsorption rare earth mining areas: A meta-analysis. Glob. Ecol. Conserv. 2025, 58, e03465. [Google Scholar] [CrossRef]
  11. Yuan, K.; Zhuang, X.; Schaefer, G.; Feng, J.; Guan, L.; Fang, H. Deep-Learning-Based Multispectral Satellite Image Segmentation for Water Body Detection. IEEE J. Sel. Top. Appl. Earth Obs. Remote Sens. 2021, 14, 7422–7434. [Google Scholar] [CrossRef]
  12. Parelius, E.J. A Review of Deep-Learning Methods for Change Detection in Multispectral Remote Sensing Images. Remote Sens. 2023, 15, 2092. [Google Scholar] [CrossRef]
  13. Bramich, J.; Bolch, C.J.S.; Fischer, A. Improved red-edge chlorophyll-a detection for Sentinel 2. Ecol. Indic. 2021, 120, 106876. [Google Scholar] [CrossRef]
  14. Hwang, S.; Park, J.; Kim, N.; Choi, Y.; Kweon, I.S. Multispectral pedestrian detection: Benchmark dataset and baseline. In Proceedings of the 2015 IEEE Conference on Computer Vision and Pattern Recognition (CVPR), Boston, MA, USA, 7–12 June 2015. [Google Scholar]
  15. Gallagher, J.E.; Oughton, E.J. Surveying You Only Look Once (YOLO) Multispectral Object Detection Advancements, Applications, and Challenges. IEEE Access 2025, 13, 7366–7395. [Google Scholar] [CrossRef]
  16. Takumi, K.; Watanabe, K.; Ha, Q.; Tejero-De-Pablos, A.; Ushiku, Y.; Harada, T. Multispectral Object Detection for Autonomous Vehicles. In Proceedings of the on Thematic Workshops of ACM Multimedia 17th Mountain View, California, CA, USA, 23–27 October 2017. [Google Scholar]
  17. Al-Shammari, D.; Whelan, B.M.; Wang, C.; Bramley, R.G.V.; Bisho, T.F.A. Assessment of red-edge based vegetation indices for crop yield prediction at the field scale across large regions in Australia. Eur. J. Agron. 2025, 164, 127479. [Google Scholar] [CrossRef]
  18. Wang, X.; Zhang, Y.; Yu, Y.; Li, Y.; Lyu, H.; Li, J.; Cai, X.; Dong, X.; Wang, G.; Li, J.; et al. Identification of dominant species of submerged vegetation based on Sentinel-2 red-edge band: A case study of Lake Erhai, China. Ecol. Indic. 2025, 171, 113168. [Google Scholar] [CrossRef]
  19. Mao, Z.; Wang, M.; Chu, J.; Sun, J.; Liang, W.; Yu, H. Feature extraction and analysis of reclaimed vegetation in ecological restoration area of abandoned mines based on hyperspectral remote sensing images. J. Arid. Land. 2024, 16, 1409–1425. [Google Scholar] [CrossRef]
  20. Ge, X.-L.; Qian, W.-X. Infrared small target detection based on isolated hyperedge. Infrared Phys. Technol. 2025, 146, 105752. [Google Scholar] [CrossRef]
  21. Jiang, Y. DME-YOLO: A real-time high-precision detector of vessel targets in infrared remote sensing images. Remote Sens. Lett. 2025, 16, 315–325. [Google Scholar] [CrossRef]
  22. Kumar, N.; Singh, P. Small and dim target detection in infrared imagery: A review, current techniques and future directions. Neurocomputing 2025, 630, 129640. [Google Scholar] [CrossRef]
  23. Wu, Z.; Li, H.; Wang, Y.; Long, B. MCCANet: A multispectral class-constraint attentional neural network for object detection in mining scenes. Expert. Syst. Appl. 2024, 247, 123233. [Google Scholar] [CrossRef]
  24. Mouret, F.; Morin, D.; Planells, M.; Vincent-Barbaroux, C. Tree Species Classification at the Pixel Level Using Deep Learning and Multispectral Time Series in an Imbalanced Context. Remote Sens. 2025, 17, 1190. [Google Scholar] [CrossRef]
  25. Morales-Martín, A.; Mesas-Carrascosa, F.-J.; Gutiérrez, P.A.; Pérez-Porras, F.-J.; Vargas, V.M.; Hervás-Martínez, C. Deep Ordinal Classification in Forest Areas Using Light Detection and Ranging Point Clouds. Sensors 2024, 24, 2168. [Google Scholar] [CrossRef] [PubMed]
  26. Amin, A.; Kamilaris, A.; Karatsiolis, S. A Weakly Supervised Multimodal Deep Learning Approach for Large-Scale Tree Classification: A Case Study in Cyprus. Remote Sens. 2024, 16, 4611. [Google Scholar] [CrossRef]
  27. Shao, Y.; Huang, Q.; Mei, Y.; Chu, H. MOD-YOLO: Multispectral object detection based on transformer dual-stream YOLO. Pattern Recogn. Lett. 2024, 183, 26–34. [Google Scholar] [CrossRef]
  28. Sun, J.; Yin, M.; Wang, Z.; Xie, T.; Bei, S. Multispectral Object Detection Based on Multilevel Feature Fusion and Dual Feature Modulation. Electronics 2024, 13, 443. [Google Scholar] [CrossRef]
  29. Chen, Y.; Ye, J.; Wan, X. TF-YOLO: A Transformer–Fusion-Based YOLO Detector for Multimodal Pedestrian Detection in Autonomous Driving Scenes. World Electr. Vehic. J. 2023, 14, 352. [Google Scholar] [CrossRef]
  30. Chen, K.; Liu, J.; Zhang, H. IGT: Illumination-guided RGB-T object detection with transformers. Knowl. Based Syst. 2023, 268, 110423. [Google Scholar] [CrossRef]
  31. Rista, P.R.R.; Saputro, A.H.; Handayani, W. Middle-Level Fusion YOLO on Multispectral Image to Detect Unhealthy Oil Palm Trees. J. Phys. Conf. Ser. 2024, 2866, 012045. [Google Scholar] [CrossRef]
  32. Wang, S.; Zeng, D.; Xu, Y.; Yang, G.; Huang, F.; Chen, L. Towards complex scenes: A deep learning-based camouflaged people detection method for snapshot multispectral images. Def. Technol. 2024, 34, 269–281. [Google Scholar] [CrossRef]
  33. Ma, Y.K.; Liu, H.; Ling, C.X.; Zhao, F.; Zhang, Y. Object detection of individual mangrove based on improved YOLOv5. Laser Optoelectron. Prog. 2022, 59, 436–446. [Google Scholar]
  34. Wang, G.; Leonce, A.; Edirisinghe, E.A.; Khafaga, T.; Simkins, G.; Yahya, U.; Shah, M.S. Ghaf Tree Detection from Unmanned Aerial Vehicle Imagery Using Convolutional Neural Networks. In Proceedings of the 2023 International Symposium on Networks, Computers and Communications (ISNCC), Doha, Qatar, 23–26 October 2023. [Google Scholar]
  35. Wang, X.; Zhao, Q.; Jiang, P.; Zheng, Y.; Yuan, L.; Yuan, P. LDS-YOLO: A lightweight small object detection method for dead trees from shelter forest. Comput. Electron. Agr. 2022, 198, 107035. [Google Scholar] [CrossRef]
  36. Xu, S.; Wang, R.; Shi, W.; Wang, X. Classification of Tree Species in Transmission Line Corridors Based on YOLO v7. Forests 2023, 15, 61. [Google Scholar] [CrossRef]
  37. Li, X.; Li, H.; Liu, K.; Wang, X. Revegetation Detection Method for Rare Earth Mining Areas Using YOLOv8n Network with Integrated Global Features. Nat. Remote Sens. Bull. 2024, 1–14. (In Chinese) [Google Scholar] [CrossRef]
  38. Varghese, R.; Sambath, M. YOLOv8: A Novel Object Detection Algorithm with Enhanced Performance and Robustness. In Proceedings of the 2024 International Conference on Advances in Data Engineering and Intelligent Computing Systems (ADICS), Chennai, India, 18–19 April 2024. [Google Scholar]
  39. Ma, C.; Chi, G.; Ju, X.; Zhang, J.; Yan, C. YOLO-CWD: A novel model for crop and weed detection based on improved YOLOv8. Crop Prot. 2025, 192, 107169. [Google Scholar] [CrossRef]
  40. Luo, H.; Wang, Y.; Chen, Y.; Li, X.; Zhan, J.; Zuo, D. EBC-YOLO: A remote sensing target recognition model adapted for complex environments. Earth Sci. Inform. 2025, 18, 282. [Google Scholar] [CrossRef]
  41. Woo, S.; Park, J.; Lee, J.-Y.; Kweon, I.S. CBAM: Convolutional Block Attention Module. In Proceedings of the European Conference on Computer Vision, Munich, Germany, 8–14 September 2018. [Google Scholar]
  42. Wang, Q.; Wu, B.; Zhu; Zuo, W.; Hu, Q. ECA-Net: Efficient Channel Attention for Deep Convolutional Neural Networks. In Proceedings of the 2020 IEEE/CVF Conference on Computer Vision and Pattern Recognition (CVPR), Seattle, WA, USA, 13–19 June 2020. [Google Scholar]
  43. Chen, Y.; Dai, X.; Liu, M.; Chen, D.; Yuan, L.; Liu, Z. Dynamic Convolution: Attention Over Convolution Kernels. In Proceedings of the 2020 IEEE/CVF Conference on Computer Vision and Pattern Recognition (CVPR), Seattle, WA, USA, 13–19 June 2020. [Google Scholar]
  44. Elfwing, S.; Uchibe, E.; Doya, K. Sigmoid-weighted linear units for neural network function approximation in reinforcement learning. Neural Netw. 2017, 107, 3–11. [Google Scholar] [CrossRef]
  45. Selvaraju, R.R.; Cogswell, M.; Das, A.; Vedantam, R.; Parikh, D.; Batra, D. Grad-CAM: Visual Explanations from Deep Networks via Gradient-Based Localization. In Proceedings of the 2017 IEEE International Conference on Computer Vision (ICCV), Venice, Italy, 22–29 October 2017; pp. 618–626. [Google Scholar] [CrossRef]
  46. Wang, A.; Chen, H.; Liu, L.; Chen, K.; Lin, Z.; Han, J.; Ding, G. YOLOv10: Real-Time End-to-End Object Detection. arXiv 2024, arXiv:2405.14458. [Google Scholar]
  47. Khanam, R.; Hussain, M. YOLOv11: An Overview of the Key Architectural Enhancements. arXiv 2024, arXiv:2410.17725. [Google Scholar] [CrossRef]
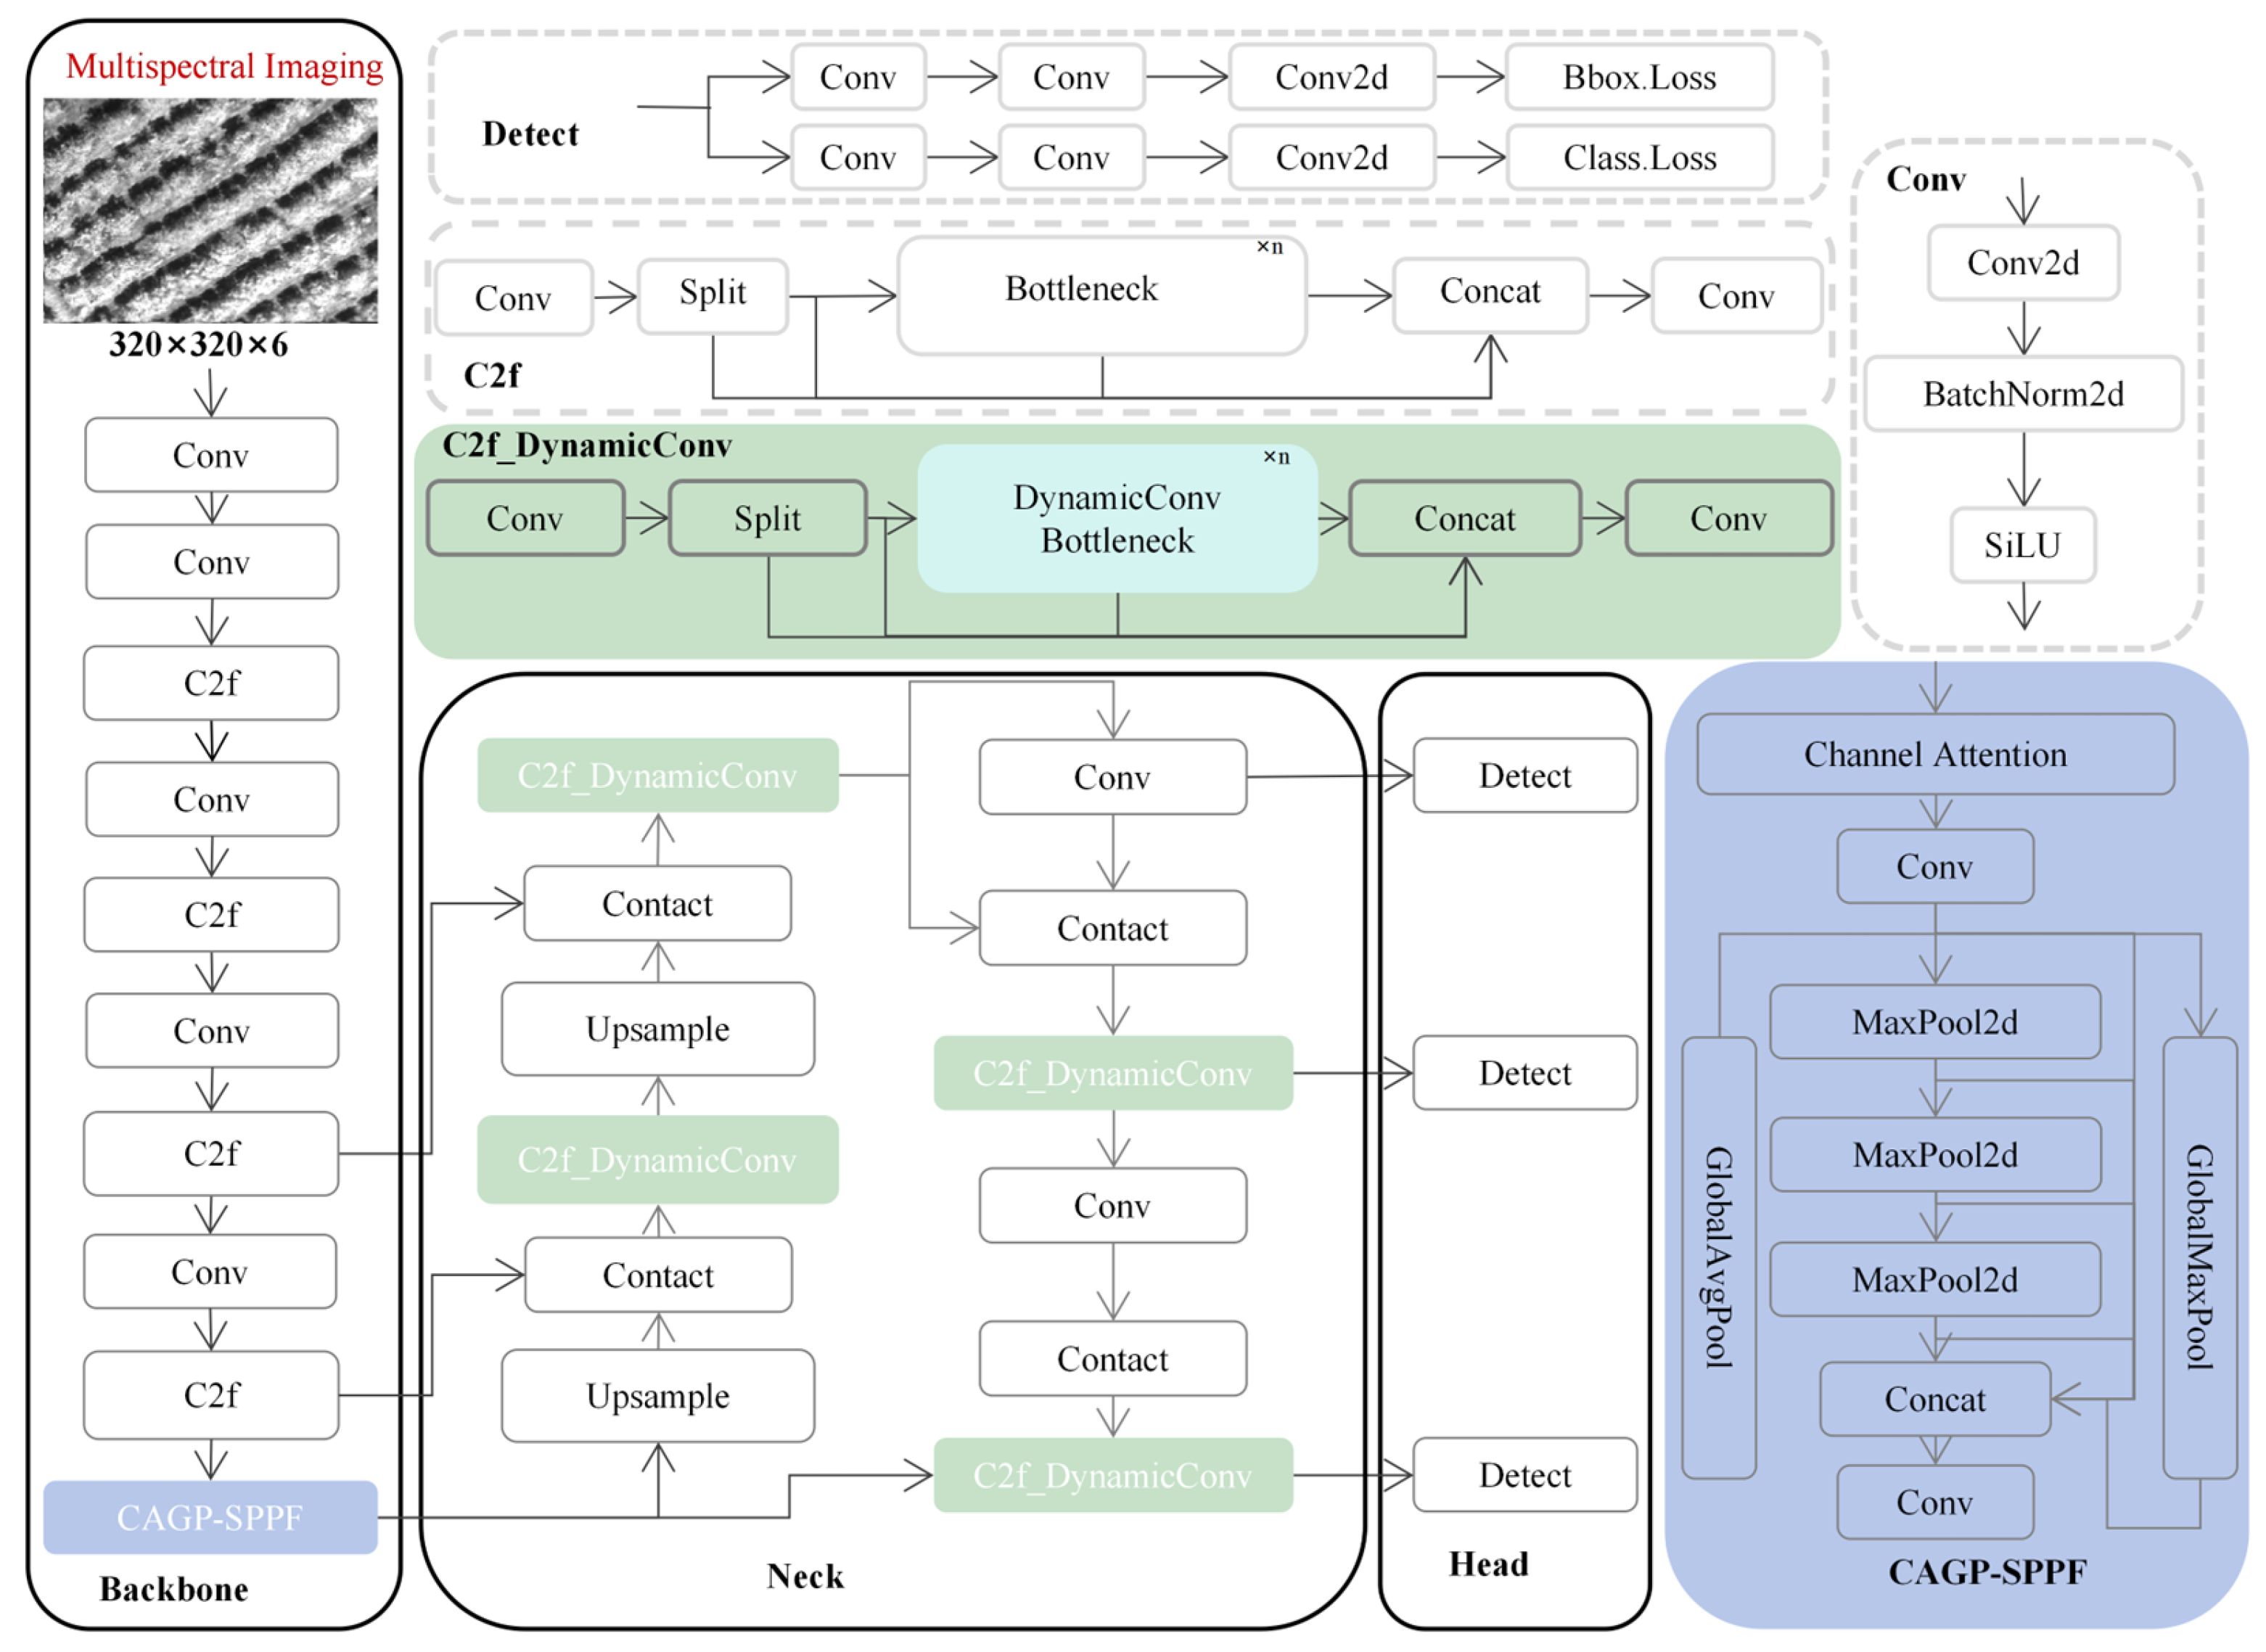
Figure 1. Structure of the MRV-YOLO Mode, which comprises three main components: Backbone, Neck, and Head. The Backbone serves as the core of the model, while the Neck represents the intermediate network structure, and the Head functions as the detection head network structure. The colored sections in the figure denote the modules that have been enhanced. The Conv module refers to the convolutional component, whereas C2f_DynamicConv signifies the improved C2f module. The DynamicConv Bottleneck is an upgraded version of the Bottleneck, playing a crucial role in YOLOv8 by facilitating feature extraction and enhancement. Additionally, Concat denotes the feature concatenation module, Upsample refers to the upsampling module, and Detect signifies the detection head. SPPF-GFP is the enhanced spatial pyramid pooling module, while MaxPool2d indicates the max pooling downsampling operation. Conv2d corresponds to 2D convolution, BatchNorm2d represents the batch normalization layer, and SiLU is the designated activation function. Lastly, Bbox Loss and Class Loss refer to the bounding box loss and classification loss, respectively.
Forests 16 01536 g001
Figure 3. CAGP-SPPF structure. The Input and Output refer to the respective input and output components. The Channel Attention denotes the Channel Attention Mechanism depicted in Figure 2. The Conv signifies the convolution module, where k = 1 indicates a convolution kernel size of 1, and k = 5 indicates a convolution kernel size of 5. MP refers to local max pooling for downsampling, while GAP represents global average pooling. GMP denotes global maximum pooling, and Concat signifies the feature concatenation module.
Forests 16 01536 g003
Figure 4. C2f_DynamicConv Structure. The DynamicConv represents dynamic convolution. The input module is denoted as Input, while avg pool refers to average pooling. The term add signifies feature concatenation, and MaxPool2d indicates max pooling downsampling. The Conv module represents the convolution operation, where 1 × 1 specifies the convolution size, and s = 1 indicates that the convolution step size is 1. The Concat module is responsible for feature concatenation, and Output denotes the output module. The primary components of the DynamicConv structure include the global average pooling layer (avg pool), two fully connected layers (FC), the SiLU activation function, the softmax activation function, K dynamic convolution kernels, weight coefficients (π), the * indicates a product relationship, convolution operations, batch normalization (BN), and the activation function layer.
Forests 16 01536 g004
Figure 5. Study Area Overview. Here, (A) is the topographic map of Ganzhou City; (B) is the unmanned aerial vehicle remote sensing imagery of reclaimed vegetation; (C) is some samples of reclaimed navel orange vegetation; (D) is a field photograph of reclaimed vegetation in the rare earth mining area.
Forests 16 01536 g005
Figure 6. Selected Samples of Reclaimed Vegetation.
Forests 16 01536 g006
Figure 8. Visualization of detection results of different module combinations under multi-channel spectral information.
Forests 16 01536 g008
Figure 9. Visualization of activation graphs before and after backbone improvement. (a) represents Ground truth, (b) is the activation graph of the output feature map of the backbone network when using the SPPF module, and (c) is the activation graph of the output feature map of the backbone network after using the CAGP-SPPF module. The highlighted areas in (b,c) represent the activated regions, while the blue parts represent the unactivated regions. The red rectangular box represents the reclaimed vegetation.
Forests 16 01536 g009
Figure 10. A wide range of reclaimed vegetation detection results. The red rectangular box represents the reclaimed vegetation.
Forests 16 01536 g010
Figure 7. Visualization of experimental results compared with different mode.
Forests 16 01536 g007
Table 1. Band Information of Multispectral Remote Sensing Imagery.
Band NameWavelength
Red660 nm–20 nm
Green555 nm–25 nm
Blue450 nm–35 nm
Red Edge1720 nm–10 nm
Red Edge1750 nm–15 nm
NIR840 nm–35 nm
Table 2. Comparative experimental results of different models.
ModeP (%)R (%)mAP@0.5 (%)mAP@0.5:0.95 (%)F1-Score (%)
RT-DETR(rgb)81.573.277.13177
RT-DETR(bands)86.280.684.835.883
YOLOv3(rgb)81.365.976.738.773
YOLOv3(bands)84.973.781.94279
YOLOv5(rgb)79.572.279.739.376
YOLOv5(bands)84.181.586.342.883
YOLOv6(rgb)81.871.880.241.577
YOLOv6(bands)85.97985.144.182
YOLOv7(rgb)8371.480.441.977
YOLOv7(bands)8778.485.243.682
YOLOv7-tiny(rgb)8165.875.934.573
YOLOv7-tiny(bands)80.778.482.738.580
YOLOv8(rgb)84.773.782.743.779
YOLOv8(bands)86.982.58744.185
YOLOv8-AS(rgb)83.977.584.850.381
YOLOv8-AS(bands)90.882.389.552.286
YOLOv10(rgb)86.268.38040.976
YOLOv10(bands)85.881.486.244.583
YOLOv11(rgb)77.171.778.137.675
YOLOv11(bands)84.980.785.441.183
our(rgb)88.179.487.652.684
our(bands)92.384.891.654.988
Note: rgb represents the red, green and blue wave segments; brands represents the red, green, blue, red, Red Edge 1, Red Edge 2, and Near-Infrared wave segments; P (%) = Precision, representing the proportion of correctly predicted positive samples among all predicted positive samples; R (%) = Recall, representing the proportion of correctly predicted positive samples among all actual positive samples; mAP@0.5 (%) = Mean Average Precision at an IoU threshold of 0.5; mAP@0.5:0.95 (%) = Mean Average Precision averaged over IoU thresholds from 0.5 to 0.95; F1-Score (%) = the weighted harmonic mean of Precision and Recall; bold indicates the optimal value.
Table 3. Ablation experiment of different modules.
Combination of Different ModulesP (%)R (%)mAP@0.5 (%)mAP@0.5:0.95 (%)F1-Score (%)
SPPF + C2f(rgb)84.773.782.743.779
SPPF + C2f(bands)86.982.58744.185
CAGP-SPPF + C2f(rgb)86.979.787.455.583
CAGP-SPPF + C2f(bands)9184.690.859.288
SPPF + C2f_DynamicConv(rgb)87.877.686.555.282
SPPF + C2f_DynamicConv(bands)9084.490.558.387
CAGP-SPPF + C2f_DynamicConv(rgb)88.179.487.656.584
CAGP-SPPF + C2f_DynamicConv(bands)92.384.891.654.988
Note: rgb represents the red, green and blue wave segments; brands represents the red, green, blue, red, Red Edge 1, Red Edge 2, and Near-Infrared wave segments; P (%) = Precision, representing the proportion of correctly predicted positive samples among all predicted positive samples; R (%) = Recall, representing the proportion of correctly predicted positive samples among all actual positive samples; mAP@0.5 (%) = Mean Average Precision at an IoU threshold of 0.5; mAP@0.5:0.95 (%) = Mean Average Precision averaged over IoU thresholds from 0.5 to 0.95; F1-Score (%) = the weighted harmonic mean of Precision and Recall; bold indicates the optimal value.
Table 4. Model Complexity Comparison.
ModeModel Size
(MB)
Parameters
(MB)
FLOPs
(G)
Times Cost
(h)
RT-DETR6331.99103.612.125
YOLOv324.412.1319.30.268
YOLOv55.22.507.40.237
YOLOv68.74.2311.90.237
YOLOv76.53.039.70.366
YOLOv7-tiny1.580.722.40.160
YOLOv86.23.018.20.240
YOLOv8-AS5.52.667.40.254
YOLOv105.42.597.90.259
YOLOv115.72.737.10.223
our7.93.837.90.247
Disclaimer/Publisher’s Note: The statements, opinions and data contained in all publications are solely those of the individual author(s) and contributor(s) and not of MDPI and/or the editor(s). MDPI and/or the editor(s) disclaim responsibility for any injury to people or property resulting from any ideas, methods, instructions or products referred to in the content.