Abstract
The aim of this paper is to investigate forest litter yield and decomposition rate estimation methods to provide a basic theory for litter production and decomposition studies and a scientific foundation for forest management practices. The Greater Khingan Dahurian larch (Larix gmelinii) forest in China was taken as the study subject. Forest litter was defined as the cumulative product of annual litterfall. The Olson exponential decay model, which is widely recognized in ecological studies, was employed to develop a system of equations representing the dynamic equilibrium among litter production, decomposition, and accumulation. Litter yield and decomposition rate estimation models were formulated based on this system. Model parameters were analyzed using multiple linear regression techniques. The proposed estimation methods were verified through field survey data and one-sample t-tests. The relative error for litter production estimation ranged from 0.01 to 0.25, with an average of 0.13, and the t-test yielded a p-value of 0.108. The relative error of the decomposition rate estimation was 0.00–0.35, with an average of 0.12, and the corresponding t-test yielded a p-value of 0.151. A litter yield and decomposition rate model with easily obtained predictor variables was constructed in this study. The model can rapidly estimate the litter yield and decomposition rate of survey sites and has important application value for litter yield- and decomposition-related studies.
1. Introduction
Forest litter is an umbrella term for all organic matter produced by plant aboveground organs that is returned to the surface [1]. Forest litter plays an important role in maintaining soil fertility, promoting normal material cycles, and preserving the nutrient balance in ecosystems [2]. Research on litter yield and decomposition rate can help reveal ecosystem nutrient cycles and energy flow mechanisms. This holds important theoretical significance and practical value for coping with climate change, achieving carbon neutrality goals, and optimizing forest resource management.
Numerous studies have investigated forest litter production and decomposition. For example, Zhang et al. used litter collectors to study litter yield and its influencing factors in major forests in northeast China [3]. Ma et al. employed statistical methods to analyze the correlations between litter yield and environmental factors in six temperate forest types [4]. Zemskov et al. utilized litter bags to examine the plant residue decomposition process in urban forest ecosystems in the Arboretum of Moscow State University Botanical Garden [5]. Liu et al. also employed the litter bag method to analyze spatial changes in forest litter decomposition in temperate forest ecosystems and relevant controlling factors [6].
Currently, most litter yield studies utilize the collector method [7,8,9,10], i.e., installing standard collectors at sample plots and periodically harvesting litter using collectors to measure the dry mass. Litter decomposition rate studies have employed the litter bag method [11,12,13], laboratory-simulated decomposition method [14,15], estimation based on present litter [16,17], and balance method [18], among which the litter bag method is the most commonly used. However, these methods are time- and labor-intensive and require long-term monitoring (usually 1–3 years), making it difficult to conduct forest litter studies.
In this study, the Greater Khingan Dahurian larch (Larix gmelinii) forest in Heilongjiang province, China was investigated to develop a method for the rapid estimation of forest litter yield and decomposition rate. Litter was considered the accumulation of annual litter decomposition, and Olson’s single-exponential equation was used to construct a set of equilibrium equations for litter yield, decomposition, and load and derive a litter yield and decomposition rate and decomposition turnover model. Multivariate linear regression was performed to calculate the model parameters. The predictive variables of this method are readily accessible, enabling the rapid estimation of litter yield and decomposition rates in the study area. This approach holds significant application potential for research concerning litter dynamics and decomposition processes.
2. Study Methods
2.1. Overview of Study Site
The Greater Khingan range in Heilongjiang province is located at the edges of northeast China (50 Greater Khingan ra 121 Greater Khingan ran (Figure 1)). The terrain exhibits an overall northeast–southwest course and is generally flat, with a mean altitude of 573 m, a maximum altitude of 1528 m, a minimum altitude of 180 m, round massifs, and gentle slopes of around 15–30°. The terrain is considered to consist of low hills and gentle slopes. This region has a cold temperate continental monsoon climate, with distinct seasons, long and cold winters, and short and hot summers. The annual mean temperature is −2.8 °C, the frost-free period is 90–110 d, the annual mean precipitation is 746 mm, and the relative humidity is 70–75%.
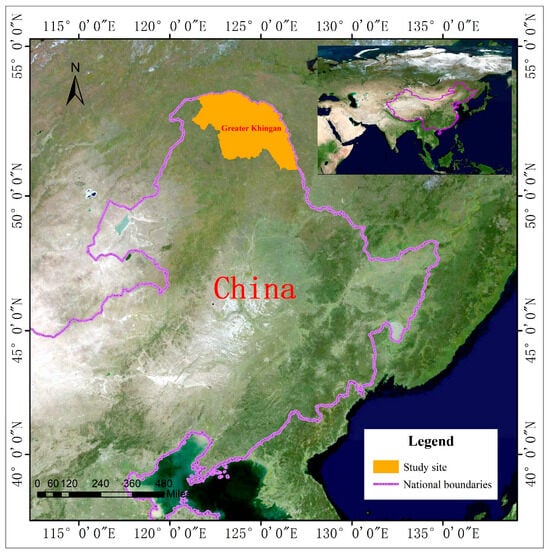
Figure 1.
Location of the study site.
As one of China’s largest primary forests, the Greater Khingan range is an ideal region for studying cold temperate forest ecosystems, with abundant forest resources, 97% forest cover, a forested area of 6.46.36 million hm2, and 529 million m3 of standing stock. Cold temperate conifers and deciduous forests in the Eurasian forest subregion constitute the natural vegetation type. The dominant tree species are Dahurian larch (Larix gmelinii) and Japanese white birch (Betula platyphylla). Other tree species include Mongolian Scots pine (Pinus sylvestris var. mongolica), Mongolian oak (Quercus mongolica), and Korean aspen (Populus davidiana). Major shrubs include Rhododendron dauricum, marsh rosemary (Ledum palustre), lingonberry (Vaccinium vitis-idaea), and Amur rose (Rosa davurica).
2.2. Data Sources
Data used to calculate the model parameter r were obtained from the 2021 “National Forest and Grassland Fire Risk Census”. Mechanical sampling was conducted across 2726 survey sites in the Greater Khingan range in Heilongjiang province. The survey period was from August 2021 to May 2022. The stand density, diameter at breast height, tree height, crown density, stand age, altitude, aspect, litter upper layer load, litter lower layer load, and thick branch (0.60 cm ≤ diameter ≤ 7.62 cm) load were investigated based on the procedures outlined in “Technical Specifications for Forest Fuel Standard Plot Survey” [19].
To validate the forest litter yield and decomposition rate estimation method, we selected 12 representative Dahurian larch forests (the dominant tree species constituted over 70% of the total) in the Greater Khingan range after defoliation in October 2023. One survey plot (25 × 25 m) was set up in each forest. Table 1 shows the basic information of the sample plots. Three to six (2 × 2 m) collectors were randomly placed within the sample lot. The collectors were set up 50 cm from the soil surface. Litter inside the collectors was periodically collected and taken to the laboratory. The litter was continuously dried at 105 °C for 72 h in an oven to obtain the dry mass. Collection was completed after defoliation in October 2024. The dry mass of all litter obtained using the same collector during the survey period was added to calculate the dry mass of litter per unit area for each collector in the survey site. The mean was then calculated to determine the annual litter yield of the survey site. Four (1 × 1 m) sample plots were set up at 3 m on both sides of each vertex in the survey site to collect the litter upper layer and lower layer, as well as thick branches (0.60 cm ≤ diameter ≤ 7.62). Complete harvesting was conducted and the samples were brought to the laboratory and dried in an oven until absolute dryness. The mean loads of different types of litter in the survey site were measured. The standing crop was measured after leaf fall in October 2023 and again before leaf fall in September 2024 to validate the litter decomposition rate. In addition, the standing crop was measured following leaf fall in October 2024 to allow the model to estimate both litter production and decomposition rates.

Table 1.
Greater Khingan Dahurian larch forest survey sites.
2.3. Olson’s Single-Exponential Equation
Based on existing data in the literature, forest litter decomposition complies with Olson’s single-exponential equation. This equation can accurately describe the litter decomposition status [20,21] and is widely used in related research. The equation is generally written as:
In the equation, is the dry mass of litter residue after t years, is the initial dry mass, k is the decomposition coefficient, and t is time.
2.4. Model Construction
From Equation (1), the annual litter yield was set as p, and residue dry mass after t years was . The following equation is obtained:
The current litter is regarded as the accumulation of annual litter decomposition. Assuming the annual litter yield remains unchanged, the total current litter load can be calculated as follows:
In the equation, b is the total litter load (t/ha), p is the annual litter yield (t/ha/year), k is the decomposition coefficient, and t is the decomposition time (years). Equation (3) can be rewritten as
When the forest stand reaches the mature stage, the value of t is high enough that , then
Forest litter can be divided into two layers: the upper and lower layers. Forest fire prevention strategies often divide litter into these two layers, of which the upper layer consists of easily combustible material at the original state during early decomposition, while the lower layer consists of non-flammable humus at the middle–late stages of decomposition. The two layers can be distinguished by morphology and can be mechanically separated. From Equation (3), the litter upper layer load equation can be obtained as follows:
where a is the litter upper layer load (t/ha) and is the time taken for the litter upper layer to decompose to the litter lower layer (years).
From Equation (5), we obtain
Substituting Equation (6), we obtain:
r was set as . From Equation (2) , it is known that r is the ratio of dry mass when the litter is decomposed to the lower layer to the initial dry mass, and (1 − r) can be interpreted as the mass lost per unit dry mass when the litter is decomposed to the lower layer. This value is relatively stable, and r was set as the model parameter.
From Equation (8), the annual litter yield p is
Substituting Equation (7), we obtain:
From Equation (1), when . It can be seen that is the annual litter decomposition residue rate, and is the litter decomposition rate, hence
In the equation, h is the litter decomposition rate.
From Equations (8)–(10), the litter upper layer decomposition turnover can be obtained as (time taken for the initial litter to decompose to the litter lower layer):
2.5. Statistical Parameter r
2.5.1. Calculation of Parameter r
Similarly to Equation (3), the total load after 1 year of litter decomposition is written as follows:
where is the total load after 1 year of litter decomposition. Similarly to Equations (5) and (6), from Equation (13), we can derive the following equations:
where is the litter upper layer load after 1 year of decomposition.
Dividing Equations (14) and (15), we get
i.e., . r can be obtained by calculating the litter upper layer load after 1 year of decomposition (before defoliation) and the total load.
2.5.2. Prediction of Parameter r
The equations used to estimate the litter yield and decomposition rate in the study are post-defoliation variables, while the parameter r calculated in Section 2.5.1 is a (pre-defoliation) variable 1 year after decomposition. To make the time period consistent, we used the September Greater Khingan 200 Dahurian larch forest (pre-defoliation) survey data in the National Forest and Grassland Fire Risk Census to first calculate parameter r. Subsequently, we selected variables that were stable before and after defoliation and conducted multivariate linear regression to predict parameter r. The predictor variables consisted of (1) altitude, a stable terrain condition; (2) thick branches (0.60 cm ≤ diameter ≤ 7.62 cm), which decompose slowly and are stable before and after defoliation; and the (3) litter lower layer load. From Equation (3), the litter lower layer load can be calculated as
In the equation, c is the litter lower layer load, k and are fixed values, and . Under the hypothesis in this study, c is a fixed value, i.e., the litter lower layer load before and after defoliation remains unchanged.
In summary, all predictor variables in the regression model remained basically unchanged during the short period before and after defoliation. Therefore, post-defoliation predictor variables can be substituted for pre-defoliation variables to predict parameter r.
2.6. Verification of Accuracy
The accuracy of the estimated litter yield and decomposition rates was verified by measuring the surveyed sample plots and calculating the relative error between the estimated and measured values.
A one-sample t-test was conducted to determine whether the prediction model exhibited significant systematic errors. The null hypothesis (H0) stated that the mean error was equal to zero, indicating the absence of systematic errors, while the alternative hypothesis (H1) suggested that the mean error was not equal to zero. The significance level (α) was set to 0.05.
3. Results and Analysis
3.1. Parameter r Calculation Results
Basic statistical information and parameter r calculation results for the survey site are presented in Table 2. The load range and standard error revealed great intra-group differences and strong dispersion of the litter upper layer load, lower layer load, and total load in the survey sites. This demonstrates that the litter load distribution in the Greater Khingan Xing’an Dahurian larch forest displays strong heterogeneity. The standard error of r was only 0.09, exhibiting a concentration trend. This indicates that using r as the model parameter is feasible.
Table 2.
Statistical description of survey site and parameter r.
3.2. Parameter r Prediction Results
The multiple linear regression analysis results for parameter r are presented in Table 3, indicating that parameter r is significantly positively correlated with the litter lower layer load and altitude and significantly negatively correlated with the thick branch load. The variance inflation factor (VIF) value satisfied the independence test criteria and the coefficient of determination R2 was 0.673 at p < 0.001, with a good model fit. Hence, the model demonstrates a high degree of accuracy in predicting the parameter r. The parameter r prediction model is as follows:
where is the litter lower layer load (t/ha), is altitude (km), and is the thick branch load (t/ha).
Table 3.
Results of multiple linear regression analysis.
3.3. Survey Site Litter Yield and Decomposition Rate Estimation
Equation (17) was utilized to predict parameter r, while Equations (9), (11) and (12) were used to estimate the litter yield, decomposition rate, and litter upper layer decomposition turnover, respectively (Table 4). The minimum, maximum, and mean predicted values of r were 0.68, 0.94, and 0.78, respectively; the minimum, maximum, and mean predicted litter yield values were 1.10 (t/ha/year), 4.43 (t/ha/year), and 2.87 (t/ha/year), respectively; and the minimum, maximum, and mean predicted decomposition rates were 0.03, 0.27, and 0.13, respectively. The litter upper layer decomposition turnover was 1.05–5.36 years, with a mean of 2.26 years.
Table 4.
Litter yield, decomposition rate, and decomposition turnover estimation of survey sites.
3.4. Results of Accuracy Verification
The results depicting the relative errors in estimating both the litter yield and decomposition rate are presented in Figure 2. The relative error in estimating litter yield ranged from 0.01 to 0.25, with an average of 0.13. For the estimation of the litter decomposition rate, the relative error ranged from 0.00 to 0.35, with an average of 0.12. Overall, the estimated values showed reasonable agreement with the measured data.
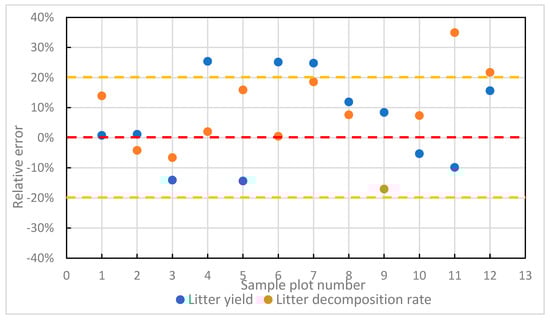
Figure 2.
Relative error in the estimation of litter yield and decomposition rate.
The results of the one-sample t-test for the estimation errors of litter yield and decomposition rate are presented in Table 5. The p-values of the tests for litter yield and decomposition rate were 0.108 and 0.151, respectively, both of which exceeded the significance level of 0.05. Therefore, the current data do not provide statistical evidence indicating the existence of systematic errors in the prediction model.
Table 5.
One-sample t-test results for estimation errors in litter yield and decomposition rate.
4. Discussion
The equations describing the relationships among litter yield, decomposition rate, and load in the study represent a geometric progression of cumulative Olson’s single-exponential equations. The integral equation can be expressed as , where p is the litter yield, k is the decomposition rate coefficient, b is the litter load, and t is time, i.e., . When t is large, ; therefore, . This matches the litter degradation rate calculation model first proposed by Olson in 1963, and can be used to reflect nutrient cycling rate at large scales and not simply to calculate the actual forest litter decomposition rate [22]. We believe that for deciduous tree species with a significant seasonal defoliation peak, the total decomposition function is not a smooth curve. Compared with function integration, a cumulative pattern can better describe litter decomposition.
Although the litter decomposition rate model constructed in this study has similarities to the balance method proposed by Liu et al. [18], which regards the current litter as the annual litter accumulation, there are also differences between these techniques. The key difference is that the decomposition rate model used by Liu et al. was constructed based on the known annual litter yield and the cumulative amount. As the annual litter yield is not easily obtained, this limits the application of the model. In this study, the annual litter yield and decomposition rate were considered outcome variables to be predicted.
As the flammability of litter differs in the upper and lower layers, these layers are considered different fuel types in the field of forest fire prevention and are usually collected separately in fuel surveys. In forest soil science, the upper and lower litter layers are two sublayers of the cover layer (layer 0) [23]. The two layers are morphologically distinguishable and easy to separate. The litter upper and lower layer loads, which are required to estimate the litter yield and decomposition rate, are easily obtained predictor variables.
The biomass of a forest ecosystem increases rapidly in the early stage with community development, and growth slows before becoming constant. For mature forests, the annual litter yield remains constant and fluctuates around the mean. This study therefore assumes that it is feasible to use an unchanging annual litter yield for the estimation of yield and decomposition rate, which do not have high precision requirements. However, the method proposed in this paper is not applicable to young forests during their early developmental stages, in which significant annual variations in litter yield are commonly observed. Forest fire disturbance disrupts the natural hierarchical structure of litter and, when compared to unburned forest areas, results in significant variations in litter decomposition rates at different time intervals after the fire [24]. These discrepancies do not align with the assumptions of this study. Consequently, the findings of this research are not applicable to forest lands affected by fire disturbances.
Forest litter is the result of the dynamic equilibrium between litter production and decomposition, and the litter load is jointly determined by the litter yield and decomposition rate. The factors affecting the litter yield and decomposition rate are complex and include not only climate and weather conditions [25,26], terrain [27,28], and stand characteristics [29,30] but also soil animals, microorganisms, enzymatic activity [31,32,33], and other factors that are difficult to quantify. This poses difficulties when using statistical methods to predict litter load. In this study, we studied the effector mechanisms of litter yield, decomposition rate, and load that mutually affected each other and utilized a mathematical model to examine the litter accumulation process. This contributes to a deeper understanding of the mechanisms underlying the spatial heterogeneity of litter load, and offers novel insights for predicting forest fuel loads and implementing evidence-based forest fire management systems.
Due to a lack of small branch (diameter < 0.6 cm) load data, only the thick branch load was considered for the prediction of parameter r. Incorporating the small branch load into the multivariate regression model in future research will further enhance the regression model fit. In addition, other methods can be utilized to obtain the model parameters for different types of litter. In the future, we will include decomposition experiments to further investigate forest litter.
5. Conclusions
In this study, we constructed a mathematical model consisting of easily obtained variables to estimate forest litter yield, decomposition rate, and decomposition turnover and utilized statistical methods to obtain the model parameters. The results indicate that the post-defoliation thick branch load, litter lower layer load, and altitude can be employed to calculate the model parameters. The litter upper layer load and total load can be used to rapidly estimate the litter yield, decomposition rate, and decomposition turnover, providing a combined litter yield and decomposition rate research method that saves time and effort. Hence, this approach has important application value for studies on litter yield and decomposition.
The Xing’an Dahurian larch forest in Heilongjiang province was used as the study subject and large sample data from the “National Forest and Grassland Fire Risk Census” were used to calculate the model parameters. We estimated the litter yield, decomposition rate, and upper layer decomposition turnover of the survey site and validated the operability and accuracy of the estimation method.
Author Contributions
Conceptualization, Z.C., L.S. and H.H.; methodology, Z.C. and H.H.; software, Z.C.; validation, Z.C.; formal analysis, J.S.; investigation, Z.C.; resources, J.S.; data curation, Z.C.; writing—original draft preparation, Z.C.; writing—review and editing, Z.C. and J.S.; visualization, Z.C.; supervision, J.S.; project administration, J.S.; funding acquisition, J.S. All authors have read and agreed to the published version of the manuscript.
Funding
This research was funded by [National Key R&D Program of China] grant number [2023YFC3006800] and [Project of Scientific Research Business Expenses of Provincial Scientific Research Institutes in Heilongjiang Province] grant number [LKSB2025-2]. The APC was funded by [2023YFC3006800].
Data Availability Statement
The data that support the findings of this study are available from the author upon reasonable request.
Conflicts of Interest
The authors declare no conflicts of interest.
References
- Xue, J.H. Forest Ecology; China Forestry Publishing House: Beijing, China, 2006; pp. 200–201. [Google Scholar]
- Shang, Y.C. General Ecology; Peking University Press: Beijing, China, 2010; pp. 59–73. [Google Scholar]
- Zhang, X.P.; Wang, R.P.; Zhu, B. Litter fall production in relation to environm to environmental factors in northeast china’s forests. J. Plant Ecol. 2008, 32, 1031–1040. [Google Scholar]
- Ma, Z.Z.; Zhang, Q.Z.; Wang, C.K. Long-term dynamics in litter production and environmental drivers. Acta Ecol. Sin. 2023, 43, 7307–7316. [Google Scholar]
- Zemskov, P.I.; Bogatyrev, L.G. Applying the Litter–Bag Technique for Studying Plant Litter Decomposition Processes in Natural and Urbanized Biogeocenoses. Eurasian Soil Sci. 2025, 58, 14. [Google Scholar] [CrossRef]
- Liu, Q. Characteristics and hotspots of forest litter decomposition research: A bibliometric analysis. Land Degrad. Dev. 2024, 35, 2684–2699. [Google Scholar] [CrossRef]
- Chen, J.H.; Gao, M.; Chen, G.C. Difference in the production and elemental composition of litter in Kandelia obovata mangrove forests due to site elevation. J. Sea Res. 2024, 200, 102508. [Google Scholar] [CrossRef]
- Vinod, C.J.; Sundriyal, R.C. Seasonal and long-term changes in litterfall production and litter decomposition in the dominant forest communities of Western Himalaya. Ecol. Front. 2024, 44, 664–672. [Google Scholar] [CrossRef]
- Zhou, L.L.; Shalom, A.D.; Wu, P.F. Litterfall production and nutrient return in different-aged Chinese fir (Cunninghamia lanceolata) plantations in South China. J. For. Res. 2015, 26, 79–89. [Google Scholar] [CrossRef]
- Satoshi, N.; Suzuki, M.I.; Ishihara. Nation-wide litter fall data from 21 forests of the Monitoring Sites 1000 Project in Japan. Ecol. Res. 2012, 27, 989–990. Available online: http://db.cger.nies.go.jp/JaLTER/ER_DataPapers/archives/2012/ERDP-2012-04 (accessed on 2 April 2025).
- Singh, K.P.; Singh, P.K. Litterfall, litter decomposition and nutrient release patterns in four native tree species raised on coal mine spoil at Singrauli, India. Biol. Fertil. Soils 1999, 29, 371–378. [Google Scholar] [CrossRef]
- Bonan, G.B.; Hartman, M.D. Evaluating litter decomposition in earth system models with long-term litterbag experiments: An example using the Community Land Model version 4 (CLM4). Glob. Change Biol. 2013, 19, 957–974. [Google Scholar] [CrossRef]
- Shailendra, B.; Uttam, B.; Bhagwat, P.P. An Overview of Leaf Litter Decomposition and Nutrient Dynamics of Multipurpose Tree Species. AJAEES 2023, 41, 68–74. Available online: https://journalajaees.com/index.php/AJAEES/article/view/2305 (accessed on 2 April 2025).
- Latterini, F.; Dyderski, M.K.; Horodecki, P. The effects of forest operations and silvicultural treatments on litter decompositionrate: A meta-analysis. Curr. For. Rep. 2023, 9, 276–290. [Google Scholar] [CrossRef]
- Liu, S.; Bu, M.L.; Li, Y. Regulation of initial soil environmental factors on litter decomposition rate affects the estimation accuracy of litter mass loss in a subtropical forest. Plant Soil. 2022, 485, 395–410. Available online: https://link.springer.com/article/10.1007/s11104-022-05838-y (accessed on 3 April 2025). [CrossRef]
- Berg, B.; Mikael, L. Long-Term Effects of Climate and Litter Chemistry on Rates and Stable Fractions of Decomposing Scots Pine and Norway Spruce Needle Litter-A Synthesis. Forests 2022, 13, 125. [Google Scholar] [CrossRef]
- Björn, B. Litter decomposition and organic matter turnover in northern forest soils. For. Ecol. Manag. 2000, 133, 13–22. [Google Scholar] [CrossRef]
- Liu, Z.W. Research method of litter decay rate in forest ecosystems. AES 2002, 22, 954–956. [Google Scholar] [CrossRef]
- National Forestry and Grassland Administration. Technical Specifications for Forest Fuel Standard Plot Survey; FXPC/LC F-01; Office of the Leading Group of the First National Natural Hazard Comprehensive Risk Survey of the State Council: Beijing, China, 2021.
- Aber, J.D.; Mcclaugherty, C.A. Predicting long-term patterns of mass loss nitrogen dynamics and soil organic matter formation from initial fine litter chemistry in temperature forest ecosystems. Can. J. Bot. 1990, 68, 2201–2208. [Google Scholar] [CrossRef]
- Moorhead, D.L.; Reynolds, J.F. A general model of litter decomposition in the northern Chihuahuan Desert. Ecol. Model. 1991, 59, 197–219. [Google Scholar] [CrossRef]
- Liu, Z.W.; Gao, W.J.; Pan, K.W. Discussion on the study methods and models of litter decomposition. AES 2006, 26, 1993–2000. [Google Scholar] [CrossRef]
- Hu, H.R.; Bei, R.T.; Wang, Y.X. Forest Soil Science; China Forestry Publishing House: Beijing, China, 2019; pp. 48–52. [Google Scholar]
- Bryanin, S.; Kondratova, A.; Abramova, E. Litter Decomposition and Nutrient Dynamics in Fire-Affected Larch Forests in the Russian Far East. Forests 2020, 11, 882. [Google Scholar] [CrossRef]
- Zhang, F.; Feng, Y.H.; Song, S.S. Temperature sensitivity of plant litter decomposition rate in China’s forests. Ecosphere 2021, 12, e03541. [Google Scholar] [CrossRef]
- Wu, J.J.; Su, B.L.; Li, X.Z. Latitudinal responses of litter decomposition to solar radiation. J. Appl. Ecol. 2024, 35, 2511–2517. [Google Scholar]
- Rosalie, F.; Louis, D.; Evelyne, T. Interannual variability and seasonality of litterfall in three temperate and boreal forest ecosystems of eastern Canada: A synthesis of long-term monitoring. For. Ecol. Manag. 2024, 568, 122069. [Google Scholar] [CrossRef]
- Chen, B.; Jiang, L.; Liu, J.F. What control home-field advantage of foliar litter decomposition along an elevational gradient in subtropical forests. Plant Soil. 2025, 512, 1493–1508. [Google Scholar] [CrossRef]
- Liu, X.; Zhou, T.; Lou, H. Models ignoring spatial heterogeneities of forest age will significantly overestimate the climate effects on litterfall in China. Sci. Total Environ. 2019, 661, 492–503. [Google Scholar] [CrossRef] [PubMed]
- Joly, F.X.; Milcu, A. Tree species diversity affects decomposition through modified micro-environmental conditions across European forests. TNP 2017, 214, 1281–1293. [Google Scholar] [CrossRef] [PubMed]
- Wu, W.X.; Zhou, X.G. Coniferous-Broadleaf Mixture Increases Soil Microbial Biomass and Functions Accompanied by Improved Stand Biomass and Litter Production in Subtropical China. Forests 2019, 10, 879. [Google Scholar] [CrossRef]
- Yang, W.Q.; Wang, K.Y. Advances in forest soil enzymology. Sci. Silvae Sin. 2004, 40, 152–159. Available online: http://www.linyekexue.net/CN/10.11707/j.1001-7488.20040227 (accessed on 5 April 2025).
- Zhang, D.L.; Mao, Z.J.; Zhang, L. Advances of enzyme activities in the process of litter decomposition. Sci. Silvae Sin. 2006, 42, 105–109. [Google Scholar] [CrossRef]
Disclaimer/Publisher’s Note: The statements, opinions and data contained in all publications are solely those of the individual author(s) and contributor(s) and not of MDPI and/or the editor(s). MDPI and/or the editor(s) disclaim responsibility for any injury to people or property resulting from any ideas, methods, instructions or products referred to in the content. |
© 2025 by the authors. Licensee MDPI, Basel, Switzerland. This article is an open access article distributed under the terms and conditions of the Creative Commons Attribution (CC BY) license (https://creativecommons.org/licenses/by/4.0/).