Article

Restoration of Impounded Forests of Coastal Louisiana Using Spoil Bank Gapping

Department of Biological Sciences, Southeastern Louisiana University, Hammond, LA 70402, USA
*
Author to whom correspondence should be addressed.
Forests 2025, 16(1), 99; https://doi.org/10.3390/f16010099
Submission received: 2 August 2024 / Revised: 13 November 2024 / Accepted: 16 December 2024 / Published: 9 January 2025
(This article belongs to the Section Forest Hydrology)

Abstract

:
Impoundment and increased flood duration are some of the most common stressors to declining forested wetlands in coastal Louisiana, USA. One type of restoration that has shown itself to be cost-effective is spoil bank gapping. This type of hydrologic restoration has occurred within the Lac des Allemands swamp of Barataria Basin. After 60 years of impoundment, the hydrogeomorphic processes in the study area were improved. The study area included eight paired 625 m2 sites. Basal area growth over the 7-year period varied between 5.93% and 14.39%, with an average of 8.31%, or just over 1% wood growth per year. Post-restoration basal areas indicate that all our study areas are improving. Pooled together, the 2018–2023 years had significantly higher net production than the pre-project 2017 growing season. The distribution between leaf and wood production was remarkably similar within species types across years, with leaf production consistently exceeding wood production, particularly due to Taxodium distichum. Canopy cover has increased by 20 percent since project construction, and as a result, herbaceous cover tends to decrease over time.

1. Introduction

Most of the wetlands of coastal Louisiana, regardless of whether they are herbaceous or forested, are in a state of degradation as a result of overlapping stressors. These include impoundment, increased flood durations influenced by subsidence and sea-level rise, nutrient limitation, herbivory, saltwater intrusion, and anthropogenic development. There are over 16,000 km of canals that have been dug for drainage, navigation, and oil and gas exploration in coastal Louisiana that have altered hydrology and influenced land loss [1]. The impoundment is by far the most common stressor of coastal Louisiana swamps, the vast majority of which are dominated by bald cypress (Taxodium distichum (L.) Rich) and water tupelo (Nyssa aquatica (L.)). Impoundment is a term used to refer to a wetland that has some form of restriction to the natural hydrologic processes due to a barrier, which is often man-made, such as levees, roadways, and spoil banks. Turner and McClenachan (2018) mentioned the southern parishes of Louisiana have such an abundance of spoil banks that they could cross the state 80 times from east to west [2,3]. They also found there to be about 4.6 hectares (ha) of land lost for every 1 ha of canals. The abundance of these spoil banks and man-made canals has caused serious implications for these coastal wetlands, as they impinge on the natural hydrogeomorphic processes [4,5,6,7,8,9]. As a result, these impounded wetlands in coastal Louisiana can experience long durations of inundation, influencing stagnant water conditions and soils that are deprived of oxygen, which is essential for the survival of all plants [4,5].
With respect to impoundment, two excellent examples in southeastern Louisiana include the Amite River Diversion swamp and the Lac des Allemands swamp, both of which have experienced over 60 years of permanent flooding [5,7,10,11]. The Amite River Diversion swamp is located within the Pontchartrain Basin and the Lac des Allemands swamp is positioned in the Barataria Basin. Both of these areas were nominated for restoration by the senior author of this manuscript under Louisiana’s Coastal Wetland Planning, Protection and Restoration Act (CWPPRA) [10,11,12]. The goal of this restoration was to study how hydrologic management would affect woody growth rates, herbaceous vegetation coverage, natural regeneration of woody seedlings, and canopy cover of the forest.
Importantly, on average, wetland restoration in coastal Louisiana costs about USD 70,000 per acre. To date, gapping projects have cost an average of USD 417 per acre [10,11,12,13,14]. The impoundment is one of the greatest stressors to bald cypress—water tupelo (Taxodium distichumNyssa aquatica) swamps in coastal Louisiana [4,5,6,7,8,9]. Spoil bank gapping aims to stimulate hydrologic restoration (i.e., increased sheet flow and drainage) in areas that experience long periods of inundation with stagnant, nutrient-poor hydrology [10]. We believe gapping would be more cost-effective than backfilling canals with spoil banks; even if hydrologic improvements are limited to the number of gaps, we expect less erosion from gapping and less disturbance to degraded forested wetlands [1,2,11]. Hoover and Smith (2021) mention that some of the highest rates of aboveground live tree carbon accumulation occur in the southeastern United States [15]. As stated above, spoil bank gapping may be another cost-effective restoration practice that may ensure an additional extent of sustainability to these forested wetlands.
The 970 ha Lac des Allemands swamp has been studied since the 1970s [5,16]. Since then, researchers have found that aboveground tree production has steadily decreased while exhibiting little to no natural woody regeneration because of permanent flooding that prevented seed germination [4,5,16,17,18,19,20,21]. River input to the Barataria Basin, like others, has been greatly reduced due to the leveeing of the Mississippi River [5,6,7,8,9], and the abundance of channelization alongside spoil banks has resulted in less flow of water with adjacent wetlands [5]. Because of this, soil samples are typically highly organic [13,22]. This is an interesting note in regard to upper tidal estuary wetlands that act as blue carbon storage [23] in the more recent importance of carbon sequestration.
This monitoring study began in the fall of 2016 with the establishment of sixteen 625 m2 stations, two of which were identical to the reference site used in the aforementioned studies (see [5,16,17,18,19,20,21,24,25,26,27,28]). Herbaceous and tree productivity was monitored during 2017, which provided data prior to the gapping of spoil banks. The construction of the gaps occurred during the winter season of 2017–2018 and was completed in February 2018 (see [10] for photographs during construction). Monitoring during 2018–2023 provided post-construction data under a wide variety of weather conditions, including a major hurricane, severe drought, and a year subject to considerably higher-than-average precipitation. Our hypotheses include the following: (i) gapping of spoil banks would lead to a more natural hydrologic regime, with greater sheet flow and drainage, (ii) net primary production would increase, (iii) canopy cover would increase, and herbaceous cover would decrease.

2. Materials and Methods
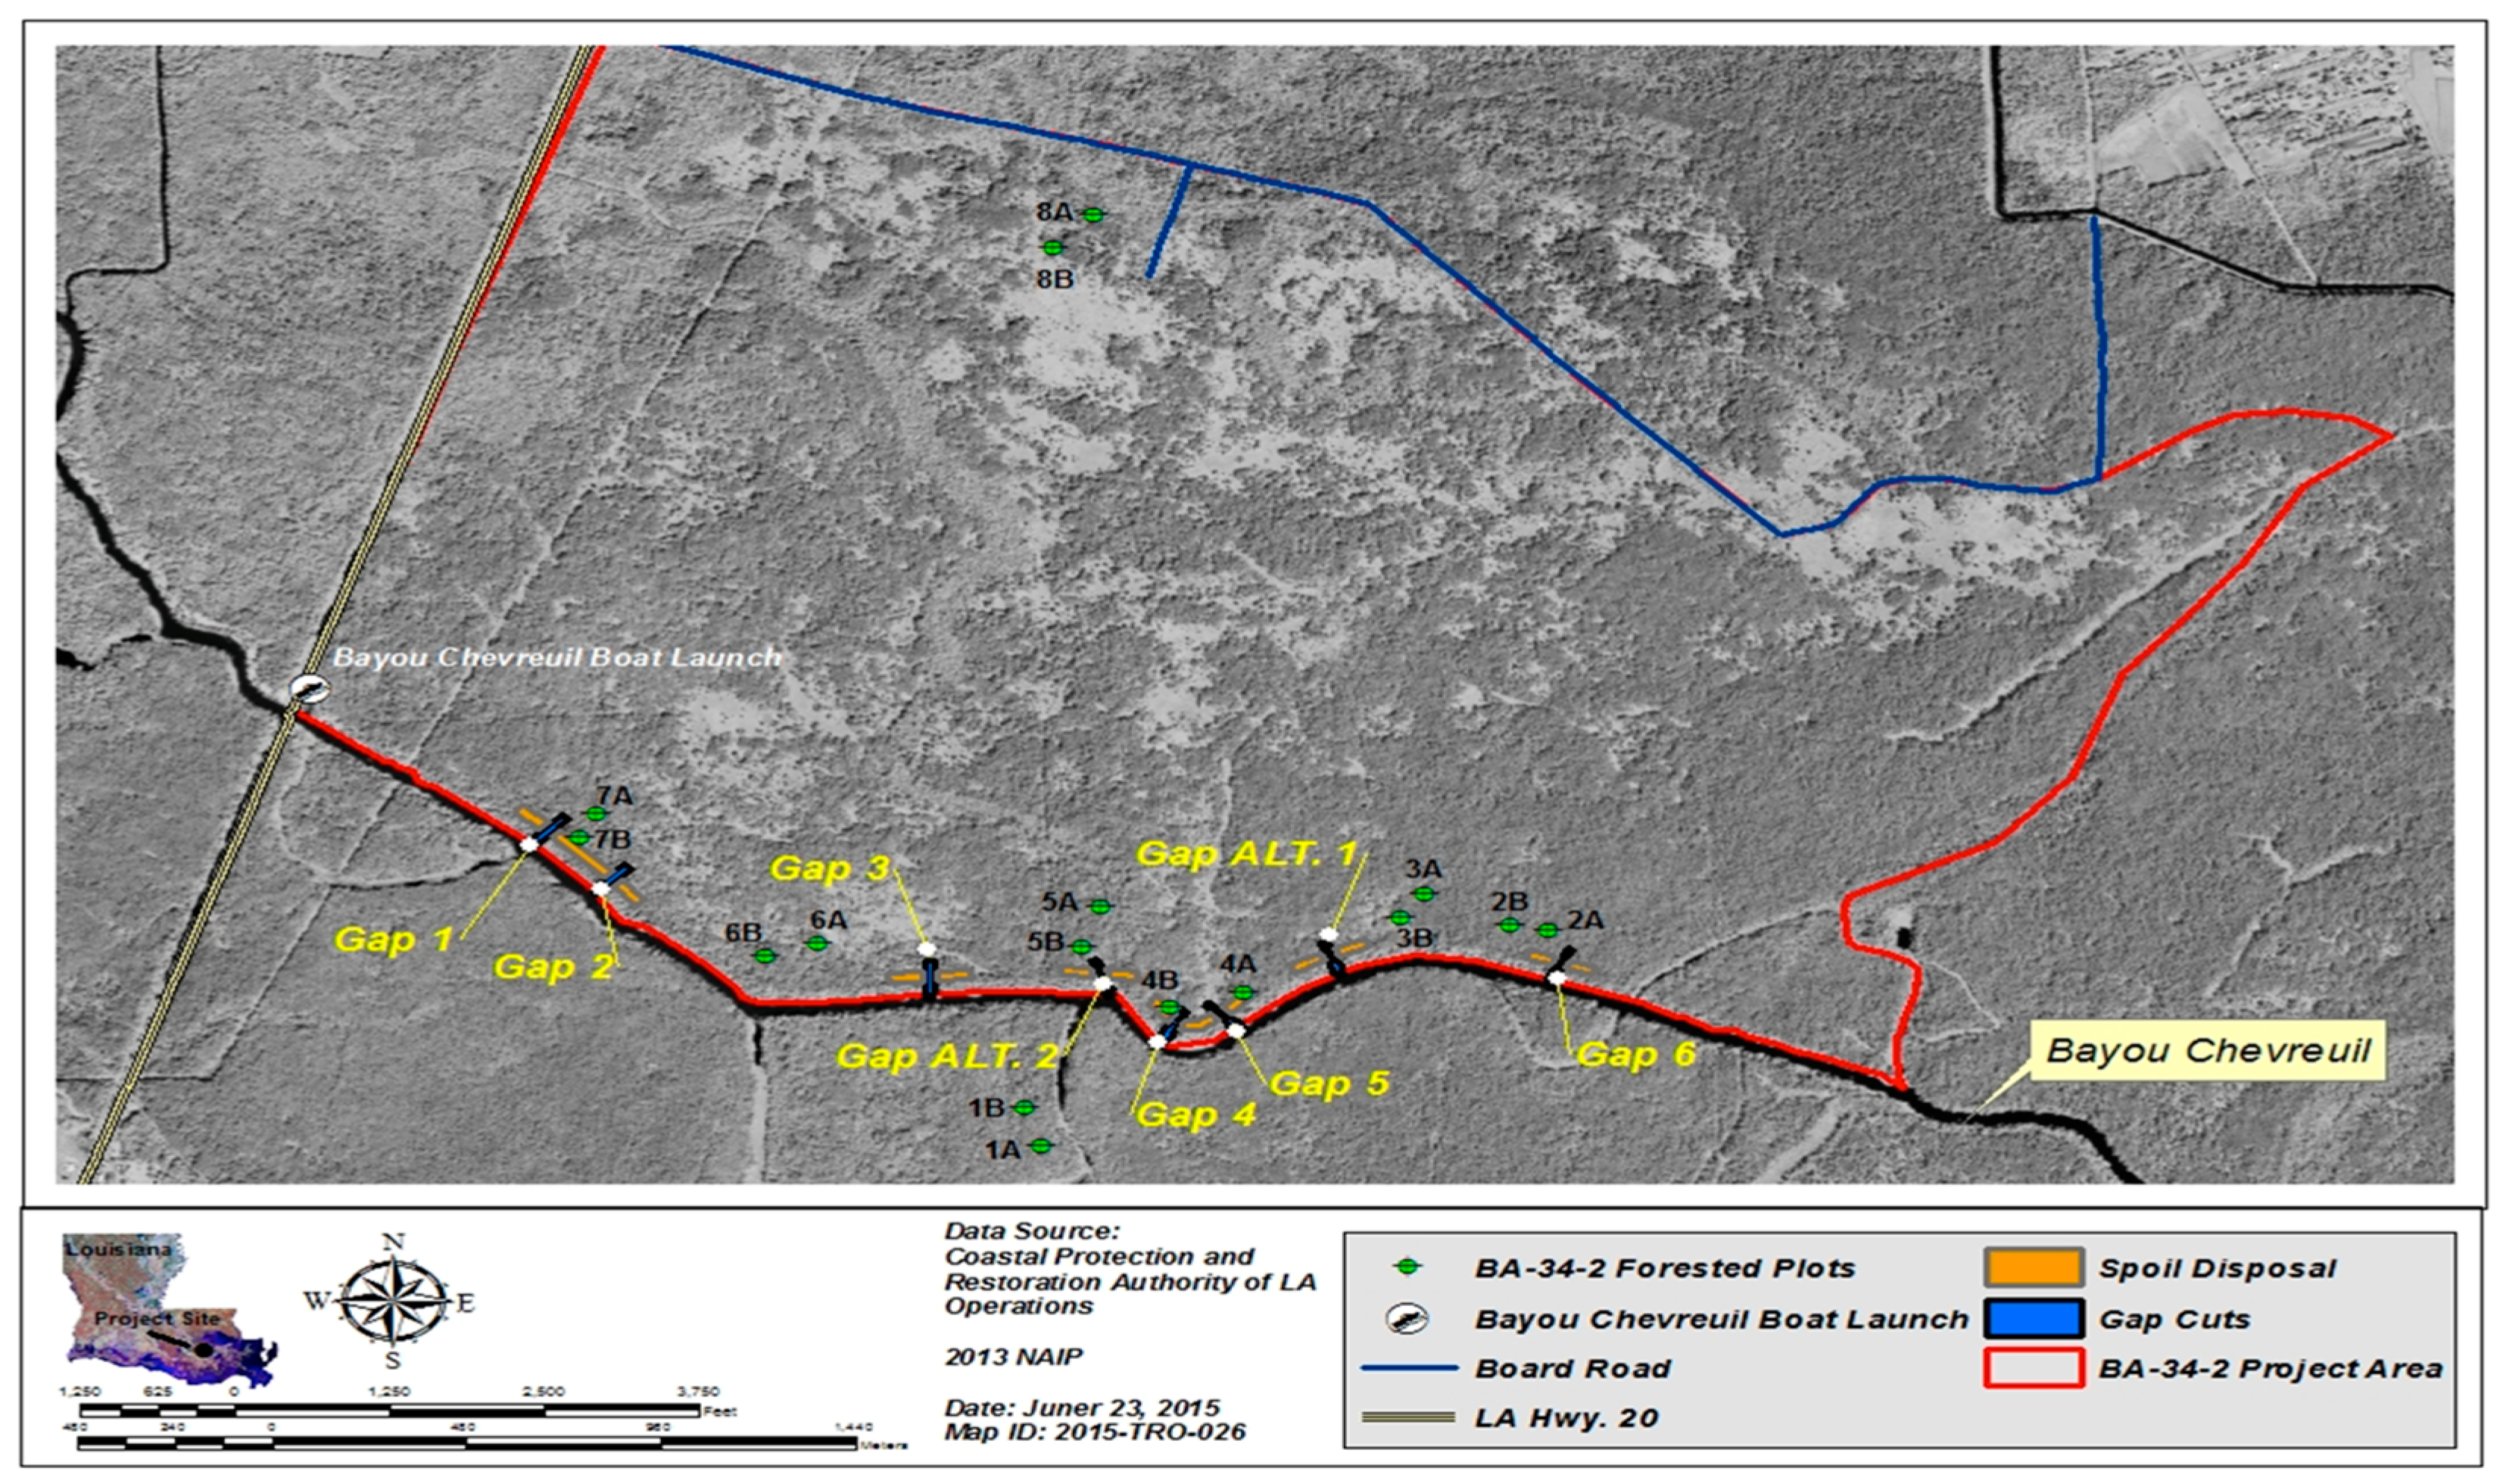
2.1. Study Site

As mentioned by Shaffer et al. (2021) [13], restoration of the Lac des Allemands swamp involved increasing exchange with Bayou Chevreuil by creating eight 30 m × 122 m gaps through the spoil bank (Figure 1 and Figure 2) [10]. As mentioned above, this monitoring study began prior to gapping to provide data on pre-construction herbaceous and tree production. The sixteen stations were broken down into eight replicated sites. Six of the eight sites were located either near or halfway between gap locations to capture maximum and minimum benefits, respectively. To ensure true replication, each site had replicated stations that were located at least 100 m apart. In addition, a healthy reference site (Stations 1A and 1B; Figure 1) was located on LSU Island, west of Bayou Chevreuil, which is not impounded. A site was also located near the northern border of the Lac des Allemands swamp (Stations 8A and 8B; Figure 1), which was not expected to benefit from the addition of gaps in Bayou Chevreuil.

2.2. Forested Swamp Vegetation

The design of the study methods is continued from Shaffer et al. (2021). The sixteen 25 m × 25 m (625 m2) stations were sampled from 2016 to 2023. The corners, i.e., the northeast, northwest, southeast, and southwest, were marked at each station with 3 m tall sections of PVC pipe. The Universal Transverse Mercator (UTM) coordinates were established using the North American Datum of 1983 (NAD 83) at the southeast (SE) corner with a differential GPS with sub-meter accuracy. Each of these SE pipes is designed to include three stripes for directional reference. All trees in the station with a diameter greater than 4″ (about 10 cm) at diameter at breast height (DBH) are tagged, with tags facing the three-stripped SE pipe of each station. Tree tags were fastened to each tree with a 3″ (about 7.5 cm) deck screw to allow the screw to be backed out over the course of the 20-year monitoring effort. A second screw was attached 180° on the backside of each tree at the tag base level as a guide to help ensure greater accuracy while collecting annual diameter measurements [6,7]. During the first year of monitoring efforts, a strand of bright survey tape was fastened to each tree; every year after, a second strand was either added or removed to increase the efficiency of finding all trees within the stations. All trees were identified to species, and diameters were measured at 2 m height (about 6 ft) to avoid buttress swell for all T. distichum and N. aquatica and at about 1.3 m height (4.5 ft, DBH) for midstory species (≥4″ diameter) [13,29]. Canopy cover was measured at each of the four herbaceous plots with a spherical densiometer (see below). These data were collected between October and early December of 2016–2023. In addition, four 0.25 m2 litterfall traps were randomly located at each station after the 2016 leaves had fallen in mid-March 2017, with a total of 64 litterfall traps across the entire study area. Leaf litter is referred to as all non-woody aboveground litter that includes flowers, fruits, and seeds [29,30]. Leaf litter is collected from these traps about every 2 months or roughly monthly during periods of high litterfall until all leaves have fallen (mid-March of the following year). Leaves are sorted to canopy species (Nyssa aquatica, Taxodium distichum, and midstory, which is almost exclusively Acer rubrum var. drummondii), dried, and weighed. In general, five investigators are present on each field day, three of whom were present during all years; these investigators carefully train new individuals to ensure consistency of measurements is maintained.

2.3. Herbaceous Vegetation

Four 2 m × 2 m (4 m2) herbaceous plots are located about 5 m from each corner pipe at each station, for a total of 64 herbaceous plots across the entire study area. Herbaceous vegetation was estimated by species in 5% increments from 2016–2023 [6,7]. Four 2 m tall PVC pipes mark the corners of each herbaceous plot. Herbaceous plots are positioned to be vacant of trees. The same two investigators make independent estimates of each species’ cover, then discuss their cover estimates until a consensus is reached.

2.4. Data Analysis

The diameter data were used to compute aboveground wood biomass from published regression formulas [31,32,33,34]. Wood production was calculated as the difference in wood biomass per year [32,33,34]. Wood production per tree was then summed by species category type (bald cypress, water tupelo, and midstory) per station and then converted to total aboveground wood production per square meter per year (g·m−2y−1).
Forest data were analyzed with the General Linear Model procedure of SYSTAT 13.0 software. For wood net primary production, a repeated measures analysis was performed; because the trees were not true replicates and to appropriately reduce power, F-values are reported as Hotelling–Lawley Trace Statistics. Herbaceous data were analyzed using the non-metric multidimensional scaling procedure of Primer 7, a community analysis software. The Bray–Curtis similarity index was used in computation of resemblance matrices.

3. Results and Discussion

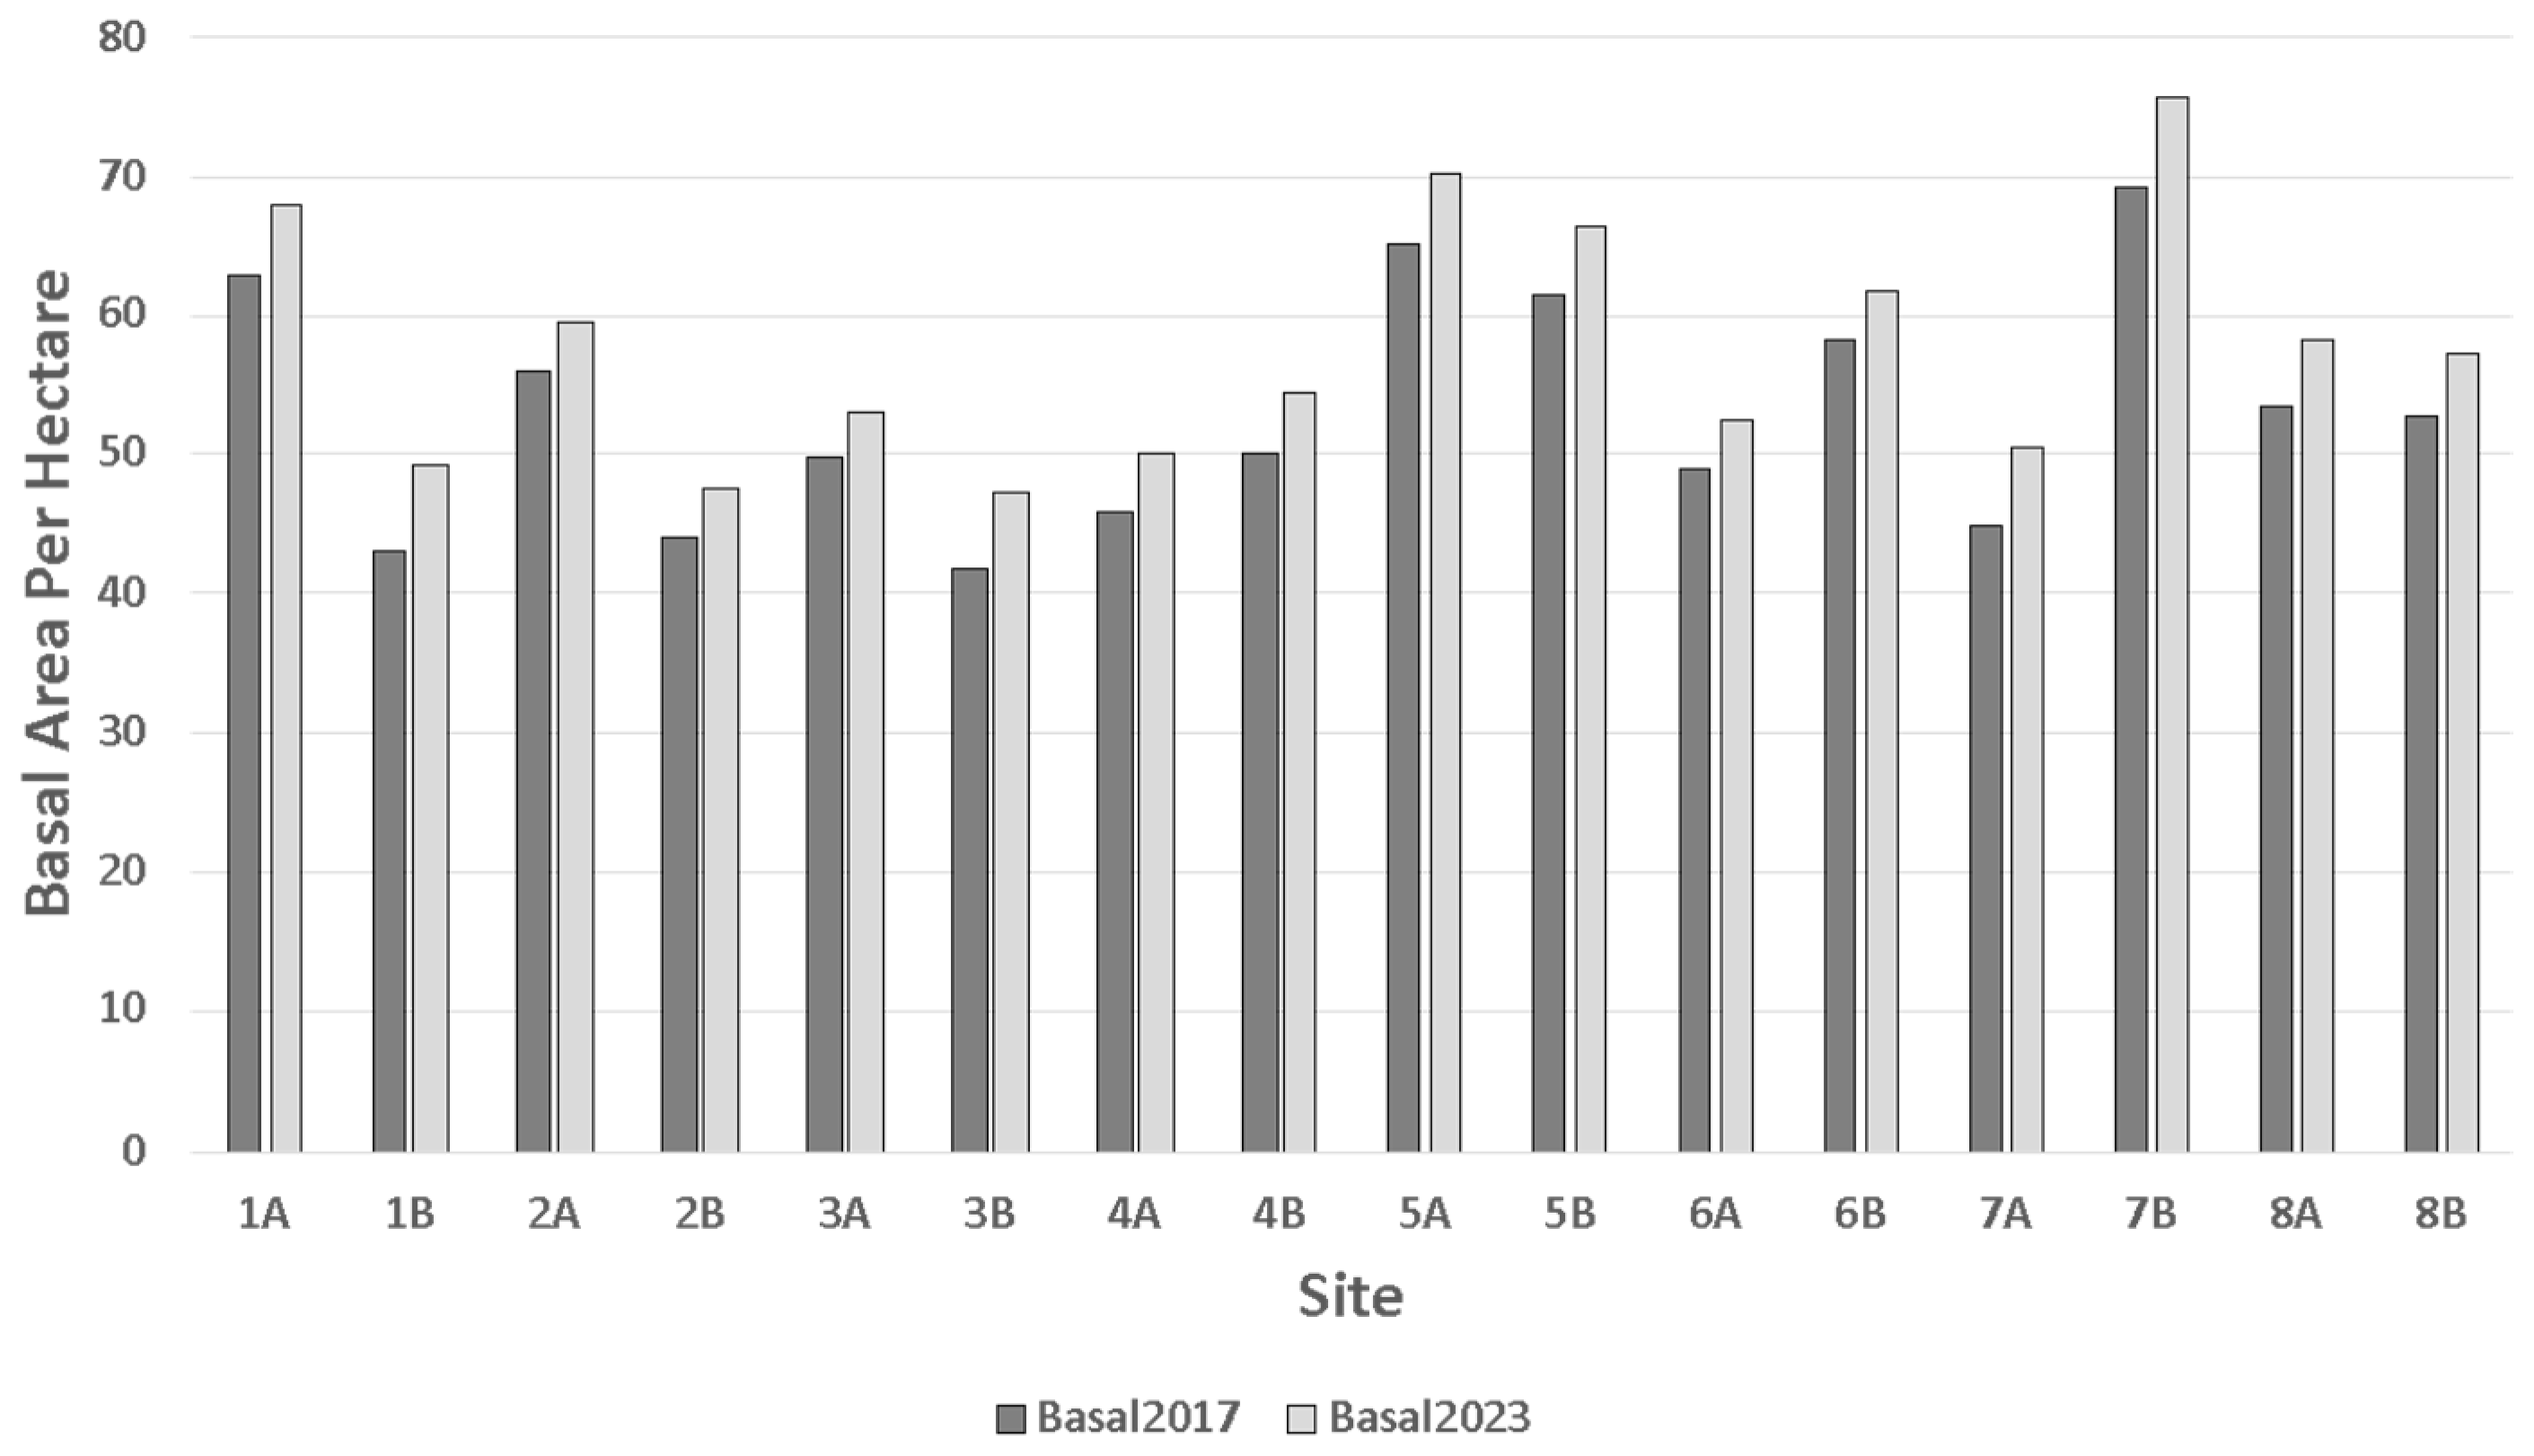
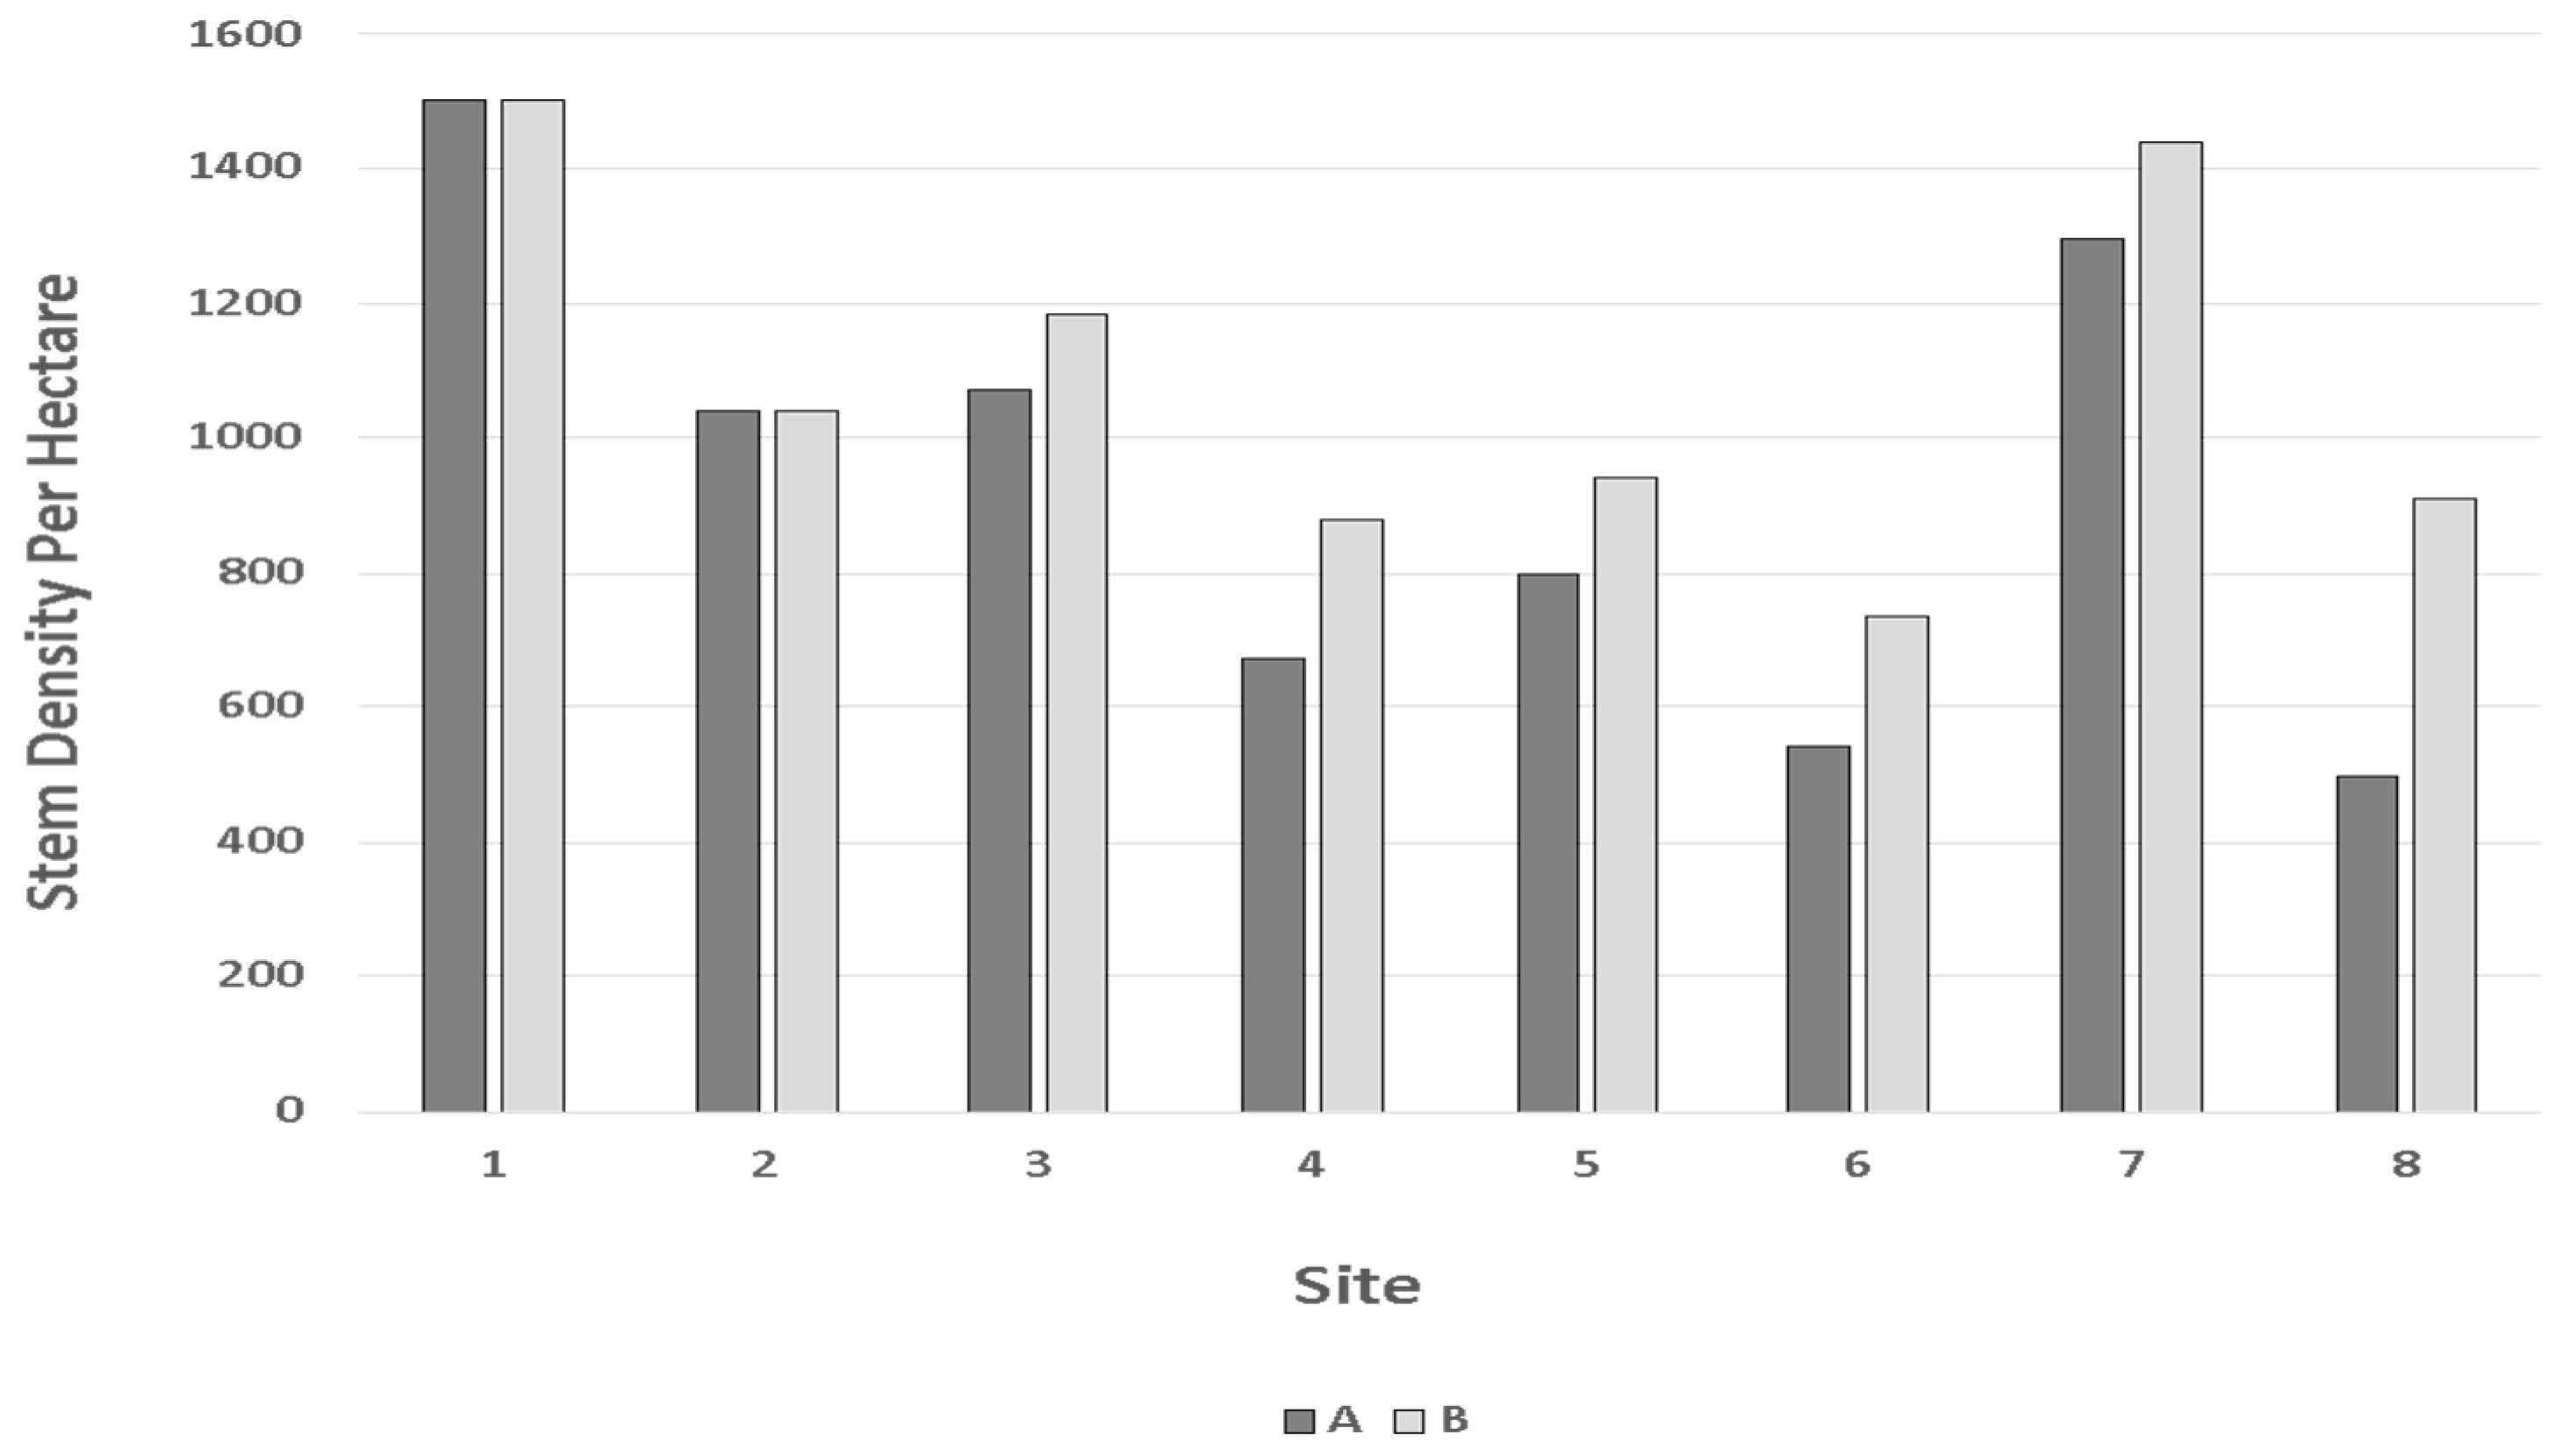
3.1. Forest Structure

A total of nine woody species were present in the study area; however, Acer rubrum var. drummondii, Nyssa aquatica, and Taxodium distichum accounted for 96.8% of the stems present (the remainder consisted of Cephalanthus occidentalis, Fraxinus caroliniana, Fraxinus profunda, Morella cerifera, Nyssa biflora, and Salix nigra). In 2023, all stations increased in basal area (Figure 3) but were nearly static in stem density. Basal area growth over the 7-year period varied between 5.93% and 14.39%, with an average of 8.31%, or just over 1% wood growth per year. A variation in dominant canopy species occurred across stations (Figure 3). Basal areas of these three dominant species differed widely (F2,991 = 122.66, p < 0.0001; Figure 3) and were highly inconsistent across sites (interaction F14,991 = 5.59, p < 0.0001); while mean differences between species may not be large, our equations predict lower biomass production from Acer rubrum var. drumondii and the less abundant other midstory species [35]. In contrast to the results by Shaffer et al. (2021), in which basal area in 2017 differed widely between sites (F7,1032 = 8.64, p < 0.0001) and tree species (F8,1032 = 36.45, p < 0.0001). In 2017, basal area averaged 53.03 m2/ha and ranged between 41.78 m2/ha and 69.28 m2/ha (Figure 3), nearly twice as great as previously measured in the Maurepas swamp [6,7]. Interestingly, each station experienced nearly equal rates of mortality and recruitment of midstory trees every year.
Stem density in 2017 and 2023 averaged 986 per hectare and ranged between 496 and 1504 per hectare (Figure 4) and was highest at the reference site. The reference site in this study is the same site as Conner and Day’s [16,17,18] “Natural” site, which was reported to have stem densities ranging between 880 and 990 stems per hectare and was representative of several other sites. This variation in stem density is a sign that the area has become highly unstable over the past 50 years, with some areas degrading and others improving in net primary production (NPP). However, the post-restoration basal areas indicate that all areas within our study sites are now improving (Figure 3). With respect to stem dominance, N. aquatica and T. distichum each dominated seven stations, whereas A. rubrum var. drummondii dominated only two stations (Figure 5); it may be possible that these sites dominated by A. rubrum var. drummondii represent a successional trend due to previous stressors [36]. With respect to basal area, which is a much better indicator of biomass [24,33,35,37], N. aquatica dominated six stations, while T. distichum dominated ten stations.

3.2. Forest Function

3.2.1. Canopy Closure

Percent canopy closure was nearly identical for 2016 and 2017 (Figure 6) [13]. Shaffer et al. (2021) found that canopy closure in 2018 increased by about 20 percent [13], which suggests that the experimental sites had positively responded to the hydrologic restoration (Figure 6). Canopy cover has remained relatively consistent since (Figure 6).

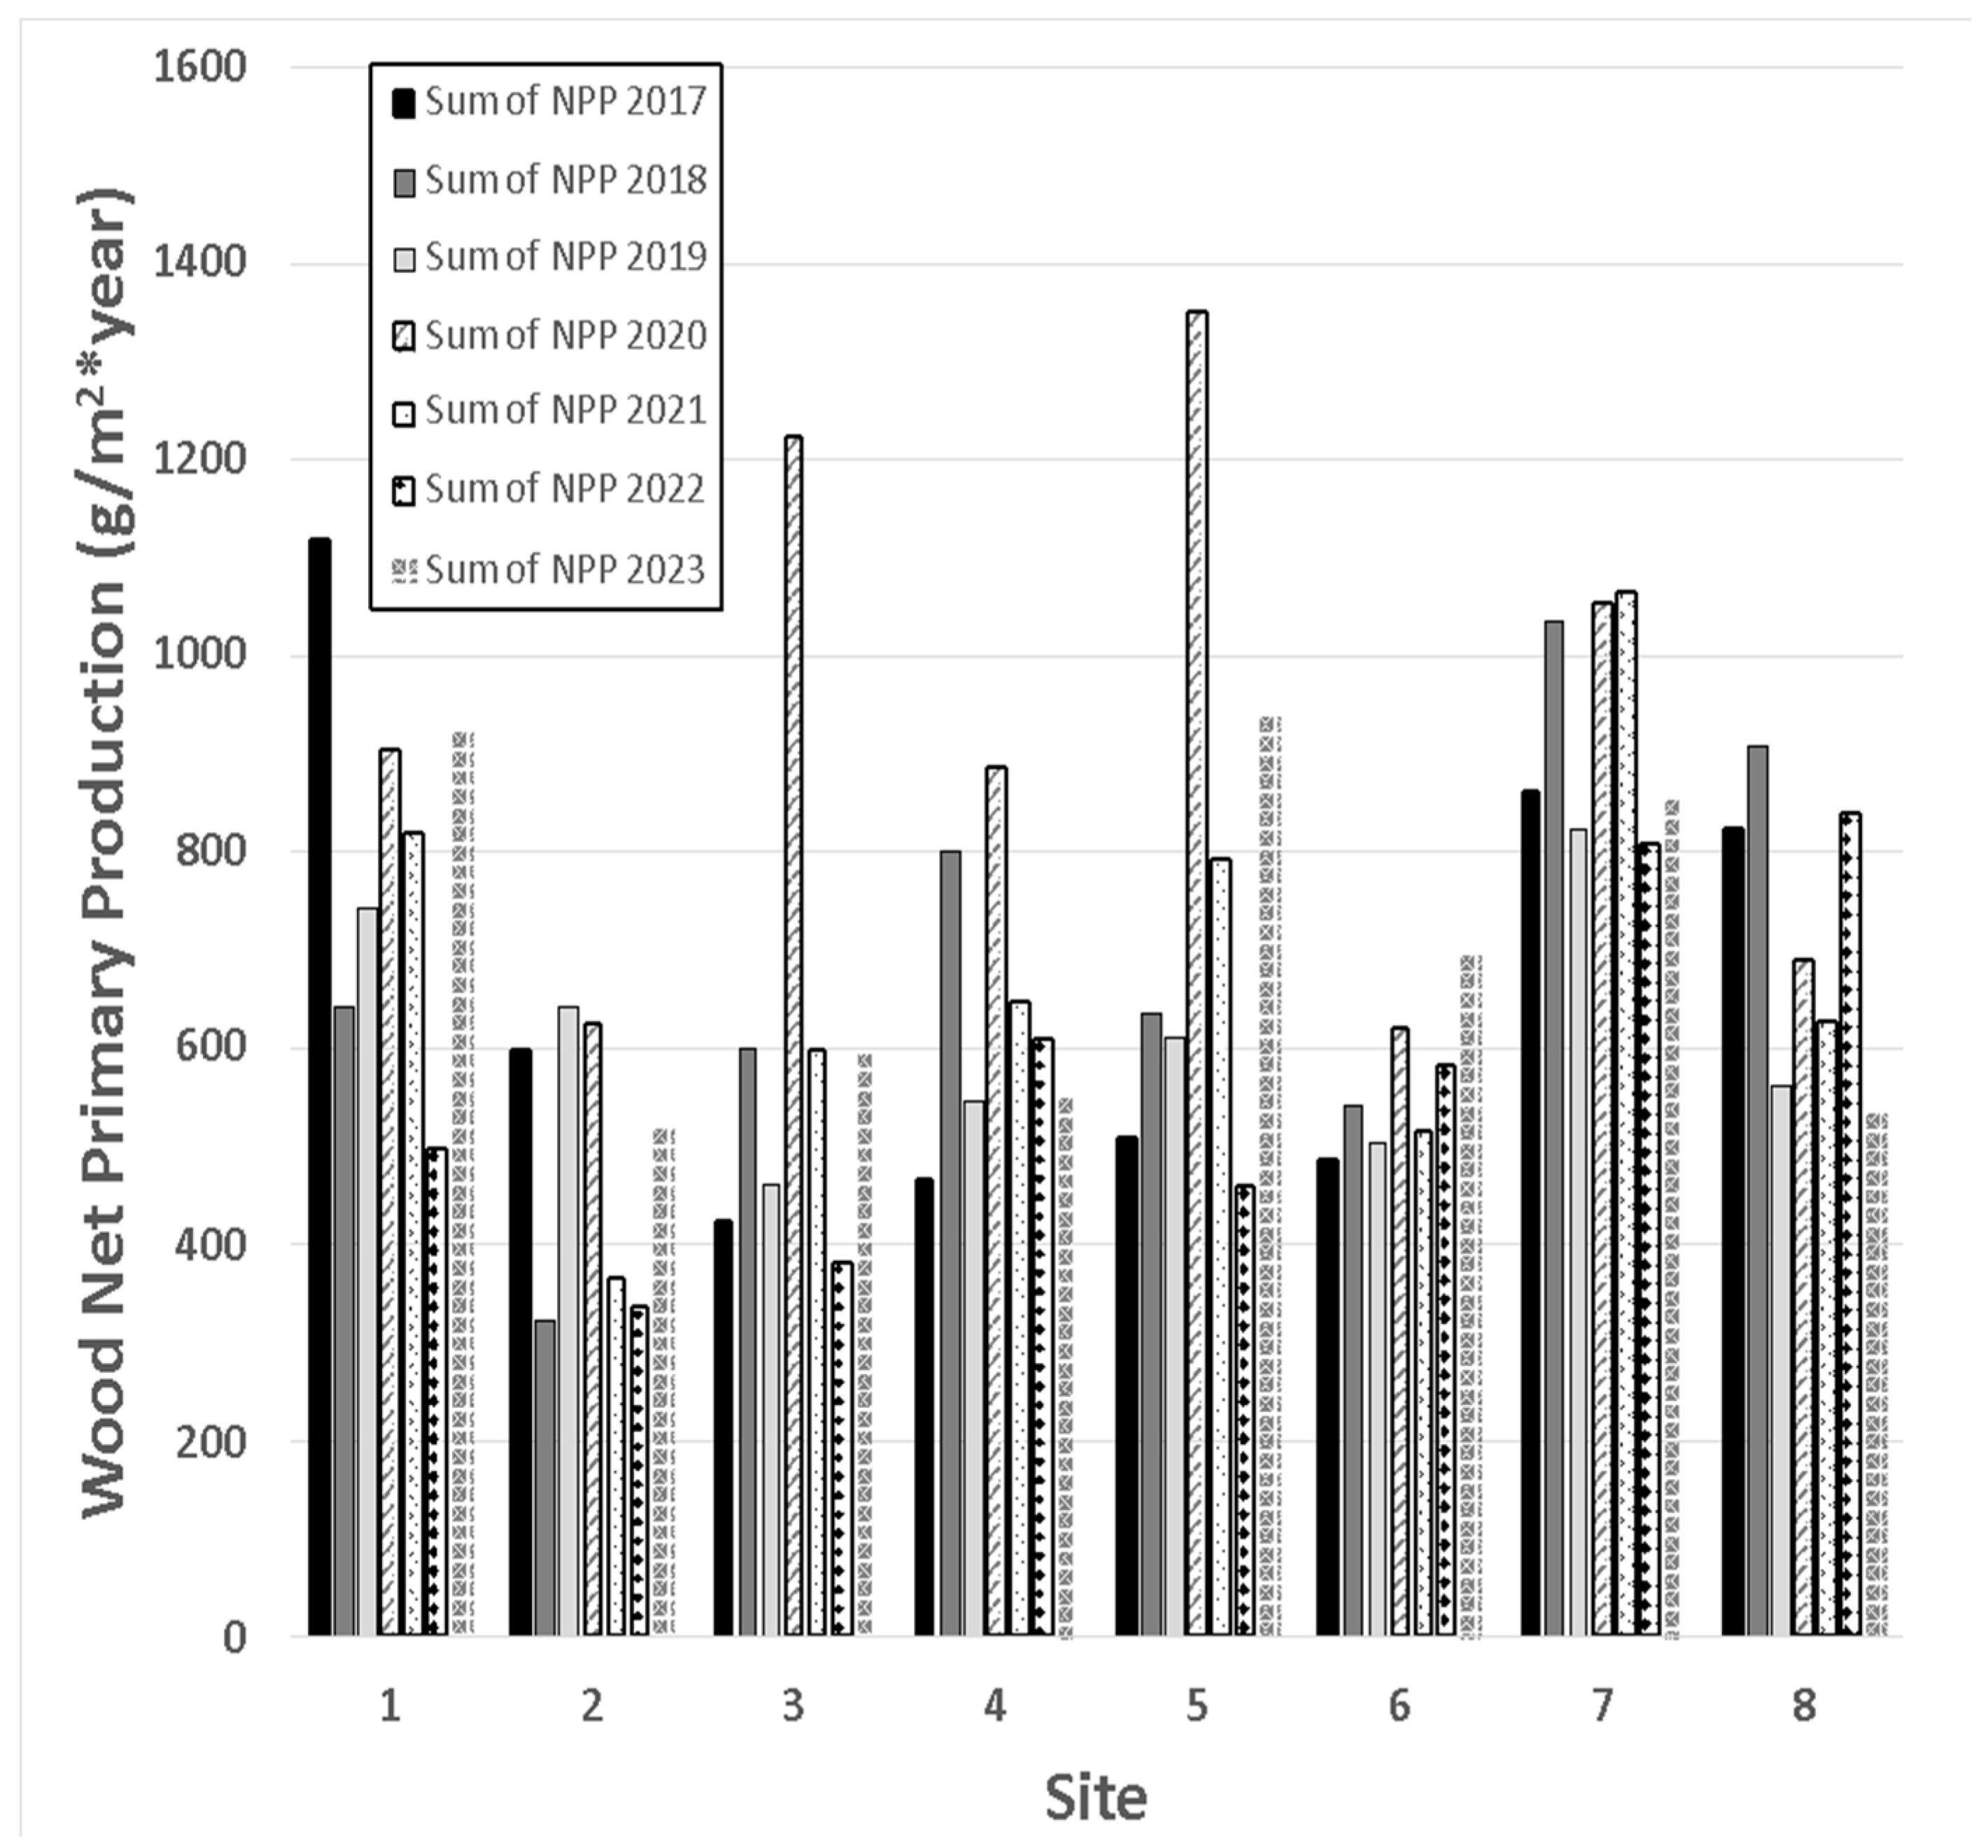
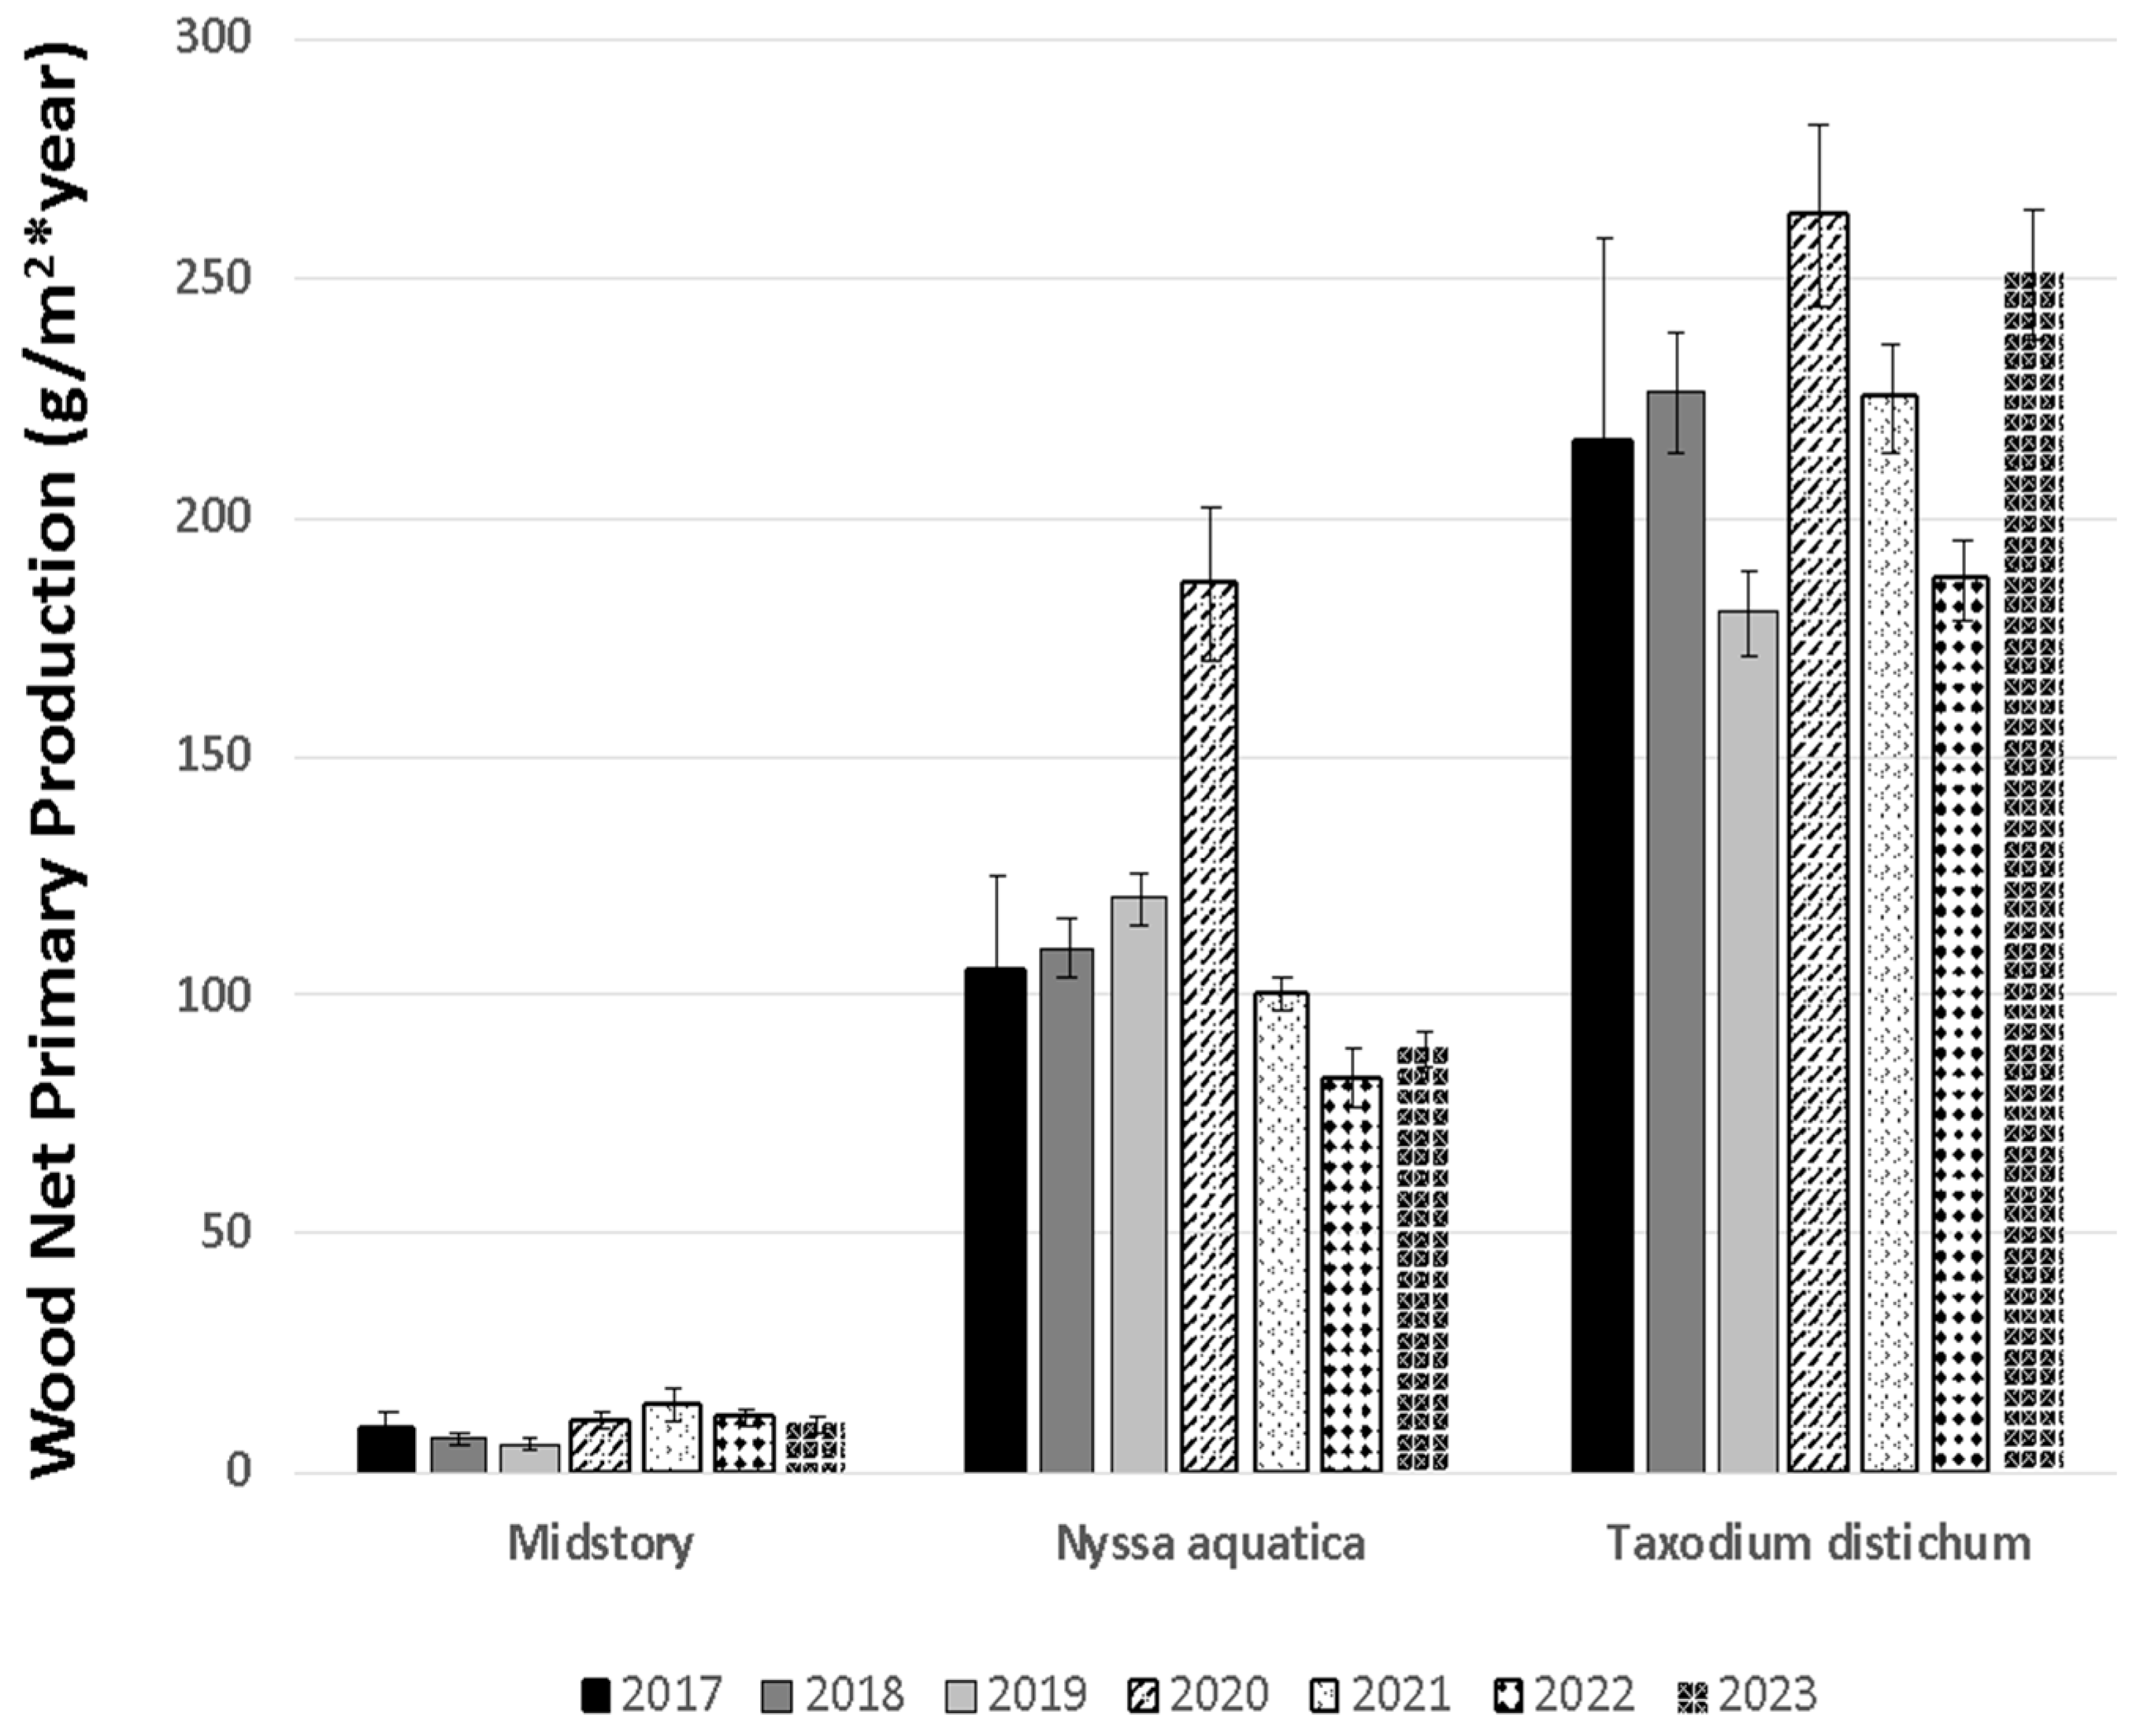
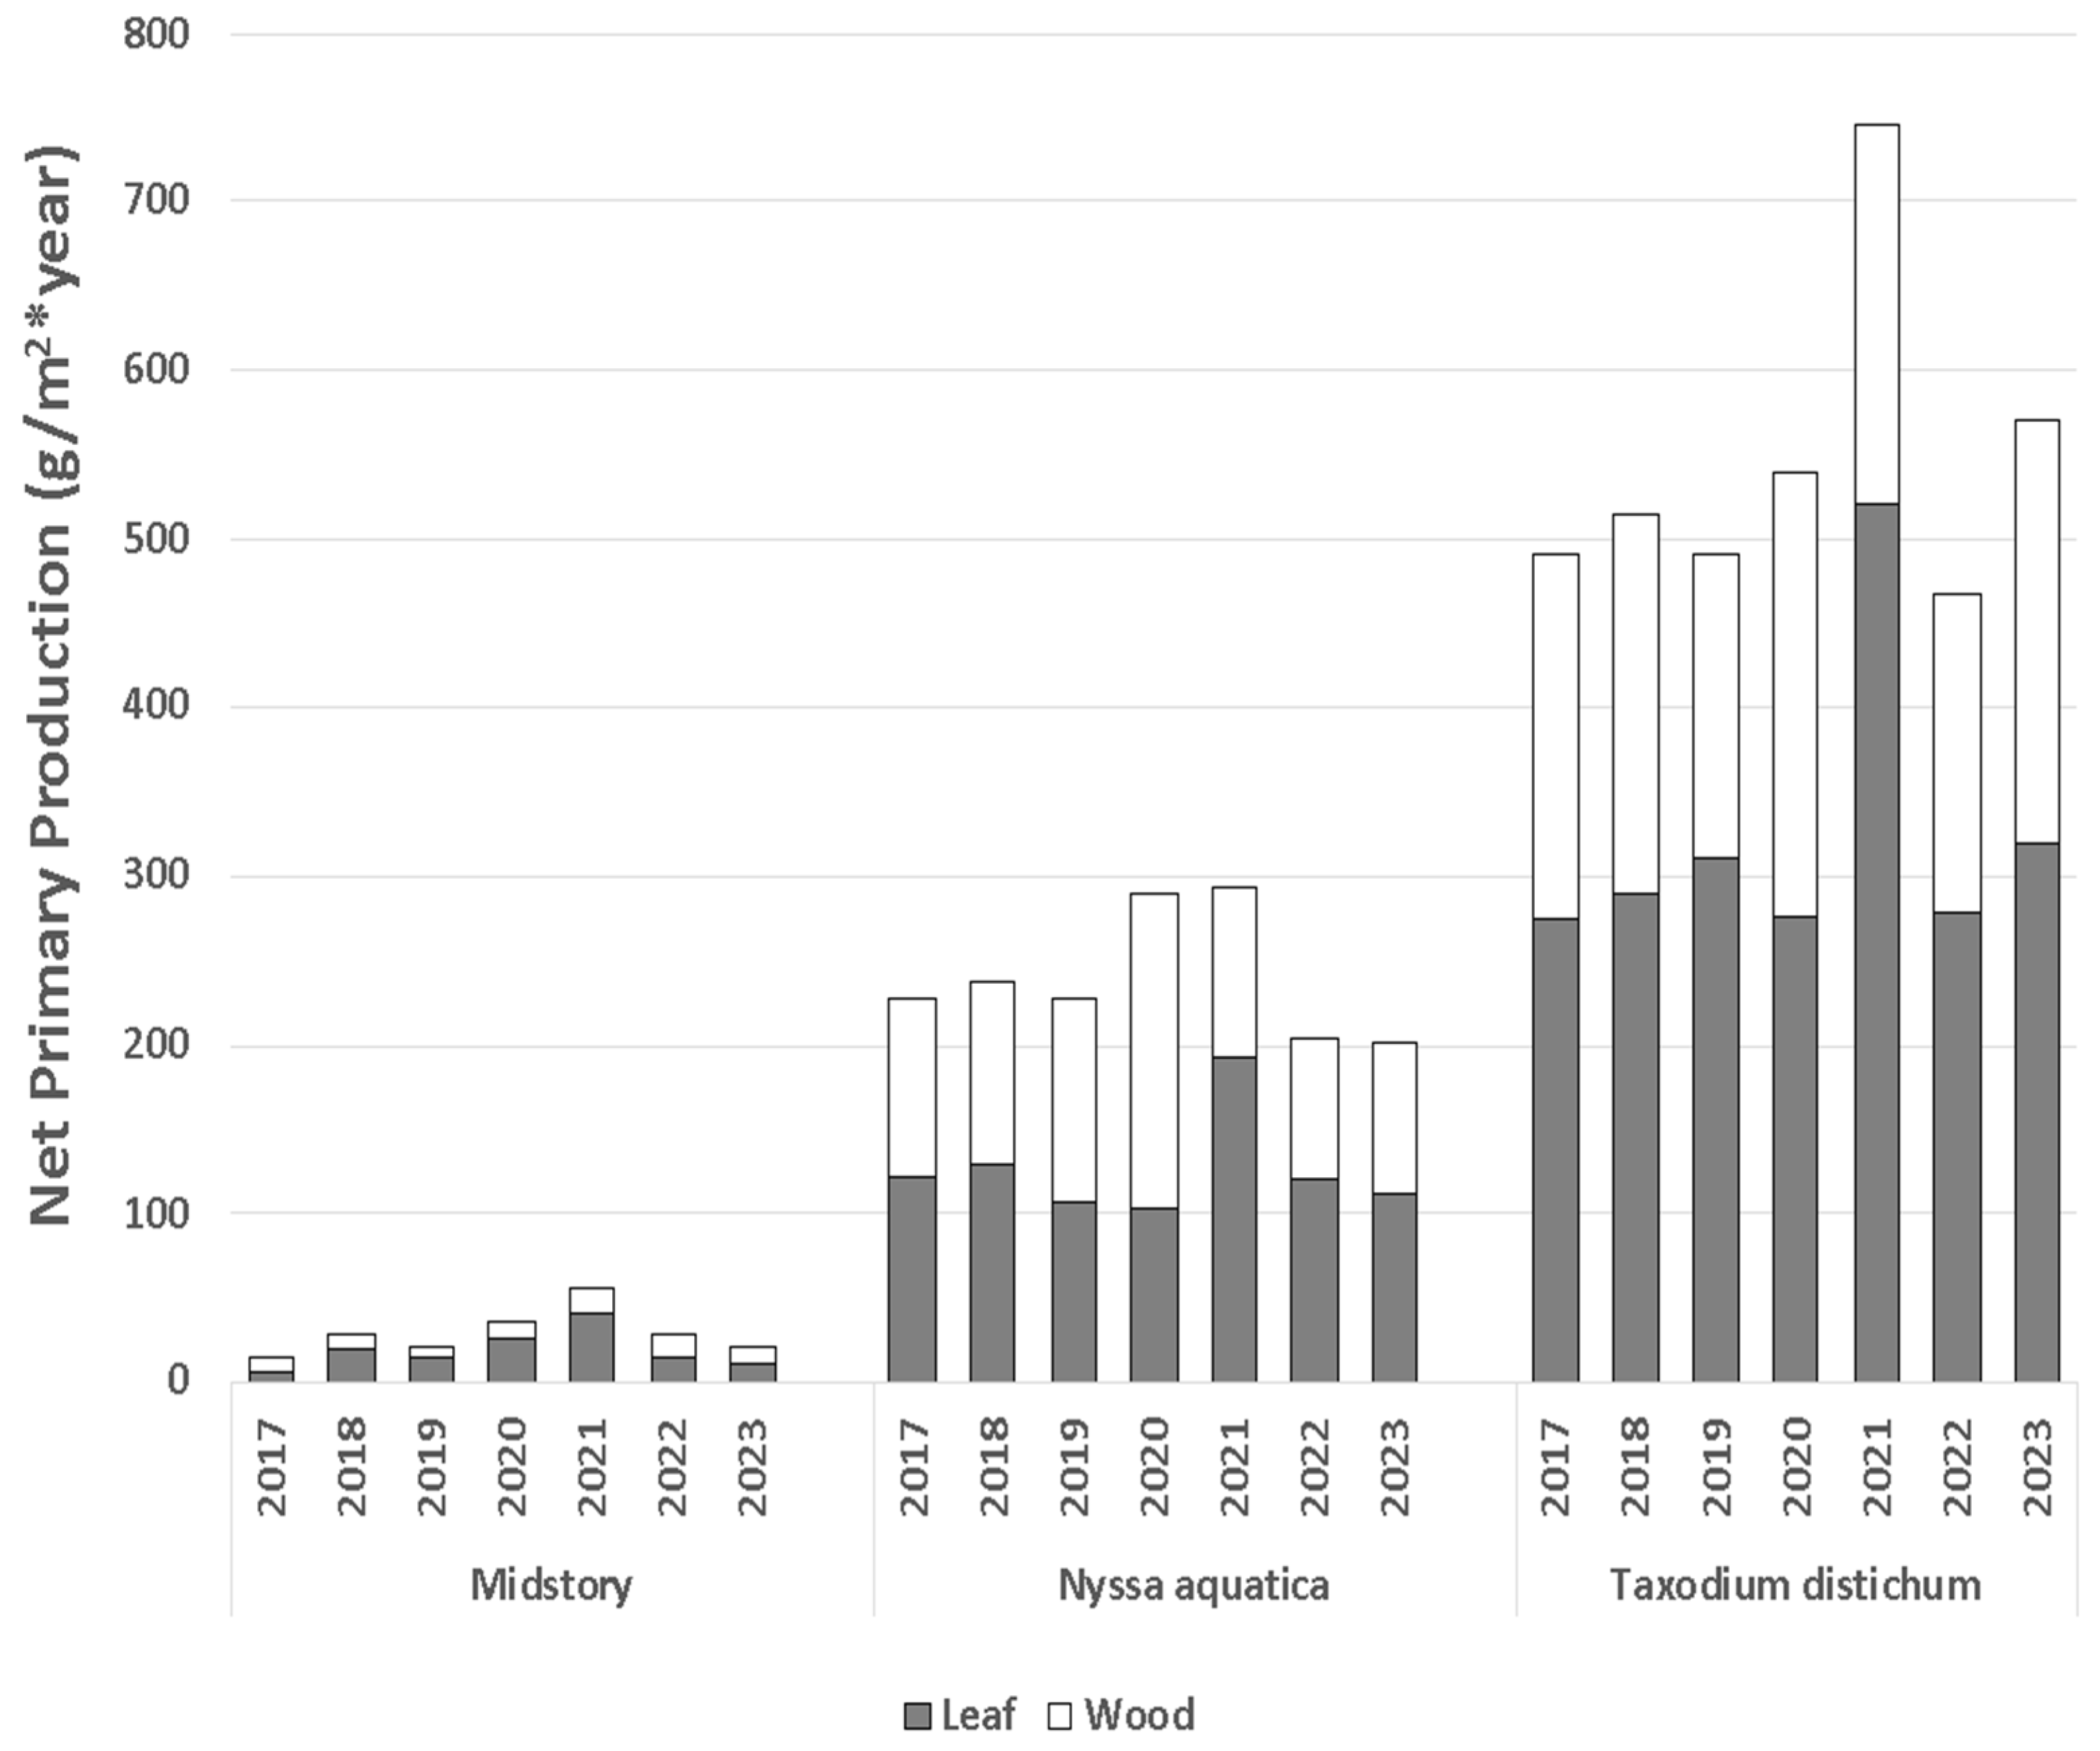
3.2.2. Wood Net Primary Production

Wood net primary production differed across sites (F7,313 = 16.63, p < 0.0001; Figure 7) and species (F2,313 = 395.16, p < 0.0001; Figure 8). According to Bonferroni-adjusted means, the greatest wood production was attributable to T. distichum, followed by N. aquatica, and the least were the midstory species. Importantly, the reference site had its highest wood production in 2017; this was not the case for any of the experimental sites in the study area (Figure 7), presumably influenced by the hydrologic restoration (i.e., increased sheet flow and drainage). During 2018, the majority of the sites were drained for about half of the growing season. Interestingly, the decreased wood productivity during 2019 compared to 2018 was primarily attributable to T. distichum (Figure 8), presumably because the sites experienced far greater levels of inundation in 2019. Several of the experimental sites experienced a burst of increased wood production in 2020, which was a normal rainfall year (see below). In 2023, the area experienced the driest year thus far, with some sites and species showing considerable variation compared to 2018, the second driest year (Figure 7 and Figure 8). When pooled together, the 2018–2023 years had significantly higher net production than the pre-project 2017 growing season (contrast F1,313 = 87.38, p < 0.0001). The three dominant species experienced variability in wood net primary production compared to 2017 (Figure 8).

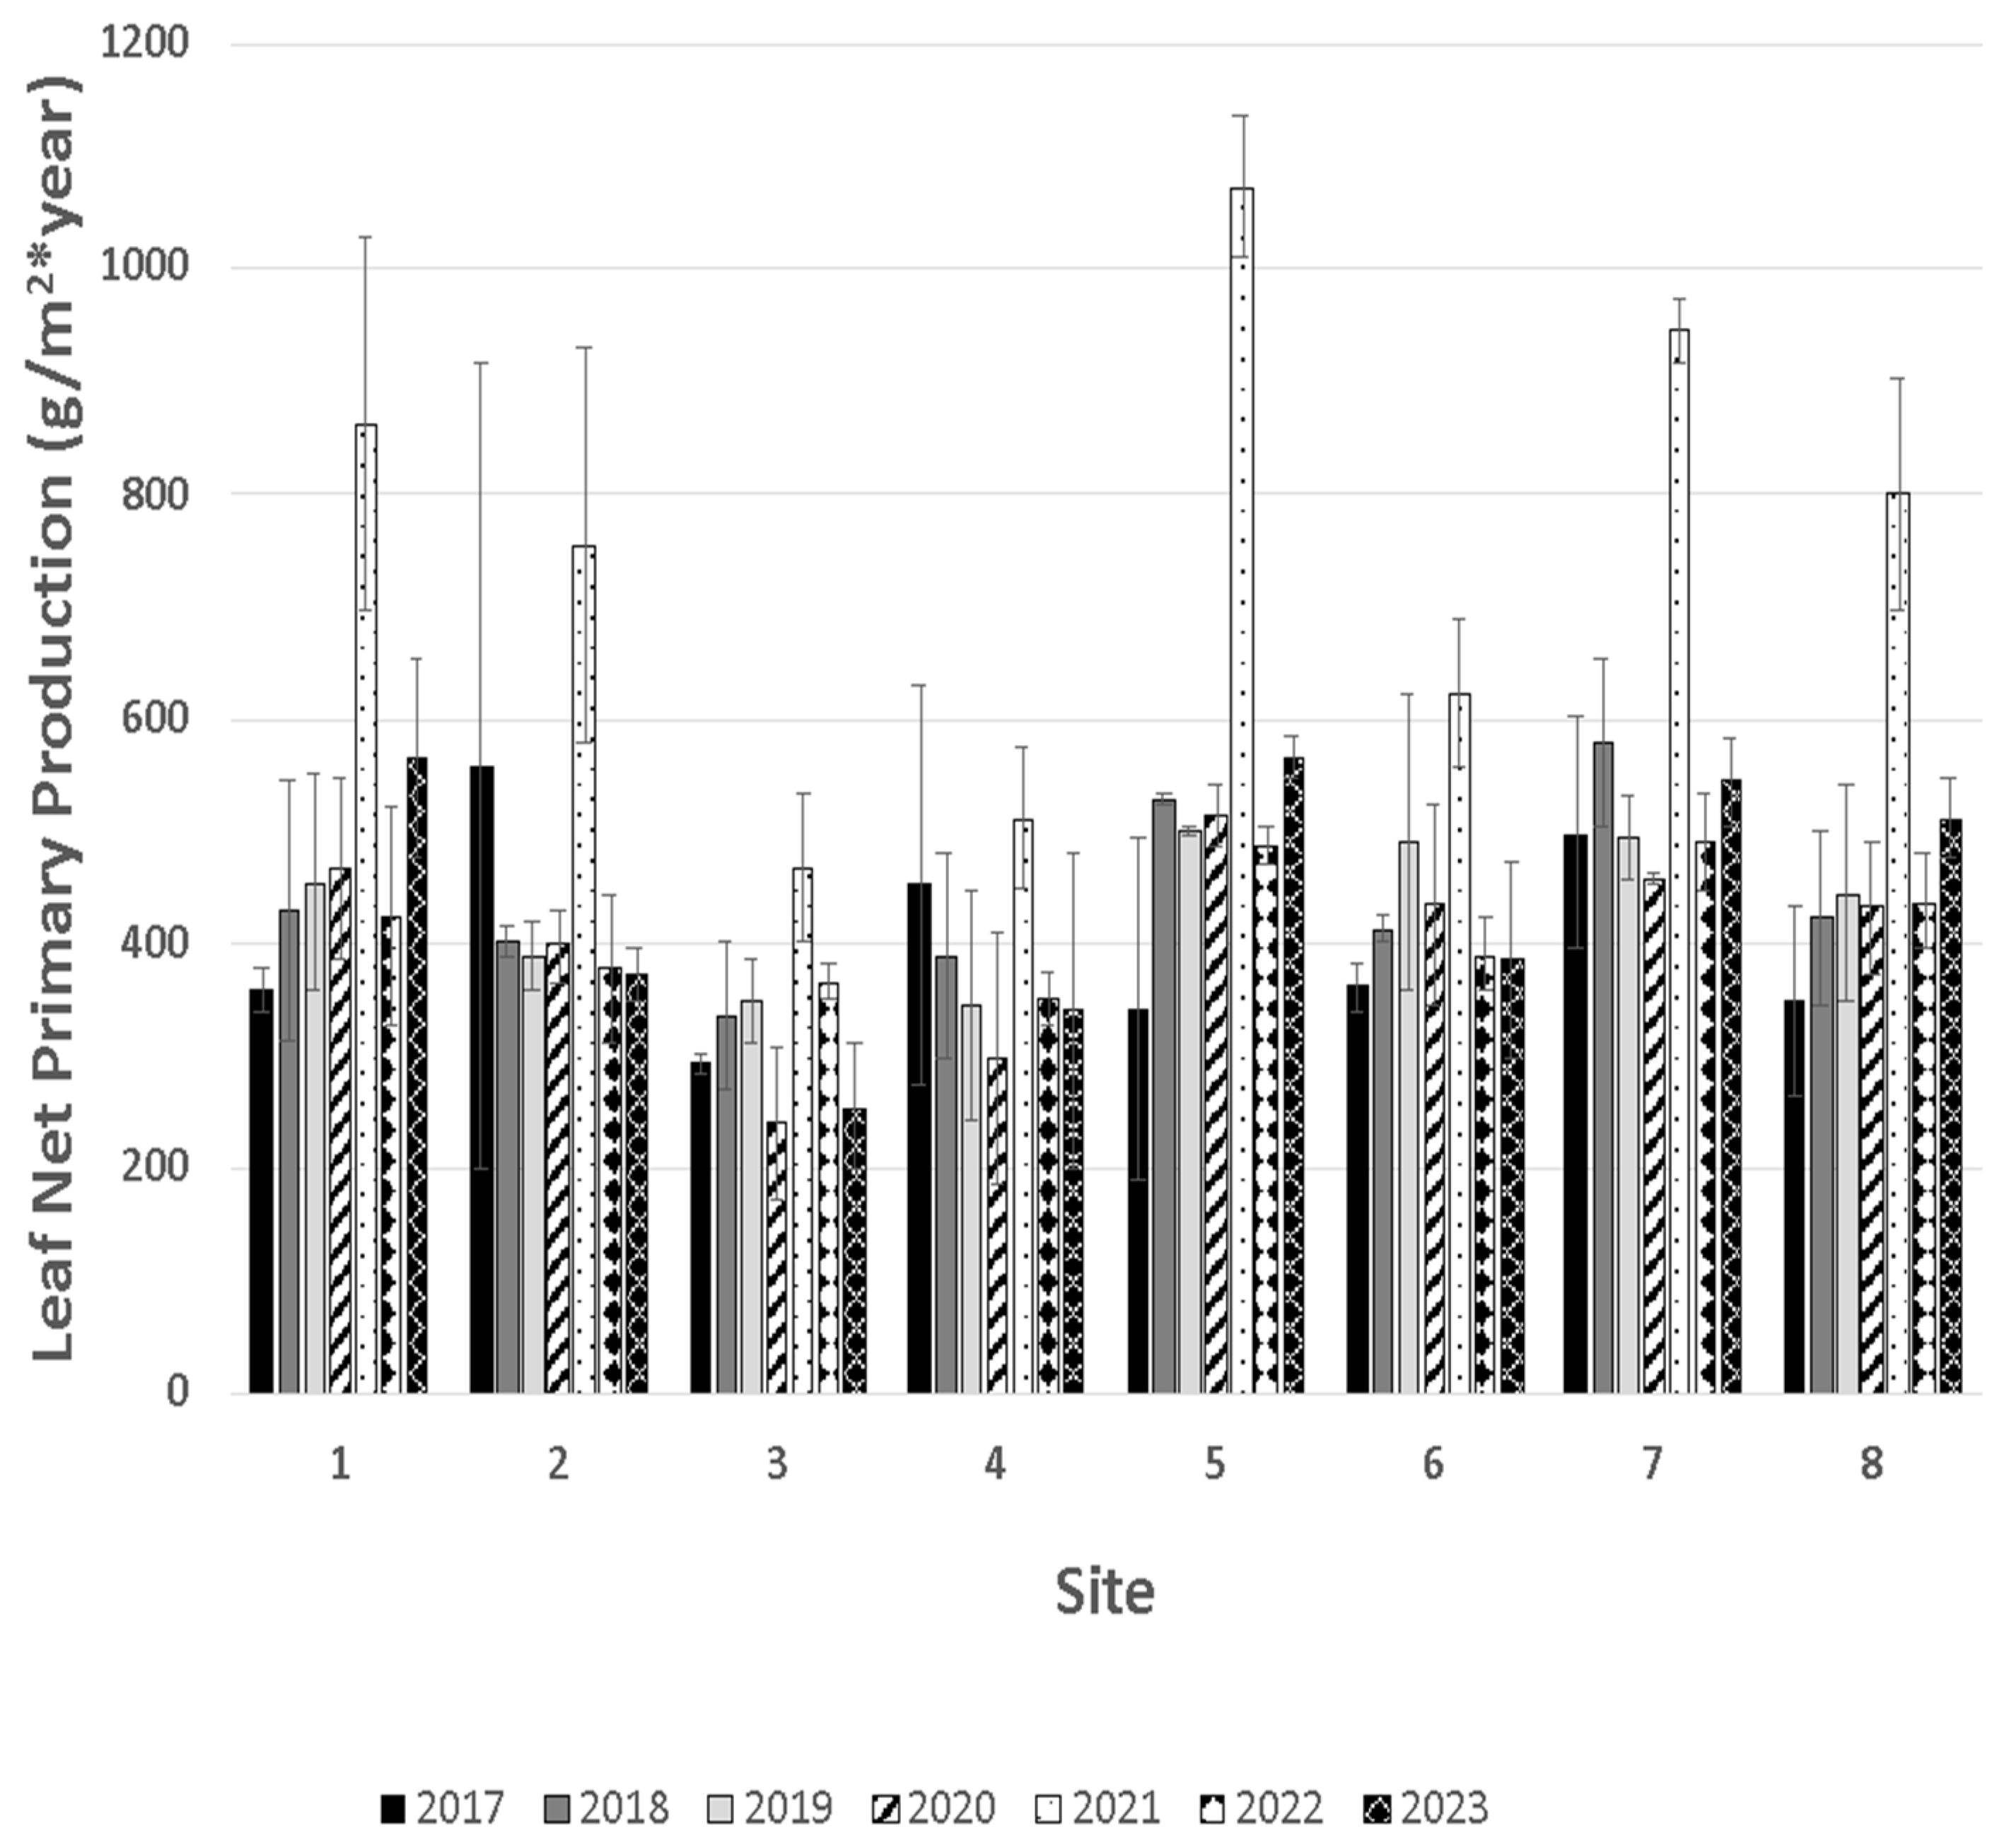
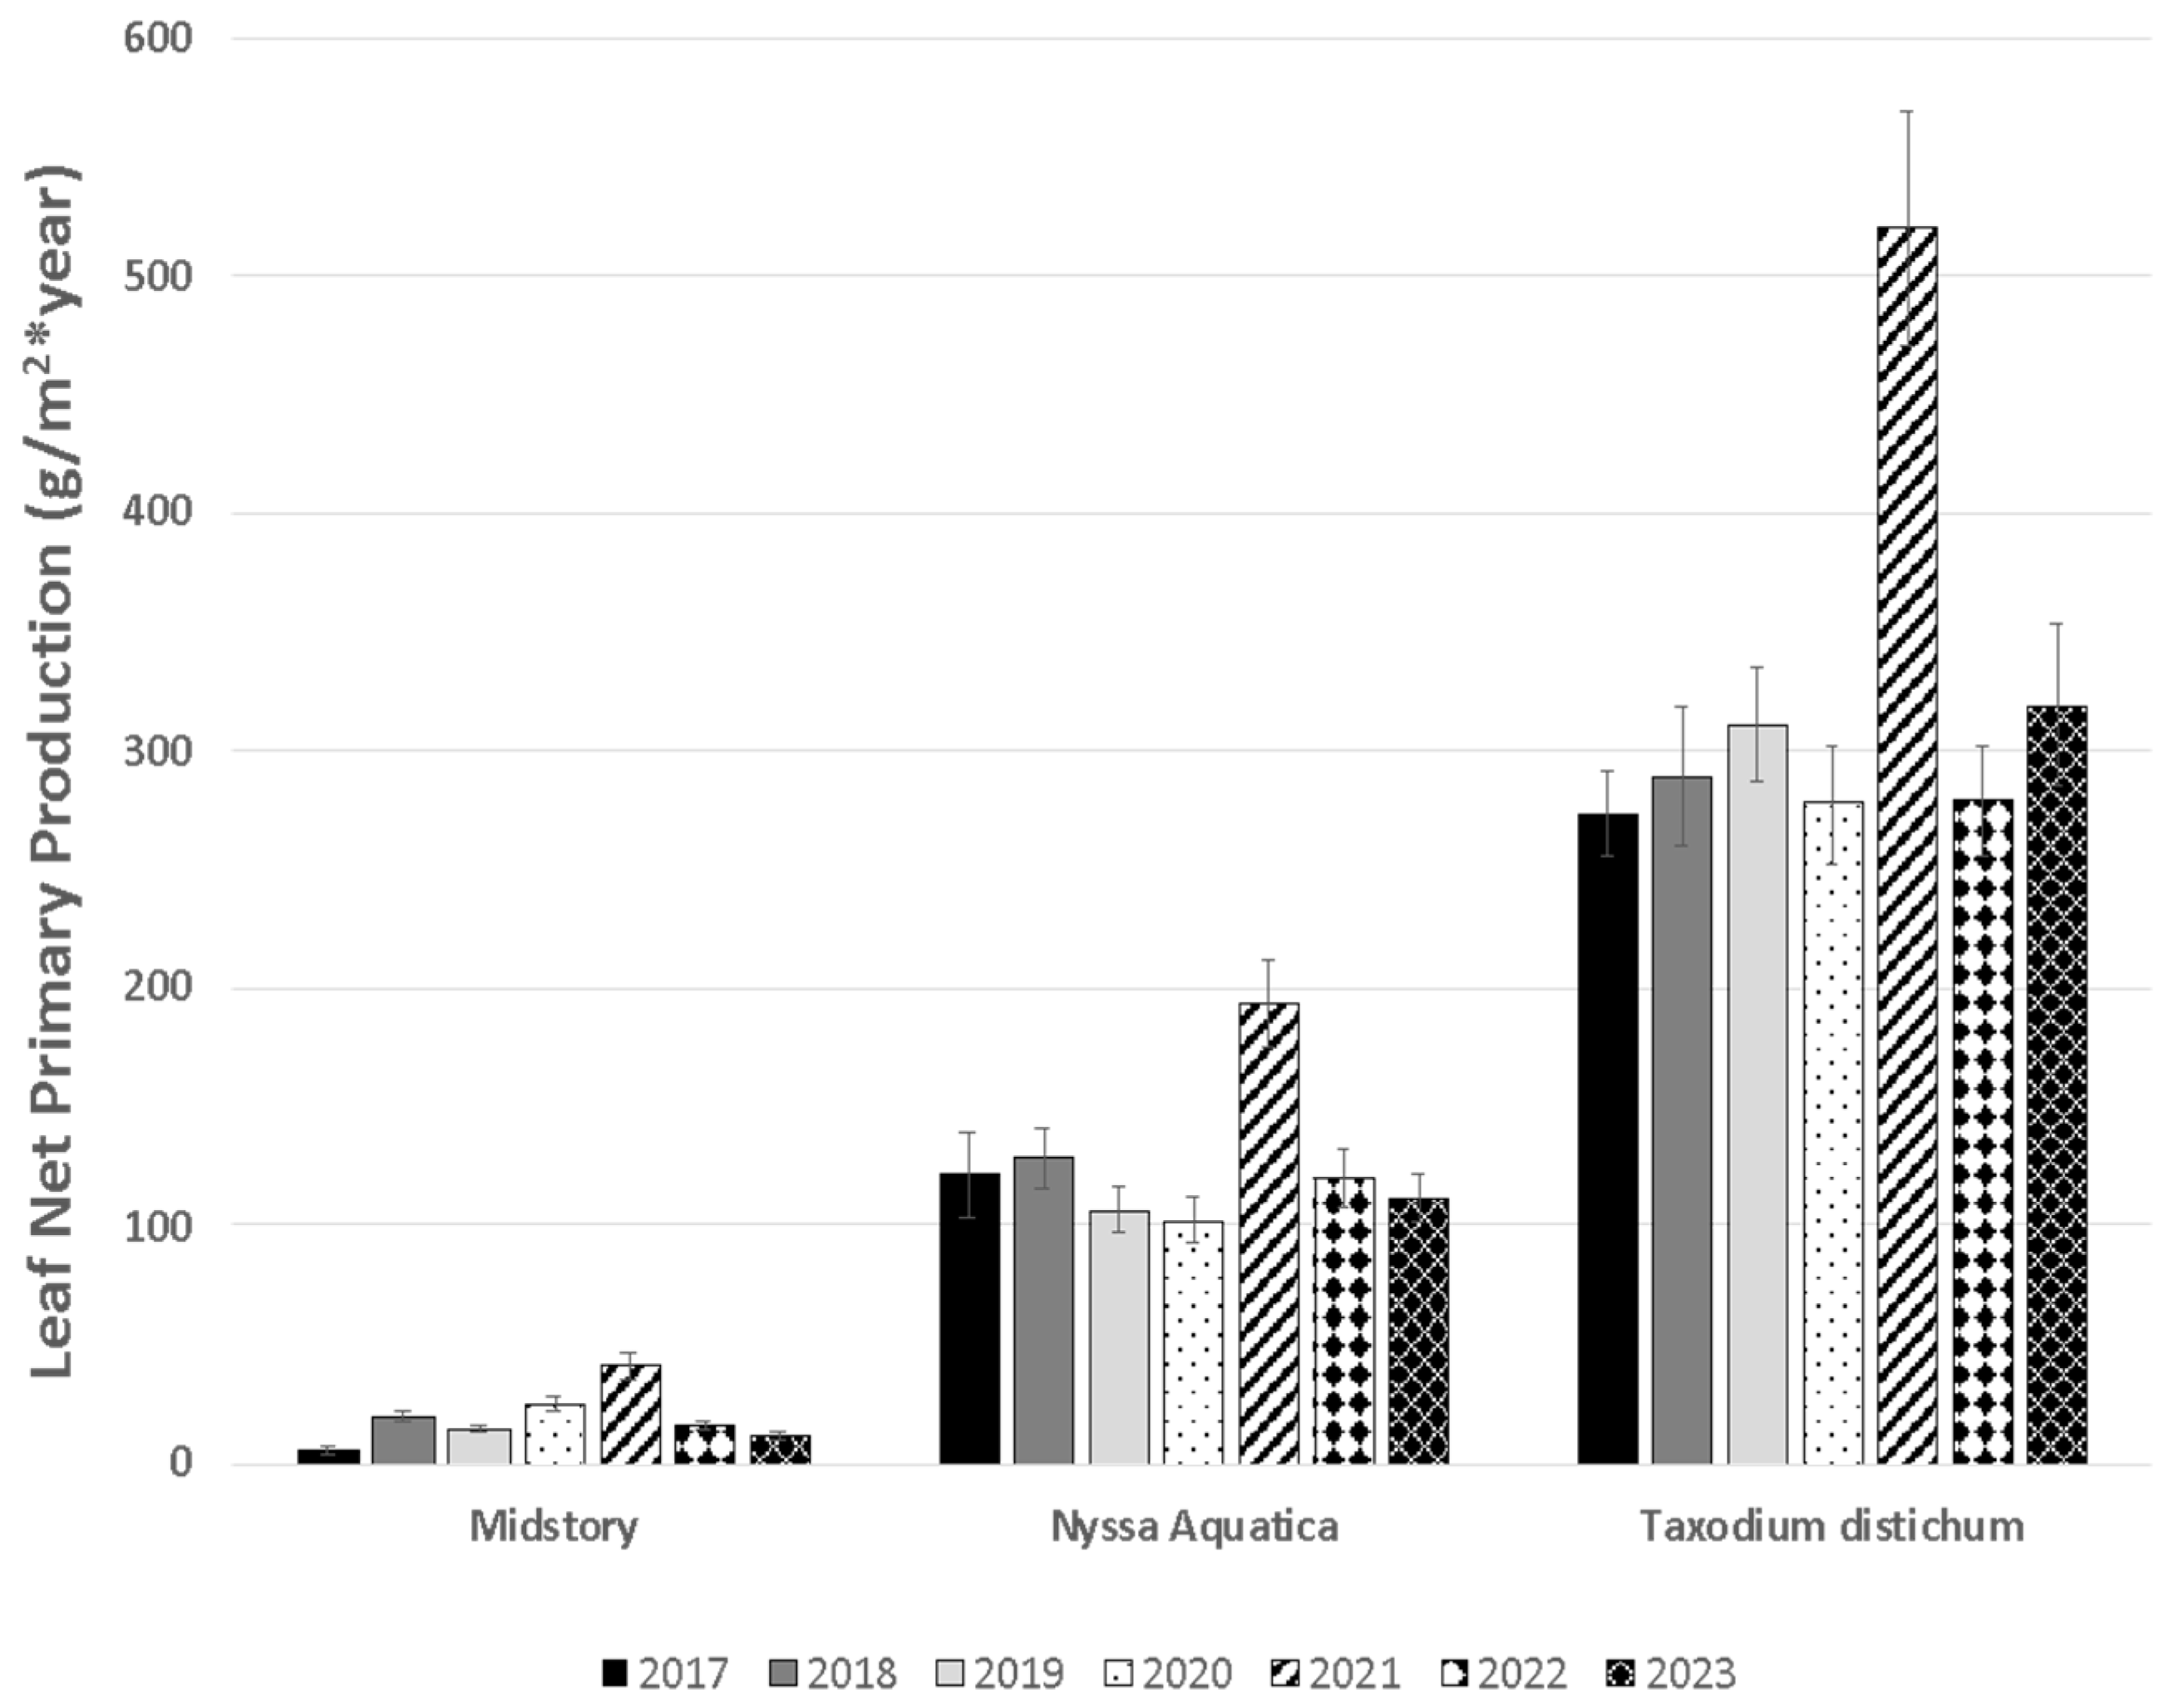
3.2.3. Leaf Net Primary Production

As opposed to Shaffer et al. (2021), leaf net primary production varied significantly across sites (F7,307 = 4.21, p < 0.0001) and varied greatly over the years (F6,307 = 10.65, p < 0.0001; Figure 9), which previously did not differ over the years. We believe litterfall was substantially reduced in our traps due to Hurricane Zeta in 2020, as some traps had oak litter from trees located over 200 m away. Interestingly, by far the greatest leaf litter production occurred in 2021, in part attributable to Hurricane Ida. Although very few interior forest trees experienced windthrow, nearly half of the branches were thrown, with nearly complete leaf loss. As a result, in the early fall, T. distichum had a second flush of leaves, resulting in nearly twice the leaf production than that of any other year. In general, litterfall is a less reliable dependent variable, compared to wood production, because of herbivory from the bald cypress leafroller (Archips goyerana) and the forest tent caterpillar (Malacosoma disstria) on T. distichum and N. aquatica, respectively [38]; at least two of the trips to collect leaf litter each year are subject to predation, resulting in the majority of leaves reduced to midribs.
In general, T. distichum produced the most leaf litter, followed by N. aquatica, with midstory species producing by far the least amount of litter (F2,307 = 334.05, p < 0.0001; Figure 10).

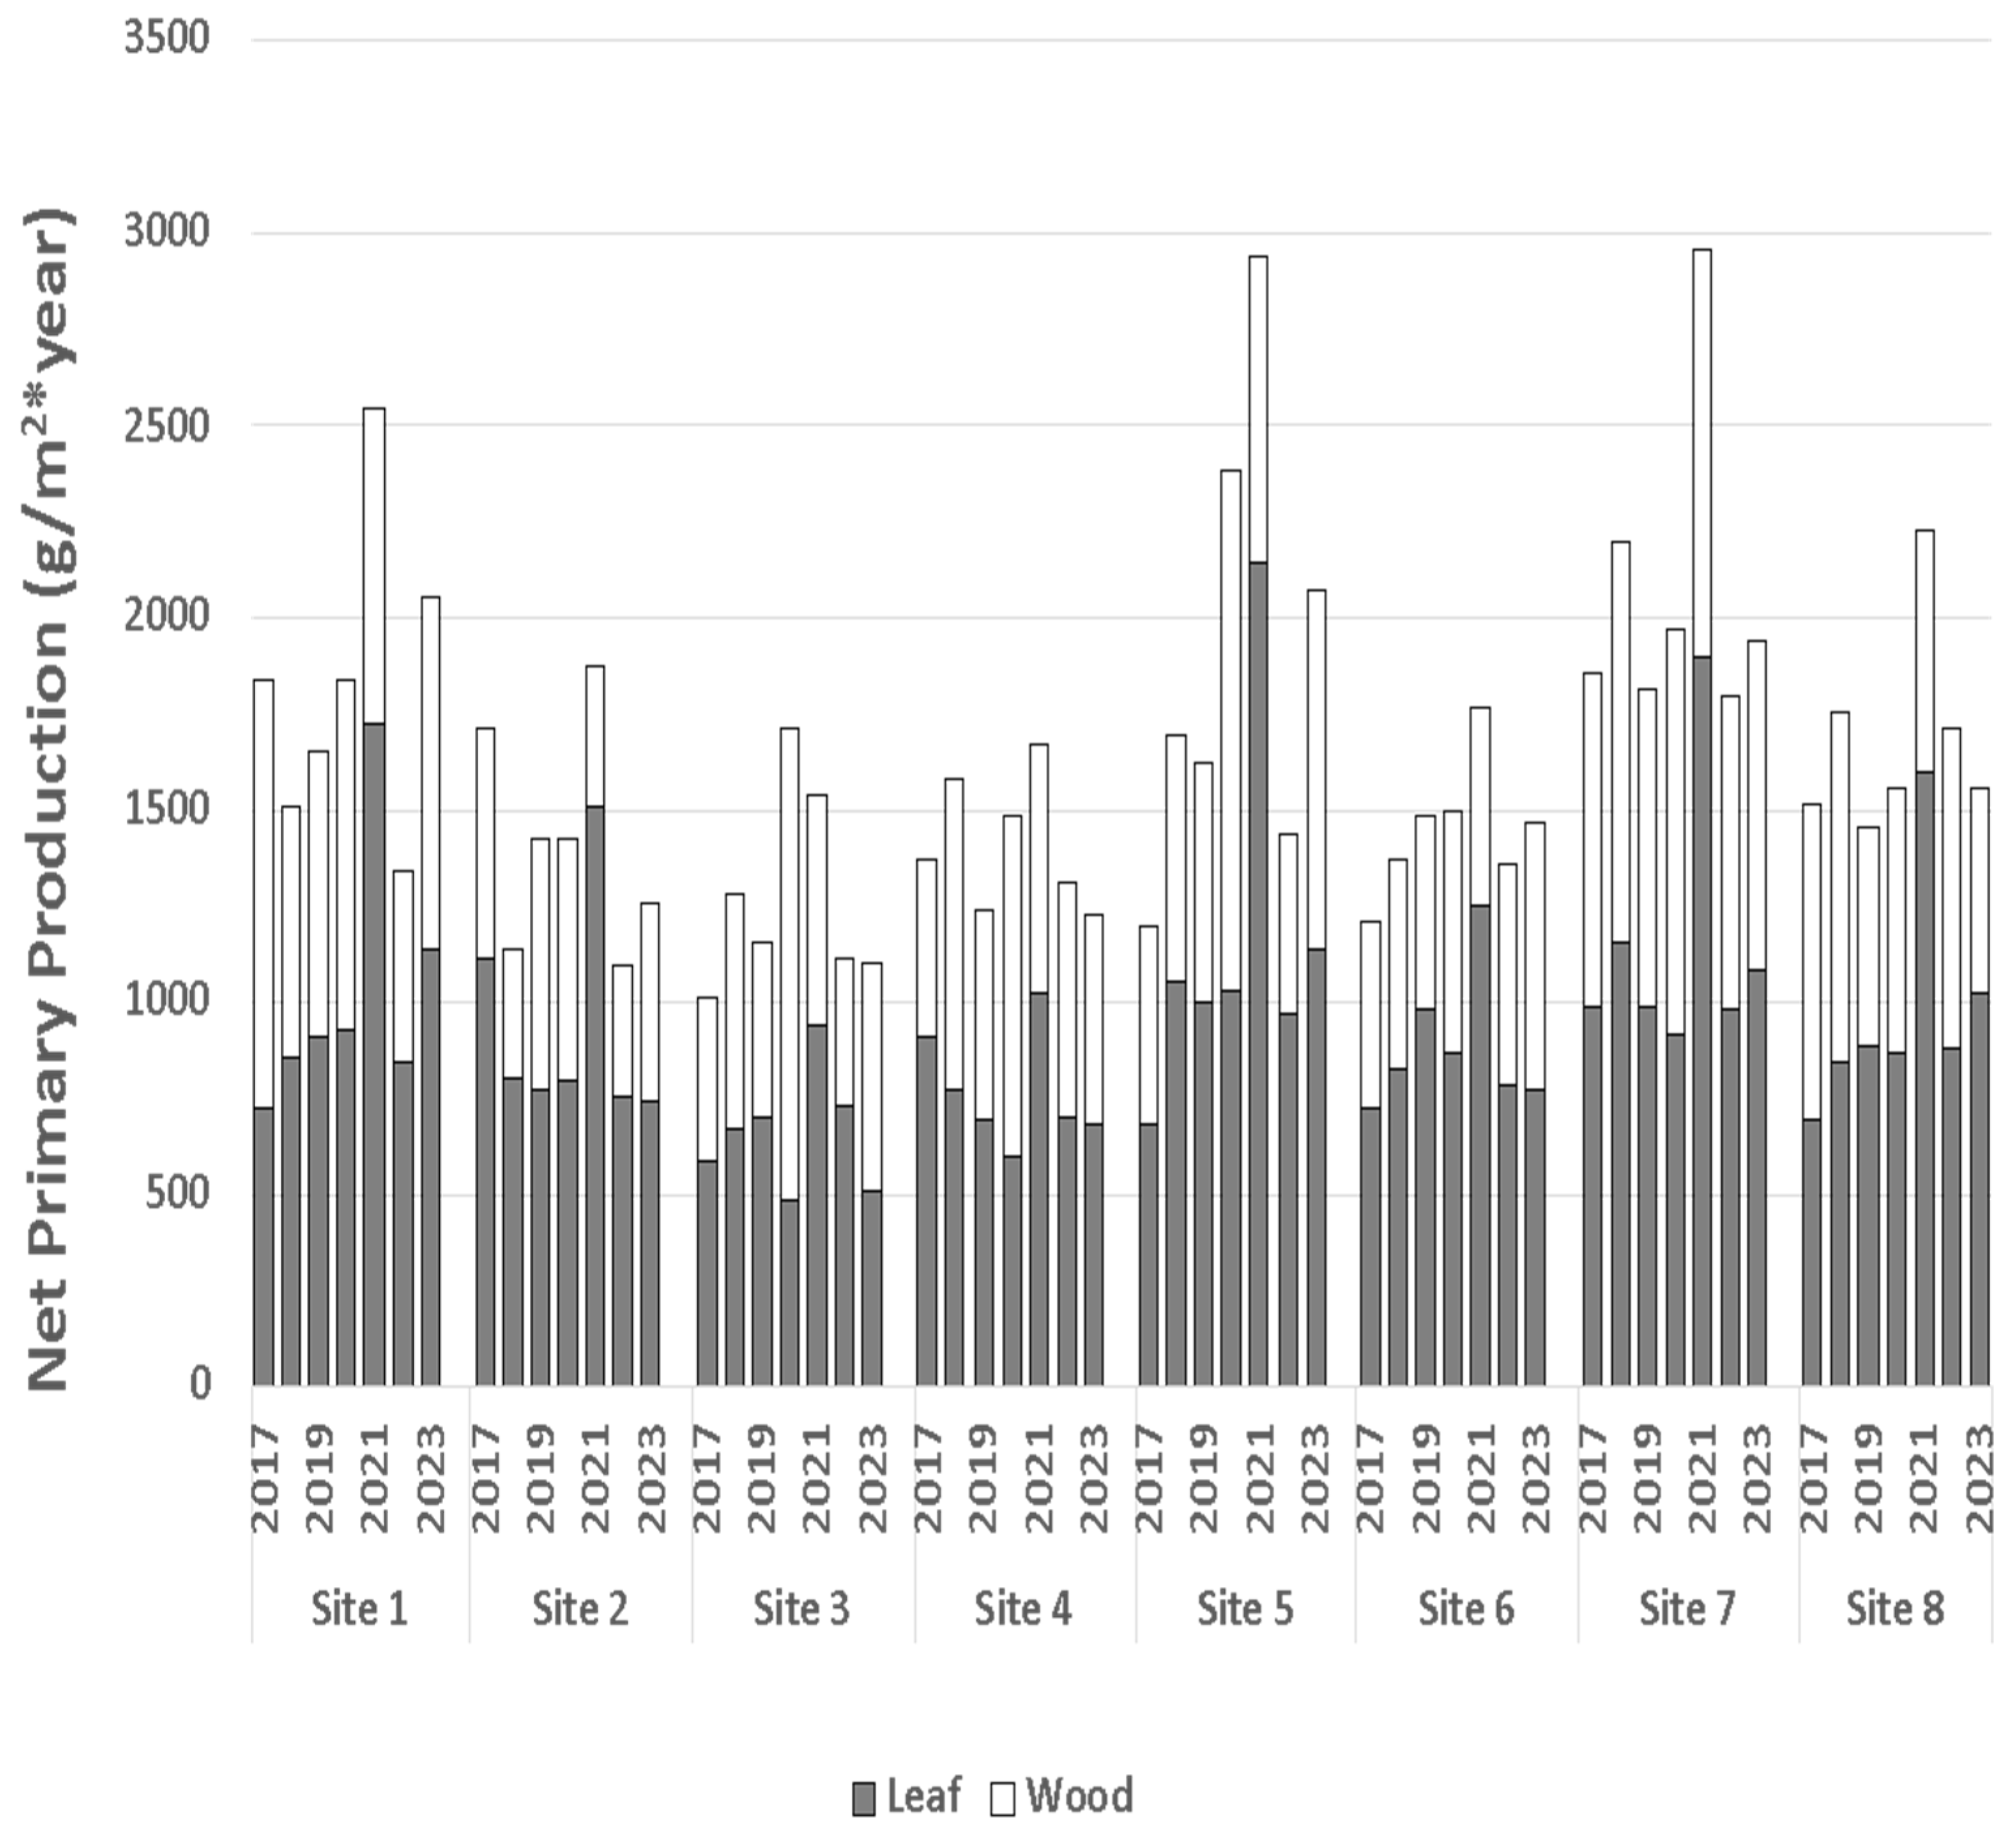
3.2.4. Total Aboveground Primary Production

Total net primary production was acquired as the sum of wood and leaf productivities [6,7]. Compared to 2017, several of the experimental sites have experienced an increase in total aboveground production (Figure 11) [13]. Since 2018, aboveground production has been measured to be as high to considerably higher than that measured in the Lac des Allemands swamp in the mid-1970s [13,31] and much greater than that measured in the 1980s [32]. The highest aboveground production in this study is considerably higher than that of the healthiest sites previously measured in the Maurepas swamp [6,7]. Within species type, the distribution between leaf and wood production was similar across years (Figure 12), with leaf production consistently exceeding wood production (F1,313 = 29.45, p < 0.0001). During 2021, total net primary production exceeded that of all other years (F1,313 = 47.87, p < 0.001). As described above, this increase was exclusively attributable to T. distichum (Figure 12) due to the production of a second flush of leaves that were produced after Hurricane Ida.

3.2.5. Herbaceous Cover

The Chief Scientist and one Field Scientist estimated the percent cover of herbaceous vegetation by species at all 64 herbaceous vegetation plots during fall of 2016 through 2023. The main trend is that herbaceous cover tends to decrease over time as the canopy cover increases (Figure 13A); this is a likely response due to the reduction of photosynthetically active radiation near the surface level as a result of additional shade caused by increased canopy cover [39,40]. Years 2017 and 2018 were identical along the X-axis (Figure 13A and Figure 14B, respectively), and both years had roughly average rainfall (Figure 15). During the pre-project years, the reference site (stations 1A and 1B) was dominated by Phanopyrum gymnocarpon (Figure 13B), but that species is no longer abundant, which shows how species composition can vary over time. In general, the Lac des Allemands project sites are dominated by Persicaria punctata and Alternanthera philoxeroides (Figure 13B). Overall, eleven herbaceous species are persistent (Figure 13B). The trajectory of herbaceous cover is clearly shown when the data are averaged for each year (Figure 14B). Note that pre-restoration year 2016 and post-restoration year 2021 were nearly equally flooded with very high water (X-axis for Figure 13 and Figure 14), but the water was stagnant during 2016 and experienced high throughput during 2021 (Y-axis for Figure 13 and Figure 14). By far, the driest year was 2023, followed by 2018.

3.3. Natural Regeneration

Variable amounts of natural regeneration have occurred during each of the post-gapping years. With suitable conditions, on average, several hundred seedlings germinate per hectare each year. The area now has T. distichum and N. aquatica saplings about 3 m tall and young-of-the-year seedlings only centimeters tall.
The main threats to the future sustainability of this now-recovering swamp are (1) an estimated eustatic sea-level rise of approximately 3.4 mm per year and (2) an average subsidence of 9 mm per year (±1 mm·y−1 S.E.) [19]. For a coastal restoration project to be effectively sustainable in Louisiana, it must incorporate sediment deposition, such as river diversions [28,33] and assimilation of wetlands [26,27].

3.4. Precipitation

Lower-than-average precipitation occurred in 2019 and more so in 2023 (Figure 15). Monthly averages for the year 2021 were over 7 inches (about 17.7 cm) of precipitation or about 2 inches (about 5 cm) greater than normal. Interestingly, total net production was highest during the wettest year of the study, but, as mentioned above, the increased NPP was attributable to a second flush of leaves by T. distichum, caused by Hurricane Ida. Alternatively, these data may indicate that the swamp may, at times, be too dry for optimal growth.

3.5. Stage

According to a nearby CRMS station, high-water events occurred during 2016, 2017, 2019, 2020, and especially 2021, while very low-water events occurred during 2018 and especially 2023 (Figure 16). Note that water levels during 2021 were notably higher than all other years, reflecting an average monthly rainfall of nearly 8 inches (about 20 cm; Figure 15). These stages depict what the most flooded sites in Lac des Allemands swamp experienced prior to gapping [5]. The difference is that the flooding prior to gapping was characterized by stagnant, nutrient-poor water, whereas sheet flow characterizes the post-project years [1,5,10,13].

4. Conclusions

This study, in accordance with Shaffer et al., 2021, aimed to express potential interest in spoil bank gapping by demonstrating a relatively cheap restoration alternative to improve the habitat of pre-existing bald cypress—water tupelo swamps. This was achieved by comparing growth rates and changes in herbaceous species composition and observing the enhanced hydrologic processes (i.e., most sites are relatively drained for a fair portion of the year, especially in low water years, as compared to the control site, Site 8). Basal area growth over the 7-year period varied between 5.93% and 14.39%, with an average of 8.31%, or just over 1% wood growth per year. Post-restoration basal areas indicate that all of our study areas are improving. Pooled together, the 2018–2023 years had significantly higher net production than the pre-project 2017 growing season. The distribution between leaf and wood production was remarkably similar within species types across years, with leaf production consistently exceeding wood production, particularly due to T. distichum. Canopy cover has increased by 20 percent since project construction, and as a result, herbaceous cover tends to decrease over time.

Author Contributions

The data were analyzed by G.P.S. and D.K. The manuscript was written by G.P.S., T.P. and D.K. N.S. provided help conceptualizing the project and communicating with all necessary parties. D.K. synthesized all of the figures. G.P.S., N.S. and T.P. provided support in the field and lab. All authors have read and agreed to the published version of the manuscript.

Funding

The restoration project, called Hydrologic Restoration and Vegetative Planting in the Lac des Allemands Swamp (BA-34-2), was funded by the Coastal Wetlands Planning, Protection and Restoration Act (CWPPRA).

Data Availability Statement

The herbaceous and forest data collected during this effort is stored in the coastal information management system database (CIMS) and can be accessed from the link (https://cims.coastal.louisiana.gov/monitoring-data/, accessed on 15 December 2024).

Acknowledgments

This monitoring study is federally sponsored by the Environmental Protection Agency (EPA) and state-sponsored by the Coastal Protection and Restoration Authority (CPRA, Louisiana). We thank Patricia Williams and Ken Teague of EPA and Jody Chenier and Shane Landry of St. James Parish for their persistence in establishing funding for this restoration project. We thank Glen Curole and Josh Sylvest of CPRA and Tim Carruthers and Garvin Pitmann of The Water Institute for their monthly assistance with this project (BA-34-2 T102). Finally, we are grateful for the countless undergraduate and graduate students who helped us collect field data.

Conflicts of Interest

The authors declare no conflicts of interest.

References

  1. Day, J.W.; Shaffer, G.P.; Cahoon, D.R.; DeLaune, R.D. Canals, backfilling and wetland loss in the Mississippi Delta. Estuarine, Coast. Shelf Sci. 2019, 227, 106325. [Google Scholar] [CrossRef]
  2. Turner, R.E.; McClenachan, G. Reversing wetland death from 35,000 cuts: Opportunities to restore Louisiana’s dredged canals. PLoS ONE 2018, 13, e0207717. [Google Scholar] [CrossRef] [PubMed]
  3. Turner, R.E.; Swenson, E.M. The Life and Death and Consequences of Canals and Spoil Banks in Salt Marshes. Wetlands 2020, 40, 1957–1965. [Google Scholar] [CrossRef]
  4. Mitsch, W.; Gosselink, J. Wetlands, 5th ed.; John Wiley and Sons: New York, NY, USA, 2015. [Google Scholar]
  5. Day, J.W.; Conner, W.H.; DeLaune, R.D.; Hopkinson, C.S.; Hunter, R.G.; Shaffer, G.P.; Kandalepas, D.; Keim, R.F.; Kemp, G.P.; Lane, R.R.; et al. A review of 50 years of study of hydrology, wetland dynamics, aquatic metabolism, water quality and trophic status, and nutrient biogeochemistry in the Barataria Basin, Mississippi River Delta-System functioning, human impacts and restoration approaches. Water 2021, 13, 642. [Google Scholar] [CrossRef]
  6. Shaffer, G.P.; Wood, W.B.; Hoeppner, S.S.; Perkins, T.E.; Zoller, J.A.; Kandalepas, D. Degradation of baldcypress-water tupelo swamps to marsh and open water in southeastern Louisiana, U.S.A.: An irreversible trajectory? J. Coast. Res. 2009, 54, 152–165. [Google Scholar] [CrossRef]
  7. Shaffer, G.P.; Day, J.W.; Kandalepas, D.; Wood, W.B.; Hunter, R.G.; Lane, R.R.; Hillmann, E.R. Decline of the Maurepas Swamp, Pontchartrain Basin, Louisiana, and approaches to restoration. Water 2016, 8, 101. [Google Scholar] [CrossRef]
  8. Day, J.W.; Shaffer, G.P.; Britsch, D.; Reed, D.; Hawes, S.; Cahoon, D. Pattern and process of land loss in the Louisiana coastal zone: An analysis of spatial and temporal patterns of wetland habitat change. Estuaries 2000, 23, 425–438. [Google Scholar] [CrossRef]
  9. Day, J.W.; Hunter, R.G.; Keim, R.; Delaune, R.; Shaffer, G.P.; Evers, E.; Reed, D.; Brantley, C.G.; Kemp, G.P.; Day, J.; et al. Ecological response of forested wetlands with and without large-scale Mississippi River input: Implications for management. Ecol. Eng. 2012, 46, 57–67. [Google Scholar] [CrossRef]
  10. CPRA (Coastal Protection and Restoration Authority of Louisiana). Project Completion Report for Hydrologic Restoration and Vegetative Plantings in the Des Allemands Swamp (BA-34-2); CPRA: Baton Rouge, LA, USA, 2018. Available online: https://www.lacoast.gov/reports/project/BA-34-2_Project_Completion_Report_Final_10_2018.pdf (accessed on 15 December 2024).
  11. CPRA (Coastal Protection and Restoration Authority of Louisiana). Fiscal Year 2025 Annual Plan: Integrated Ecosystem Restoration and Hurricane Protection in Coastal Louisiana; CPRA: Baton Rouge, LA, USA, 2024. Available online: https://coastal.la.gov/wp-content/uploads/2024/02/FINAL-CPRA_FY25-AP_20240228_print-compressed.pdf (accessed on 15 December 2024).
  12. Coast 2050: Toward a Sustainable Louisiana: Louisiana Coastal Wetlands Conservation and Restoration Task Force; Louisiana Department of Natural Resources: Baton Rouge, LA, USA, 1998; 161p.
  13. Shaffer, G.P.; Kandalepas, D.; Stevens, N.; Crocket, T.; Curole, G. Hydrologic restoration of the Lac des Allemands swamp, Barataria, Louisiana. Forests 2021, 12, 1074–1088. [Google Scholar] [CrossRef]
  14. CPRA (Coastal Protection and Restoration Authority of Louisiana). Louisiana’s Comprehensive Master Plan for a Sustainable Coast-2017 Draft Plan Release; CPRA: Baton Rouge, LA, USA, 2017; 169p. [Google Scholar]
  15. Hoover, C.M.; Smith, J.E. Current aboveground live tree carbon stocks and annual net change in forests of conterminous United States. Carbon Balance Manag. 2021, 16, 17. [Google Scholar] [CrossRef]
  16. Conner, W.H.; Day, J.W. Productivity and composition of a baldcypress-water tupelo swamp site and a bottomland hardwood site in a Louisiana swamp. Am. J. Bot. 1976, 63, 1354–1364. [Google Scholar]
  17. Conner, W.H.; Gosselink, J.G.; Parrondo, R.T. Comparison of the vegetation of three Louisiana swamp sites with different flooding regimes. Am. J. Bot. 1981, 68, 320–331. [Google Scholar] [CrossRef]
  18. Conner, W.H.; Day, J.W. Water level variability and litterfall productivity of forested freshwater wetlands in Louisiana. Am. Midl. Nat. 1992, 128, 237–245. [Google Scholar] [CrossRef]
  19. Conner, W.H.; Day, J.W. Rising water levels in Louisiana: Implications for two coastal forested wetland areas in Louisiana. J. Coast. Res. 1988, 4, 589–596. [Google Scholar]
  20. DuBarry, A.P. Germination of bottomland tree seed while immersed in water. J. For. 1963, 61, 225–226. [Google Scholar]
  21. Harms, W.R. Some effects of soil type and water regime on growth of water tupelo seedlings. Ecology 1973, 54, 188–193. [Google Scholar] [CrossRef]
  22. Jafari, N.H.; Harris, B.D.; Day, J.W.; Sasser, C.E.; Kemp, G.P.; Lane, R.R.; Wigand, C.; Holme, G.O.; Freeman, A.; Sharp, L.A.; et al. Wetland soil strength with emphasis on the impact of nutrients and sediments. Estuar. Coast. Shelf Sci. 2019, 229, 106394. [Google Scholar] [CrossRef]
  23. Krauss, K.W.; Noe, G.B.; Duberstein, J.A.; Conner, W.H.; Stagg, C.L.; Cormier, N.; Jones, M.C.; Bernhardt, C.E.; Graeme Lockaby, B.; From, A.S.; et al. The role of the upper tidal estuary in wetland blue carbon storage and flux. Glob. Biogeochem. Cycles 2018, 32, 817–839. [Google Scholar] [CrossRef]
  24. Myers, R.S.; Shaffer, G.P.; Llewellyn, D.W. Baldcypress (Taxodium distichum (L.) Rich.) restoration in southeast Louisiana: Relative effects of herbivory, flooding, competition and macronutrients. Wetlands 1995, 15, 141–148. [Google Scholar] [CrossRef]
  25. Southern, R.F.; Shaffer, G.P. The effects of submergence and light on two age classes of baldcypress (Taxodium distichum (L.) Rich.) seedlings. Wetlands 2000, 20, 697–706. [Google Scholar] [CrossRef]
  26. Shaffer, G.P.; Day, J.W.; Hunter, R.G.; Lane, R.R.; Lundberg, C.J.; Wood, W.B.; Hillmann, E.R.; Day, J.N.; Stricklan, E.; Kandalepas, D. System response, nutria herbivory, and vegetation recovery of an assimilation wetland in coastal Louisiana. Ecol. Eng. 2015, 79, 120–131. [Google Scholar] [CrossRef]
  27. Hunter, R.G.; Day, J.W.; Lane, R.R.; Shaffer, G.P.; Day, J.N.; Conner, W.H.; Rybczyk, J.M.; Mistich, J.A.; Ko, J.Y. Using natural wetlands for municipal effluent assimilation: A half century of experience for the Mississippi River Delta and surrounding environs. In Multifunctional Wetlands: Pollution Abatement and Other Ecological Services from Natural and Constructed Wetlands; Nagabhatla, N.N., Metcalfe, C.D., Eds.; Springer: Basel, Switzerland, 2018; pp. 15–81. [Google Scholar]
  28. Rutherford, J.S.; Day, J.W.; D’Eia, C.F.; Wiegman, A.R.H.; Wilson, C.S.; Caffey, R.H.; Shaffer, G.P.; Lane, R.R.; Batker, D. Evaluating trade-offs of a large infrequent sediment diversion for restoration of a forested wetland in the Mississippi Delta. Coast. Shelf Sci. 2018, 202, 80–89. [Google Scholar] [CrossRef]
  29. Megonigal, J.P.; Conner, W.H.; Kroeger, S.; Sharitz, R.R. Aboveground Production in Southeastern Floodplain Forests: A Test of the Subsidy-Stress Hypothesis. Ecology 1997, 78, 370–384. [Google Scholar] [CrossRef]
  30. Megonigal, J.P.; Day, F.P. Organic matter dynamics in four seasonally flooded forest communities of the Great Dismal Swamp. Am. J. Bot. 1988, 75, 1334–1343. [Google Scholar] [CrossRef]
  31. Delaune, R.D.; Buresh, R.J.; Patrick, W.H., Jr. Relationship of soil properties to standing crop biomass of Spartina alterniflora in a Louisiana marsh. Estuar. Coast. Mar. Sci. 1979, 8, 477–487. [Google Scholar] [CrossRef]
  32. Hatton, R.S. Aspects of Marsh Accretion and Geochemistry: Barataria Basin, Louisiana. Master’s Thesis, Louisiana State University, Baton Rouge, LA, USA, 1981; 116p. [Google Scholar]
  33. Vorster, A.G.; Evangelista, P.H.; Stovall, A.E.L.; Ex, S. Variability and uncertainty in forest biomass estimates from the tree to landscape scale: The role of allometric equations. Carbon Balance Manag. 2020, 15, 8. [Google Scholar] [CrossRef]
  34. Messina, M.G.; Conner, W.H. (Eds.) Southern Forested Wetlands: Ecology and Management; Lewis Publishers: New York, NY, USA, 1998; 640p. [Google Scholar]
  35. Jenkins, J.C.; Chojnacky, D.C.; Heath, L.S.; Birdsey, R.A. National-scale biomass estimators for United States tree species. For. Sci. 2003, 49, 12–35. [Google Scholar] [CrossRef]
  36. Rozendaal, D.M.A.; Suarez, D.R.; Sy, V.D.; Avitabile, V.; Carter, S.; Yao, C.Y.A.; Alvarez-Davila, E.; Anderson-Teixeira, K.; Araujo-Murakami, A.; Arroyo, L.; et al. Aboveground forest biomass varies across continents, ecological zones and successional stages: Refined IPCC default values for tropical and subtropical forests. Environ. Res. Lett. 2022, 17, 014047. [Google Scholar] [CrossRef]
  37. Ricker, M.C.; Blosser, G.D.; Conner, W.H.; Lockaby, B.G. Wood Biomass and Carbon Pools within a Floodplain Forest of the Congaree River, South Carolina, USA. Wetlands 2019, 39, 1003–1013. [Google Scholar] [CrossRef]
  38. Souther-Effler, R.F. Interactions of Insect Herbivory and Multiple Abiotic Stress Agents on Two Wetland Tree Species in Southeast Louisiana Swamps. Doctoral Dissertations, Louisiana State University and Agricultural & Mechanical College, Baton Rouge, LA, USA, 2004. Available online: https://repository.lsu.edu/gradschool_dissertations/50 (accessed on 15 December 2024).
  39. Wallace, K.J.; Laughlin, D.C.; Clarkson, B.D.; Schipper, L.A. Forest canopy restoration has indirect effects on litter decomposition and no effect on denitrification. Ecosphere 2018, 9, e02534. [Google Scholar] [CrossRef]
  40. Dormann, C.F.; Bagnara, M.; Boch, S.; Hinderling, J.; Janeiro-Otero, A.; Schäfer, D.; Schall, P.; Hartig, F. Plant species richness increases with light availability, but not variability, in temperate forests understory. BMC Ecol. 2020, 20, 43. [Google Scholar] [CrossRef] [PubMed]
Figure 1. Aerial map showing the location of the sixteen 625 m2 stations (eight sites) established in 2016 from the Lac des Allemands swamp restoration project. Locations of the eight gaps are also shown. Figure is from Shaffer et al., 2021.
Forests 16 00099 g001
Figure 2. Aerial map showing the location of the study site. Figure is from CPRA [10].
Forests 16 00099 g002
Figure 3. Overall basal area for Sites 1–8 (m2·ha−1 ± S.E.), with replicated stations, for the three dominant tree species, A. rubrum var. drummondii, N. aquatica, and T. distichum in 2017 (dark gray), and 2023 (light gray). Figure is updated from Shaffer et al., 2021.
Forests 16 00099 g003
Figure 4. Overall stem density for Stations A (dark gray) and B (light gray) at Sites 1–8 (Figure 1) in 2023. Figure is updated from Shaffer et al., 2021.
Forests 16 00099 g004
Figure 5. Stem density for the dominant midstory species A. rubrum var. drummondii (dark gray) and the two dominant canopy species N. aquatica (medium gray) and T. distichum (light gray) at Sites 1–8, with replicated stations pooled, in 2023. Figure is updated from Shaffer et al., 2021.
Forests 16 00099 g005
Figure 6. Percent canopy closure (mean ± S.E.) for 2016–2023. Bars that share letters are not statistically different according to a contrast of 2016 + 2017 vs. post-project years (F1,335 = 259.28, p < 0.0001). This figure is updated from Shaffer et al., 2021.
Forests 16 00099 g006
Figure 7. Net wood primary production (mean ± S.E.) for Sites 1–8 during 2017 (black), 2018 (dark gray), 2019 (light gray), 2020 (stripped), 2021 (stippled), 2022 (diamond), and 2023 (crossed) growing seasons. Figure is updated from Shaffer et al., 2021 [13].
Forests 16 00099 g007
Figure 8. Net wood primary production (mean ± S.E.) for midstory species, N. aquatica, and T. distichum for 2017 (black), 2018 (dark gray), 2019 (light gray), 2020 (stripped), 2021 (stippled), 2022 (diamond), and 2023 (crossed) growing seasons. Midstory species were nearly all A. rubrum var. drummondii. Figure is updated from Shaffer et al., 2021.
Forests 16 00099 g008
Figure 9. Leaf litter production (mean ± S.E.) for each site in the Lac des Allemands swamp, including the reference site (Site 1), during 2017 (black), 2018 (dark gray), 2019 (light gray), 2020 (stripped), 2021 (stippled), 2022 (diamond), and 2023 (crossed). Figure is updated from Shaffer et al., 2021.
Forests 16 00099 g009
Figure 10. Leaf litter production (g·m−2 y−1 ± S.E.) during 2017 (black), 2018 (dark gray), 2019 (light gray), 2020 (stripped) 2021 (stippled), 2022 (diamond), and 2023 (crossed), in the reference and Lac des Allemands swamp for the two canopy species (T. distichum and N. aquatica) and midstory species (nearly all of which are contributed by A. rubrum var. drummondii). Figure is updated from Shaffer et al., 2021.
Forests 16 00099 g010
Figure 11. Total aboveground production across sites (Figure 1) and years from 2017 to 2023. Figure is updated from Shaffer et al., 2021.
Forests 16 00099 g011
Figure 12. Total aboveground production across years for each species type from 2017 to 2023. Figure is updated from Shaffer et al., 2021.
Forests 16 00099 g012
Figure 13. Percent cover of (A) all species and all years (bubble size represents relative total cover) and (B) the same ordination showing only the eleven dominant herbaceous species (Alternanthera philoxeroides, Bidens laevis, Crinum americanus, Cyperus virens, Diodia teres, Hydrocotyle ranunculoides, Phanopyrum gymnocarpon, Peltandra virginica, Persicaria punctata, Sagittaria phatyphylla, and Sacciolepis striata). Pie slices reflect the relative percentage covered by the individual species. Figures are updated from Shaffer et al., 2021.
Forests 16 00099 g013aForests 16 00099 g013b
Figure 14. (A) Ordination colored by year and (B) average percent cover of all herbaceous species demonstrating low-water events in 2017 and 2018 and very high flooding during 2016 (stagnant) and 2021 (throughput). Figures are updated from Shaffer et al., 2021.
Forests 16 00099 g014aForests 16 00099 g014b
Figure 15. Average monthly precipitation for the years 2016 through 2023.
Forests 16 00099 g015
Figure 16. Stage gauge records for a CRMS site near Lac des Allemands swamp.
Forests 16 00099 g016
Disclaimer/Publisher’s Note: The statements, opinions and data contained in all publications are solely those of the individual author(s) and contributor(s) and not of MDPI and/or the editor(s). MDPI and/or the editor(s) disclaim responsibility for any injury to people or property resulting from any ideas, methods, instructions or products referred to in the content.

