Abstract
Eogystia hippophaecolus (Hua, Chou, Fang et Chen) is a drilling pest that damages sea buckthorn, leading to substantial ecological and economic losses in areas where sea buckthorn is cultivated in China. Pheromone lures are widely used to monitor and trap male moths; however, the olfactory recognition mechanisms in male moths require further investigation. In this study, we characterized odorant receptor genes using phylogenetics, gene expression, sequence analyses and molecular docking. A phylogenetic analysis using the maximum likelihood method revealed that odorant receptor co-receptor (EhipOrco) genes clustered with other lepidopteran Orco genes, while pheromone receptor (EhipPR) genes clustered with other lepidopteran PR genes, suggesting that these genes have similar functions. The expression levels of 27 odorant receptor (EhipOR) genes in five tissues of male adults were analyzed using qPCR. Nine EhipOR genes were specifically expressed in the antennae, while several EhipOR genes were highly expressed in the head, feet, and external genitalia. As determined using molecular docking, EhipPR1–3 bound strongly to the primary sex pheromone components of E. hippophaecolus. Additionally, EhipPR1–3 demonstrated a strong binding affinity for longifolene among sea buckthorn volatiles. This study provides a foundation for future functional research on EhipORs and the olfactory recognition mechanisms of E. hippophaecolus.
1. Introduction
Eogystia hippophaecolus belongs to the order Lepidoptera and family Cossidae [1]. It is the primary pest of sea buckthorn. As the area of sea buckthorn has expanded, insect pests have become an increasingly serious threat, leading to large-scale outbreaks in various regions, such as Liaoning, Inner Mongolia, Xinjiang, and Ningxia. These outbreaks have caused the widespread decline or death of sea buckthorn, reducing its ecological and economic value significantly and resulting in substantial losses to local forestry production [2,3]. E. hippophaecolus larvae primarily infest the roots of sea buckthorn, disrupting water and nutrient transport, which ultimately leads to the death of the entire plant. Sex pheromone lures are effective for monitoring population dynamics and offer a promising approach for the large-scale control of E. hippophaecolus outbreaks. However, the olfactory recognition mechanism remains unexplored.
Insects use their sense of smell to encode airborne odorant molecules, thereby driving various behaviors, such as courtship, host searching, identifying suitable oviposition sites, and predator avoidance [4,5]. The ORs receive chemical molecules from the external environment through OBPs and CSPs and translate them into electrical signals (signal transduction) for response processing at the higher brain centers [6,7]. Insect antennae house numerous olfactory receptors derived from antennal epidermal cells. Each receptor contains multiple olfactory sensory neurons (OSNs), and the dendritic membranes of the OSNs are populated with a diverse array of olfactory receptors, with ORs playing a central role [8]. Consistent with the role of ORs in the detection of a wide range of volatile chemical signals, there is substantial evidence that they are highly expressed in the antennae [9,10,11]. However, non-antennal expression of certain ORs has also been observed [12,13], suggesting that these receptors have distinct roles. ORs, as highly specific receptor proteins for odorant compounds, play crucial roles in differentiating and recognizing various volatiles. Therefore, investigating their function is essential for a thorough understanding of the olfactory recognition mechanism in insects.
A large number of ecological and biological studies have focused on E. hippophaecolus, including studies of its infestation mechanism and the sex pheromone components of females (E3-14:Ac and Z7-14:Ac); additionally, effective sex pheromones and traps have been developed to target male adults for monitoring and control [14,15]. However, the mechanism underlying olfactory recognition has not been completely clarified. Based on transcriptomic data for male and female E. hippophaecolus antennae, Hu et al. identified 137 olfactory proteins in both sexes. They found three pheromone-binding proteins that were preferentially expressed in the antennae and analyzed their binding ability to sex pheromones [16]. Additionally, Li et al. discovered that 18 genes encoding chemosensory proteins were predominantly expressed in the labial palps [17]. However, the OR genes of E. hippophaecolus have not been evaluated to date. In this study, a phylogenetic tree based on the OR genes of E. hippophaecolus (EhipORs) and other Lepidoptera was constructed. qPCR was employed to assess their expression levels in different tissues of adult male insects from five species (antennae, head [excluding antennae and lower labial palps], legs, external genitalia, and labial palps). Gene cloning and amino acid sequence analyses were performed to evaluate PR genes that were preferentially expressed in the antennae. Protein modeling and molecular docking were performed to investigate the binding properties of PR proteins with sex pheromone compounds and sea buckthorn volatiles. The findings of this study provide a foundation for future functional assays and the development of novel insecticides to control this pest.
2. Materials and Methods
2.1. Insect Collection and Processing
Male adults of E. hippophaecolus were collected from infested sea buckthorn forests in Nuanshui village, Junggar Banner County, Inner Mongolia (110°5′ N, 39°6′ E) in June 2024. The antennae, head, legs, external genitalia, and lower lip whiskers of live insects were placed in centrifuge tubes containing RNAlater (Ambion, Austin, TX, USA), transported to the laboratory, and stored at −80 °C.
2.2. RNA Extraction and cDNA Synthesis
Total RNA was extracted from several olfactory tissues of adult male buckthorn wood-boring moths, including the antennae, head, feet, external genitalia, and mandibular whiskers. Extraction was performed using TRIzol reagent (Invitrogen, Carlsbad, CA, USA) and the RNeasy Plus Mini Kit (Qiagen, Hilden, Germany; catalog no. 74134). The mass and concentration (ng/mL) of total RNA were measured using the NanoDrop 8000 micro-UV/visible spectrophotometer (Thermo, Waltham, MA, USA). The RNAs that passed both the OD260/OD280 ratio and the OD260/OD230 ratio were used in the next step of the experiments. cDNA was synthesized using the PrimeScript RT Reagent Kit with gDNA Eraser Reverse Transcription Kit (No. RR047Q; TaKaRa, Shiga, Japan) and first-strand cDNA was synthesized with 1 µg of total RNA. Final storage was at −20 °C.
2.3. Phylogenic Analyses
A phylogenetic tree was constructed using the MEGA7((Version 7.0.26, Molecular Evolutionary Genetics Analysis, Philadelphia, PA, USA) programme based on Eogystia hippophaecolus ORs (EhipOR), Plutella xylostella Linnaeus ORs (PxylOR) [18], Bombyx mori Linnaeus ORs (BmorOR) for Lepidoptera, Coleoptera Holotrichia oblita Faldermann ORs (HoblOR) [19] and Anoplophora chinensis Forster ORs (AchiORs) [20], and Cyrtorhinus lividipennis Reuter ORs (ClivORs) [21] in Hemiptera. The tree was generated using the maximum likelihood method with 500 bootstrap replications. GenBank numbers of all OR genes are shown in Supplementary Table S1.
2.4. Tissue Expression of EhipORs
Primers were designed for OR genes using the Primer Premier 3 online tool (http://bioinfo.ut.ee/primer3-0.4.0/, accessed on 31 May 2024) and were synthesized by Beijing Ruiboxingke Biotechnology Co., Ltd. (Beijing, China).The sequences of all primers used in this study are shown in Table 1. RT-PCR was used for initial screening, followed by qPCR validation to confirm the expression of OR genes that were highly expressed in various tissues (antennae, head, lower labial whiskers, feet, and external genitalia) of adult males.

Table 1.
The primers used for qPCR and gene cloning.
The qPCR analysis was conducted using a CFX96TM real-time system (Bio-Rad, Hercules, CA, USA). The qPCR reaction was performed in a 12.5 μL system containing 6.25 μL of SYBR Premix Ex Taq (No. RR820A; TaKaRa), 4.25 μL ddH2O, 0.5 μL upstream primers, 0.5 μL downstream primers and 1 μL 10-fold diluted cDNA. The qPCR program consisted of an initial step at 95 °C for 2 min, followed by 40 cycles of 95 °C for 30 s and 60 °C for 1 min. The appropriate reference gene is fundamental for optimum qPCR analysis. The sequences of the actin gene primers were based on those reported in a previous publication [16]. To examine reproducibility, each qPCR reaction for each tissue was performed in three biological replicates and three technical replicates, in which each biological replication was with ten individuals, each biological replication with three technical replicates. Negative controls without either template were included in each experiment. Gene expression levels were analyzed using the 2−ΔΔCT method [22].
2.5. Statistical Analysis
Data were analyzed using the 2−ΔΔCT method, and histograms were generated using GraphPad Prism 9 (GraphPad Software Inc., San Diego, CA, USA). Data were analyzed using SPSS 27.0.1 software (IBM, Endicatt, NY, USA), and statistical comparisons of the expression of ORs were performed using one-way ANOVA followed by Tukey’s honest significant differences (HSD) test. Additionally, p < 0.05 indicated a statistically significant difference. Gene expression levels in male labial palp were used as controls. Data were expressed as mean ± SEM.
2.6. Gene Cloning and Amino Acid Sequence Analysis
Full-length primers were designed based on the coding sequences (CDSs) of EhipPR1–3, as published in the NCBI database. Primer synthesis was outsourced to Beijing Ruibo Xingke Biotechnology Co. (Beijing, China). The cDNA was used as a template for PCR amplification of the full-length EhipPR1–3 genes using Primer STAR Max Premix (Catalog No. R045A; TaKaRa). The products were detected by electrophoresis on a 1.2% agarose gel. The bands in the desired range were excised and purified using the TIANgel Midi Purification Kit (Tiangen, China), ligated into the pEASY vector, and then transformed into Trans1-T1 cells. Colony PCR was performed for identification, and the bacterial culture, free of visible contaminants, was sent to Beijing Ruiboxingke Biotechnology Co., Ltd. (Beijing, China), for plasmid extraction and sequencing. The cloned EhipPR1–3 sequence was then analyzed using DNAMAN 9.0.
ORF prediction was conducted using the NCBI ORF Finder (http://www.ncbi.nlm.nih.gov/orffinder, accessed on 12 July 2024). The physicochemical properties of the EhipPR1–3 proteins were analyzed using the ExPASy ProtParam tool (http://web.expasy.org/protparam/, accessed on 12 August 2024.), including the formula, molecular weight (MW) in kDa, isoelectric point (pI), instability index, aliphatic index, and GRAVY value.
2.7. EhipPR1–3 Protein Modeling and Molecular Docking
Protein models for EhipPR1, EhipPR2, and EhipPR3 were constructed using the AlphaFold 3 online tool. The models were then evaluated using UCLA DOE LAB—SAVES v6.0 (https://saves.mbi.ucla.edu/, accessed on 20 August 2024), generating Ramachandran and ERRAT plots to assess the quality of the protein structures and validity of their non-bonding interactions. The evaluated proteins can be used in the next step of molecular docking. Protein-small molecule docking was carried out using AutoDockTools-1.5.6. The ligands used in the docking experiments included the buckthorn E. hippophaecolus sex pheromone and its analogs (E3-14:Ac, Z3-14:Ac, E9-14:Ac, Z7-14:Ac, Z9-14:Ac, Z3-14:Ac, and Z7-14:Ac) as well as volatile compounds from sea buckthorn (longifolene, 1-octene, 3-methyl butanol, benzothiazole, 3-carene, benzaldehyde, and naphthalene). The 3D structures of compounds used as ligands were downloaded from the PubChem database (https://pubchem.ncbi.nlm.nih.gov/, 2 September 2024) (Table 2). The lowest binding energies were recorded, and the most suitable chemical ligands were predicted based on these values. The docking results with the lowest binding energies were visualized using Discovery Studio 4.5 Visualizer.
Table 2.
Three-dimensional structural names and CAS accession numbers of ligand compounds for molecular docking downloaded from the PubChem database.
3. Results
3.1. Phylogenetic Analysis of EhipORs and Other Lepidoptera Odorant Receptors
The phylogenetic analysis showed that the EhipPRs belong to the same branch as the PRs of other Lepidoptera, and this branch is independent of the common OR genes of Coleoptera and Hemiptera and Lepidoptera, and EhipPR1–3 clustered with PRs from other Lepidoptera, such as BmorOR1, BmorOR3, BmorOR6, PxylOR1, PxylOR4–8, and PxylOR41. The EhipOrco gene grouped with PXYIOrco and BmorOrco within the Lepidoptera Orco group (Figure 1).
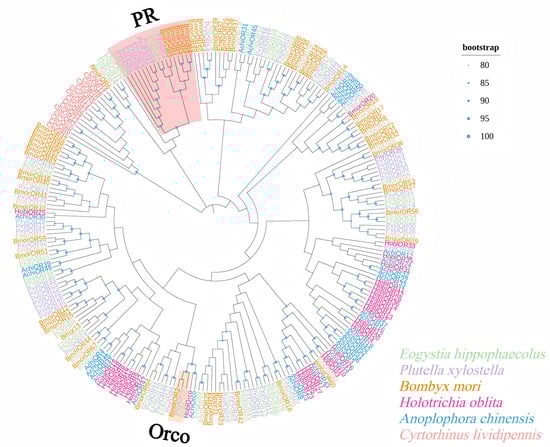
Figure 1.
Phylogenetic tree of E. hippophaecolus with Lepidoptera, Hemiptera and Coleoptera OR genes: Lepidoptera: Eogystia hippophaecolus (green), Plutella xylostella (purple) and Bombyx mori (brown). Hemiptera: Cyrtorhinus lividipennis (red). Coleoptera: Holotrichia oblita (pink) and Anoplophora chinensis (blue). Lepidoptera PR genes are highlighted in pink shading and Lepidoptera Orco genes are highlighted in yellow shading (node support based on 500 bootstrap replications is shown).
3.2. Expression Levels of EhipOR Genes in Different Tissues
Twenty-seven OR genes were highly expressed in the five tissues analyzed by RT-PCR. Labial palpi expression was used as the control in fluorescence quantitative PCR. Tissue expression profiles (Figure 2) showed that 19 OR genes with significantly higher expression in the antennae, EhipOR28, EhipOR30, EhipOR36, EhipOR45, EhipPR1, EhipPR2, EhipPR3, and EhipOrco were specifically expressed in the antennae and barely expressed on other tissues. In particular, the PR genes EhipPR1, EhipPR2, and EhipPR3, which act as sex-pheromone-receiving elements, were highly accumulated in the male antennae. This suggests that these genes play an important role in the reception of sex pheromones and host-finding.
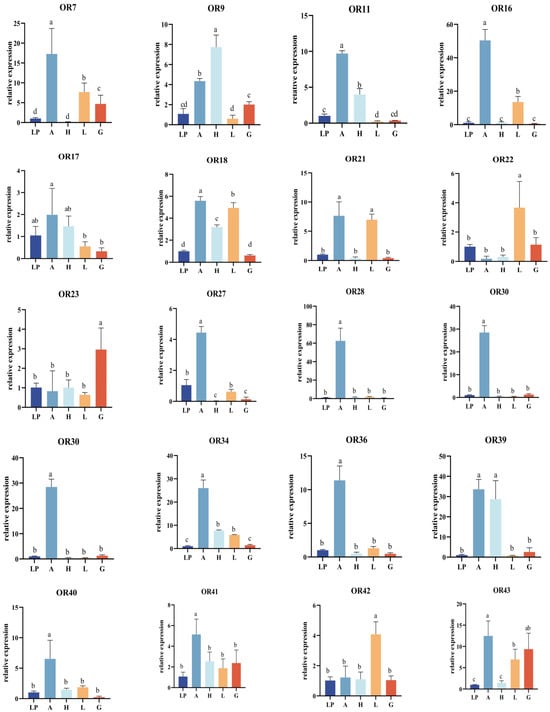
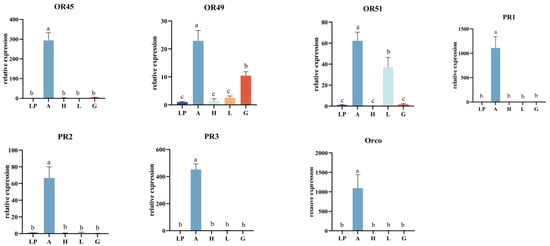
Figure 2.
Expression profiles of EhipOR genes in different tissues. A, Antennae; H, Heat; L, Leg; G, External Genitalia; L, Labial palp. Gene expression of labial palp was used as control and relative expression levels are expressed as means ± standard error of mean (SEM). Error bars indicate standard error of three biological replicates. Different letters within the same figure mean that the values are significantly different under one-way ANOVA followed by Tukey’s honest significant differences (HSD) test (p < 0.05).
We found that nine OR genes were expressed in the head, and in particular, EhipOR9 was significantly more expressed in the head than in other tissues. Additionally, genes were also expressed in the legs of the male moth. Notably, EhipOR21 was expressed in the region of the leg near the antennae, with expression levels significantly higher than those in the labial palp, head, and external genitalia tissues. EhipOR22 and EhipOR42 exhibited the highest expression levels in the legs, significantly higher than in other tissues. These findings suggest the presence of an olfactory recognition mechanism in the legs of the male moth. EhipOR23 was expressed in all five tissues of the male moth, with significantly higher expression in the external genitalia compared to other tissues. This suggests that EhipOR23 plays a role in sex pheromone reception and mating in male moths. In summary, most OR genes of E. hippophaecolus were significantly expressed in the antennae. Only a few genes, such as EhipOR22 and EhipOR23, were significantly expressed in the head, leg, and external genitalia. No OR genes in E. hippophaecolus showed region-specific or significantly higher expression in the labial palp compared to other tissues.
3.3. EhipPR1–3 Gene Cloning and Amino Acid Sequence Analysis
Following phylogenetic tree construction and tissue expression profiling, the EhipPR1–3 genes, which were predominantly expressed in the antennae, were selected for further analyses. Based on NCBI sequence data (KX655954.1, KX655970.1, and KX656005.1), the CDS lengths of EhipPR1, EhipPR2, and EhipPR3 were 1290 bp (Figure 3A) encoding 429 amino acids, 1239 bp (Figure 3B) encoding 412 amino acids, and 1272 bp (Figure 3C) encoding 423 amino acids, respectively.
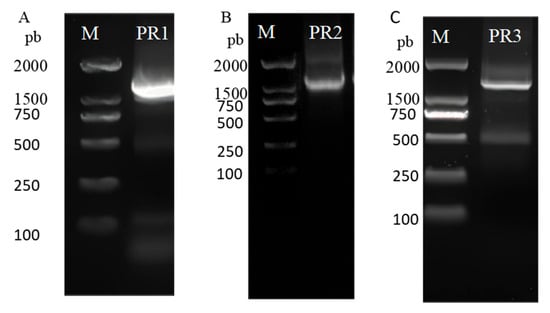
Figure 3.
Electrophoretogram of PCR products of PRs genes in E. hippophaecolus. M: BM 2000+ marker, lanes 1–3: PCR amplification products of PR1, PR2 and PR3. (A) PCR products of PR1. (B) PCR products of PR2. (C) PCR products of PR3.
ProtParam predictions (Table 3) indicated that the molecular formulas of EhipPR1–3 were C2363H3570N554O610S31, C2259H3464N522O591S28, and C2247H3470N546O596S27, with molecular weights of 50.49, 48.28, and 48.53 kDa, respectively. The isoelectric points (pIs) were 8.77, 8.35, and 8.47, and these differences were not significant. Amino acids with an instability index below 40 were considered stable, while those above 40 were unstable. The results showed that all three proteins were stable. The aliphatic amino acid indices of the three proteins were approximately 100, indicating thermal stability. Additionally, the average hydrophilicity (GRAVY value) was greater than 0, suggesting that all three proteins were hydrophobic.
Table 3.
Analysis of the amino acid sequence of the sex pheromone receptor.
3.4. Molecular Docking of EhipPR1–3
After protein modeling of EhipPR1–3 using AlphaFold 3 online software, the protein model must be evaluated using the ERRAT and Ramachandran plot method to determine whether molecular docking can proceed (Figure 4). In the Ramachandran plot evaluation, it is generally considered that the proportion of amino acid residues falling in the permissive and maximal permissive regions to the overall amino acid residues of the protein is higher than 90%, which can be regarded as the conformational reasonableness of the resulting model [23]. In this study, it was indicated that over 90% of the amino acid residues of all three protein models were located in the most energetically favorable regions.
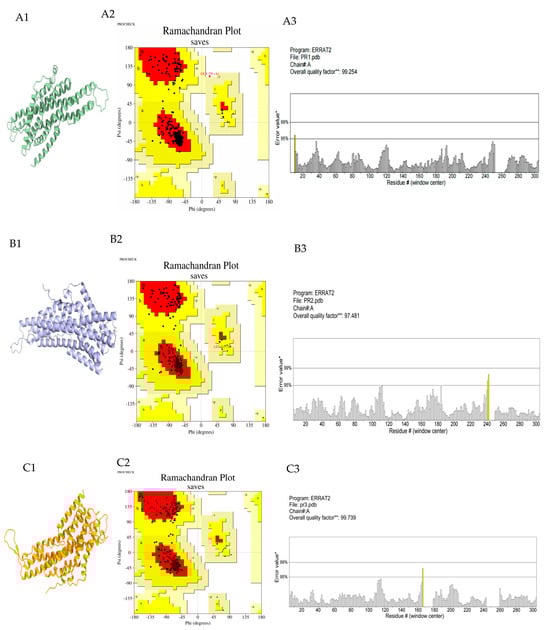
Figure 4.
AloAlphaFold 3 protein modeling results and model evaluation. (A1–A3) are the results of EhipPR1, EhipPR2 and EhipPR3 protein modeling, respectively. (B1–B3) are the Ramachandran Plot of EhipPR1−3: red, most favored regions [A,B,L]; yellow, additional allowed regions [a,b,l,p]; pale yellow, generously allowed regions [~a,~b~l~p]. Included among these, A: Core alpha, B: Core beta, L: Core left-handed alpha, a: Allowed alpha, b: Allowed beta, l: Allowed left-handed alpha, p: Allowed epsilon, ~a: Generous alpha, ~b: Generous beta, ~l: Generous left-handed alpha, ~p: Generous epsilon, Black box: Number of non−glycine and non−proline residues, Black triangle: Number of glycine residues. (C1–C3) are the ERRAT evaluations for EhipPR1−3: the overall quality factor is a quantitative assessment of the overall quality of the protein structure model. Note: Yellow color indicated that 95%≤ the error value < 99%, *: On the error axis, two lines are drawn to indicate the confidence with which it is possible to reject regions that exceed that error value. **: Expressed as the percentage of the protein for which the calculated error value falls below the 95% rejection limit.
The overall quality of non-bonding interactions between different atoms in the target conformation was evaluated by the ERRAT procedure. The overall ERRAT quality factor for the EhipPR1–3 3D structural model was greater than 95, significantly exceeding the general threshold of 50 [24]. This indicates that the non-covalent bonding interactions in the modeled proteins are overall reasonable.
In summary, these three evaluated and qualified protein models can be used for the next step of molecular docking.
The validated protein models of EhipPR1, EhipPR2, and EhipPR3 were docked with sex pheromones, their analogs from E. hippophaecolus, and volatiles from sea buckthorn. The minimum docking binding energies were then calculated (Figure 5). Proteins with the lowest binding energies are typically considered to bind most stably to ligands. In docking experiments involving sex pheromone compounds, both EhipPR1 and EhipPR2 exhibited similar binding profiles. They showed the lowest binding energies with E3-14:Ac, −5.81 and −4.80 kcal/mol, respectively, which were significantly lower than those observed with other sex pheromones and their analogs. The docking results of EhipPR3 with various sex pheromones and analogues showed the lowest binding energies. The docking results of EhipPR3 to various sex pheromones and their analogues were similar, and all of them were around −5 kcal/mol, with the lowest docking result of −5.50 kcal/mol to Z7-14:Ac. In the docking results to compounds of sea buckthorn volatile compounds, all three proteins had the lowest binding energy to longifolene of −5.54, −6.63, and −6.20 kcal/mol, respectively. The lowest docking binding energies of EhipPR1, EhipPR2 and EhipPR3 with seven sex pheromones and their analogues, the seven major volatile compounds of sea buckthorn, were visualized and analyzed, respectively.
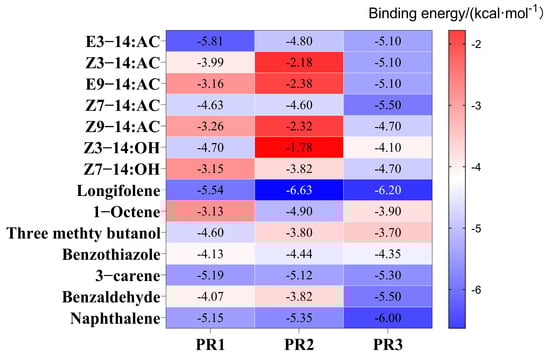
Figure 5.
Molecular docking results of E. hippophaecola sex pheromone receptor protein with sex pheromone compounds and sea buckthorn volatile compounds. The horizontal coordinates are docking proteins, the vertical coordinates are ligand substances, and the numbers in the graph indicate docking binding energies, with changes from red to blue indicating high to low changes in docking binding energies.
The docking results are visualized in Figure 6. The docking results revealed that the primary intermolecular forces between EhipPR1, EhipPR2, EhipPR3, and the sex pheromones E3-14:Ac and Z7-14:Ac were hydrophobic and van der Waals forces. Specifically, E3-14:Ac formed a hydrogen bond with the tyrosine residue at position 311 of PR1, while Z7-14:Ac formed a hydrogen bond with isoleucine at position 196 of PR3.
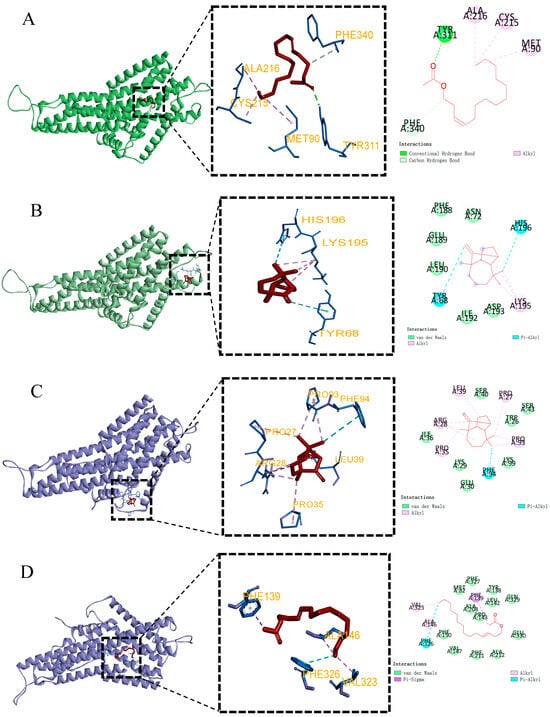
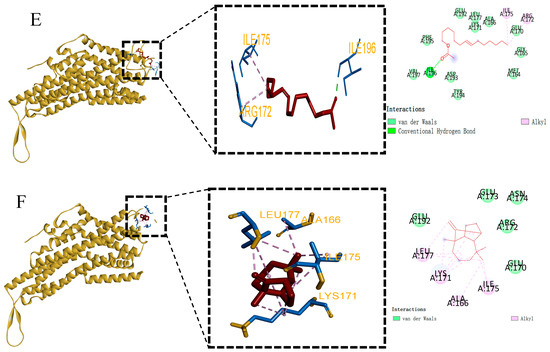
Figure 6.
Molecular docking diagram of protein and ligand. (A) PR1 and E3-14:Ac docking results. (B) PR1 and longifolene docking results. (C) PR2 and longifolene docking results. (D) PR2 and E3-14:Ac docking results. (E) PR3 and Z7-14:Ac docking results. (F) PR3 and longifolene docking results. In the above figure, the red stick represents the structure of the docked ligand, blue is the amino acid residues, orange letters are the names of the amino acid residues, the pink circle represents the amino acids that form the alkyl force between the protein and the ligand, the light green circle represents the amino acids that form the carbon–hydrogen bond force between the protein and the ligand, the green circle represents the amino acids that form the hydrogen bonding force between the protein and the ligand, green circles represent amino acids with hydrogen bonding forces between protein and ligand, light green circles without dotted lines represent amino acids with van der Waals forces between protein and ligand, blue circles represent amino acids with Pi-Alky forces between protein and ligand, and purple circles represent amino acids with Pi-Sigma forces between the protein and ligand.
4. Discussion
In phylogenetic analyses, EhipORs of E. hippophaecolus were classified into different clades, suggesting that they have different functions [25]. EhipOrco aggregated with other lepidopteran Orco genes to form a subfamily; these loci were highly homologous to each other. All EhipPRs (EhipPR1–3) were assigned to the PR family, which included Bmor1, Bmor3, and PxylOR41, sex pheromone receptors that have been functionally characterized [26,27], suggesting that they have functional similarity.
The functions of insect ORs are closely linked to their expression patterns [28], emphasizing the importance of understanding these patterns in different tissues. In this study, we found that 19 ORs were predominantly expressed in the antennal region of male adult insects, with significantly higher expression levels than those in other tissues. This confirms that the antennae are the main olfactory organ in E. hippophaecolus. This finding aligns with earlier research demonstrating that ORs are highly expressed in the antennae of various insect species. For example, 27 out of 33 MperORs in the Myzus persicae Sulzer are expressed exclusively or at high levels in the antennae [29], and GmolOR12, GmolOR20, and GmolOR21 in Grapholita molesta Busck are mainly expressed in the antennae of adults [30]. It is hypothesized that E. hippophaecolus uses its olfactory system to locate host plants. Studies have shown that male lepidopterans search for mates by detecting specific sex pheromones released by conspecific females through a highly sensitive olfactory system in the antennae. As a result, PRs involved in sex pheromone recognition are typically expressed specifically in the antennae [31,32]. The results of the present experiments are in agreement with these previous findings; in particular, EhipPR1–3 showed biased expression in the male antennae, with EhipPR1 expression being 1000-fold higher than that in the control. In addition to being highly or specifically expressed in the antennae, a small number of OR genes are also expressed in other tissues, including the rostrum, ovipositor, and feet [33,34,35]. In this study, EhipOR9, EhipOR17, and EhipOR39 were highly expressed in the head, and this was not an exception. In addition to antennae and lower labial whiskers, the head also contains tissues like the insect’s jaws. Moreover, Drosophila Linnaeus was found to have seven OR genes expressed in olfactory neurons in the palate, and these organs in Drosophila may play a role in taste enhancement [36]. Xu et al. detected that LmigOR2 is highly expressed in locust mouthparts. Additionally, locust jaws have been shown to play a key role in locating and searching for food resources [37]. Thus, the three odor receptor genes with relatively high expression in the head may have some function in taste recognition. In this study, EhipOR22 and EhipOR42 were found to be highly expressed in the leg; however, this is not exceptional. Wang et al. also found that 11 conventional ORs were highly expressed in the wing and leg outside of the antennae [38]. Meanwhile, hairy tentacles and scales, Burr’s bristles and scales were found on the legs of E. hippophaecolus, which have the function of detecting mechanical stimuli and host volatiles [39]. These suggest that these ORs may perceive contacting pheromone. Hu et al. also found that Sensilla trichodea was also present in the external genitalia of the E. hippophaecolus by scanning electron microscopy, and found that the male external genitalia could play a role in sex pheromone identification during mating between adult males and females of the E. hippophaecolus [16,39]. In the present study, we found that the expression of EhipOR23 was significantly higher in the external genital tissues than in other tissues, probably due to the involvement of this gene in the process of male moths finding females and mating.
Pheromone communication is commonly used in Lepidoptera to locate conspecific mates of the opposite sex [40]. Among the protein families involved in pheromone detection, PRs are crucial for determining the specificity and sensitivity of chemical mating signal recognition, which is fundamental to both interspecific isolation and intraspecific mate selection [41,42]. Therefore, we used molecular docking techniques to explore the binding modes and affinities between EhipPR1–3 proteins, sex pheromones and sea buckthorn volatile compound ligands. More accurate predictions of binding poses and binding affinities can suggest candidates for active compounds with higher true positive rates and can considerably reduce expensive experimental efforts [43]. Generally, lower docking energies correspond to more stable binding conformations and a higher likelihood of interaction. The more stable the conformation, the lower the binding energy. A docking score <−5.0 kcal/mol indicated that the ingredients had a good binding activity to the protein targets, while a docking score <−7.0 kcal/mol indicated a strong binding activity [44]. EhipPR1–3 had the lowest binding energies to longifolene among the volatiles of sea buckthorn, which may be because longifolene is widely distributed in nature. PR proteins bind directly to sex pheromones and mediate signal transduction, determining the selectivity and specificity of ORNs to the ligand. In this study, EhipPR1–3 effectively bound the E. hippophaecolus sex pheromone, consistent with previous EAG findings for male E. hippophaecolus antennae [45]. These results further suggest that EhipPR genes play a crucial role in mate-finding behavior. Effective binding of ORs to ligands depends on the interaction forces. In this study, the protein–ligand interaction was primarily mediated by hydrogen bonding, hydrophobic interactions, and van der Waals forces. In this, hydrogen bonds play key roles in conferring binding specificity of macromolecular complexes [46,47,48]. E3-14:Ac forms a hydrogen bond with the tyrosine residue at position 311 of PR2, while Z7-14:Ac forms a hydrogen bond with the isoleucine residue at position 196 of PR3. This result also further suggests that there is specificity in the recognition of sex pheromones by EhipPR1 and EhipPR3. However, this remains a preliminary hypothesis, and further studies, such as site-directed mutagenesis, are needed to confirm these findings [49].
5. Conclusions
E. hippophaecolus is an important boring insect that causes significant damage to sea buckthorn in China. The ORs of E. hippophaecolus are capable of specifically detecting odorant substances and contribute to host plant recognition. Therefore, we investigated the ORs genes of E. hippophaecolus. In the phylogenic tree, EhipPR1–3 clustered with PRs of other Lepidopteran insects. The EhipOrco gene clustered into the Lepidopteran Orco group with PxylOrco and BmorOrco. Tissue expression profiles showed that most of the EhipORs genes were significantly expressed in the antennal region of male adults, and only a few ORs genes were significantly expressed in other tissues, e.g., EhipOR9 was significantly expressed on the head, EhipOR22 and EhipOR42 were significantly expressed on the legs, EhipOR23 was significantly expressed on the external genitalia, and there were no genes significantly expressed on the labial palp region. In addition, we cloned and analyzed the amino acid sequences of EhipPR1, EhipPR2 and EhipPR3 genes that are biasedly expressed in the antennae. Finally, we used molecular docking to explore the binding properties and affinities between the E. hippophaecolus sex pheromone receptor genes and the ligands for sex messages and their analogues, sea buckthorn volatile compounds. It was found that in sea buckthorn volatiles, EhipPR1–3 had a good binding effect with longifolene, and among the sex pheromone components, EhipPR1 had a good binding effect with E3-14:Ac, and EhipPR3 had a good binding effect with Z7-14:Ac. In summary, these findings lay the foundation for further investigations of the functions of ORs in E. hippophaecolus and provide valuable insights for developing novel, environmentally friendly pest control strategies.
Supplementary Materials
The following supporting information can be downloaded at: https://www.mdpi.com/article/10.3390/f16010098/s1, Table S1: Odorant receptors genes registry numbers or article sources used in this article.
Author Contributions
Conceptualization, C.C. and S.Z. (Shixiang Zong); methodology, C.C. and S.Z. (Sainan Zhang); software, C.C. and Y.N.; validation, C.C., S.Z. (Sainan Zhang) and Y.N.; formal analysis, C.C.; investigation, C.C. and S.L.; resources, C.C. and X.L.; data curation, C.C.; writing—original draft preparation, C.C. and J.T.; writing—review and editing, C.C. and S.Z. (Shixiang Zong); visualization, C.C.; supervision, S.Z. (Shixiang Zong) and J.T.; project administration, S.Z. (Shixiang Zong); funding acquisition, S.Z. (Shixiang Zong). All authors have read and agreed to the published version of the manuscript.
Funding
This research was funded by the Demonstration and Innovative Application of Green Pest Control Technology for Major Insect Disasters in the Forest and Fruit Industry of Junggar Banner (grant number 2023CG-04).
Data Availability Statement
The data are not publicly available due to the usage for ongoing project.
Acknowledgments
We are very grateful to the staff of the Junggar Banner Forestry and Grassland Business Centre for their great assistance during the fieldwork.
Conflicts of Interest
The authors declare that this research was conducted in the absence of any commercial or financial relationships that could be construed as a potential conflict of interest.
References
- Yakovlev, R.V. A New species and new records of the genus Meharia chretien 1915 (lepidoptera, cossidae) from the middle east and central asia. Zool. Zhurnal 2018, 97, 1127–1131. [Google Scholar] [CrossRef]
- Hu, J.H.; Liu, J. Occurrence characteristics and control measures of Eogystia hippophaecolus in Panyang County. Mod. Agric. Sci. Technol. 2017, 98+102. [Google Scholar]
- Luo, J.J.; Wang, F.C.; Wang, K.; Song, L.; Qin, W.S.; Wang, X.; Wang, H.Y.; Pan, X.Y. Characteristics of the occurrence and integrated control of Eogystia hippophaecolus in Tayu Reclamation Area of Xinjiang. Fruit Tree Pract. Technol. Inf. 2020, 26–28. [Google Scholar]
- Turlings, T.C.J.; Erb, M. Tritrophic Interactions Mediated by Herbivore-Induced Plant Volatiles: Mechanisms, Ecological Relevance, and Application Potential. In Annual Review of Entomology; Berenbaum, M.R., Ed.; Annual Review: San Mateo, CA, USA, 2018; Volume 63, pp. 433–452. [Google Scholar]
- Guo, H.; Wang, C.Z. The ethological significance and olfactory detection of herbivore-induced plant volatiles in interactions of plants, herbivorous insects, and parasitoids. Arthropod Plant Interact. 2019, 13, 161–179. [Google Scholar] [CrossRef]
- Ache, B.W. Insect chemoreception: Mechanisms in insect olfaction. Science 1987, 236, 341. [Google Scholar] [CrossRef]
- Field, L.M.; Pickett, J.A.; Wadhams, L.J. Molecular studies in insect olfaction. Insect Mol. Biol. 2000, 9, 545–551. [Google Scholar] [CrossRef]
- Ronderos, D.S.; Smith, D.P. Diverse signaling mechanisms mediate volatile odorant detection in Drosophila. Fly 2009, 3, 290–297. [Google Scholar] [CrossRef]
- Zhao, Y.N.; Wang, F.Z.; Zhang, X.Y.; Zhang, S.H.; Guo, S.L.; Zhu, G.P.; Liu, Q.; Li, M. Transcriptome and Expression Patterns of Chemosensory Genes in Antennae of the Parasitoid Wasp Chouioia cunea. PLoS ONE 2016, 11, e0148159. [Google Scholar] [CrossRef]
- Liu, J.F.; Yang, L.; Li, M.; He, X.J.; Wang, Z.L.; Zeng, Z.J. Cloning and expression pattern of odorant receptor 11 in Asian honeybee drones, Apis cerana (Hymenoptera, Apidae). J. Asia Pac. Entomol. 2019, 22, 110–116. [Google Scholar] [CrossRef]
- Yang, K.; Huang, L.Q.; Ning, C.; Wang, C.Z. Two single-point mutations shift the ligand selectivity of a pheromone receptor between two closely related moth species. eLife 2017, 6, e29100. [Google Scholar] [CrossRef]
- Chang, H.T.; Liu, Y.; Yang, T.; Pelosi, P.; Dong, S.L.; Wang, G.R. Pheromone binding proteins enhance the sensitivity of olfactory receptors to sex pheromones in Chilo suppressalis. Sci. Rep. 2015, 5, 13093. [Google Scholar] [CrossRef] [PubMed]
- Li, R.T.; Huang, L.Q.; Dong, J.F.; Wang, C.Z. A moth odorant receptor highly expressed in the ovipositor is involved in detecting host-plant volatiles. eLife 2020, 9, e53706. [Google Scholar] [CrossRef] [PubMed]
- Fang, Y.L.; Sun, J.H.; Zhao, C.H.; Sun, Y.P.; Zhang, H.Q.; Zhang, Z.N. Identification of sex pheromone components in Eogystia hippophaecolus (Lepidoptera: Cossidae) and their biological activities. J. Entomol. 2003, 5, 665–666. [Google Scholar]
- Cheng, X.F.; Wang, J.M.; Zhang, J.T. Synthesis of sex pheromone in Eogystia hippophaecolus and experiments on moth-attracting activity in forests. For. Sci. 2007, 74–77. [Google Scholar]
- Hu, P.; Gao, C.L.; Zong, S.X.; Luo, Y.Q.; Tao, J. Pheromone Binding Protein EhipPBP1 Is Highly Enriched in the Male Antennae of the Seabuckthorn Carpenterworm and Is Binding to Sex Pheromone Components. Front. Physiol. 2018, 9, 447. [Google Scholar] [CrossRef]
- Li, Z.X.; Liu, L.; Zong, S.X.; Tao, J. Molecular Characterization and Expression Profiling of Chemosensory Proteins in Male Eogystia hippophaecolus (Lepidoptera: Cossidae). J. Entomol. Sci. 2021, 56, 217–234. [Google Scholar] [CrossRef]
- Yang, S.Y.; Cao, D.P.; Wang, G.R.; Liu, Y. Identification of Genes Involved in Chemoreception in Plutella xyllostella by Antennal Transcriptome Analysis. Sci. Rep. 2017, 7, 11941. [Google Scholar] [CrossRef]
- Li, K.; Wei, H.; Shu, C.; Zhang, S.; Cao, Y.; Luo, C.; Yin, J. Identification and comparison of candidate odorant receptor genes in the olfactory and non-olfactory organs of Holotrichia oblita Faldermann by transcriptome analysis. Comp. Biochem. Physiol. D Genom. Proteom. 2017, 24, 1–11. [Google Scholar] [CrossRef]
- Sun, L.; Zhang, Y.N.; Qian, J.L.; Kang, K.; Zhang, X.Q.; Deng, J.D.; Tang, Y.P.; Chen, C.; Hansen, L.; Xu, T.; et al. Identification and Expression Patterns of Anoplophora chinensis (Forster) Chemosensory Receptor Genes from the Antennal Transcriptome. Front. Physiol. 2018, 9, 90. [Google Scholar] [CrossRef]
- Wang, G.Y.; Zhu, J.L.; Zhou, W.W.; Liu, S.; Khairul, Q.M.; Ansari, N.A.; Zhu, Z.R. Identification and expression analysis of putative chemoreception genes from Cyrtorhinus lividipennis (Hemiptera: Miridae) antennal transcriptome. Sci. Rep. 2018, 8, 12981. [Google Scholar] [CrossRef]
- Livak, K.J.; Schmittgen, T.D. Analysis of relative gene expression data using real-time quantitative PCR and the 2(-Delta Delta C(T)) Method. Methods 2001, 25, 402–408. [Google Scholar] [CrossRef] [PubMed]
- Carugo, O.; Djinović-Carugo, K. Half a century of Ramachandran plots. Acta Crystallogr. 2013, 69, 1333–1341. [Google Scholar] [CrossRef] [PubMed]
- Fu, S.H.; Zhnag, H.; Zhao, W.Q.; Liang, Z.G. Molecular docking of PxylOBP33 with its associated infochemicals. J. Environ. Entomol. 2023, 45, 1291–1305. [Google Scholar]
- de Fouchier, A.; Sun, X.; Monsempes, C.; Mirabeau, O.; Jacquin-Joly, E.; Montagné, N. Evolution of two receptors detecting the same pheromone compound in crop pest moths of the genus Spodoptera. Front. Ecol. Evol. 2015, 3, 95. [Google Scholar] [CrossRef]
- Sakurai, T.; Nakagawa, T.; Mitsuno, H.; Mori, H.; Endo, Y.; Tanoue, S.; Yasukochi, Y.; Touhara, K.; Nishioka, T. Identification and functional characterization of a sex pheromone receptor in the silkmoth Bombyx mori. Proc. Natl. Acad. Sci. USA 2004, 101, 16653–16658. [Google Scholar] [CrossRef]
- Cattaneo, A.M.; Gonzalez, F.; Bengtsson, J.M.; Jacquin-Joly, E.; Montagné, N.; Walker, W.B.; Witzgall, P.; Bobkov, Y.V. Candidate pheromone receptors of codling moth Cydia pomonella respond to pheromones and kairomones. Chem. Senses 2019, 44, E25. [Google Scholar] [CrossRef]
- Legeai, F.; Malpel, S.; Montagné, N.; Monsempes, C.; Cousserans, F.; Merlin, C.; François, M.C.; Maïbèche-Coisné, M.; Gavory, F.; Poulain, J.; et al. An Expressed Sequence Tag collection from the male antennae of the Noctuid moth Spodoptera littoralis: A resource for olfactory and pheromone detection research. BMC Genom. 2011, 12, 86. [Google Scholar] [CrossRef]
- Liu, J.T.; Xie, J.X.; Khashaveh, A.; Zhou, J.J.; Zhang, Y.J.; Dong, H.; Cong, B.; Gu, S.H. Identification and Tissue Expression Profiles of Odorant Receptor Genes in the Green Peach Aphid Myzus persicae. Insects 2022, 13, 398. [Google Scholar] [CrossRef]
- Chen, L.H.; Tian, K.; Wang, G.R.; Xu, X.L.; He, K.H.; Liu, W.; Wu, J.X. The general odorant receptor GmolOR9 from Grapholita molesta (Lepidoptera: Tortricidae) is mainly tuned to eight host-plant volatiles. Insect Sci. 2020, 27, 1233–1243. [Google Scholar] [CrossRef]
- Bastin-Héline, L.; de Fouchier, A.; Cao, S.; Koutroumpa, F.; Caballero-Vidal, G.; Robakiewicz, S.; Monsempes, C.; François, M.C.; Ribeyre, T.; Maria, A.; et al. A novel lineage of candidate pheromone receptors for sex communication in moths. eLife 2019, 8, e49826. [Google Scholar] [CrossRef]
- Liu, X.L.; Sun, S.J.; Khuhro, S.A.; Elzaki, M.E.A.; Yan, Q.; Dong, S.L. Functional characterization of pheromone receptors in the moth Athetis dissimilis (Lepidoptera: Noctuidae). Pestic. Biochem. Physiol. 2019, 158, 69–76. [Google Scholar] [CrossRef] [PubMed]
- Choo, Y.M.; Xu, P.X.; Hwang, J.K.; Zeng, F.F.; Tan, K.M.; Bhagavathy, G.; Chauhan, K.R.; Leal, W.S. Reverse chemical ecology approach for the identification of an oviposition attractant for Culex quinquefasciatus. Proc. Natl. Acad. Sci. USA 2018, 115, 714–719. [Google Scholar] [CrossRef] [PubMed]
- Du, L.X.; Liu, Y.; Zhang, J.; Gao, X.W.; Wang, B.; Wang, G.R. Identification and characterization of chemosensory genes in the antennal transcriptome of Spodoptera exigua. Comp. Biochem. Physiol. D Genom. Proteom. 2018, 27, 54–65. [Google Scholar] [CrossRef] [PubMed]
- Guo, M.B.; Chen, Q.Y.; Liu, Y.; Wang, G.R.; Han, Z.J. Chemoreception of Mouthparts: Sensilla Morphology and Discovery of Chemosensory Genes in Proboscis and Labial Palps of Adult Helicoverpa armigera (Lepidoptera: Noctuidae). Front. Physiol. 2018, 9, 970. [Google Scholar] [CrossRef]
- Shiraiwa, T. Multimodal Chemosensory Integration through the Maxillary Palp in Drosophila. PLoS ONE 2008, 3, e2191. [Google Scholar] [CrossRef]
- Xu, H.Z.; Guo, M.; Yang, Y.; You, Y.W.; Zhang, L. Differential expression of two novel odorant receptors in the locust (Locusta migratoria). BMC Neurosci. 2013, 14, 50. [Google Scholar] [CrossRef][Green Version]
- Wang, Z.F.; Yang, P.C.; Chen, D.F.; Jiang, F.; Li, Y.; Wang, X.H.; Kang, L. Identification and functional analysis of olfactory receptor family reveal unusual characteristics of the olfactory system in the migratory locust. Cell. Mol. Life Sci. 2015, 72, 4429–4443. [Google Scholar] [CrossRef]
- Hu, P.; Gao, C.L.; Tao, J.; Lu, P.F.; Luo, Y.Q.; Ren, L.L. Sensilla on six olfactory organs of male Eogystia hippophaecolus (Lepidoptera: Cossidae). Microsc. Res. Tech. 2018, 81, 1059–1070. [Google Scholar] [CrossRef]
- Benton, R. Molecular Basis of Odor Detection in Insects. In International Symposium on Olfaction and Taste; Finger, T.E., Ed.; New York Academy of Sciences: New York, NY, USA, 2009; Volume 1170, pp. 478–481. [Google Scholar]
- Liu, Y.P.; Liu, Y.; Jiang, X.C.; Wang, G.R. Cloning and functional characterization of three new pheromone receptors from the diamondback moth, Plutella xylostella. J. Insect Physiol. 2018, 107, 14–22. [Google Scholar] [CrossRef]
- Groot, A.T.; Horovitz, J.L.; Hamilton, J.; Santangelo, R.G.; Schal, C.; Gould, F. Experimental evidence for interspecific directional selection on moth pheromone communication. Proc. Natl. Acad. Sci. USA 2006, 103, 5858–5863. [Google Scholar] [CrossRef]
- Shin, W.H.; Kim, J.K.; Kim, D.S.; Seok, C. GalaxyDock2: Protein-Ligand Docking Using Beta-Complex and Global Optimization. J. Comput. Chem. 2013, 34, 2647–2656. [Google Scholar] [CrossRef] [PubMed]
- Hsin, K.Y.; Ghosh, S.; Kitano, H. Combining Machine Learning Systems and Multiple Docking Simulation Packages to Improve Docking Prediction Reliability for Network Pharmacology. PLoS ONE 2013, 8, e83922. [Google Scholar] [CrossRef] [PubMed]
- Fang, Y.L.; Sun, J.H.; Zhao, C.H.; Zhang, Z.N. Sex pheromone components of the sandthorn carpenterworm, Holcocerus hippophaecolus. J. Chem. Ecol. 2005, 31, 39–48. [Google Scholar] [CrossRef] [PubMed]
- Xu, D.; Tsai, C.J.; Nussinov, R. Hydrogen bonds and salt bridges across protein-protein interfaces. Protein Eng. 1997, 10, 999–1012. [Google Scholar] [CrossRef]
- Mandel-Gutfreund, Y.; Schueler, O.; Margalit, H. Comprehensive analysis of hydrogen bonds in regulatory protein DNA-complexes: In search of common principles. J. Mol. Biol. 1995, 253, 370–382. [Google Scholar] [CrossRef]
- Coulocheri, S.A.; Pigis, D.G.; Papavassiliou, K.A.; Papavassiliou, A.G. Hydrogen bonds in protein-DNA complexes: Where geometry meets plasticity. Biochimie 2007, 89, 1291–1303. [Google Scholar] [CrossRef]
- Xu, L.; Jiang, H.B.; Yu, J.L.; Pan, D.; Tao, Y.; Lei, Q.; Chen, Y.; Liu, Z.; Wang, J.J. Two odorant receptors regulate 1-octen-3-ol induced oviposition behavior in the oriental fruit fly. Commun. Biol. 2023, 6, 176. [Google Scholar] [CrossRef]
Disclaimer/Publisher’s Note: The statements, opinions and data contained in all publications are solely those of the individual author(s) and contributor(s) and not of MDPI and/or the editor(s). MDPI and/or the editor(s) disclaim responsibility for any injury to people or property resulting from any ideas, methods, instructions or products referred to in the content. |
© 2025 by the authors. Licensee MDPI, Basel, Switzerland. This article is an open access article distributed under the terms and conditions of the Creative Commons Attribution (CC BY) license (https://creativecommons.org/licenses/by/4.0/).