Article

Study on Small-Scale Forest Fire Risk Zoning Based on Random Forest and the Fuzzy Analytic Network Process

College of Forestry, Fujian Agriculture and Forestry University, Fuzhou 350002, China
*
Author to whom correspondence should be addressed.
These authors contributed equally to this work.
Forests 2025, 16(1), 97; https://doi.org/10.3390/f16010097
Submission received: 22 November 2024 / Revised: 25 December 2024 / Accepted: 7 January 2025 / Published: 9 January 2025
(This article belongs to the Section Natural Hazards and Risk Management)

Abstract

:
Forest fire risk mapping is an essential measure for forest fire management. Quickly and precisely assessing forest fire risks, rationally planning fire risk zones, and scientifically allocating firefighting resources are of great significance for mitigating the increasingly severe threat of forest fires. This study utilized the random forest (RF) algorithm and the Fuzzy Analytic Network Process (FANP) to conduct a forest fire risk-zoning study in the protection and development belt of Wuyishan National Park. The findings revealed that some areas in the western and southern parts of this region have relatively high fire risk levels. Particularly, forest fire prevention and control in the western area need to be strengthened to prevent potential hazards to Wuyishan National Park. The accuracy of the FANP model was as high as 88.5%; areas with fire risk levels of grade 3 and above could control 98.44% of forest fires, and the proportion of areas with fire risk levels of grade 4 and above was 33.41%, which could control 65.63% of forest fires. This finding indicates that the FANP has preferable applicability in small-scale forest fire risk zoning and can offer more reliable decision-making support and reference basis for regional forest fire management.

1. Introduction

Forest fires, as a highly destructive natural disturbance, not only cause long-term damage to the ecological environment but also exert profound influences on human society and the economy [1,2]. As climate change intensifies, the frequency and intensity of forest fire occurrences are on the rise, presenting unprecedented threats to global forest resources and ecosystems [3,4,5]. Against this backdrop, timely and accurate assessment of fire risks, rational planning of fire risk areas, and scientific allocation of firefighting resources have become crucial strategies for mitigating the forest-fire threats brought about by climate change [6]. However, the majority of current fire risk-zoning studies have been focused on medium to large spatial scales [7,8], with limited research on small-scale regions [9]. Yet certain small-scale areas hold significant ecological value and demand robust wildfire prevention and control measures. Therefore, selecting appropriate fire risk-zoning methods for these targeted small-scale regions and conducting fine-scale fire risk zoning, mapping, and decision analysis can enable precise risk prediction and response. This approach serves as a crucial measure in mitigating fire losses, safeguarding the ecological environment, and maintaining societal security [10].
In response to the escalating threat of forest fires under climate change, scientific methods for forest fire risk assessment are of particular significance. In recent years, machine learning approaches have witnessed rapid development. These methods can handle high-dimensional data promptly and effectively. Hence, some scholars have applied them in forest fire risk assessment studies and demonstrated relatively high accuracy in various regions [11,12,13]. The random forest algorithm (RF), as a typical representative of machine learning, has a lower computational cost compared to other machine learning models. It can effectively estimate and handle missing values, thereby guaranteeing model accuracy and avoiding overfitting. Moreover, it can effectively address collinearity among variables [14]. Its excellent learning performance has been highlighted in comparisons to traditional statistical models, and its accuracy in forest fire risk assessment research has been widely validated [15]; research conducted by Milanovic has shown that RF models have demonstrated outstanding predictive capabilities for forest fires in eastern Serbia, achieving an impressive accuracy rate of 91.7% [16]. Furthermore, Oliveira discovered that RF models could accurately predict more than 93% of wildfires in Mediterranean Europe [17]. Nevertheless, it requires a sufficiently large forest fire dataset to ensure its advantage in predictive accuracy. The “black box” nature of RF leads to limitations in its interpretability, making it challenging to intuitively reveal the specific mechanisms of forest fires [18].
Geographic Information System–Multi-Criteria Decision Analysis (GIS-MCDA), integrating the GIS and MCDA, relies on correlation and information fusion among fire factors, along with referencing of expert knowledge, to provide more accurate forest fire risk assessments in medium and small-scale areas with a shortage of historical active fire data [19,20]. It can offer support for decision-makers in formulating fire prevention and emergency response measures. Nevertheless, its application in forest fire risk assessment within China remains relatively limited. Among the commonly employed MCDA methods, the Analytic Hierarchy Process (AHP) is one, while the Analytic Network Process (ANP), as a variant of the AHP, has shown outstanding performance in reducing errors within the AHP method [21]. However, its application in the field of forest fire risk assessment is still rather restricted. Simultaneously, the results of MCDA are highly dependent on the decisions and evaluations provided by experts, and this subjectivity constitutes the primary source of uncertainty in the MCDA process. Moreover, forest fire risk is an ambiguous concept involving the comprehensive assessment of multiple factors [22,23], including meteorological factors, vegetation conditions, terrain, human activity factors, and so on. The combination and interrelationships of these factors make the evaluation of forest fire risk complex and difficult to determine through straightforward criteria. The weights and contributions of each factor may also vary with the natural environment, resulting in uncertainty in fire risk assessment results. To handle this ambiguous situation, researchers have introduced the concept of fuzzy logic [24]. Fuzzy logic enables the utilization of fuzzy concepts and ranges to represent uncertain factors and handle fuzzy and uncertain information through membership functions and fuzzy sets. By integrating multiple fire risk factors to achieve overlap in the feature space, comprehensive and objective analysis and evaluation of the influence of fire risk factors on forest fires can be achieved [25].
The protection and development belt of Wuyishan National Park, as an important small-scale ecological conservation area, has extremely high demand for forest fire prevention and control. Timely forest fire risk assessment and precise fire risk-zoning maps can provide favorable support for this requirement. Therefore, this study aims to compare the applicability of RF and the FANP in the research of forest fire risk zoning in the protection and development belt of Wuyishan National Park. The goal is to provide scientific references for the selection of small-scale fire risk-zoning methods and to offer scientific solutions for forest fire management in important ecological conservation areas. Next, we will provide an overview of this study from the perspectives of Section 2, Materials and Methods; Section 3, Results; Section 4, Discussion; and Section 5, Conclusions.

2. Materials and Methods
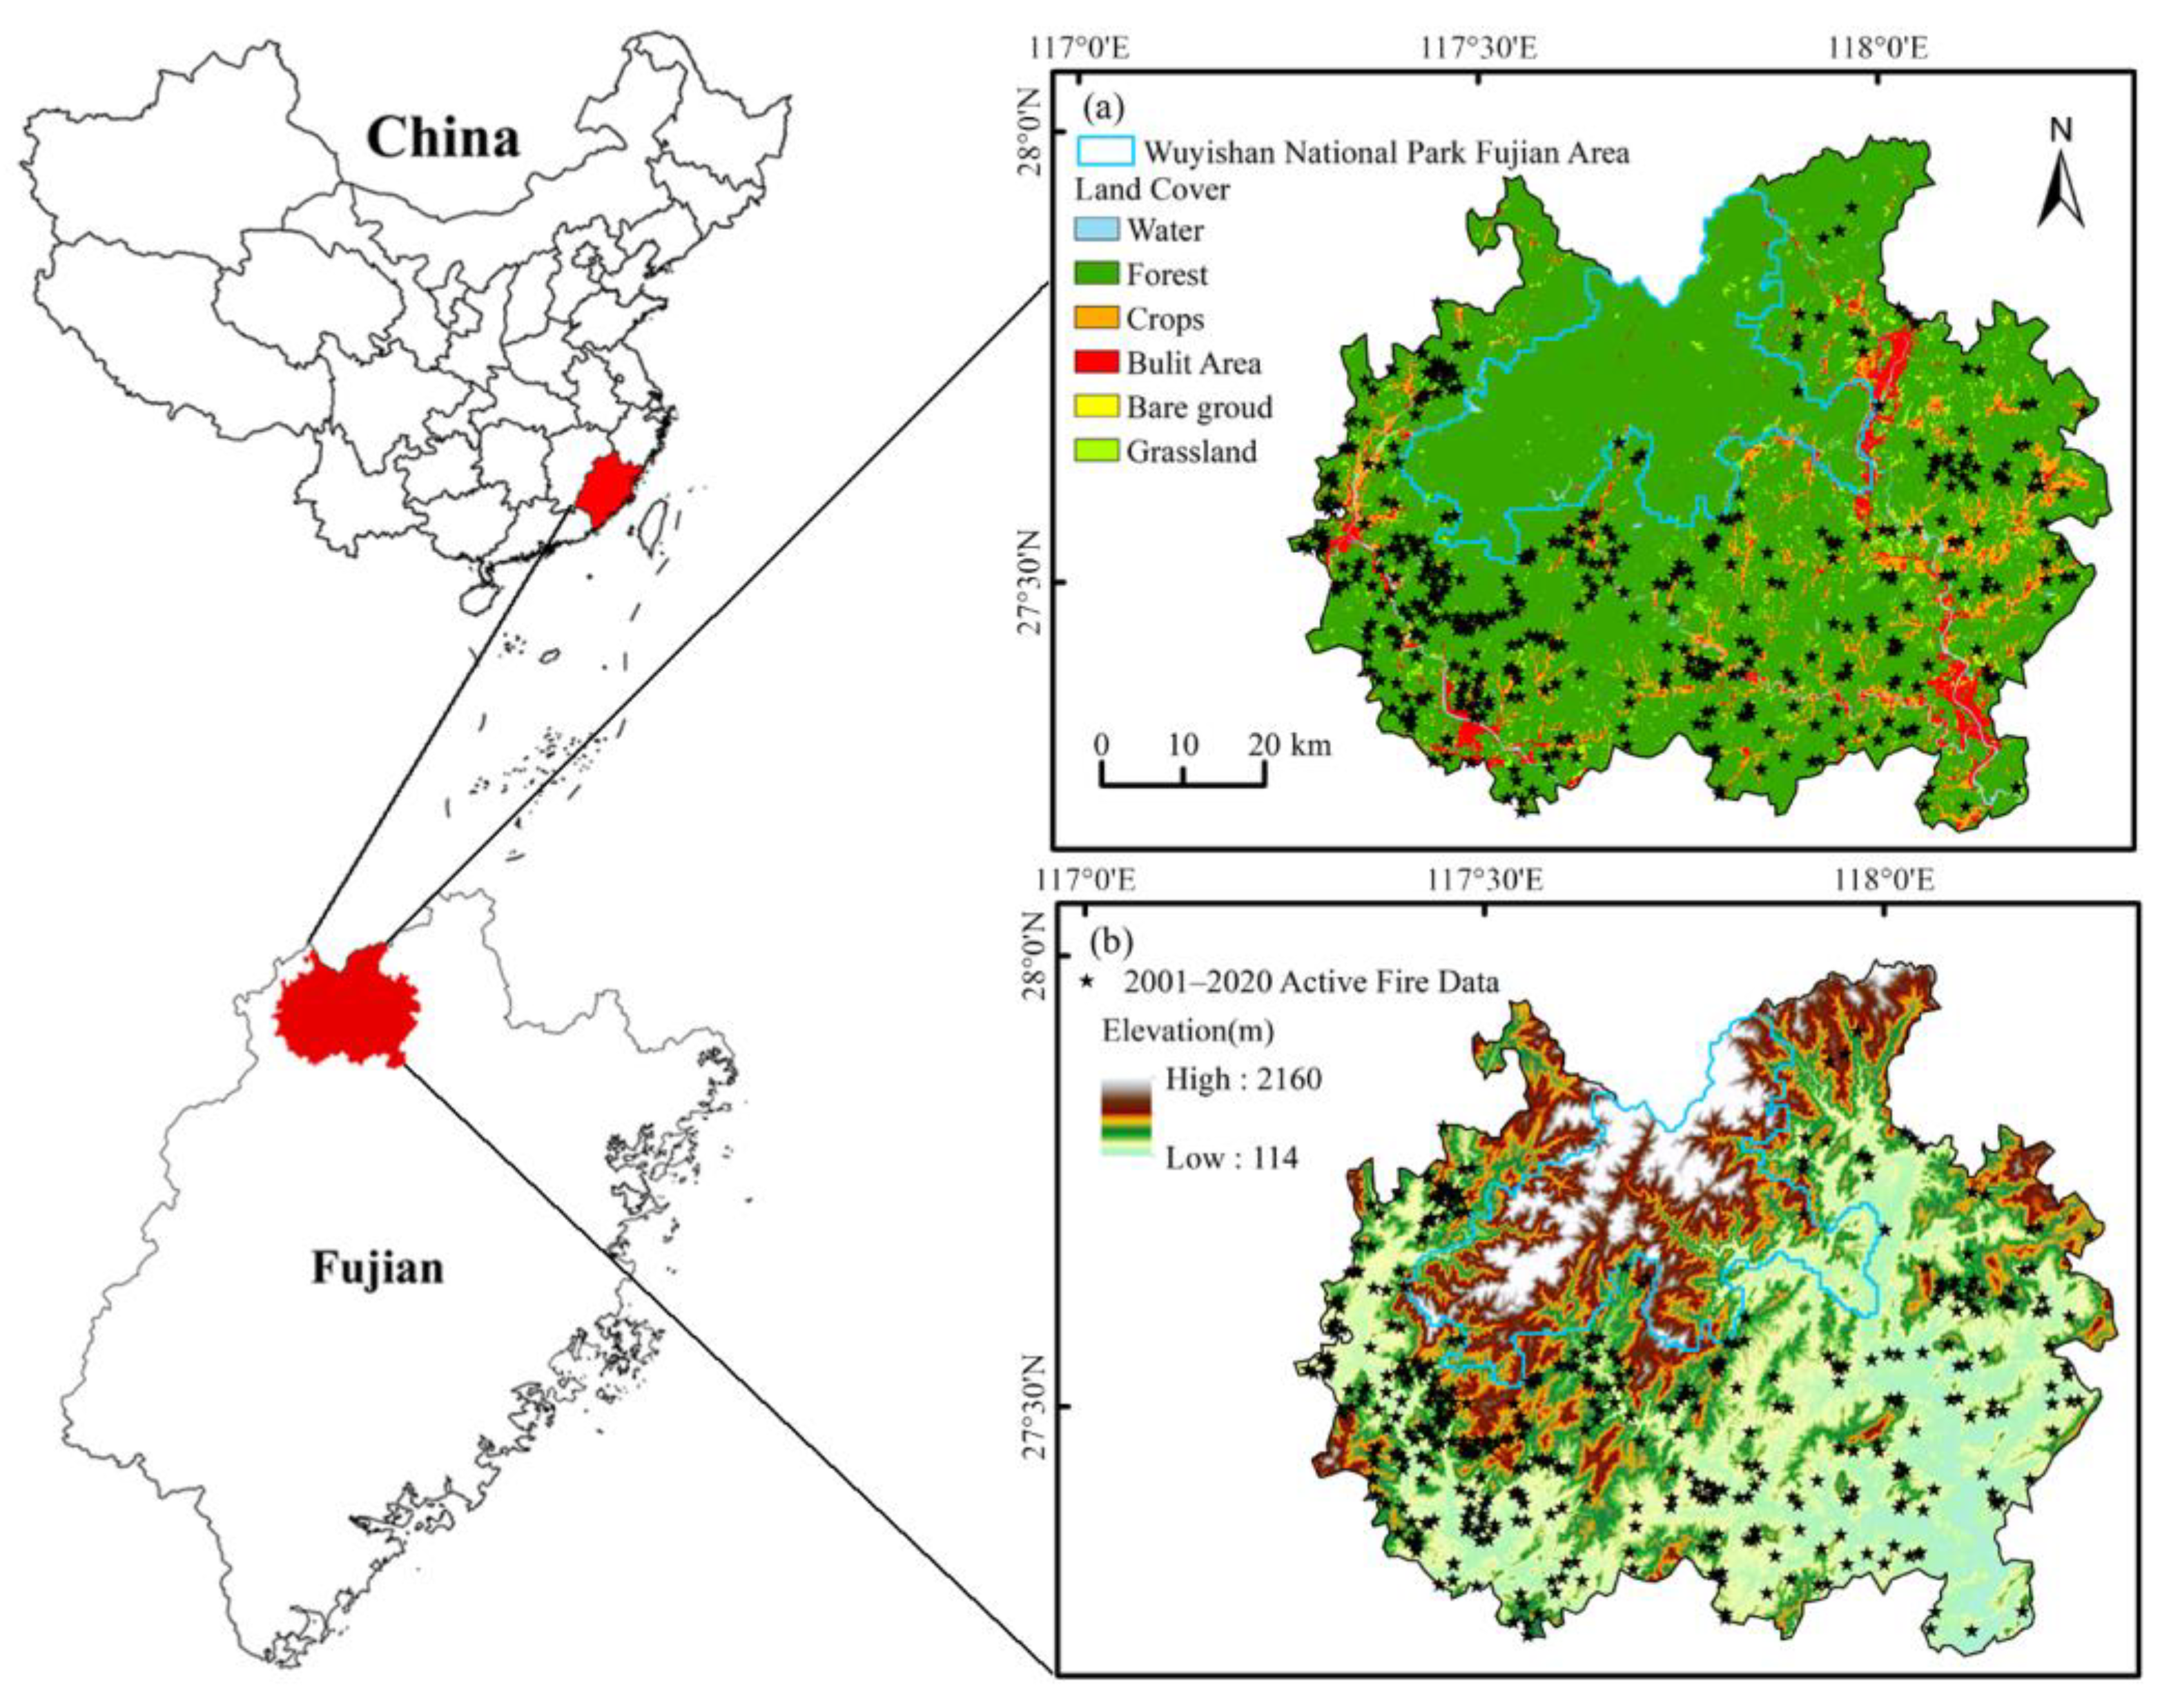
2.1. Study Area

The protection and development belt of Wuyishan National Park is situated in Nanping City and is characterized by a mid-subtropical monsoon climate, encompassing an area of 4250 km2 (Figure 1). This area is centered around Wuyishan National Park, renowned for its dual status as a World Natural and Cultural Heritage site. The annual average temperature approximates 17 °C to 19 °C, the annual average precipitation ranges from 1684 to 1780 mm, and the annual average relative humidity is as high as 78%. This park is also a World Biosphere Reserve. Within the Fujian Province (1001.41 km2), 261 families and 2866 species of higher plants and 690 species of wild vertebrate animals belonging to 5 classes, 37 orders, 148 families, and 420 genera have been recorded [26]. The protection and development belt of Wuyishan National Park is primarily divided into protection coordination areas and development integration areas, with areas of 1010 km2 and 3240 km2, respectively. The area of Wuyishan National Park within Fujian Province constitutes the key protected area, while the remaining protection coordination areas function as buffer zones. The development integration areas are the transitional zones, and the area outside the Protection and Development Belt within the administrative region of Nanping City is the radiation expansion area, with zoning control implemented [27].

2.2. Data Source

By consulting the opinions of regional experts and referring to the relevant literature [10,15,28,29,30,31], in combination with the standard selection rules of MCDA [32], the ultimately determined impact factors were classified into three categories. These categories were environmental factors (wind speed, rainfall, maximum temperature, relative humidity, Normalized Difference Vegetation Index (NDVI), distance to rivers, and land cover), human activity factors (distance to settlements, distance to roads), and terrain factors (slope, aspect, and altitude), and the specific data sources are presented in Table 1.

2.3. Data Processing

Wind speed, relative humidity, precipitation, and maximum temperature vector point data were subjected to spatial interpolation via the Kriging method (set the resolution to 50 m while keeping the other parameters at their default settings) to generate raster data. The distances to settlements and roads were derived using the Euclidean distance tool in ArcGIS 10.2 with the aid of the boundary vector map of the protection and development belt of Wuyishan National Park as well as the data of settlements and roads. The variations in the slope, aspect, and altitude of the terrain were analyzed by leveraging the DEM data. The NDVI raster layer was classified using the natural break classification (Jenks classification) approach, while the remaining data layers were categorized using the equal interval method, ultimately obtaining the grade layers of the forest fire risk factors.
This research utilized the MODIS Collection 6.1 hotspots in the protection and development belt of Wuyishan National Park from 2001 to 2020 for this forest fire risk-zoning study. To enhance the accuracy, credibility, and validity of the data in this research, high-confidence hotspots (80 < confidence ≤ 100) in the study areas were selected, and hotspots within 24 h and with a distance of less than 1 km were excluded. Only the earliest hotspots were retained, resulting in 428 hotspots for the protection and development belt of Wuyishan National Park. Each reliable hotspot was regarded as a fire incident [31]. Since the occurrence of a forest fire was a binary classification issue, the data were required to be in a binomial distribution format. Based on the experience of predecessors, approximately a 1:1 quantity ratio of random points (non-active fire data) was generated using ArcGIS 10.2 software [33], and the associated burned-area data spanning from 2001 to 2020 were extracted. Random points situated within the burned area were meticulously scrutinized by juxtaposing their temporal occurrences with the corresponding burned-area data. In instances where temporal synchrony was identified between the random points and the burned area incidents, the respective random points were systematically eliminated to safeguard against the inclusion of active fire data. Conversely, the residual random points were duly preserved for further analysis. Active fire data were assigned a value of 1, and random points were assigned a value of 0. The generation of random points was completely random in both time and space, with 429 random points selected; 70% of the active fire data and random points were utilized for fire risk modeling, and the remaining 30% were employed for model validation [31]. Finally, the active fire data, the random points, and all fire risk factor layers were imported into the GIS database.

2.4. Methods

2.4.1. Random Forest Algorithm

  • Basic principles
In the original data, we let there be n pieces of forest fire data and m fire risk factors. The bootstrap resampling technique was utilized to randomly sample n t r e e samples of size n from the n forest fire data with replacement, thereby constructing n t r e e classification tree sets. At each node of each classification tree, m t r y ( m t r y   m ) fire risk factors were randomly chosen and the variable with the greatest classification ability was selected for branching. Each tree was permitted to grow to its fullest extent without any pruning. The n t r e e classification trees thus generated constituted the random forest, and the mode of the classification results of the n t r e e trees was regarded as the classification result of the random forest algorithm. The samples not selected in each bootstrap resampling formed the n t r e e out-of-bag (OOB) data, serving as the test samples for the random forest algorithm [22].
During the establishment of the random forest algorithm, n t r e e and m t r y were the two most critical user-defined parameters. Experiments conducted by Liaw et al. (2002) indicated that m t r y = m was a preferable option, while for the setting of n t r e e , it only required that the overall error rate of the forest tended to stabilize [34]. Based on this, in this paper, the value of m t r y = m and the value of n t r e e was set to 100.
  • Importance evaluation
The random forest algorithm is capable of assessing the importance of feature variables. The fundamental idea is as follows: For variable x j , the out-of-bag error rate, e r r O O B t , was initially calculated for the corresponding out-of-bag data, O O B t , for each tree,   t . Subsequently, the value of variable x j in the out-of-bag data was randomly altered while keeping all other variables unchanged, and the e e r O O B t j ~ of the O O B t j ~ was re-computed after the sequence change. The significance of a certain feature variable could be estimated by analyzing the increase in the out-of-bag error when the sequence of the out-of-bag data was changed [22].
The importance score of variable x j is
V I ( X j ) = 1 n t r e e t ( O O B t j ~ e r r O O B t )

2.4.2. Fuzzy Analytic Network Process

  • Fuzzy logic
Fuzzy logic can serve as a mathematical basis and be applied in numerous fuzzy and imprecise variables and systems, providing a foundation for reasoning, interpretation, control, and decision-making under uncertain circumstances. In the study of forest fires, the uncertainties of natural and human factors, as well as the complexity of the forest ecosystem, result in the complexity and uncertainty of fire risk factors and forest fires. For instance, different levels of rainfall, temperature, and wind speed domains exert varying degrees of influence on forest fire risk. Fuzzy logic can better analyze the impact of fire risk factors on forest fires based on regional characteristics [12]. Meanwhile, the fuzzy classification method has no fixed range or threshold, allowing pixels or segments to gradually belong to one or more categories. That is, pixels or segments can have fuzzy membership degrees and may belong to multiple categories, which can overlap in the feature space. The fire risk factor layers of the study area were combined with historical active fire data. The NDVI layer was classified into five levels using the natural breakpoint classification (Jenks classification) method, and the remaining standard layers were classified using the equal interval method to obtain the sub-standards of all fire risk factors. Subsequently, the fuzzy membership function was employed to calculate the fuzzy membership values of the sub-standards and map them to each standard layer to obtain the fuzzy layer. This membership value mapped the importance of the sub-standards to a value between 0 and 1, which was used to measure the importance of the sub-standards in the occurrence of forest fires. The larger the value, the deeper the degree of influence.
The frequency ratio of the sub-standards was calculated using the following frequency ratio formula:
F R i j = N i j / N S i j / S
where i denotes the influence factor; j represents the classification of the influence factor; F R i j is the frequency ratio of the j th grade of the i th influence factor; N i j is the number of active fire data of the j th grade of the i th influence factor; N is the total number of active fire data in the study area; S i j is the number of grids of the j th grade of the i th influence factor; and S is the total number of grids in the study area.
The frequency ratio was normalized to obtain the fuzzy membership values, and the formula is as follows:
u i j = F R i j / m a x i ( F R i j )
where u i j represents the fuzzy membership value of the j th grade of the i th influence factor.
  • Analytic Network Process
The ANP is a decision-making method, suitable for complex structures, developed on the basis of the AHP [35]. In the research of forest fire risk assessment, the ANP is closer to reality and more reasonable than the AHP and can yield more reliable results [36].
When establishing the ANP for forest fire risk using SuperDecisions 3.2 software, it was necessary to consider the independence, correlation, and feedback among the fire risk factors; divide the factors into the control layer and the network layer; and construct the correlation network among the factors. When comparing the dominance of indicators, a judgment matrix needs to be formed as input data. For cases where elements are independent of each other, direct dominance can be used for comparison, while for cases where elements are interdependent, indirect dominance should be used for comparison. In this study, the 1–9 scale method was employed to represent the strength of the influence of two elements under a given criterion. The consistency index (Consistency Ratio, CR) was used to test the judgment matrix to ensure that the CR values of all matrices in this model were less than 0.1. Next, the initial super matrix, weighted super matrix, and limit matrix were calculated through the SuperDecisions software, and the column vectors of the limit matrix represented the final weight of each fire risk factor [37].

2.5. Verification of Forest Fire Risk Map

The accuracies of different forest fire risk models were analyzed and compared through the Receiver Operating Characteristic (ROC) curve [38]. The ROC curve is a graphical technique used for examining the trade-off between specificity and sensitivity, where the x-axis represents the false positive rate (FPR) and the y-axis represents the true positive rate (TPR). The ROC curve represents the trade-off between the two rates. The optimal result of model verification is to have the highest area under the curve (AUC) score. The quantitative and qualitative relationship between the AUC and prediction accuracy can be classified as poor, moderate, good, very good, and excellent within the range of 0.5 to 1.0, with an interval of 0.1 [37]. Validation of the model’s actual effectiveness was carried out by using 30% of the active fire data that were not involved in the modeling process as predicted objects. The verification of the forest fire occurrence probability and fire risk level corresponding to these predicted objects was crucial for evaluating the model’s predictive capability for actual active fire data, which was essential for assessing the accuracy and reliability of the proposed risk maps.

3. Results

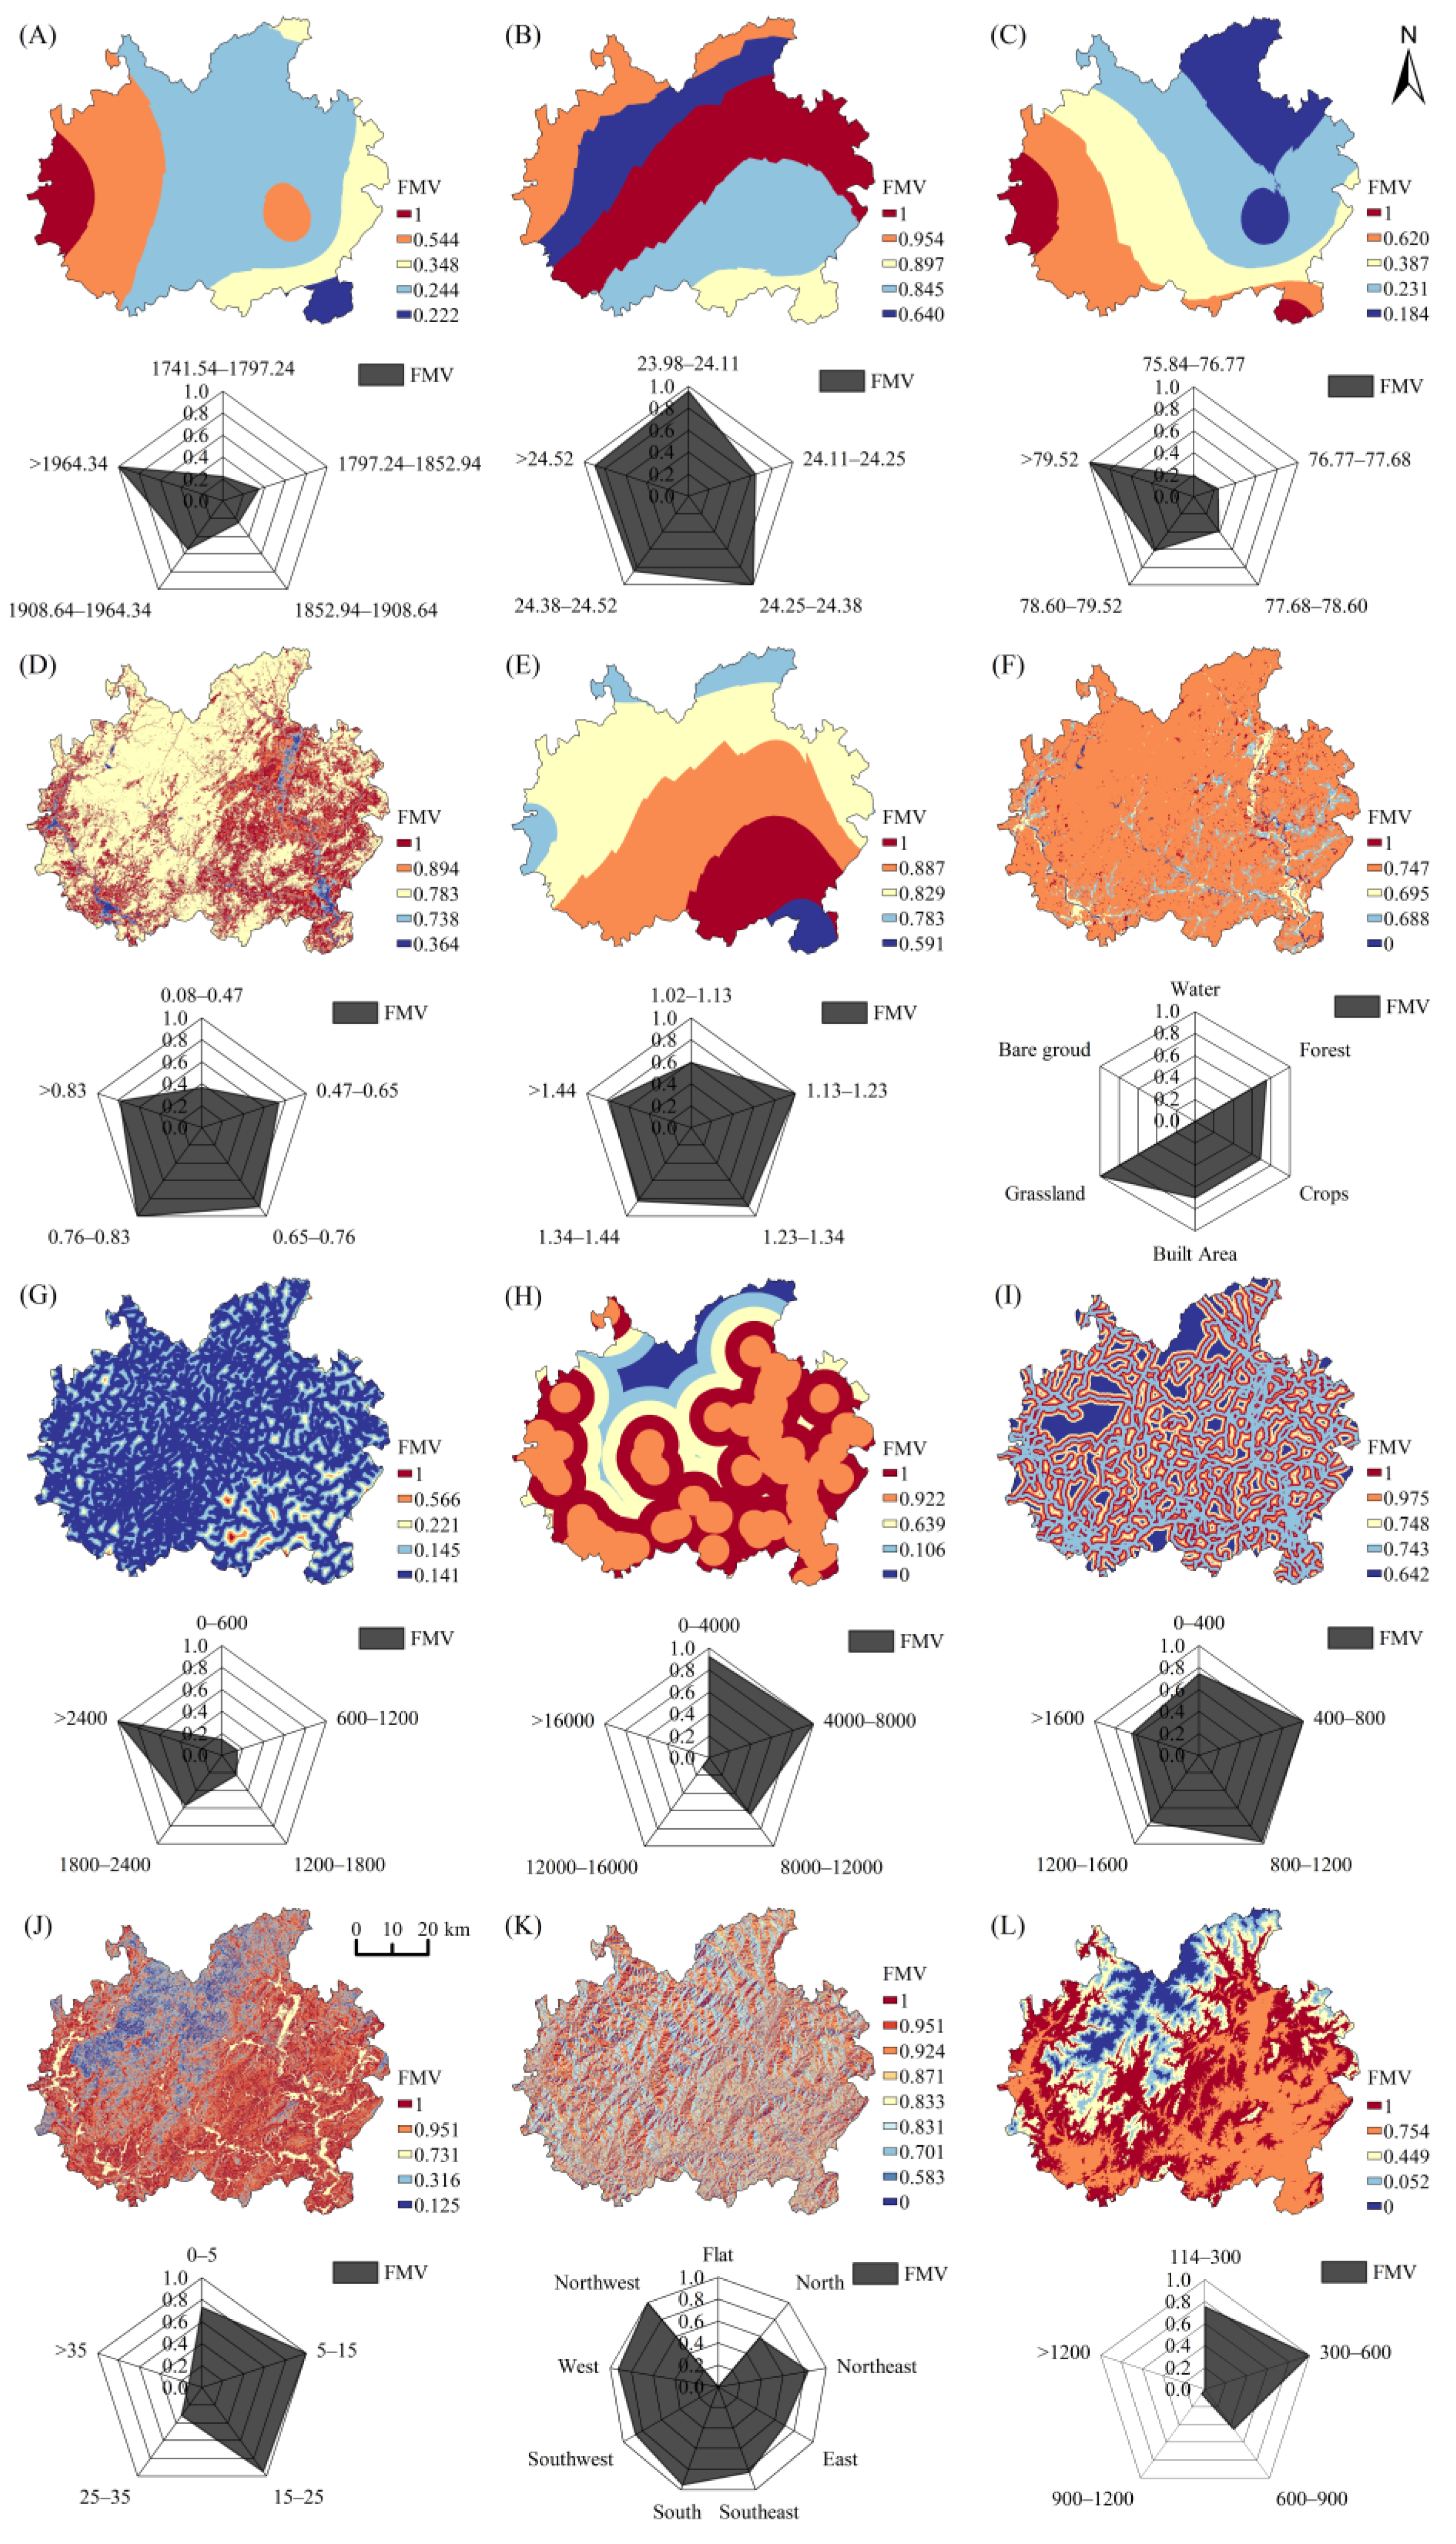
3.1. The Grade Weight of Forest Fire Risk Factors

Through the analysis of the fuzzy membership values of the fire risk factors in the protection and development belt of Wuyishan National Park, and by quantifying the relative importance of each factor grade to the forest fire risk using the fuzzy logic method, the influence of different factors on fire occurrence and their spatial distribution could be effectively revealed (Figure 2). The area with rainfall greater than 1964.34 mm had the highest fuzzy membership value and was distributed in the western part of the study area. The highest temperature grade (24.25–24.38 °C) in the central region had the greatest impact on forest fire occurrence. The areas with high relative humidity (>79.52%), particularly in the western region, had lower fire risk. The area with the lowest NDVI (0.08–0.47) had a lower fire risk, with a fuzzy membership value of 0.364. The areas with low wind speed (1.02–1.13 m·s−1) in the southwestern region and the areas with large slopes (>35°) had smaller impacts on fires. The areas that are farther from rivers (>1200 m) and closer to residential areas (0–8000 m) had higher fire risk, especially the area of 400–1200 m from the road. Judging from the changing trend of the fuzzy membership values of the fire risk factor grades, the influence of rainfall, relative humidity, and distance from the river on forest fire risk showed an overall increasing trend as the fire risk factor grade rose. In contrast, the influence of distance from residential areas and altitude on forest fire occurrence showed a decreasing trend. It is worth noting that there was no obvious pattern in the changes of the remaining factors.

3.2. The Weights of Forest Fire Risk Factors

The forest fires in the protection and development belt of Wuyishan National Park were predominantly and significantly influenced by environmental factors. Among these, rainfall, maximum temperature, and the NDVI assumed relatively considerable weights in both methods. However, the influences of human activity factors and topographic factors were relatively consistent yet relatively less prominent. The human activity factors, such as distance from residential areas and roads, exhibited relatively consistent weights in both approaches. Regarding the topographic factors, the weights of altitude and slope also manifested their influence in the fire risk zoning. In conclusion, although the weights of the individual factors differed significantly in the two methods, the weights of the various factors in the fire risk assessment of the two methods were essentially the same (Table 2).

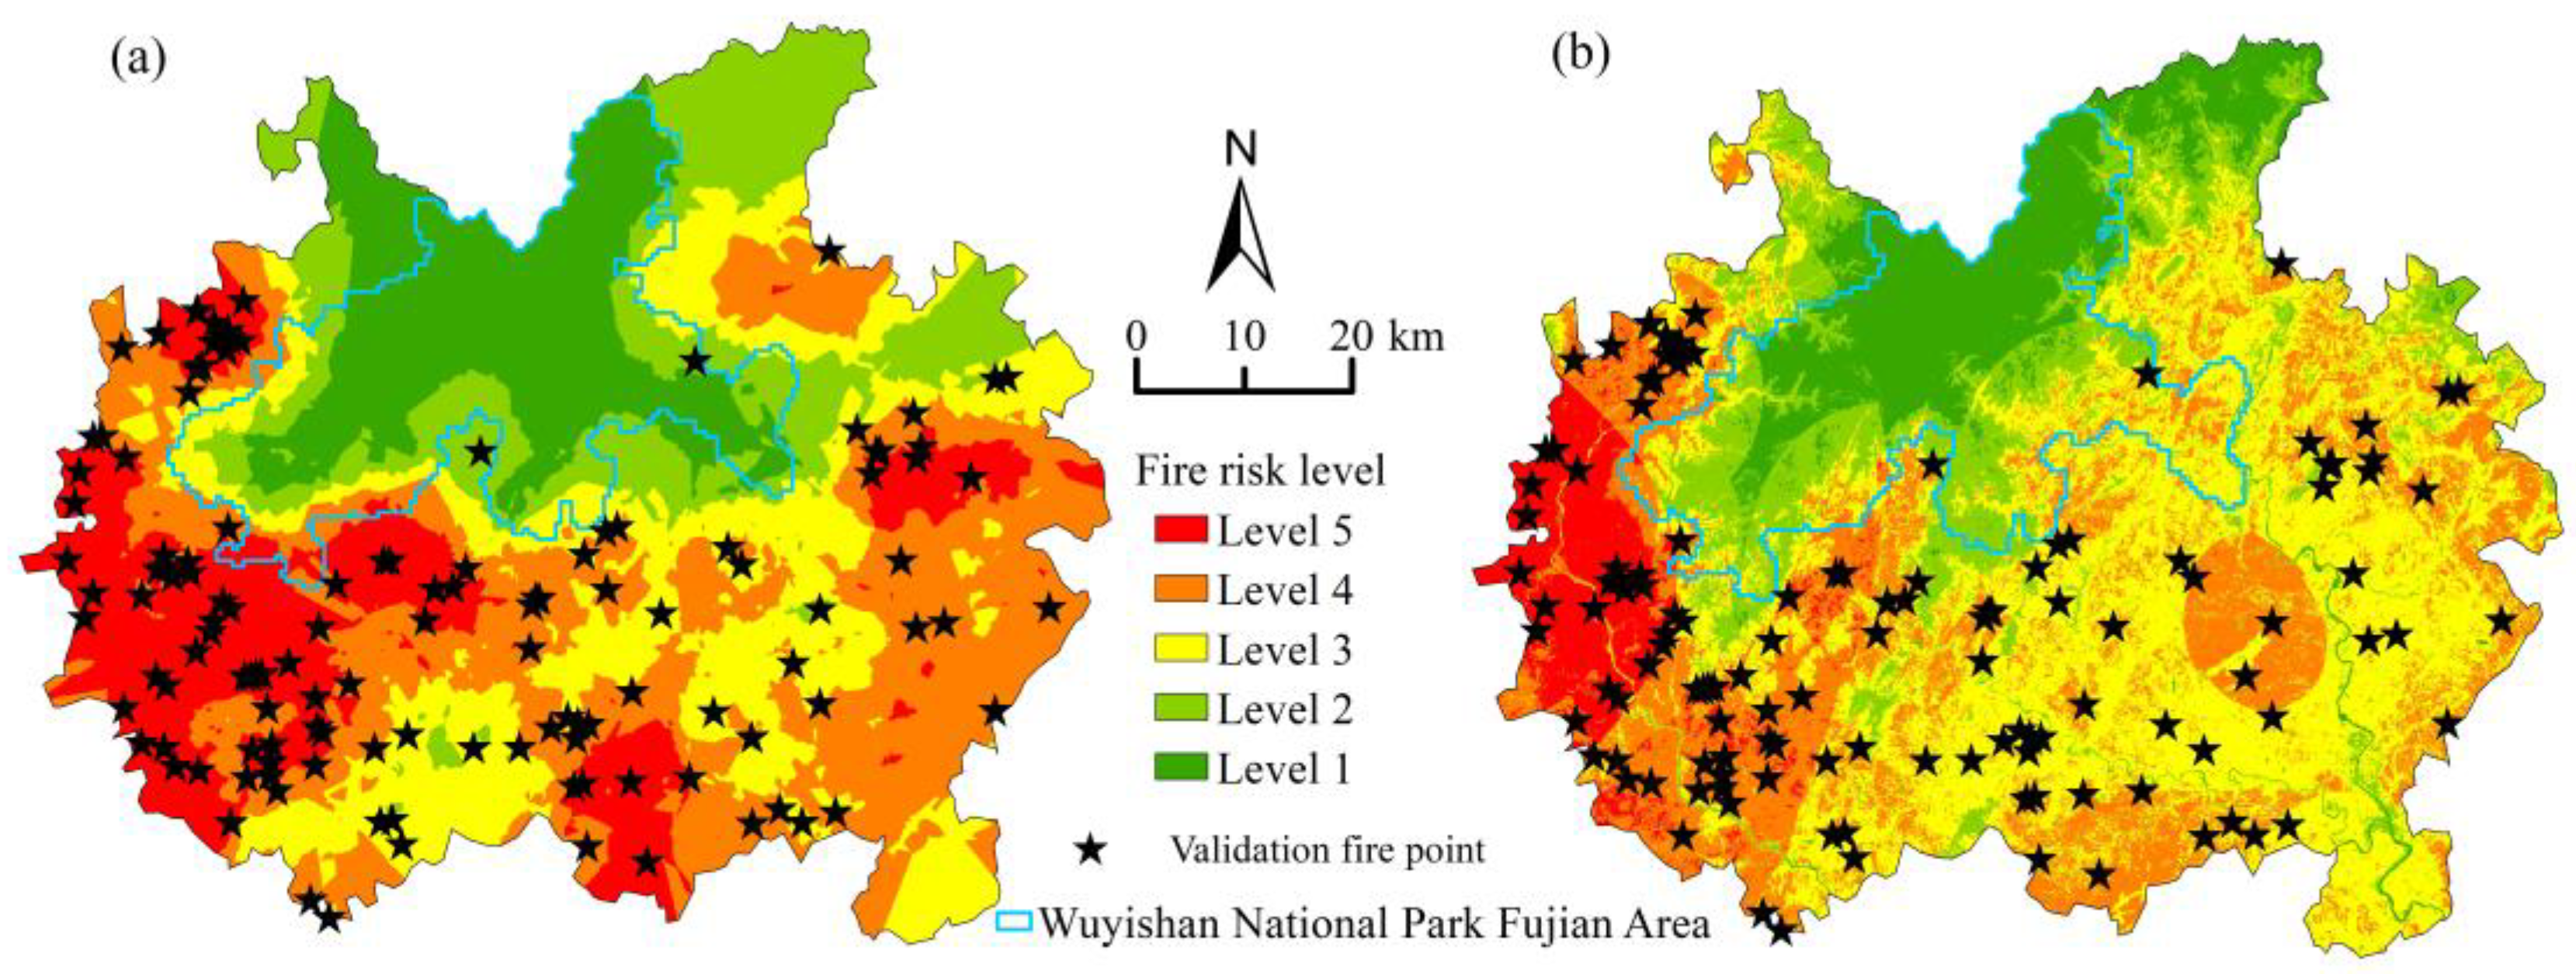
3.3. Construction of the Forest Fire Risk Map

The RF algorithm employed Kriging interpolation in ArcGIS software to interpolate the model prediction results of the training set and construct a forest fire risk map (Figure 3a). The FANP utilized the raster calculator in the ArcGIS software to superimpose the ANP weights and the fuzzy layers of each fire risk factor to construct a forest fire risk map (Figure 3b): forest fire risk map = (0.1771 × fuzzified precipitation) + (0.131 × fuzzified maximum temperature) + (0.0597 × fuzzified relative humidity) + (0.1094 × fuzzified NDVI) + (0.083 × fuzzified wind speed) + (0.1074 × fuzzified land cover) + (0.0223 × fuzzified distance to rivers) + (0.0753 × fuzzified distance to settlements) + (0.0412 × fuzzified distance to roads) + (0.0288 × fuzzified slope) + (0.0586 × fuzzified slope aspect) + (0.1062 × fuzzified elevation).
The forest fire risk map was classified into five risk levels, ranging from 1 to 5, using the natural breaks classification method, representing very low risk, low risk, medium risk, high risk, and very high risk, respectively. Thereby, we obtained the forest fire risk classification map (Figure 3). The area proportions of fire risk levels 1 to 5 in the RF forest were 14.61%, 15.39%, 22.74%, 30.03%, and 17.06%, respectively, while the area proportions of fire risk levels 1 to 5 in the FANP forest were 11.56%, 15.18%, 39.86%, 27.08%, and 6.33% (Figure 4).

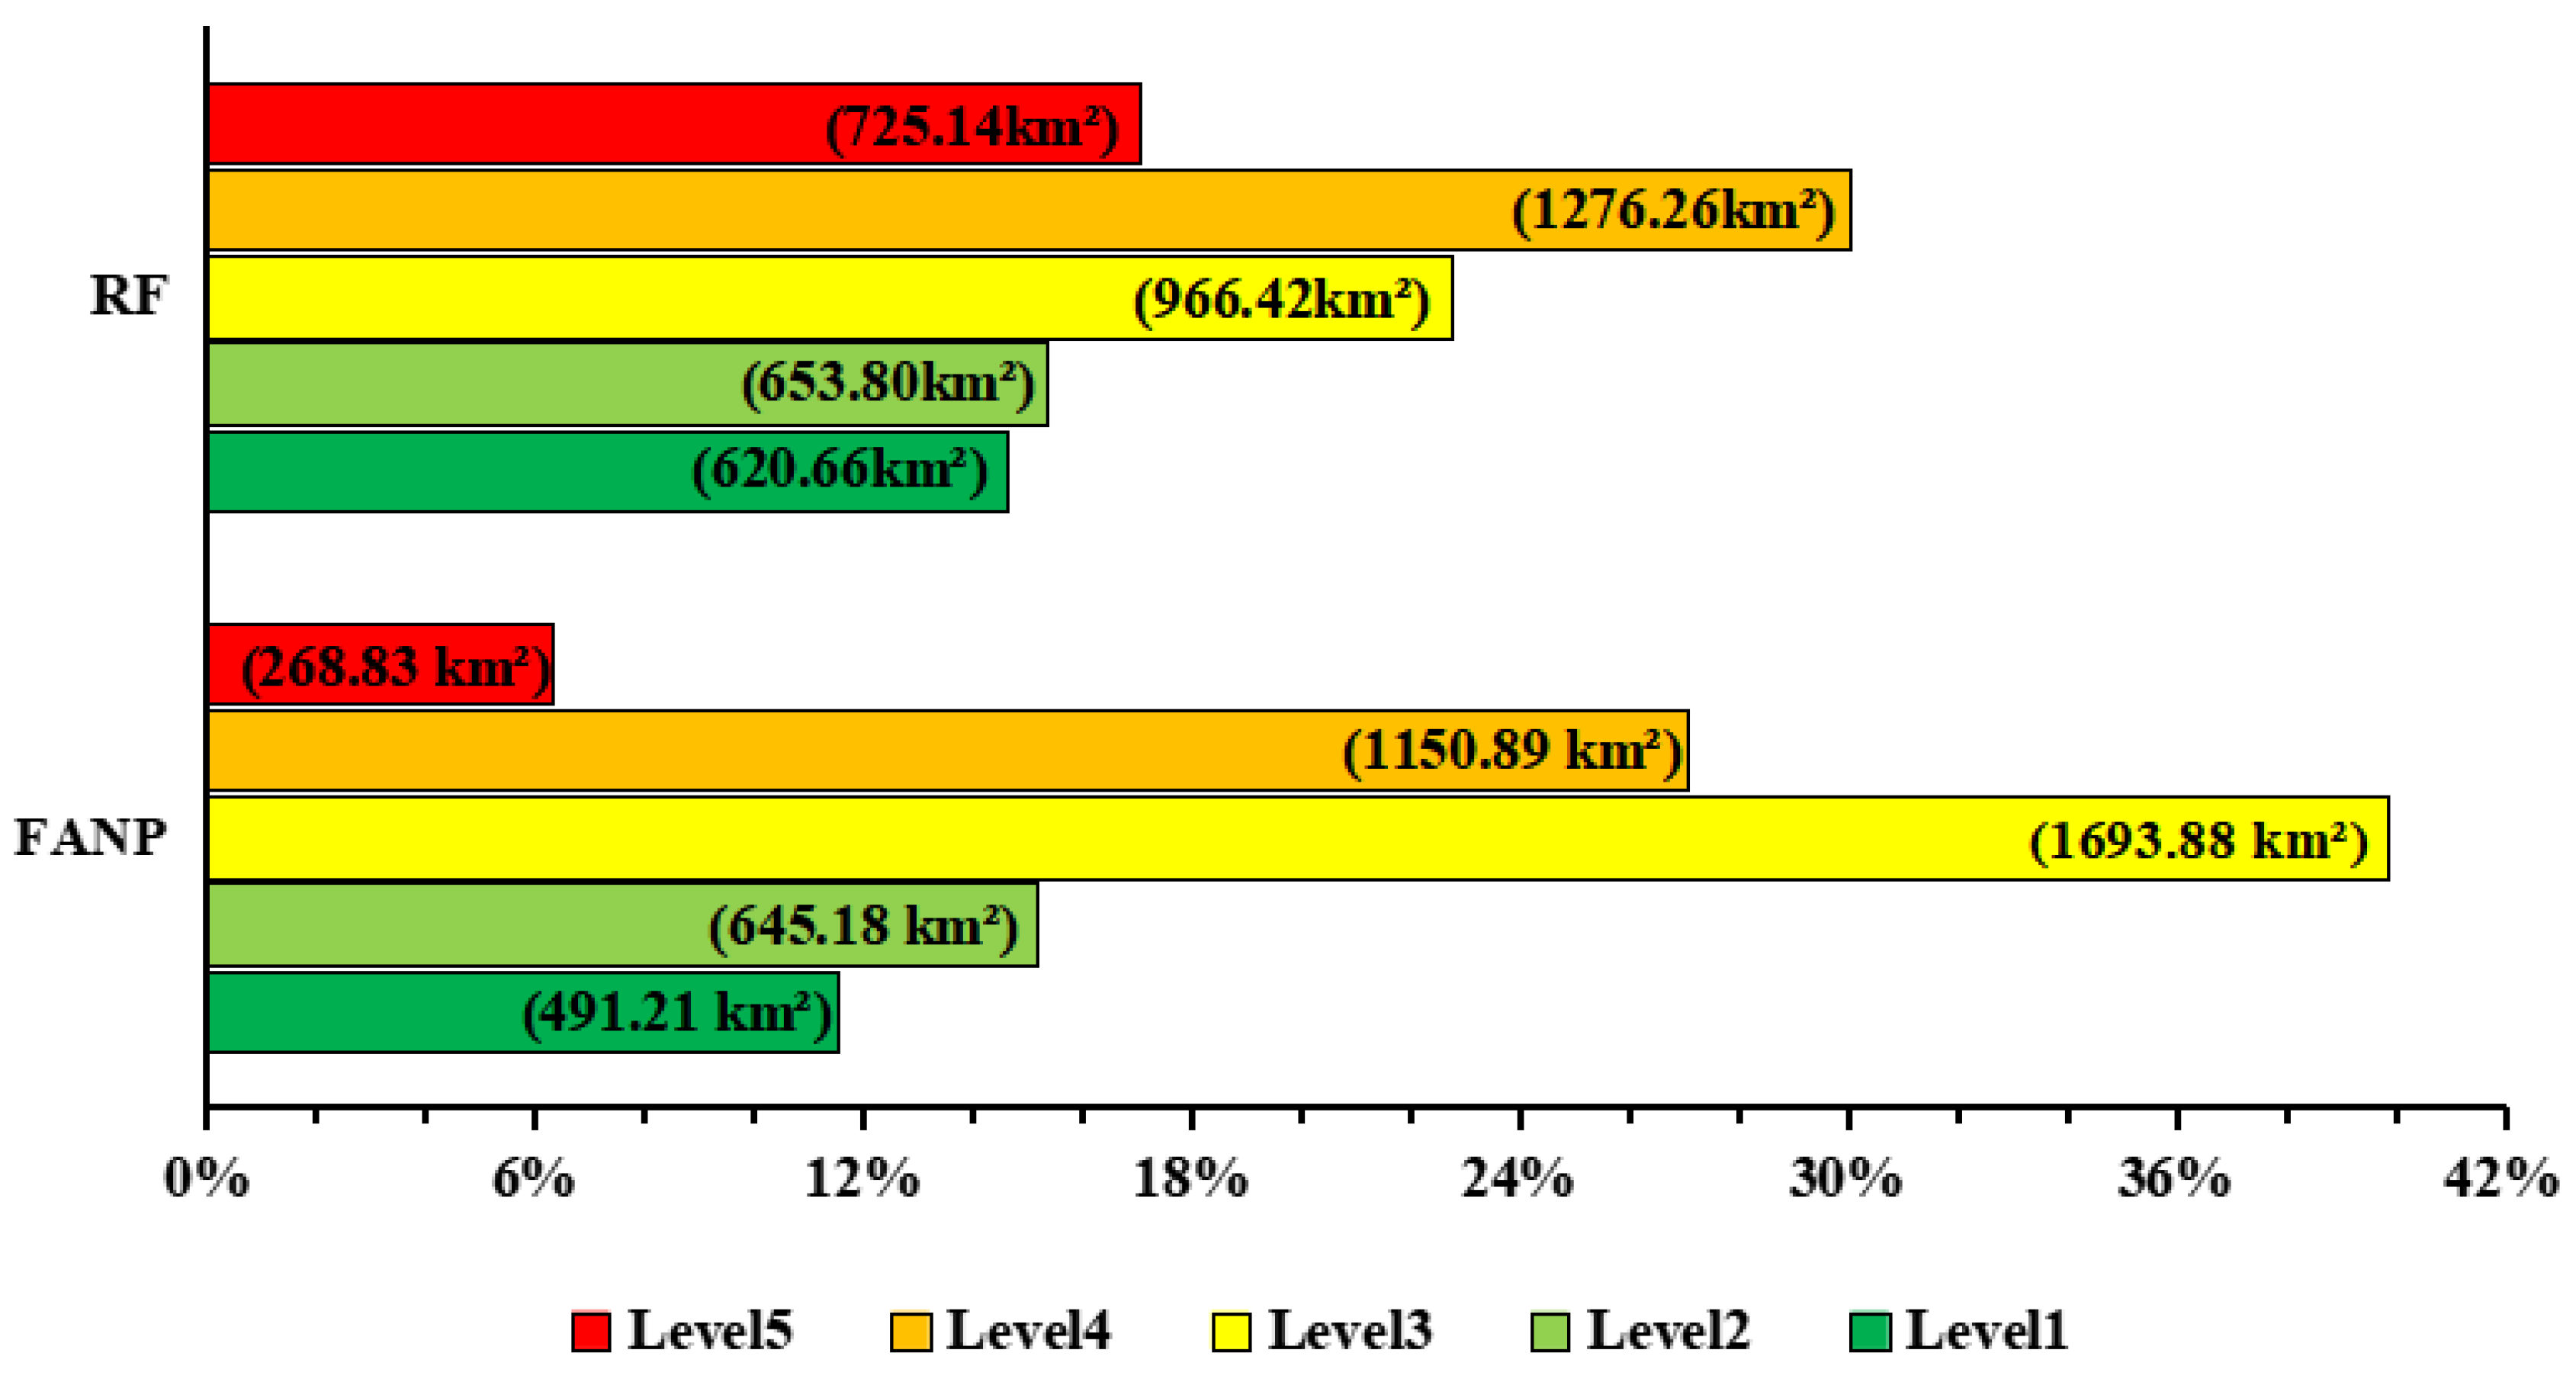
3.4. Assessment of Forest Fire Risk Map

The results presented in Table 3 indicate that the AUC, precision, recall, and F1 scores of the FANP in the protection and development belt of Wuyishan National Park are all greater than those of the RF, suggesting that the FANP demonstrated higher accuracy and predictive capacity in forest fire risk assessment within this region. Concurrently, to validate the application effect of the fire risk classification map, the proportions of the verified active fire data and areas for each fire risk level, along with their ratios, were statistically analyzed. Among them, the ratios could better represent the probability of fire occurrence per unit area in each fire risk level. A higher value implied a greater probability of fire occurrence and could provide more scientific guidance for the allocation of firefighting resources. The outcomes in Table 4 reveal that the majority of the actual data of the FANP in the protection and development belt of Wuyishan National Park were significantly superior to those of the RF algorithm, indicating that the practical application effect of the FANP is more favorable than that of RF.

4. Discussion

This study applied RF and the FANP to assess the forest fire risk in the protection and development belt of Wuyishan National Park, where both methods demonstrated significant value and characteristics. As a powerful machine learning algorithm, RF has attracted considerable attention in fire risk assessment studies worldwide. For instance, research findings have indicated that RF performed well in small-scale fire risk zoning in regions such as Iran’s Firouzabad and Serbia’s Tara National Park [7,38]. Moreover, some studies have utilized RF for large-scale fire risk prediction in areas like Australia, China, and the United States [6,39,40]. The advantages of RF lie in its ability to process large numbers of input variables and its high prediction accuracy and stability, providing strong support for fire risk zoning. On the other hand, the FANP excels in handling uncertainty and complexity and has been used in fire risk studies in regions such as the Noshahr forests and Gachsaran, demonstrating good predictive capabilities in forest fire mapping [37,41]. Compared to the aforementioned study regions, the complexity of the ecosystems and the impact of human activities in China’s national parks often lead to greater uncertainty in fire risk assessments. Furthermore, the protection and development belt of Wuyishan National Park are subject to stricter management controls, and there are differences in management objectives across the regions. Therefore, this study assessed the applicability of both methods by comparing their effectiveness in revealing the mechanisms of forest fire occurrence, model prediction accuracy, practical application outcomes, and management requirements. The FANP employed fuzzy logic statistical methods to quantify the impact of each fire risk factor grade on the occurrence of forest fires, which could better explain the extent of influence of each sub-criterion of the fire risk factors on forest fires [25]. Simultaneously, through the analysis of the fuzzy membership value distribution and radar chart of the fire risk factors, it was possible to observe the influence trends and regional differences of different factors on fire risks (Figure 2). This could better analyze the comprehensive effects of each factor in the forest fire risk assessment and regional characteristics and formulate targeted prevention and control strategies. In contrast, the “black box” characteristic of the random forest algorithm limited its ability to reveal the influence of fire risk factors on the occurrence of forest fires [18].
The analysis results of the RF algorithm and FANP regarding the significance of each fire risk factor for forest fire occurrence indicate that among the environmental factors, the weights of rainfall and maximum temperature were significantly higher than those of other factors. This suggests that rainfall and temperature are the primary driving factors for forest fires in this region [42]; the NDVI also holds a relatively high weight, demonstrating that the NDVI has a notable influence on the occurrence of forest fires [22]. Nevertheless, the weights of relative humidity, land cover, and wind speed exhibit substantial differences between the two models. Lan’s research findings suggest that wind speed plays a crucial role in the occurrence of fires in the southeastern area [43], while Guo’s study in Fujian Province contends that RH has a relatively lower impact on forest fires [44], both of which are more consistent with the research results of the FANP. Lucca’s research is relatively limited, but to a certain extent, it represents a combination of human activities and environmental factors. For instance, construction land is associated with more frequent human activities, and forests and grasslands constitute a certain system of the NDVI. Therefore, during the weight assessment of the FANP, it was considered an important factor in the forest fire risk assessment. Among the terrain factors, the weight of elevation in the FANP was higher than those of slope and aspect, mainly because with the increase in elevation, human activities decreased, thereby reducing the likelihood of forest fire occurrence [44].
The evaluation results of the models for forest fire risk assessment indicate the predictive accuracy and assessment capabilities of the FANP and RF, respectively; however, the assessment capabilities of the models were mostly verified using forest fire risk maps, which cannot effectively demonstrate their actual effects in practical applications. The verification results of the fire risk classification map can better substantiate their actual performance in predictive capabilities. For instance, the protection and development belt of Wuyishan National Park, as an important ecological reserve [26,45], has the primary goal of maximizing the prevention and control of forest fires [27,46]. The FANP can prevent 98.44% of fires in areas with a fire risk level of at least 3. The secondary goal is to enhance the efficiency of fire risk prevention and control [47], and the efficiency of forest fire prevention and control in areas with a fire risk level of at least 4 by the FANP was also significantly higher than that of RF (Table 4). This is more in line with the regional requirements for forest fire prevention and control and has a superior predictive ability compared to RF (Table 3), indicating that the FANP is more applicable in the protection and development belt of Wuyishan National Park

5. Conclusions

In this study, RF and the FANP were utilized to conduct forest fire risk zoning for the protection and development belt of Wuyishan National Park. The western and southern parts of this area have relatively higher fire risk levels. Particularly, forest fire prevention in the western part should be strengthened to prevent it from causing damage to Wuyishan National Park. The areas with a fire risk level of 3 or above can prevent 98.44% of forest fires, and the areas with a fire risk level of 4 or above, accounting for 33.41% of the total, can prevent 65.63% of forest fires. All the indicators of the FANP and the actual verification results are superior to those of RF, indicating that the FANP has a strong applicability in small-scale forest fire risk zoning and can offer more reliable decision support and reference for regional forest fire management.

Author Contributions

Conceptualization, F.G., D.C., A.Z. and Y.H. ; methodology, F.G., D.C., A.Z. and Y.O.; software, D.C., A.Z., Y.H., Y.O. and C.L.; validation, D.C., A.Z. and F.G.; formal analysis, F.G., D.C., A.Z. and R.N.; investigation, D.C., Y.H., C.L. and Y.O.; resources, F.G.; data curation, W.W., J.Z. and C.L.; writing—original draft preparation, D.C., A.Z. and F.G.; writing—review and editing, M.T., D.C., A.Z. and F.G.; visualization, D.C. and A.Z.; supervision, F.G.; project administration, F.G.; funding acquisition, F.G. All authors have read and agreed to the published version of the manuscript.

Funding

This study was funded by 2024Y4015 Fujian Provincial Science and Technology Program “University-Industry Cooperation Project”. And the “Strategic International Scientific and Technological Innovation Cooperation” of the National Key Research and Development Program, 2018YFE0207800, Development of Forest and Grassland Combustibility Assessment Model.

Data Availability Statement

The original contributions presented in this study are included in the article, and further inquiries can be directed to the corresponding author.

Conflicts of Interest

The authors declare no conflicts of interest.

References

  1. Crockett, J.L.; Westerling, A.L. Greater temperature and precipitation extremes intensify Western US droughts, wildfire severity, and Sierra Nevada tree mortality. J. Clim. 2018, 31, 341–354. [Google Scholar] [CrossRef]
  2. Li, X.; Liu, L.; Qi, S. Forest fire hazard during 2000–2016 in Zhejiang province of the typical subtropical region, China. Nat. Hazards 2018, 94, 975–977. [Google Scholar] [CrossRef]
  3. Jain, P.; Castellanos-Acuna, D.; Coogan, S.C.P.; Abatzoglou, J.T.; Flannigan, M.D. Observed increases in extreme fire weather driven by atmospheric humidity and temperature. Nat. Clim. Change 2022, 12, 63–70. [Google Scholar] [CrossRef]
  4. Flannigan, M.D.; Krawchuk, M.A.; de Groot, W.J.; Wotton, B.M.; Gowman, L.M. Implications of changing climate for global wildland fire. Int. J. Wildland Fire 2009, 18, 483–507. [Google Scholar] [CrossRef]
  5. Shu, Y.; Shi, C.; Yi, B.; Zhao, P.; Guan, L.; Zhou, M. Influence of climatic factors on lightning fires in the primeval forest region of the Northern Daxing’an Mountains, China. Sustainability 2022, 14, 5462. [Google Scholar] [CrossRef]
  6. Tan, C.; Feng, Z. Mapping forest fire risk zones using machine learning algorithms in Hunan province, China. Sustainability 2023, 15, 6292. [Google Scholar] [CrossRef]
  7. Gigovic, L.; Pourghasemi, H.R.; Drobnjak, S.; Bai, S.B. Testing a new ensemble model based on SVM and random forest in forest fire susceptibility assessment and its mapping in Serbia’s Tara National Park. Forests 2019, 10, 408. [Google Scholar] [CrossRef]
  8. Eslami, R.; Azarnoush, M.; Kialashki, K.; Kazemzadeh, F. GIS-based forest fire susceptibility assessment by random forest, artificial neural network and logistic regression methods. J. Trop. For. Sci. 2021, 33, 173–184. [Google Scholar] [CrossRef]
  9. Eugenio, F.C.; dos Santos, A.R.; Fiedler, N.C.; Ribeiro, G.A.; da Silva, A.G.; dos Santos, A.B.; Paneto, G.G.; Schettino, V.R. Applying GIS to develop a model for forest fire risk: A case study in Espírito Santo, Brazil. J. Environ. Manag. 2016, 173, 65–71. [Google Scholar] [CrossRef]
  10. Guo, F.; Su, Z.; Wang, G.; Sun, L.; Lin, F.; Liu, A. Wildfire ignition in the forests of southeast China: Identifying drivers and spatial distribution to predict wildfire likelihood. Appl. Geogr. 2016, 66, 12–21. [Google Scholar] [CrossRef]
  11. Jafarzadeh, A.A.; Mahdavi, A.; Jafarzadeh, H. Evaluation of forest fire risk using the Apriori algorithm and fuzzy c-means clustering. J. For. Sci. 2017, 63, 370–380. [Google Scholar] [CrossRef]
  12. Syafitri, N.; Labellapansa, A.; Kadir, E.A.; Saian, R.; Afini Zahari, N.N.; Anwar, N.H.; Shaharuddin, N.M. Early detection of fire hazard using fuzzy logic approach. Int. J. Adv. Comput. Res. 2019, 9, 252–259. [Google Scholar] [CrossRef]
  13. Singh, K.R.; Neethu, K.P.; Madhurekaa, K.; Harita, A.; Mohan, P. Parallel SVM model for forest fire prediction. Soft Comput. Lett. 2021, 3, 100014. [Google Scholar] [CrossRef]
  14. Pham, B.T.; Jaafari, A.; Avand, M.; Al-Ansari, N.; Dinh Du, T.; Yen, H.P.H.; Phong, T.V.; Nguyen, D.H.; Le, H.V.; Mafi-Gholami, D.; et al. Performance Evaluation of Machine Learning Methods for Forest Fire Modeling and Prediction. Symmetry 2020, 12, 1022. [Google Scholar] [CrossRef]
  15. Abid, F. A Survey of Machine Learning Algorithms Based Forest Fires Prediction and Detection Systems. Fire Technol. 2021, 57, 559–590. [Google Scholar] [CrossRef]
  16. Milanovic, S.; Marković, N.; Pamucar, D.; Gigović, L.; Kostić, P.; Milanović, S.D. Forest fire probability mapping in eastern Serbia: Logistic regression versus random forest method. Forests 2020, 12, 5. [Google Scholar] [CrossRef]
  17. Oliveira, S.; Oehler, F.; San-Miguel-Ayanz, J.; Camia, A.; Percira, J. Modeling spatial pattens of fire occurrence in Mediterranean Europe using Multiple Regression and Random Forest. For. Ecol. Manag. 2012, 275, 117–129. [Google Scholar] [CrossRef]
  18. Breiman, L. Random forests. Mach. Learn. 2001, 45, 5–32. [Google Scholar] [CrossRef]
  19. Nikolić, G.; Vujović, F.; Golijanin, J.; Šiljeg, A.; Valjarević, A. Modelling of wildfire susceptibility in different climate zones in Montenegro Using GIS-MCDA. Atmosphere 2023, 14, 929. [Google Scholar] [CrossRef]
  20. Ray, S.K. Flood risk index mapping in data scarce region by considering GIS and MCDA (FRI mapping in data scarce region by considering GIS and MCDA). Environ. Dev. Sustain. 2024, 1–53. [Google Scholar] [CrossRef]
  21. Ghorbanzadeh, O.; Feizizadeh, B.; Blaschke, T. Multi-criteria risk evaluation by integrating an analytical network process approach into GIS-based sensitivity and uncertainty analyses. Geomat. Nat. Hazards Risk 2018, 9, 127–151. [Google Scholar] [CrossRef]
  22. Ma, W.; Feng, Z.; Cheng, Z.; Chen, S.; Wang, F. Identifying forest fire driving factors and related impacts in China using random forest algorithm. Forests 2020, 11, 507. [Google Scholar] [CrossRef]
  23. Jones, M.W.; Abatzoglou, J.T.; Veraverbeke, S.; Andela, N.; Lasslop, G.; Forkel, M.; Smith, A.J.; Burton, C.; Betts, R.A.; van der Werf, G.R.; et al. Global and regional trends and drivers of fire under climate change. Rev. Geophys. 2022, 60, e2020RG000726. [Google Scholar] [CrossRef]
  24. Şahiner, A.; Ermiş, T.; Karakoyun, M.H.; Awan, M.W. Determining the most effective way of intervention in forest fires with fuzzy logic modeling: The case of Antalya/Türkiye. Nat. Hazards 2023, 116, 2269–2282. [Google Scholar] [CrossRef]
  25. Güngöroğlu, C. Determination of forest fire risk with fuzzy analytic hierarchy process and its mapping with the application of GIS: The case of Turkey/Çakirlar. Hum. Ecol. Risk Assess. 2017, 23, 388–406. [Google Scholar] [CrossRef]
  26. Wuyi Mountain National Park Office. Wuyi Mountain National Park (Fujian Area) Introduction. 21 August 2017. Available online: https://wysgjgy.fujian.gov.cn/gygk/gyjj/201708/t20170821_5511563.htm (accessed on 20 November 2014).
  27. Haixiaziyuanbao. Master Plan for the Protection and Development Belt of Wuyishan National Park (2021–2035). 4 May 2023. Available online: https://zrzyt.fujian.gov.cn/ztzl/ztzlfjmp/202305/t20230505_6163321.htm (accessed on 20 November 2014).
  28. Cao, Q.; Zhang, L.; Su, Z.; Wang, G.; Sun, S.; Guo, F. Comparing four regression techniques to explore factors governing the number of forest fires in Southeast, China. Geomat. Nat. Hazards Risk 2021, 12, 499–521. [Google Scholar] [CrossRef]
  29. Guo, F.; Wang, G.; Su, Z.; Liang, H.; Wang, W.; Lin, F.; Liu, A. What drives forest fire in Fujian, China? Evidence from logistic regression and Random Forests. Int. J. Wildland Fire 2016, 25, 505–519. [Google Scholar] [CrossRef]
  30. Cao, Q.; Zhang, L.; Su, Z.; Wang, G.; Guo, F. Exploring spatially varying relationships between forest fire and environmental factors at different quantile levels. Int. J. Wildland Fire 2020, 29, 486–498. [Google Scholar] [CrossRef]
  31. Zeng, A.; Yang, S.; Zhu, H.; Tigabu, M.; Su, Z.; Wang, G.; Guo, F. Spatiotemporal dynamics and climate influence of forest fires in Fujian Province, China. Forests 2022, 13, 423. [Google Scholar] [CrossRef]
  32. Malczewski, J. GIS-based multicriteria decision analysis: A survey of the literature. Int. J. Geogr. Inf. Sci. 2006, 20, 703–726. [Google Scholar] [CrossRef]
  33. Xiao, F. Forest fire disaster area prediction based on genetic algorithm and support vector machine. Adv. Mater. Res. 2012, 446, 3037–3041. [Google Scholar] [CrossRef]
  34. Liaw, A.; Wiener, M. Classification and Regression by random Forest. R News 2002, 23, 18–22. Available online: https://www.researchgate.net/publication/228451484 (accessed on 6 January 2025).
  35. Saaty, T.L. Decision Making with Dependence and Feedback: The Analytic Network Process; RWS Publications: Pittsburgh, PA, USA, 1996. [Google Scholar]
  36. Nachappa, T.G.; Piralilou, S.T.; Gholamnia, K.; Ghorbanzadeh, O.; Rahmati, O.; Blaschke, T. Flood susceptibility mapping with machine learning, multi-criteria decision analysis and ensemble using Dempster Shafer Theory. J. Hydrol. 2020, 590, 125275. [Google Scholar] [CrossRef]
  37. Gheshlaghi, H.A.; Feizizadeh, B.; Blaschke, T. GIS-based forest fire risk mapping using the analytical network process and fuzzy logic. J. Environ. Plan. Manag. 2020, 63, 481–499. [Google Scholar] [CrossRef]
  38. Noroozi, F.; Ghanbarian, G.; Safaeian, R.; Pourghasemi, H.R. Forest fire mapping: A comparison between GIS-based random forest and Bayesian models. Nat. Hazards 2024, 120, 6569–6592. [Google Scholar] [CrossRef]
  39. Sulova, A.; Jokar Arsanjani, J. Exploratory Analysis of Driving Force of Wildfires in Australia: An Application of Machine Learning within Google Earth Engine. Remote Sens. 2021, 13, 10. [Google Scholar] [CrossRef]
  40. Makowski, D. Simple random forest classification algorithms for predicting occurrences and sizes of wildfires. Extremes 2023, 26, 331–338. [Google Scholar] [CrossRef]
  41. Feizizadeh, B.; Omarzadeh, D.; Mohammadnejad, V.; Sharifi, H.A.; Karkarg, B.G. An integratedapproach of artificial intelligence and geoinformation techniques applied to forest fire riskmodeling in Gachsaran, Iran. J. Environ. Plan. Manag. 2022, 66, 1369–1391. [Google Scholar] [CrossRef]
  42. Sivrikaya, F.; Günlü, A.; Küçük, Ö.; Ürker, O. Forest fire risk mapping with Landsat 8 OLI images: Evaluation of the potential use of vegetation indices. Ecol. Inform. 2024, 79, 102461. [Google Scholar] [CrossRef]
  43. Lan, Z.G.; Su, Z.W.; Guo, M.; Alvarado, E.C.; Guo, F.; Hu, H.; Wang, G. Are climate factors driving the contemporary wildfire occurrence in China? Forests 2021, 12, 392. [Google Scholar] [CrossRef]
  44. Guo, F.T.; Su, Z.W.; Wang, G.Y.; Sun, L.; Tigabu, M.; Yang, X.; Hu, H. Understanding fire drivers and relative impacts in different Chinese forest ecosystems. Sci. Total Environ. 2017, 605, 411–425. [Google Scholar] [CrossRef] [PubMed]
  45. Liu, C.; Lin, M.; Qi, X.; Zheng, W. Estimating the preservation value of Wuyishan National Park from the perspective of bounded rational decision making. Sustainability 2021, 13, 6983. [Google Scholar] [CrossRef]
  46. Wuyi Mountain National Park Office. Wuyi Mountain National Parkforest Fire Station Established. 22 March 2024. Available online: https://wysgjgy.fujian.gov.cn/zwgk/stbh/202403/t20240322_6418178.htm (accessed on 20 November 2014).
  47. General Office of Fujian Provincial People’s Government. Notice of General Office of Fujian Provincial People’s Government on Issuing and Distributing Fujian Province Forest Fire Emergency Plan. 24 April 2022. Available online: https://www.fj.gov.cn/zwgk/zxwj/szfbgtwj/202205/t20220510_5906609.htm (accessed on 20 November 2014).
Figure 1. Land cover (a) and active fire distribution (b) in the study area.
Forests 16 00097 g001
Figure 2. Fuzzy mapping and radar chart representation of membership functions for fire risk factors in the protection and development belt of Wuyishan National Park: (A) rainfall; (B) maximum temperature; (C) relative humidity; (D) NDVI; (E) wind speed; (F) land cover; (G) distance to river; (H) distance to settlement; (I) distance to road; (J) slope degree; (K) slope aspect; and (L) altitude.
Forests 16 00097 g002
Figure 3. Forest fire risk level zoning map using RF (a) and FANP (b) approaches.
Forests 16 00097 g003
Figure 4. Percentage of the area of fire danger level in the forest fire risk level zoning map.
Forests 16 00097 g004
Table 1. Data sources used in the present study.
Data Category NameData SourceData FormatResolutionRange
RainfallGeographic remote sensing ecological network platform
(http://www.gisrs.cn/ accessed on 11 June 2024)
SHP10 m2001–2020
Max temperatureSHP10 m2001–2020
WindSHP10 m2001–2020
Relative humiditySHP10 m2001–2020
NDVITIF30 m2001–2020
Land coverEsri Land Cover (https://livingatlas.arcgis.com/
accessed on 18 May 2024)
TIF10 m2023
RiverNational Catalogue Service For Geographic Information (https://www.webmap.cn/
accessed on 20 July 2023)
SHP1:250,0002017
RoadSHP1:250,0002017
SettlementSHP1:250,0002017
Digital elevation modelEarth Data
(https://search.asf.alaska.edu/
accessed on 20 July 2023)
TIF12.5 m/
Active fire dataMODIS Collection6.1 Dataset
(https://firms.modaps.eosdis.nasa.gov/
accessed on 11 March 2024)
SHP1000 m2001–2020
Burned-area dataMCD64A1.006 MODIS Burned Area Monthly Global
(https://ladsweb.modaps.eosdis.nasa.gov/ accessed on 11 March 2024)
SHP500 m2001–2020
Table 2. Weights for forest fire risk factors based on RF and FANP approaches.
ClusterFactorRF WeightFANP Weight
Environmental
factor
Rainfall0.15620.1771
Maximum temperature0.17350.1310
Relative humidity0.15740.0597
NDVI0.10320.1094
Land cover0.01300.1074
Wind speed0.03660.0830
Distance to river0.05310.0223
Human activity
factor
Distance to settlement0.09150.0753
Distance to road0.05350.0412
Terrain factorAltitude0.04140.1062
Slope0.08110.0288
Slope aspect0.03940.0586
Table 3. Validation indicators for RF and FANP; modeling of fire risk zones.
Validation IndexFANPRF
AUC0.8850.814
Precision0.7550.715
Recall0.9140.766
F1 score0.8270.74
Table 4. Percentages of active fire data and area of fire danger level in forest fire risk level zoning map.
Fire Risk LevelFANPRF
Fire RatioArea RatioFrequency RatioFire RatioArea RatioFrequency Ratio
Level10.00%11.56%0.000.78%14.61%0.05
Level21.56%15.18%0.103.91%15.39%0.25
Level332.81%39.86%0.8220.31%22.74%0.89
Level446.09%27.08%1.7030.47%30.03%1.01
Level519.53%6.33%3.0944.53%17.06%2.61
≥Level398.44%73.26%1.3495.31%69.84%1.36
≥Level465.63%33.41%1.9675.00%47.10%1.59
Disclaimer/Publisher’s Note: The statements, opinions and data contained in all publications are solely those of the individual author(s) and contributor(s) and not of MDPI and/or the editor(s). MDPI and/or the editor(s) disclaim responsibility for any injury to people or property resulting from any ideas, methods, instructions or products referred to in the content.

