Article

Genome-Wide Investigation and Expression Analysis of AP2 Gene Subfamily Reveals Its Evolution and Regulatory Role Under Salt Stress in Populus

1
College of Horticulture and Plant Protection, Henan University of Science and Technology, Luoyang 471023, China
2
State Key Laboratory of Tree Genetics and Breeding, Chinese Academy of Forestry, Beijing 100091, China
*
Authors to whom correspondence should be addressed.
Forests 2025, 16(1), 94; https://doi.org/10.3390/f16010094
Submission received: 5 December 2024 / Revised: 2 January 2025 / Accepted: 7 January 2025 / Published: 8 January 2025
(This article belongs to the Special Issue Abiotic and Biotic Stress Responses in Trees Species)

Abstract

:
The APETALA2/ethylene-responsive factor (AP2/ERF) is a well-researched superfamily of plant transcription factors. The APETALA2 (AP2) subfamily is essential for plant growth and development. However, a systematic analysis of the AP2 subfamily in poplar has yet to be conducted. This study identified 29 AP2 genes in the poplar genome, classifying them into three clades—euAP2, euANT, and basalANT based on evolutionary relationships. These genes are distributed across 12 chromosomes and one scaffold. Results from the syntenic analysis suggest that whole-genome duplication events are the primary factors driving the expansion of the AP2 subfamily in poplar. Cis-element analysis reveals that numerous PtAP2 genes possess hormone-related cis-elements. These genes also contain cis-elements linked to plant development and stress responses. PtAP2s from different clades exhibit significantly tissue-specific expression patterns in poplar. Gene expression levels in the euAP2 clade are significantly higher than in the euANT and basalANT clades across various tissues, with basalANT showing the lowest expression. Through RT-qPCR and recombinant Saccharomyces cerevisiae assays under salt stress, it was discovered that the majority of AP2 genes showed a negative response in salt stress regulation in poplar trees. In conclusion, this study offers valuable insights into salt tolerance in poplar trees and the role of AP2 genes under salt stress conditions.

1. Introduction

The AP2/ERF transcription factor superfamily is vital for plant development and stress response, including drought, salinity, and heat [1]. The AP2/ERF superfamily is characterized by the presence of an AP2 domain in all its members. It is divided into four subfamilies—AP2, ERF (ethylene-responsive-element-binding protein), RAV (Related to ABI3/VP), and Soloist—based on the number of AP2 and B3 domains and the sequence similarity among genes [2]. Each member of the AP2 subfamily possesses two AP2 domains, consisting of a pre-domain region near the C-terminus, an AP2-R1 domain, a linker region comprising 30 amino acid residues, an AP2-R2 domain, and a post-domain region near the N-terminus. The AP2 subfamily can be divided into the miR172-bound euAP2 group and the AINTEGUMENTA (ANT) group based on amino acid sequences and nuclear localization sequences of its two conserved domains [3].
Given the critical role of AP2 genes in flower development, members of the AP2 subfamily have been cloned from various species, and their functions have been validated during different stages of plant ontogeny. Flower development is a crucial link in plant life cycle, which directly affects plant growth and reproduction [4]. The AP2 homologous genes BrAP2a and BrAP2b from Arabidopsis (Arabidopsis thaliana) in B. rapa restore the corolla defect phenotype observed in Arabidopsis ap2-5 mutants. Knocking out the corresponding BnAP2 gene in B. napus using the CRISPR/Cas9 system results in a scab-like phenotype [5]. Overexpression of the CpAP2-L11 gene from Chimonanthus praecox promotes early flowering in Arabidopsis [6]. Additionally, AP2 genes also affect lateral root development, leaf morphology, and seed development in plants. For instance, overexpression of the AtAP2 gene leads to larger seeds and enhanced germination capacity in Arabidopsis [7]. The LsAP2 gene from lettuce (Lactuca sativa L.) suppresses LsKAN2 by interacting with a CIN-like TCP transcription factor, resulting in morphological changes in Lactuca leaves [8]. The AINTEGUMENTA LIKE1 (PtAIL1) gene from Populus trichocarpa positively regulates the number of adventitious roots [9]. Overexpressing CAP2, an AP2 gene family member from Cicer arietinum, in tobacco notably enhances leaf surface area and lateral root count [10].
The AP2 gene subfamily is crucial in stress responses. Silencing the Triticum aestivum TaAP2-15 transcription factor attenuates wheat’s resistance to Puccinia striiformis f. sp. tritici (Pst), facilitating pathogen proliferation [11]. The AtANT gene negatively regulates Arabidopsis’s response to salt stress by binding to the SCABP8 promoter and modulating the SOS signaling cascade, thereby influencing the plant’s adaptation to salt stress conditions [12]. Heterologous expression of SmAP-17 in Arabidopsis increases Arabidopsis tolerance to salt stress [13]; overexpressed C. arietinum CAP2 transgenic tobacco showed greater salt tolerance than wild-type plants [10].
Although the AP2 gene family has been studied in several species such as A. thaliana (18AP2s) [14], Solanum melongena (22AP2s) [15], Fagopyum tataricum (15AP2s) [16], Vitis vinifera (18AP2s) [17], Saccharum spontaneum (43AP2s) [18], and Salix matsudana (55AP2s) [19], AP2 family members in poplar, namely PtAP2s, have not been systematically analyzed. Populus is widely regarded as having the advantages of extensive distribution, strong adaptability, and rapid growth, thereby being recognized as one of the important afforestation tree species globally. Furthermore, due to its small genome and ease of transgenic modification, poplar holds significant scientific research and ecological value as a model species in woody plant research [20]. The salinization of soils globally has intensified due to climate change and anthropogenic activities. Salinized soils can severely hinder the growth and development of salt-sensitive poplar species due to osmotic stress and ionic toxicity. Therefore, it is imperative to cultivate a new generation of poplar varieties that exhibit tolerance to extreme conditions, including salinity and drought [21,22]. Currently, few reports address the AP2 gene subfamily in poplar under saline stress. Conducting a genome-wide analysis of the AP2 gene family in poplar can help clarify the mechanisms by which these genes function in saline-alkaline environments.

2. Materials and Methods

2.1. Identification of PtAP2 Transcription Factors

Genome and General Feature Format (GFF) files for P. trichocarpa (versions 3.0, 3.1, and 4.1) were sourced from the phytozome database (https://phytozome-next.jgi.doe.gov) on 5 June 2023. Using 18 AP2 protein sequences from A. thaliana [14] as references, three databases of P. trichocarpa were searched by local BLASTp (e-value: 1 × 10⁻⁵ to identify protein sequences containing the AP2 domain. The AP2 domain Hidden Markov model (PF00847) was sourced from the Pfam database (http://pfam.xfam.org/) on 6 June 2023. Potential PtAP2 protein sequences were identified using HMMER3.0 (e-value ≤ 1 × 10⁻¹⁰). The NCBI Standard Protein BLAST, NCBI Batch CD-Search (https://www.ncbi.nlm.nih.gov), and SMART (https://smart.embl.de) databases (accessed on 5 June 2023) were used to verify the protein structure, identify the corresponding AP2 protein, and assign names to the identified PtAP2s. Chromosome positions, exon counts, coding sequences (CDS), and protein lengths of PtAP2s were obtained from the P. trichocarpa GFF file. The isoelectric points (pI) and molecular weights (MW) of PtAP2 proteins were predicted using ExPASy [23] (https://web.expasy.org/protparam/) as of 6 June 2023. The WoLF PSORT tool was employed to predict the subcellular localization of PtAP2 proteins [24], accessed on 6 June 2023.

2.2. Evolutionary Relationships, Gene Structure, and Conserved Motif Analysis

The MUSCLE algorithm was utilized to perform multiple sequence alignments of AP2 protein sequences from P. trichocarpa, A. thaliana, and Zea mays [25]. The evolutionary tree was generated using the Neighbor-Joining method in MEGA6.0 with bootstrap values from 1000 replicates, and visualized via the iTOL website (https://itol.embl.de/) as of 13 June 2023. Conserved motifs of the PtAP2 protein were identified via the MEME suite (https://meme-suite.org/meme/) as of 15 June 2023, and visualized using the Gene Structure View tool in TBtools (v2.056) [26].

2.3. Chromosomal Locations and Collinearity in P. trichocarpa and Related Species

The PtAP2 genes were localized on chromosomes according to the genome and GFF3 annotation files of P. trichocarpa, and were named based on their chromosomal positions. Genomes and annotation files for Salix purpurea (v5.1) and Setaria viridis (v4.1) were sourced from the phytozome database. MCScanX and Multiple Synteny Plot were employed for interspecies synteny analysis and visualization. The TBtools software was used to calculate the non-synonymous (Ka) and synonymous (Ks) substitution rates.

2.4. Cis-Elements and Functional Annotation

The 2000 bp upstream DNA sequence of the PtAP2s initiation codon (ATG) was extracted using TBtools, and its cis-elements were analyzed with Plant CARE. The Plant CARE website is available at http://bioinformatics.psb.ugent.be/webtools/plantcare/html (accessed 21 June 2023). Visualization was performed using the Simple BioSequence Viewer in TBtools software.

2.5. Assessment of the Expression Patterns of PtAP2 Genes Across Various Tissues

RNA-Seq data from 25 P. trichocarpa samples, covering different developmental stages and tissues, were sourced from the phytozome database (v1). PtAP2 expression data were then organized and visualized as a heatmap using TBtools (https://phytozome-next.jgi.doe.gov/geneatlas/) (accessed 9 December 2023).

2.6. Plant Materials and Treatments

Tissue culture seedlings of 84K (Populus alba × P. glandulosa) were grown under controlled conditions at 24 ± 1 °C with a 16 h light and 8 h dark cycle, utilizing 1/2 MS medium as the growth substrate. After one month of cultivation, the seedlings were transferred to 1/2 Hoagland’s liquid medium for 72 h before being exposed to 200 mM NaCl to induce salt stress. Leaves from the 2nd to 4th positions were collected at intervals of 0, 6, 12, 24, 48, and 72 h, then frozen in liquid nitrogen and stored at −80 °C. At each time point, three biological replicates were collected for RNA extraction and RT-qPCR analysis.

2.7. RNA Extraction and qRT-PCR

Total RNA from samples collected at various time points was extracted using the RNA Prep Pure Plant Plus Kit (Cat DP441; Tian Gen, Beijing, China). RNA concentration and integrity were evaluated using the NanoDrop 2000 (Thermo Fisher Scientific, Waltham, MA, USA) and 1.5% agarose gel electrophoresis. Using the M5 Super qPCR RT kit with gDNA remover Kit (Cat MF166-01; Mei5 Bio Biotechnology, Beijing, China), 1 µg of poplar RNA was reverse transcribed into cDNA. Primers for quantitative reverse transcription polymerase chain reaction (qRT-PCR) were designed using Primer3 [27] (Table S1) (https://primer3.ut.ee/ version 4.1.0) on 11 January 2024. Gene expression levels were measured using the 2× M5 HiPer SYBR Premix EsTaq (Cat MF787-01; Mei5 Bio Biotechnology, Beijing, China), with the CFX96 instrument (Bio-Rad, Hercules, CA, USA) employed for the analysis. Poplar ACTIN (Potri.001G309500) and 18S rRNA (Potri.008G111800) were utilized as internal reference genes (Table S1). The relative expression levels of PtAP2s were calculated using the 2−ΔΔCt method, with three biological replicates conducted for each sample. The primer sequences for the aforementioned genes analyzed via RT-qPCR are presented in Table S3. For the analysis of RT-qPCR data, one-way ANOVA (analysis of variance) in GraphPad Prism 9 was utilized to determine statistical significance [28].

2.8. Yeast Heterologous Expression and Functional Validation of PtAP2s

Four PtAP2 genes (PteuANT1/2, PtAIL5-1/5-4) were amplified from 84k cDNA using specific primers (Table S2) and cloned into the pTOPO vector (Cat MF021-01; Mei5 Bio Biotechnology, Beijing, China) for sequencing. The four genes were excised from the pTOPO vector using primers that included KpnI and EcoRI restriction enzyme sites (Table S3), and subsequently, they were ligated into the pYES2 vector using T4 DNA ligase (Cat M0202V; New England Biolabs, Beverly, MA, USA). Ultimately, four recombinant plasmids containing the pYES2 vector were successfully obtained. Thereafter, the vector constructs along with the empty pYES2 vector were transformed into INVSc1 (Cat G6047; ANGYUBIO, Shanghai, China) yeast cells and were utilized for subsequent experiments. The yeast stress experiment was conducted in accordance with the methodology described by Zhang et al. [29]. Briefly, the OD600 value of recombinant S. cerevisiae was adjusted to 1.0 and then resuspended in 5 M NaCl for 6 h. The yeast solutions containing the pYES2 recombinant plasmids with the PteuANT1/2 and PtAIL5-1/5-4 genes, along with the yeast solution containing the empty pYES2 vector, were subjected to 10-fold dilutions, resulting in five gradient dilutions. Subsequently, 4 μL of each dilution was plated onto SC-Ura solid medium (containing 2% galactose) for cultivation. The survival differences between the recombinant S. cerevisiae cells and the control were assessed after a culture period of 3 days at 30 °C.

3. Results and Analysis

3.1. Characterization of the PtAP2 Gene Family and Evaluation of Protein Physicochemical Properties

This study identified 29 PtAP2 gene family members by conducting local BLAST screenings across three versions (v3.0, v3.1, and v4.1) of the P. trichocarpa database (refer to Table 1). The gene accession numbers are listed in Supplementary Table S4. Each of the 29 AP2 members identified in this study contains two complete AP2 domains, which aligns with the typical structural features of AP2 genes. Based on the sequence features and chromosomal organization of PtAP2 transcription factors, these genes were named following the classification method by Kim et al. [3]. ExPASy prediction results indicated that the lengths of the AP2 proteins in populus ranged from 306 amino acids (PtbasalANT3) to 722 amino acids (PtAIL5-2), while their molecular weights (MWs) ranged from 34.8497 kDa (PtbasalANT3) to 79.22513 kDa (PtAIL5-2). Isoelectric point (pI) predictions for the 29 AP2 proteins showed a range from 5.59 for PtbasalANT6 to 8.72 for PtbasalANT3. Subcellular localization predictions suggest that 22 PtAP2 proteins are likely to be found in the nucleus, whereas seven proteins from the basalANT clade may be localized to the chloroplast.

3.2. Phylogenetic Analysis of PtAP2s

This study explored the evolutionary relationships of PtAP2 proteins by performing multiple sequence alignment and cluster analysis on 18 AP2 protein sequences from A. thaliana [14], 25 from maize [25], and 29 from P. trichocarpa. The clustering results revealed that the 72 PtAP2 proteins from the three species were categorized into three clades: euANT, euAP2, and basalANT (Figure 1). PtAP2 proteins were distributed across all three clades, with the largest number of PtAP2 proteins found in the euANT clade, totaling 13, comprising 5 ANT proteins (PtANT1/2/3/4/5) and 9 AIL (ANT-like) proteins (PtAIL5-1/-2/-3/-4, PtAIL1-1/-2, PtAIL3-1/-2, and PtAIL7). The basalANT clade comprises nine members, designated as PtbasalANT1 through PtbasalANT9. In contrast, the euAP2 clade has the fewest number of PtAP2 protein members, specifically, only six (PteuAP2-1/-2/-3/-4/-5/-6).

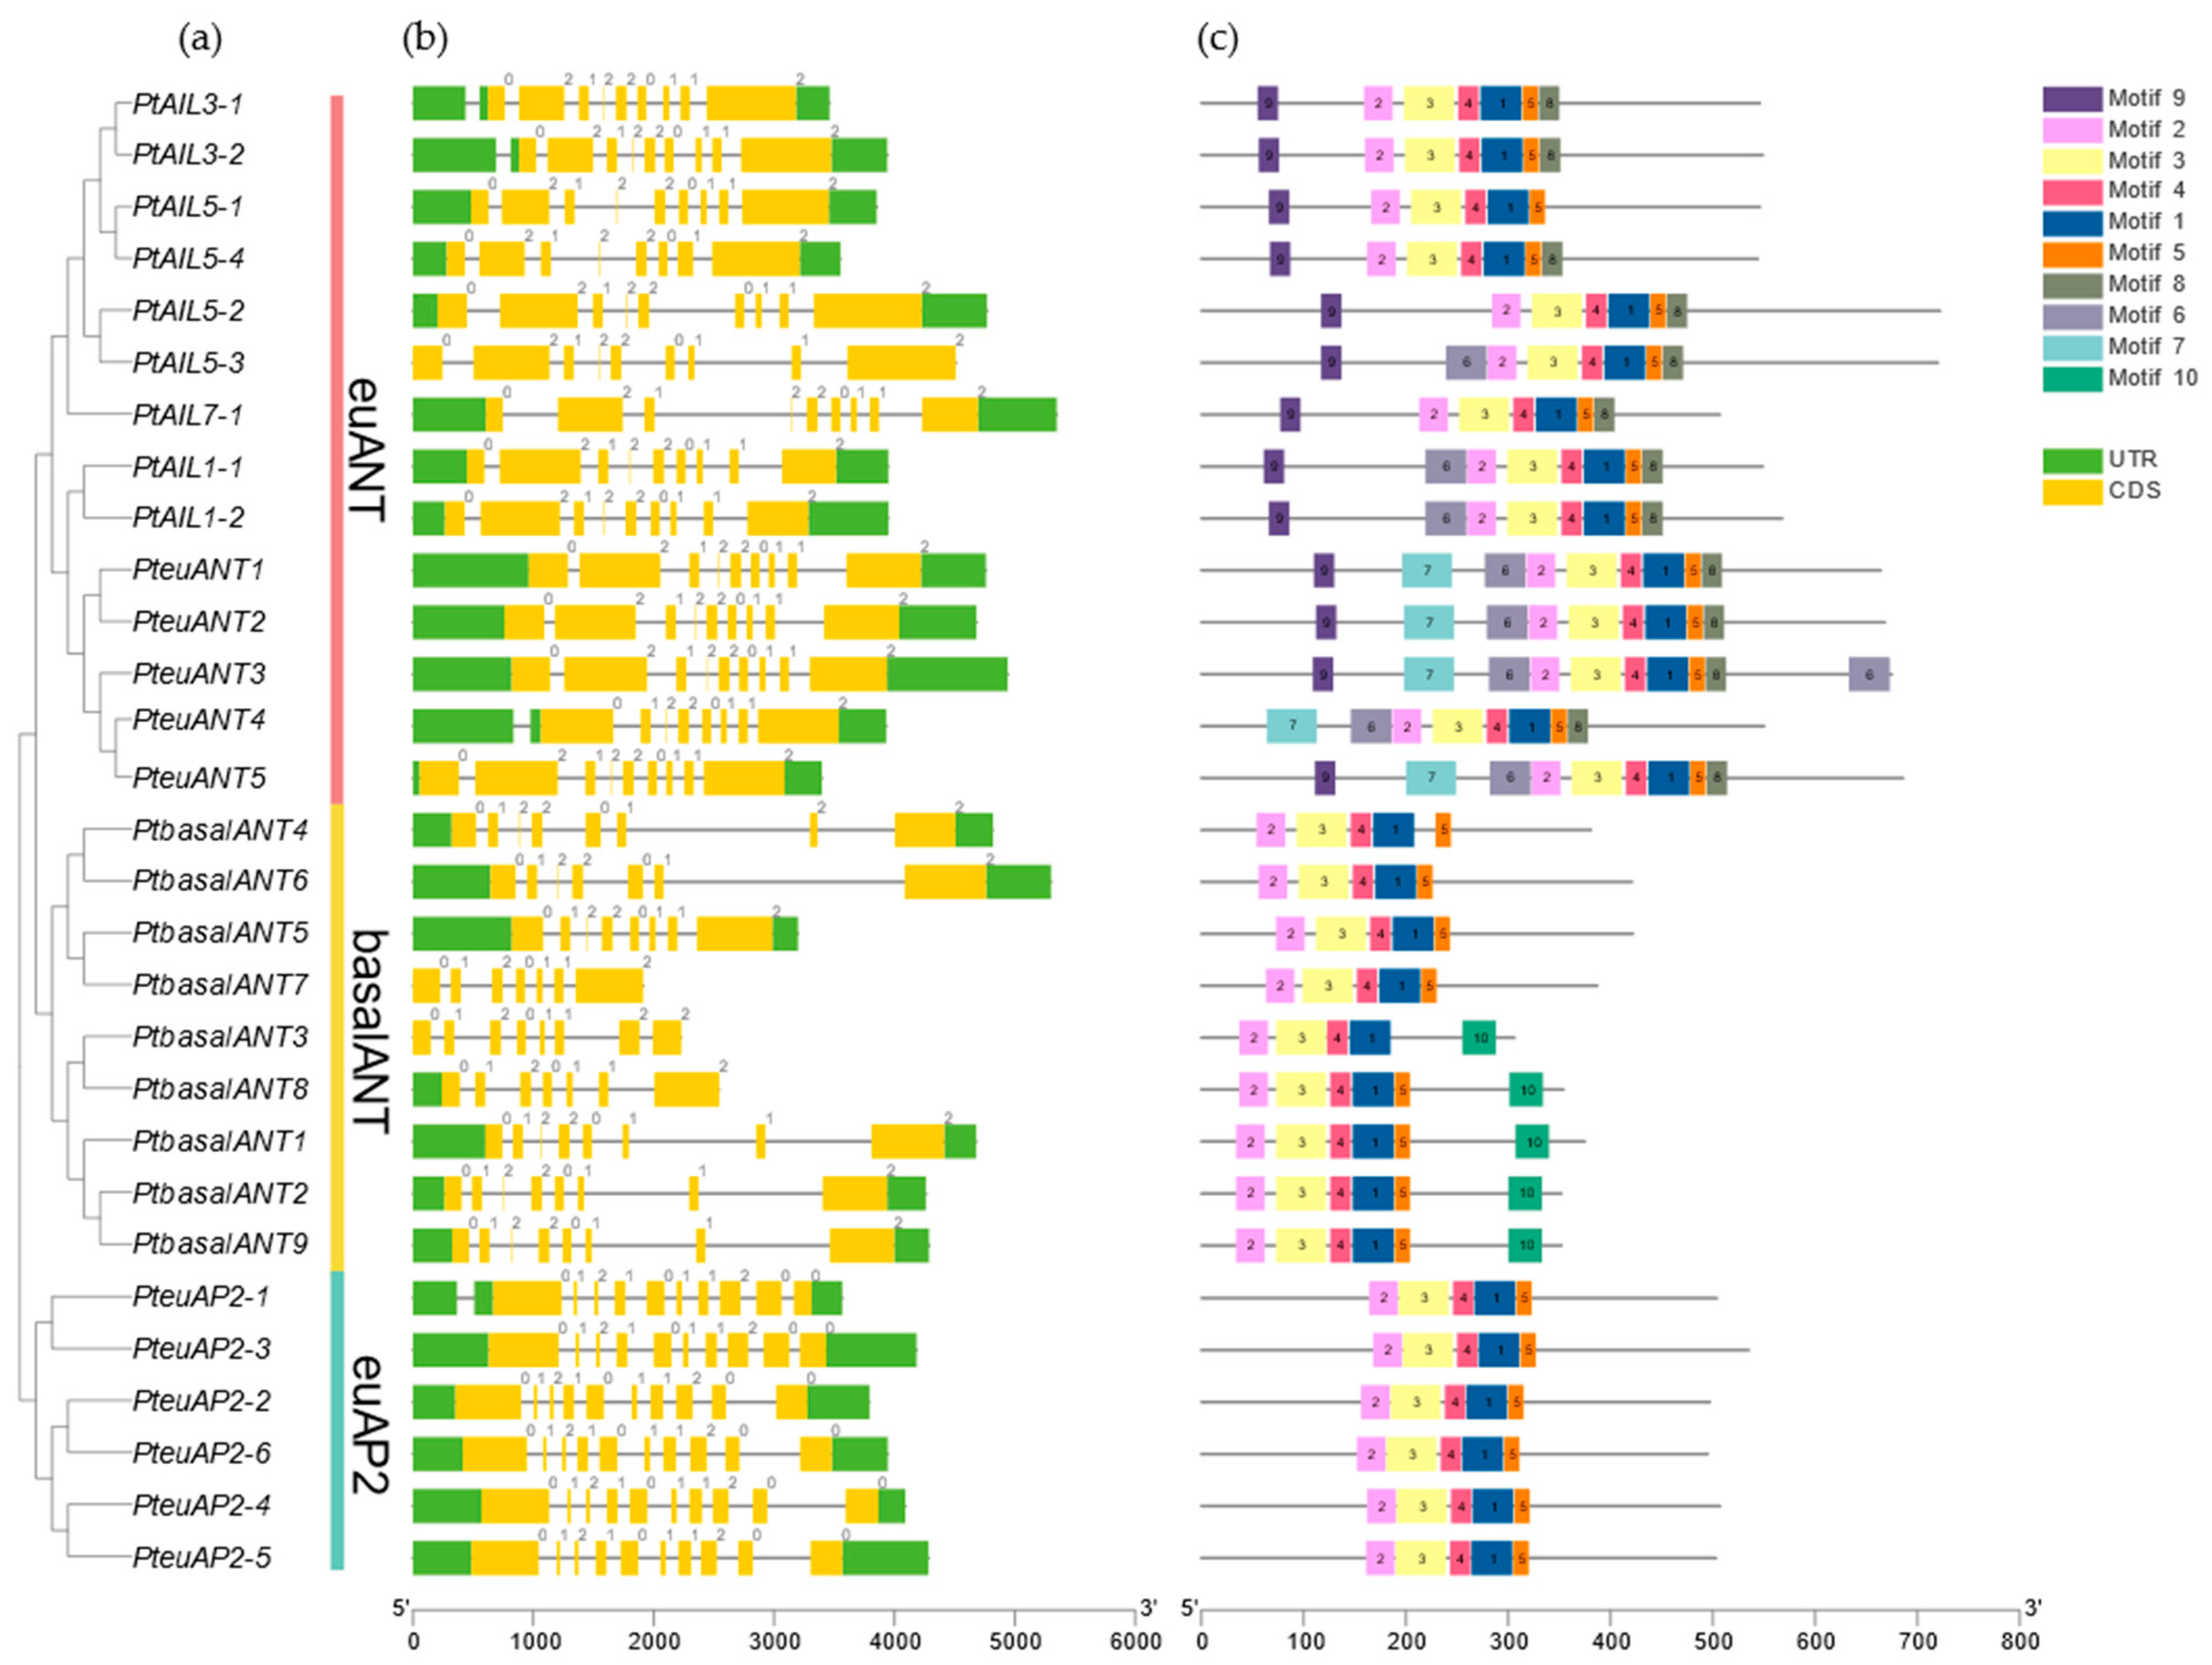
3.3. The Analysis of PtAP2 Gene Structure and Motifs Was Conducted to Identify Key Features and Patterns

The variation among PtAP2 genes was further investigated through gene structure analysis. As illustrated in Figure 2, only PtAIL5-3, PtbasalANT7, and PtbasalANT3 lacked the UTR structure, collectively accounting for 10.3% of the PtAP2 genes. Exon/intron prediction results showed that AP2 genes in the same group had similar exon/intron distribution patterns. In the euANT clade, with the exception of PteuAIL3-1/-2, which possesses 10 exons, the remaining 12 genes in this group have 9 exons and 7 to 9 introns. Within the basalANT clade, PtbasalANT1/2/3/5/9 genes each contained eight exons, while PtbasalANT4/6/7/8 genes had seven exons, with intron counts varying between six and seven. In the euAP2 clade, all genes except PteuAP2-1, which has 11 exons, contain 10 exons, with introns numbering between 9 and 10.
Due to their specific binding sites and involvement in particular biological processes, motifs exhibit conserved and essential biological functions across various organisms. The analysis of conserved motifs in PtAP2 genes can elucidate the conserved DNA binding sites within the target region and identify the interactions between these sites and the target gene [30]. Ten conserved motifs of the PtAP2 protein were identified using MEME. The results (Figure 2c) indicate that all PtAP2 proteins contain motifs 1, 2, and 4, with motif 2 representing the AP2-R1 domain of the AP2 protein, while motifs 1 and 4 correspond to the R2 domain of the AP2 protein. In summary, the AP2 domain is positioned differently within the euANT clade, near the N-terminus of the basalANT clade, and in the center of the euAP2 clade. Although the number of PtAP2 protein motifs varies across different clades, the distribution of motifs within each group remains relatively stable. For instance, motif 9 is exclusively found at the N-terminus of genes within the euANT clade; motif 8 is specifically located at the C-terminus of this protein group; PteuANT1/2/3/4 is situated on a branch of the euANT clade, and all of these have motif 7; and motif 10 is specifically present in PtbasalANT1/2/3/8/9 proteins within the basalANT clade. The conserved motifs in poplar’s AP2 family proteins validate the classification of PtAP2 proteins, indicating that proteins within the same group generally exhibit similar conserved motifs. Therefore, these proteins are likely to exhibit analogous functions.

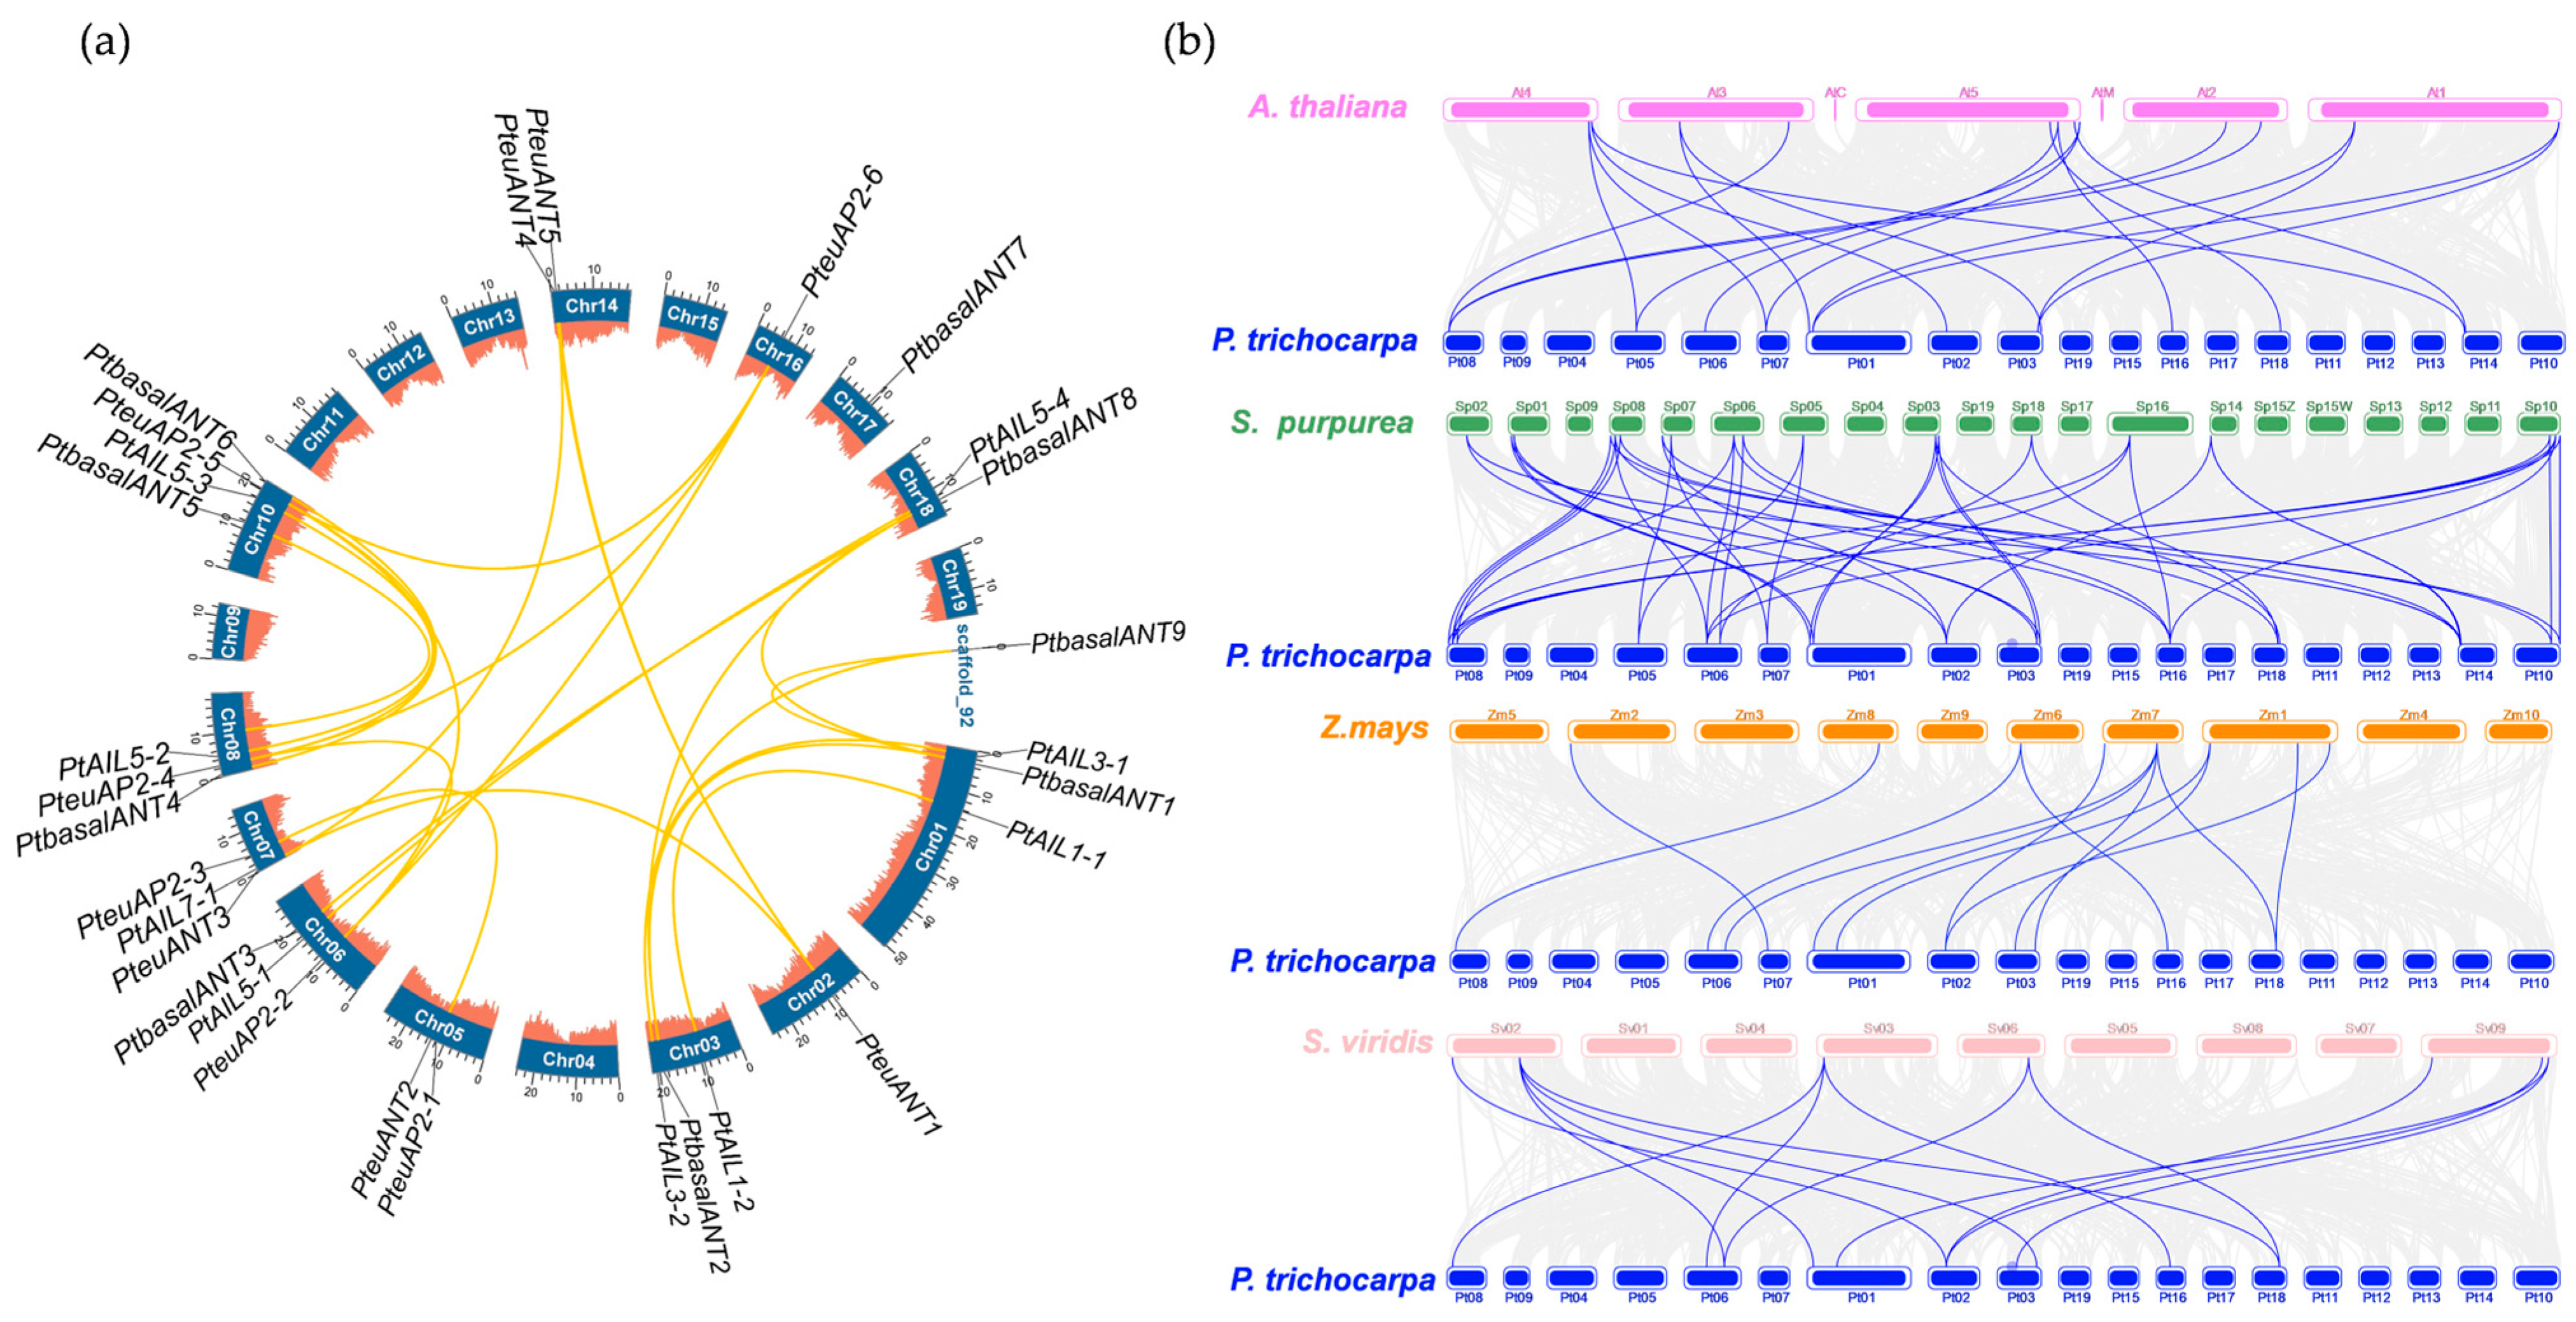
3.4. Chromosomal Localization and Collinearity of PtAP2 Genes

Figure 3a illustrates the chromosomal distribution of the PtAP2 genes, with 29 PtAP2 genes positioned on 12 chromosomes and one scaffold. Overall, the distribution of PtAP2 genes does not exhibit a distinct spatial pattern. The largest chromosome, Chr01, harbors three genes, PtAIL1-1, PtAIL3-1, and PtbasalANT1, whereas Chr10 accommodates four AP2 genes, PtbasalANT5/6, PtAIL5-3, and PteuAP2-5. Chromosomes Chr01, Chr03, Chr06, Chr07, and Chr08 each harbor three PtAP2 genes. Additionally, Chr05, Chr14, and Chr18 contain two PtAP2 genes each, while Chr02, Chr16, Chr17, and scaffold 92 each possess one PtAP2 gene. Conversely, Chr04, Chr09, Chr11, Chr12, Chr13, Chr15, and Chr19 lack PtAP2 gene distribution.
A collinearity analysis was conducted, revealing that the gene amplification patterns of the AP2 gene family in poplar originated from segmental duplication (SD) and whole genome duplication (WGD) events, with no evidence of tandem duplications identified (Figure 3a). Notably, three instances of segmental duplication/whole genome duplication (SD/WGD) phenomena were observed among the PtbasalANT1 gene and the PtbasalANT2/3/8/9 genes, as well as between the euAP2-2 gene and the euAP2-4/5/6 genes, respectively. The SD/WGD events between two genes occur among PtbasalANT4 and PtbasalANT6, PtAIL1-1 and PtAIL1-2, PtAIL5-4 and PtAIL5-1, as well as between PtAIL5-2 and PtAIL5-3. These phenomena indicate that SD/WGD events serve as the primary drivers of the expansion of the AP2 gene family. The Ka/Ks ratios for PtAP2 genes are all below 1, suggesting they have undergone strong purifying selection during evolution (Supplementary Table S5). This finding is beneficial for the removal of deleterious mutations and helps to prevent functional differentiation, suggesting that the AP2 gene functions under negative selection are conserved [31].
To clarify the evolutionary relationship of the PtAP2 gene across species, we examined the collinearity among four species: the dicotyledons A. thaliana and S. purpurea, and the monocotyledons Z. mays and S. viridis (Figure 3b). The results indicated that the PtAP2 genes exhibited 19, 45, 13, and 14 collinear gene pairs with A. thaliana, S. purpurea, Z. mays, and S. viridis, respectively. These results suggest that P. tricocarpa and S. purpurea are closely related, and that the evolutionary distance of AP2 genes between dicotyledons is shorter than that between monocotyledons. The six AP2 genes—PteuANT1, PteuAP2-4, PtbasalANT1, PtbasalANT2, PteuAP2-2, and PteuAP2-6—from Populus demonstrate a collinear relationship with three other species, highlighting their evolutionary conservation within the plant AP2 gene family.

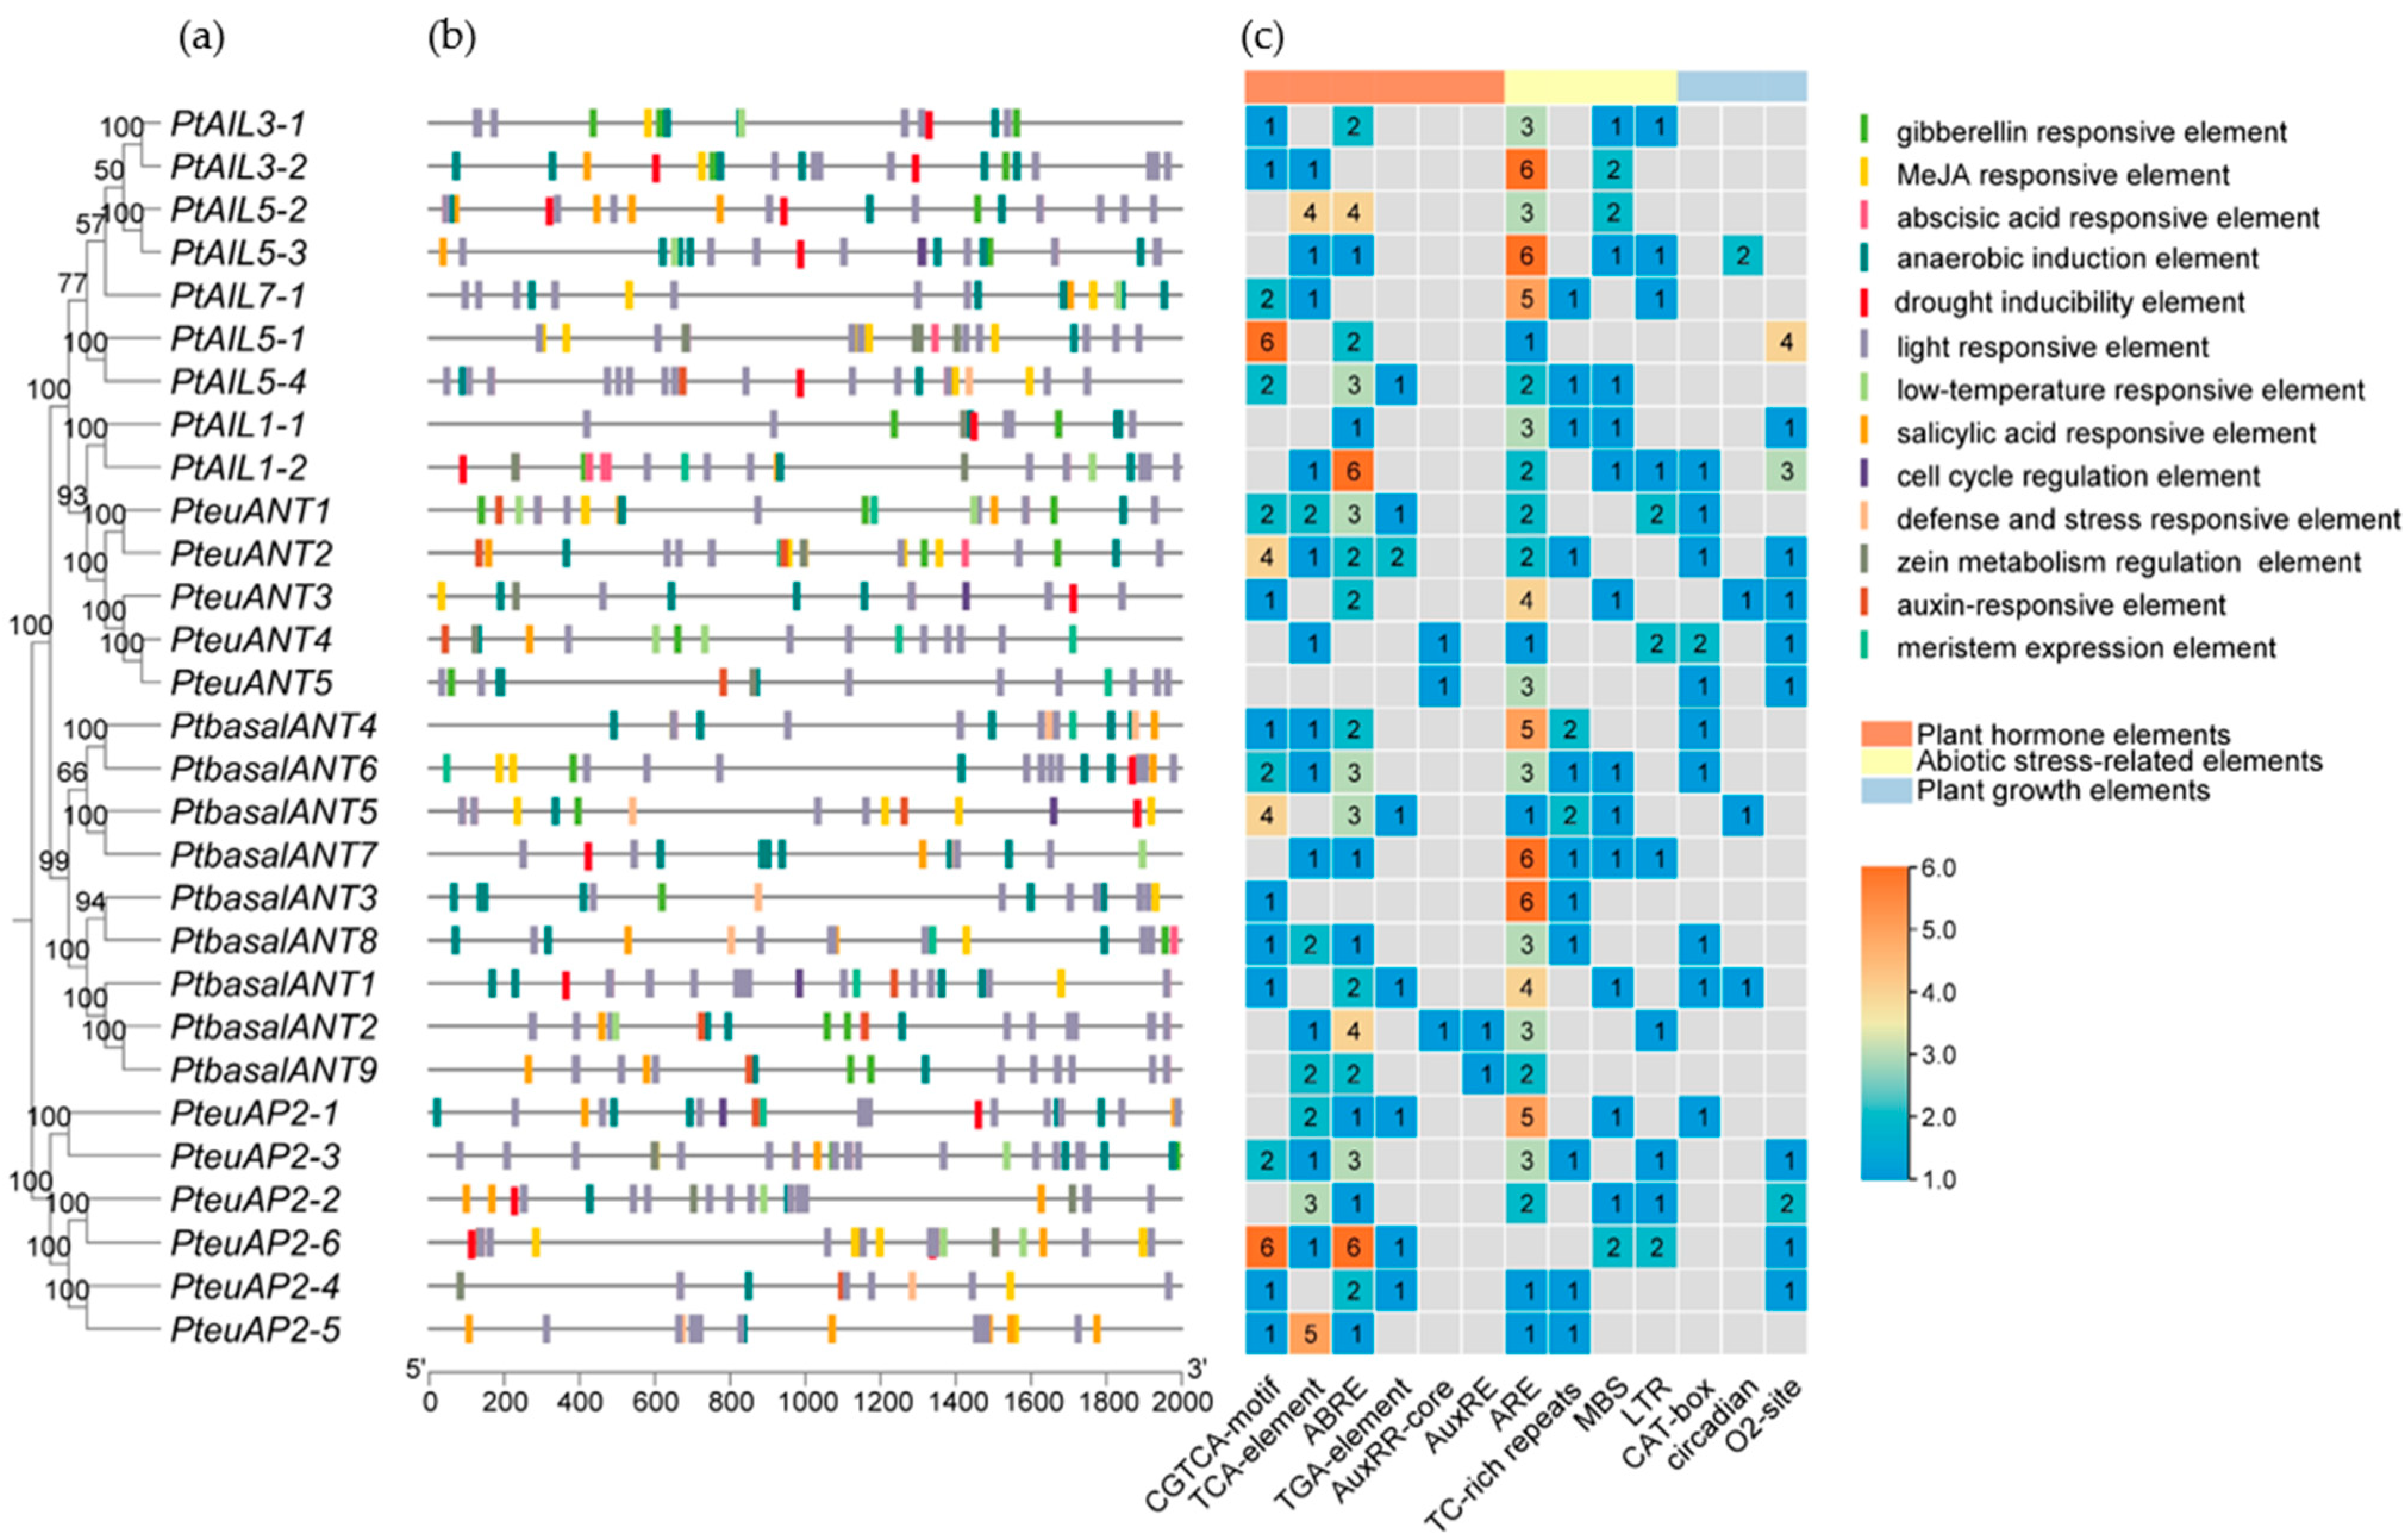
3.5. Analysis of Cis-Elements of PtAP2 Genes

Cis-elements are essential for the process of transcriptional regulation in higher plants. Analyzing cis-elements provides insights into transcriptional gene regulation, revealing the mechanisms of gene expression control [32]. The predictive analysis of the PtAP2 gene promoter sequences (Figure 4) reveals a substantial number of light-responsive elements, indicating that PtAP2s may play a significant role in plant light response. Additionally, hormone response elements (19.2%), growth and development elements (13.5%), and stress response elements (9.6%) also constitute a significant portion. The upstream promoter of PtAP2s contains various hormone response elements, including the ABA response elements (ABREs), auxin regulatory elements (AuxRR-core and AuxREs), Gibberella-related elements (GARE-motif, P-box, and TATC-box), MeJA response elements (TGACG-motif and CGTCA-motif), and salicylic acid-responsive elements linked to plant disease resistance (TGA-element and TCA-element). Additionally, there are antioxidant response elements (AREs), MBS for drought response, low temperature-responsive elements (LTR), and TC-rich elements related to stress response. ABRE is a key cis-acting element in transcriptional regulation responsive to osmotic stress, detecting signals mediated by ABA [33]. About 82.8% of AP2 genes in P. trichocarpa possess ABRE regulatory elements, indicating a potential role in osmotic stress response. The promoter sequence of the PtAP2 gene includes several regulatory elements, such as the MBSI for flavonoid biosynthesis, the O2-site for zein metabolism regulation, the circadian element, and the CAT-box related to meristem expression. Predictive analyses suggest that the PtAP2 gene significantly influences plant secondary metabolism, light response, hormone signaling, and stress response.

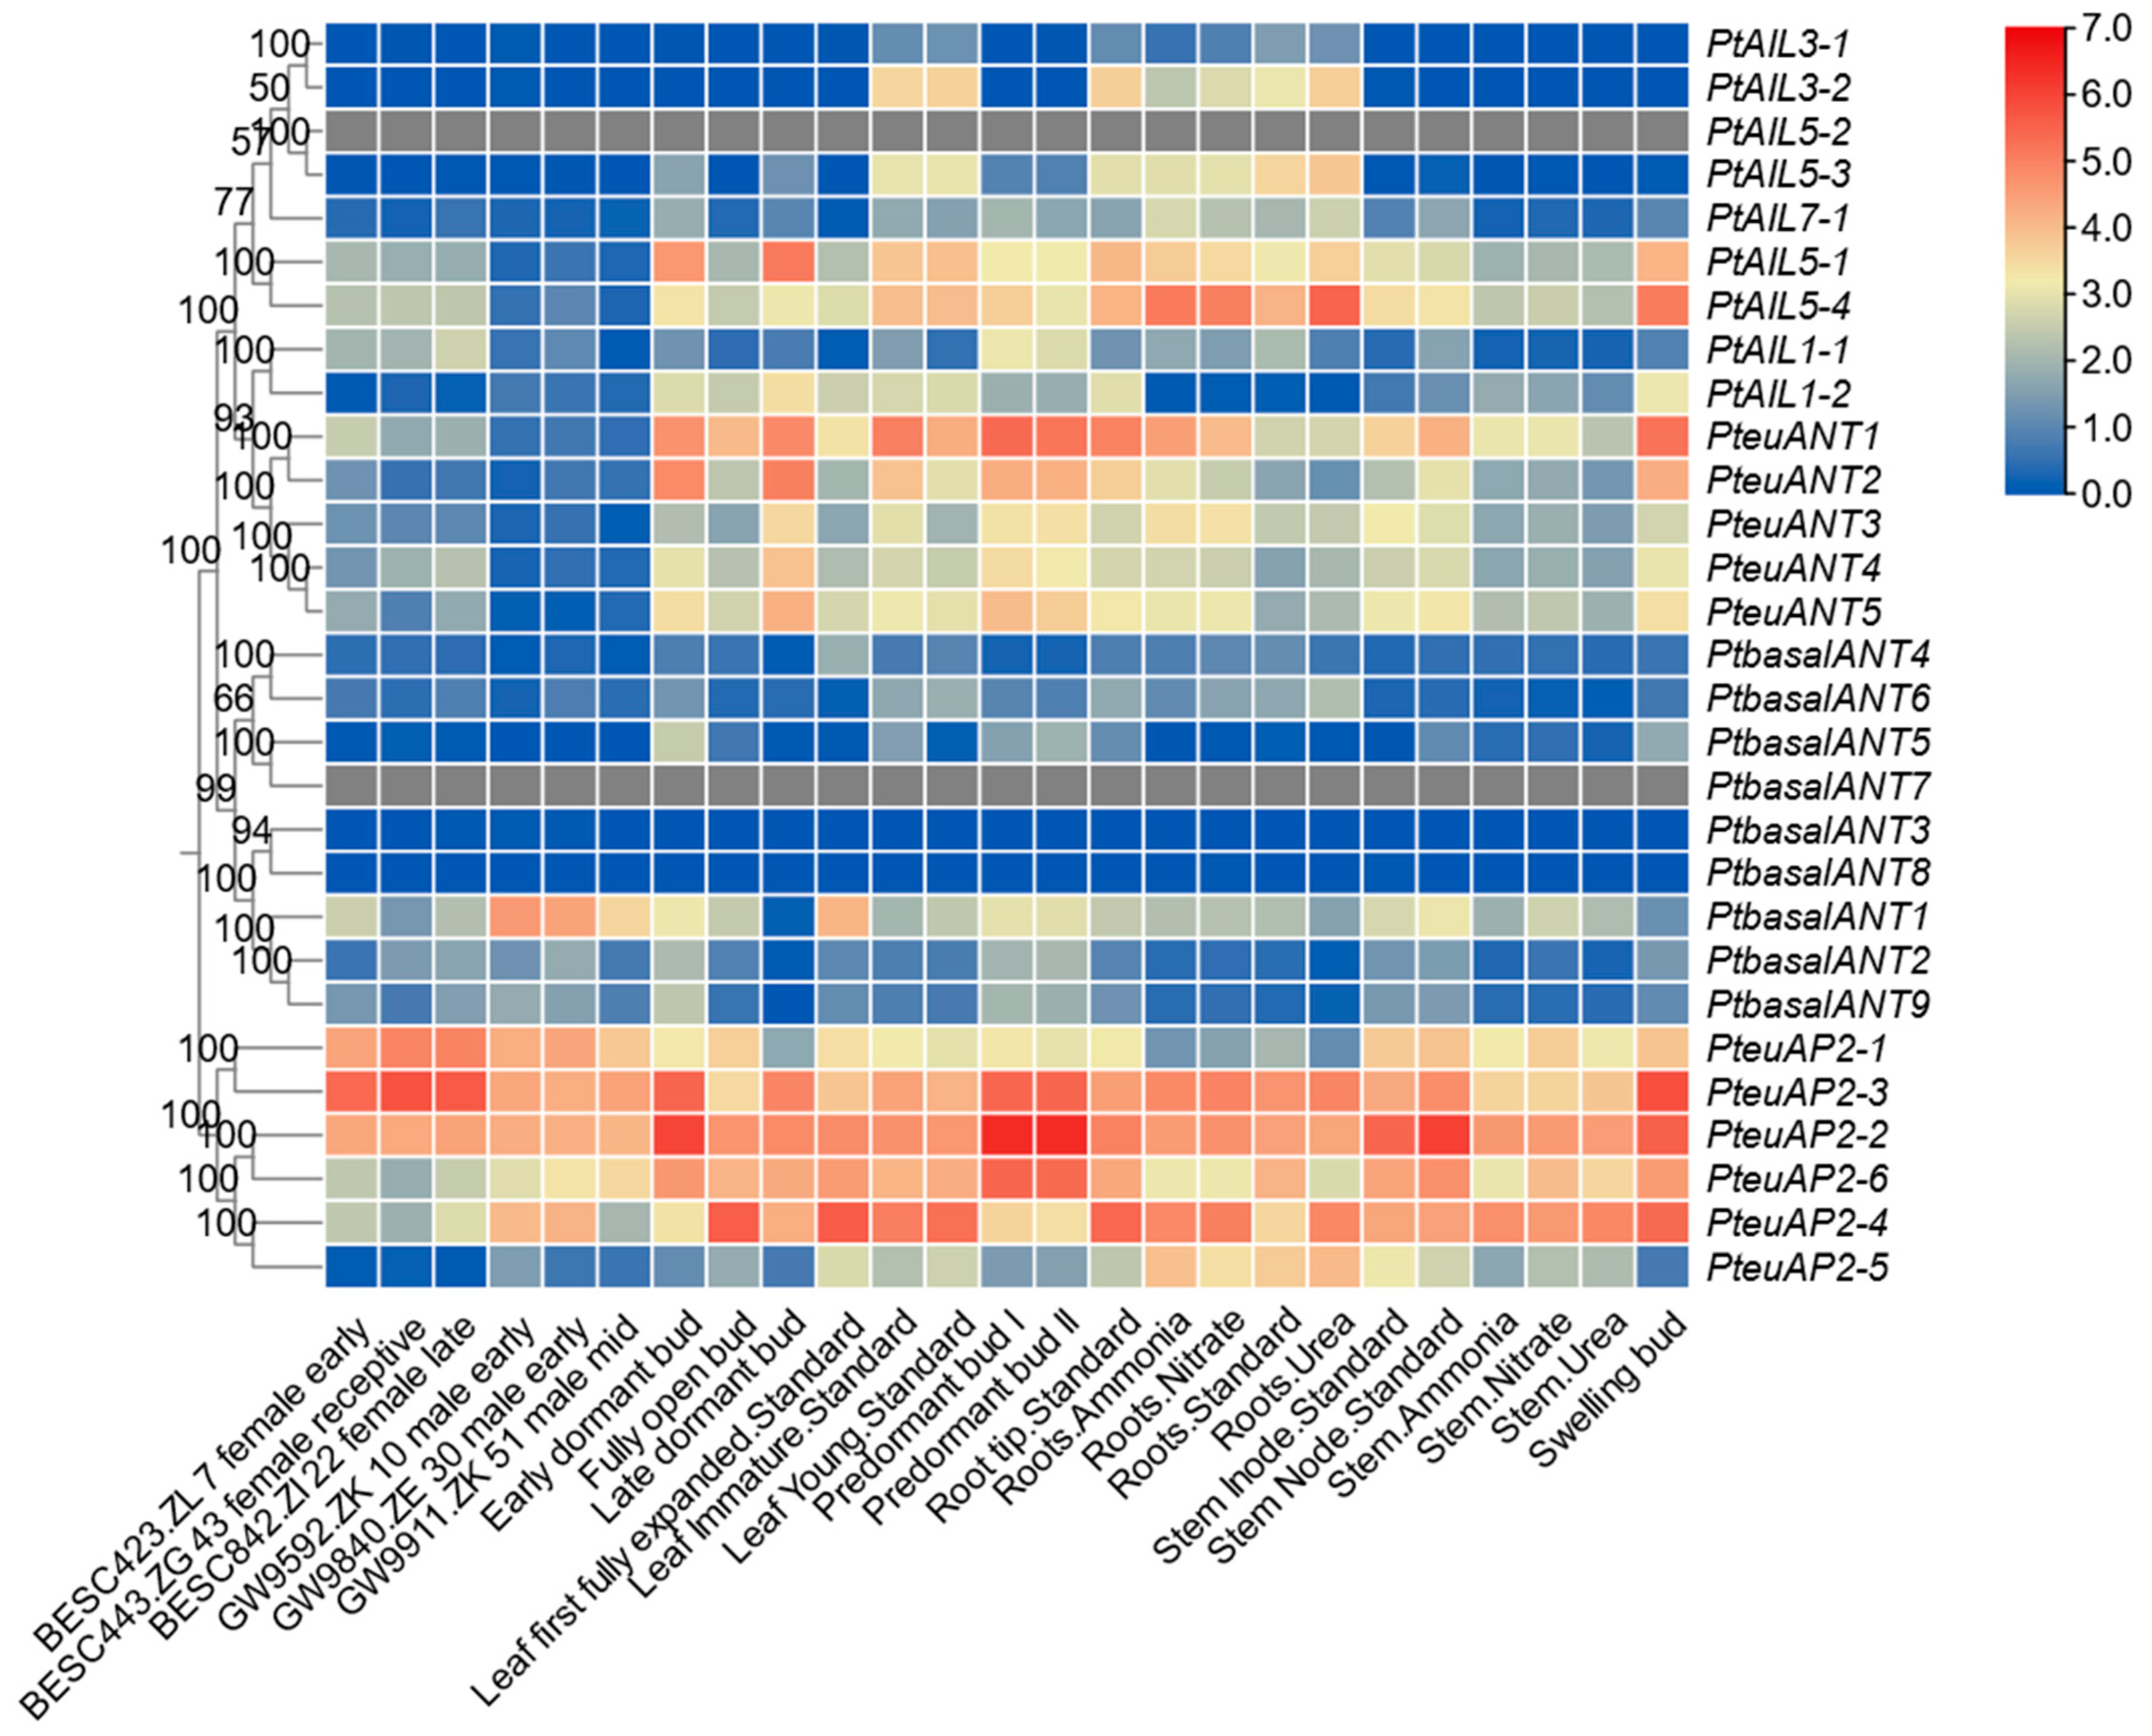
3.6. Analysis of the Expression Patterns of PtAP2 Genes in Various Tissues

This study investigated the expression patterns of the PtAP2 gene in P. trichocarpa by analyzing RNA-seq data from 25 developmental stages available on phytozome. The findings revealed notable differences in the expression patterns of PtAP2 genes among various clades (Figure 5). Gene expression levels in the euAP2 clade were significantly elevated compared to those in the basalANT and euANT clades. Notably, the expression of PteuAP2-2 in the poplar predormant bud II was the highest among all samples, with an FPKM value of 84.012, indicating that the PteuAP2-2 gene may primarily play a role during the overwintering growth stage of poplar. Consistent with the findings from poplar single-cell sequencing analysis [34], the expression level of the PtAP2 gene during stem development was notably low. Only the expression of basalANT1 was elevated within the basalANT clade. In summary, PtAP2 gene expression exhibits tissue specificity.

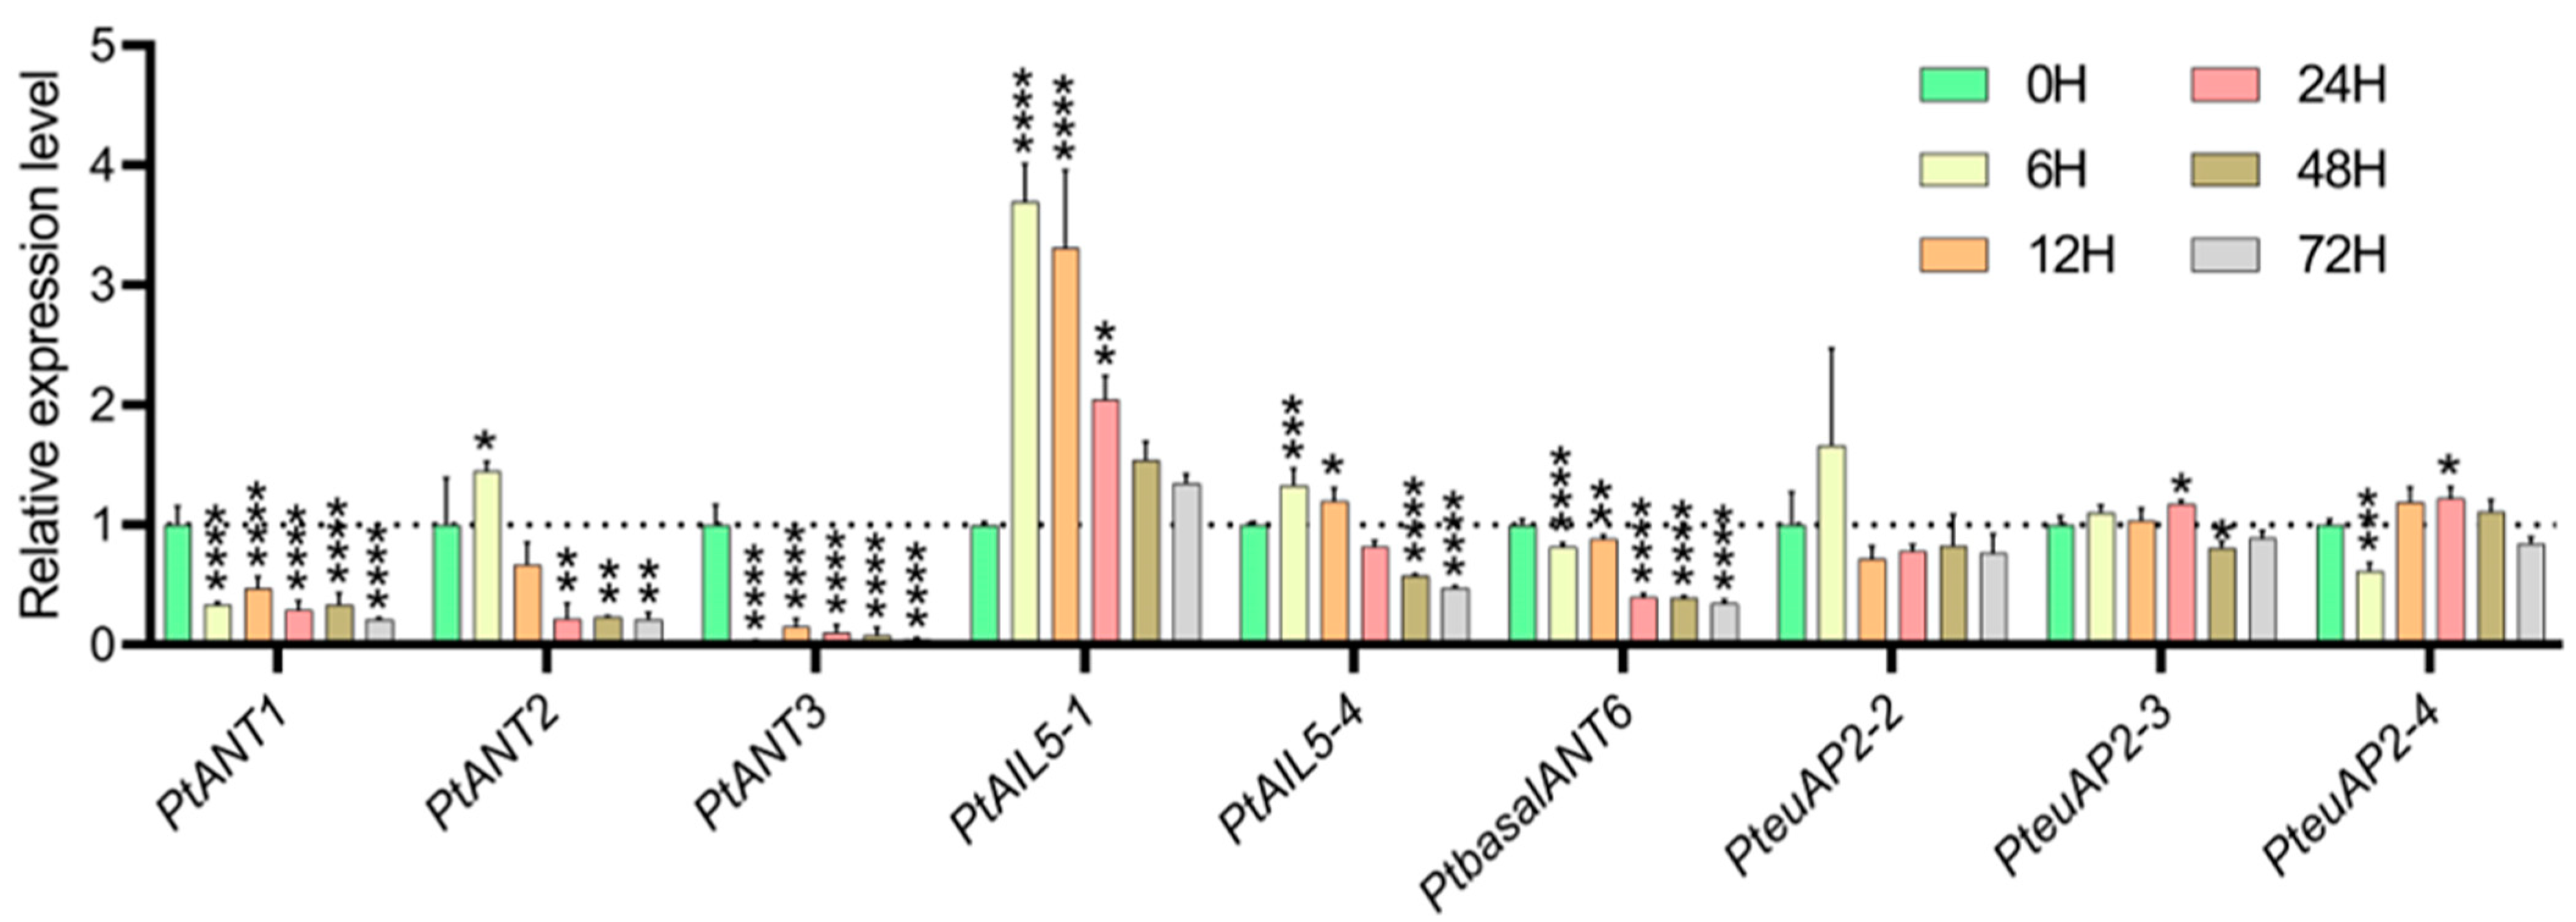
3.7. Analysis of the Expression Patterns of PtAP2 Genes Under NaCl Stress

In order to further elucidate the expression patterns of PtAP2 genes in poplar under salt stress, 84K seedlings were subjected to NaCl stress. Nine AP2 genes were randomly select for RT-qPCR analysis, using unstressed poplar samples as controls. The results (Figure 6) show a significant down-regulation trend in the expression levels of PtANT1 and PtANT3. With the prolongation of NaCl treatment duration, the expression level of the PtANT3 gene decreased to its lowest point at 72 h. The expression levels of PtANT2, PtAIL5-1, and PtAIL5-4 peaked at six h following the onset of salt stress; however, their expression subsequently decreased with the prolonged duration of salt treatment, ultimately reaching the lowest levels at 72 h. Notably, the expression level of the PtAIL5-1 gene at 6 h was approximately 3.7 times greater than that at 0 h. These findings imply that these genes might exhibit negative responses to regulatory activities during salt treatment, suggesting they could perform similar roles throughout the period of salt stress. In contrast, the expression levels of PteuAP2-2, PteuAP2-3, and PteuAP2-4 remained relatively unchanged, indicating that salt stress exerted minimal effects on these three euAP2 genes. The AP2 genes in poplar show unique expression patterns under salt stress, implying their potential involvement in the regulatory network responding to this stress. However, further research is needed to clarify their specific roles.

3.8. PtAP2 Genes Improve Salt Sensitivity of Recombinant Saccharomyces cerevisiae

As a eukaryotic model organism, S. cerevisiae is capable of partially validating gene functions under conditions of stress. Consequently, this study employed the S. cerevisiae system to ascertain the functional roles of PtAP2 members under salt stress conditions. This study found no significant growth differences between pYES2 empty control S. cerevisiae cells and those expressing PtANT1, PtANT2, PtAIL5-1, and PtAIL5-4 under non-stress conditions (Figure 7). Following exposure to 5 M NaCl for 6 h, the growth of non-transformed empty S. cerevisiae cells showed significantly superior growth compared to that of recombinant S. cerevisiae cells containing the PtANT2, PtAIL5-1, and PtAIL5-4 genes. Recombinant yeast cells with the PteuANT1 gene exhibited similar growth to the control group yeast cells. These results suggest that the expression of PteuANT2, PtAIL5-1, and PtAIL5-4 genes in S. cerevisiae cells enhances the sensitivity of these cells to salt stress (Figure 7). This constitutes preliminary evidence that these three salt-sensitive candidate genes are associated with the salt tolerance of Populus; however, their functional roles under poplar stress require further investigation.

4. Discussion

With advancements in sequencing technology and analytical tools, this study conducted a bidirectional BLAST and HMM search across three poplar databases, ultimately identifying 29 PtAP2 genes that each contain two complete AP2 domains (Figure S2). It is not surprising that this finding slightly differs from the 26 PtAP2 genes previously identified by Zhuang et al. using the Poplar v1.1 genome [35]. This study further analyzed the 26 PtAP2 genes reported by Zhuang et al. and found that the sequences of 9 genes were incomplete. For example, the sequences of gw1.XV1.1797.1 and gw1.V11243.1 contain only one AP2 domain, which does not conform to the definition of an AP2 gene [36] (Figure S1).
The biological roles of AP2 genes can be deduced from their phylogenetic relationships across various species. Phylogenetic analysis indicated that the PtAP2 protein clusters with the AP2 of Arabidopsis and maize, forming three distinct clades: euANT, basalANT, and euAP2. This finding is consistent with the classification of the AP2 gene in species such as Carya illinoinensis [37], T. aestivum L. [38], and C. praecox [6]. The evolutionary tree indicates that, compared to the ZmAP2 gene, the evolutionary distance between the PtAP2 gene and the AtAP2 gene is shorter. Moreover, the 3′ end of the genes in the euAP2 clades contains the microRNA172 (miR172) binding sequence. MiR172, a conserved plant miRNA, is essential for regulating organ development and stress responses by targeting AP2 subfamily genes [39]. All six euAP2s in the euAP2 clade of poplar contain miR172a target sites; however, the regulatory mechanisms between miR172 and PteuAP2s, as well as the molecular mechanisms underlying responses to various stresses, require further investigation.
Increases or decreases in the number of introns or exons are associated with the integration and rearrangement of gene segments [40]. The AP2 gene contains a notably higher number of exons compared to other subfamilies within the AP2/ERF gene family, despite variations in exon positions. This phenomenon is not exclusive to poplar trees. For instance, AP2 genes with more than four exons in Actinidia eriantha [41] account for 85%; all AP2 family members in S. melongena [15] possess six or more exons. In F. tataricum [16], the AP2 family genes generally have more than seven exons, except for the FtPinG0007082400 gene, which contains four exons. Approximately 96.3% of AP2 family members in S. matsudana [19] contain more than seven exons. The number of exons in the PtAP2 gene ranges from seven to eleven, suggesting that the AP2 genes may possess a more intricate structure and diverse functions. Eukaryotic genes are categorized as either intron-free or intron-containing, depending on the presence of introns. Plant intron-rich genes are predominantly found in early-diverging species [31]. In comparison to intron-free genes, intron-rich genes experience stronger selective pressure. The intron count in PtAP2s is consistently between seven and ten, suggesting its significant role in adaptation and evolution. Variations in introns indicate that the AP2 gene family has undergone significant evolutionary changes, which may contribute to the multifunctionality and redundancy of AP2 genes [42,43]. The PtAP2 proteins exhibit a motif distribution akin to AP2 proteins in other species, featuring highly conserved motifs 1, 2, and 4, which encompass the YRG and RAYD elements. YRG elements in AP2 proteins are characterized by their high basicity, whereas RAYD elements can form amphipathic α-helix structures. These sequence elements are essential for the function of AP2 proteins [36].
Similar to its distribution in other species, the AP2 gene on the poplar chromosome exhibits no apparent regular pattern [37,38]. Both SD/WGD and tandem duplication play essential roles in the evolution and expansion of plant gene families [44,45]. MCScanX serves as a robust tool for analyzing chromosomal structural alterations and the historical expansion of gene families. Research indicates that more than 50% of the genes in Populus have originated from whole-genome duplication WGD/SD events [46]. PtAP2 collinear gene pairs have been generated through SD/WGD events, without the involvement of tandem duplication. Consequently, we hypothesize that SD/WGD represent the primary drivers of PtAP2 gene family amplification. The results of the collinearity analysis of PtAP2 genes among different species indicated that the collinearity of AP2 genes among Saliciaceae species was significantly stronger than that observed in Cruciferae and Gramineae, paralleling the collinearity results of other gene families, such as auxin response factors, R2R3-MYB transcription factors, and the laccase gene family in poplar [47,48,49].
Preliminary predictions of gene function can be accomplished through the analysis of gene expression patterns [47]. Research has demonstrated that the expression of the majority of AP2 gene family members is tissue-specific. For instance, the ANT gene exhibits predominant expression in plant meristems [50]. In comparison to other tissues, the FtAP2 gene is more prominently expressed in fruits, flowers, and roots [16]. Additionally, the AP2 gene in wheat is primarily expressed in roots and flower spikes [38]. The PtAP2 gene is also highly expressed in young tissues, including terminal buds, female flowers, root tips, and axillary buds. Studies show that the AP2 gene family regulates the development of plant roots, leaves, and flowers. Overexpressing PtAIL1 increases adventitious root numbers, while RNA interference extends their formation period in poplar [9]. Liu et al. generated two frameshift mutants of ZmANT1 homologous genes in S. viridis using the CRISPR/Cas9 gene editing protocol. The photosynthetic and growth rates of these mutants decreased; some mutants exhibited smaller leaves, abnormal vein structures, and reduced seed weight [51]. The aforementioned results suggest that the PtAP2 gene may play a significant role in the reproductive and developmental processes of poplar.
Salinity and drought stress represent significant abiotic stresses that negatively impact plant growth. Salinity and drought stress frequently coexist; additionally, climatic aridity intensifies the evaporation of surface water vapor, resulting in the accumulation of saline and alkaline substances near the soil surface, ultimately causing soil salinization [52]. Plant cis-elements regulate the expression of stress-responsive genes in an appropriate temporal and spatial manner, minimizing unnecessary energy use during stress conditions [32]. Twenty-four PtAP2 genes contain both ABRE and ARE elements. ABRE, a cis-acting element involved in ABA-regulated gene expression, binds to the bZIP transcription factor to enhance plant response to salt stress [53]. Salt stress quickly increases reactive oxygen species (ROS) in plants, causing cellular redox imbalance and triggering significant oxidative stress responses. ARE binds to Nrf2 to activate genes encoding proteins that scavenge reactive oxygen species, thereby reducing cellular damage and playing a pivotal role in antioxidant defense mechanisms [54]. Analyzing differentially expressed genes using RNA-seq across various experimental samples is essential for understanding cellular biological processes under differing conditions. However, discrepancies resulting from experiments conducted in separate batches could lead to significant variations in outcomes [55]. The disparity in the expression patterns of genes PtAIL5-1 and PtAIL5-4 observed in this study compared to the report by Zhao et al. in their transcriptome analysis under salt stress in poplar might be due to deviations arising from dissimilar experimental conditions (Figure S1) [56]. The research findings from RNA-seq and RT-qPCR experiments indicate that several PtAP2 genes may play a role in regulating the response to NaCl-induced stress.
As a eukaryotic organism, S. cerevisiae exhibits similarities with plants in its molecular mechanisms for responding to abiotic stress. The utilization of the yeast expression system can offer insights into elucidating the functions of plant genes under non-biological stress conditions [57]. For instance, the overexpression of the TrFQR1 gene improves yeast stress tolerance under heat and toxicity conditions, while EsDREB2B enhances yeast resistance to salt and cold stress [58,59]. Moreover, the transcription factors TaVQ27-4D and HvPLATZ2 exhibited decreased tolerance to salt stress in recombinant yeast upon heterologous expression, despite showing upregulated expression trends under salt stress [60,61]. Likewise, the outcomes of salt stress experiments conducted on recombinant yeast carrying the transcription factors PteuANT1/2 and PtAIL5-1/5-4 indicate that certain PtAP2 genes might also function as negative regulatory elements in salt stress transcriptional regulation. These findings suggest that certain PtAP2 genes exhibit a negative response to salt stress processes in poplar, offering a valuable reference for future studies on PtAP2 genes.

5. Conclusions

This study identified 29 members of the PtAP2 gene subfamily in poplar through comprehensive genomic analysis. Analysis of gene structure and protein motifs revealed the conservation of PtAP2 gene structures within the same branch. It has been demonstrated that the expansion of PtAP2 gene family members originated from WGD events and underwent selective purification. Tissue-specific expression of PtAP2 genes in the euANT and basalANT clades, primarily in regions with intense cell activity like the cambium, root, and bud of poplar, implies their essential role in poplar growth and development. Additionally, most PtAP2 genes exhibited responsiveness to salt stress, showing a decreasing expression pattern under such conditions. Furthermore, yeast stress experiments indicated that four transcription factors, namely, PteuANT1/2 and PtAIL5-1/5-4, could heighten yeast sensitivity to salt stress. In conclusion, this study conducted a thorough analysis of the PtAP2 gene in poplar, laying a groundwork for future investigations into the PtAP2 gene family’s functions.

Supplementary Materials

The following supporting information can be downloaded at: https://www.mdpi.com/article/10.3390/f16010094/s1, Table S1. Primers used for RT-qPCR. Table S2. Primers used for amplification AP2 genes. Table S3. Primers used for the construction of the pYES2 vector. Table S4. The PtAP2 gene accession number list. Table S5. Ka/ks analysis in the PtAP2 genes of Populus trichocarpa. Figure S1. Transcriptome data of PtAP2 genes under salt stress. Figure S2.Prediction of protein domain structures of PtAP2 in version 1.1. Figure S3. Multiple sequence alignment of all PtAP2 proteins using ClustalX 2.1.

Author Contributions

Conceptualization H.L. and Y.L.; methodology, Z.H. and Q.F.; software, Z.W. and X.L.; validation, X.L. and Z.H.; formal analysis, Z.W.; writing original draft preparation, Z.W.; writing review and editing, H.L. and Y.L. All authors have read and agreed to the published version of the manuscript.

Funding

This research was funded by the Fundamental Research Funds of SKLTGB (grant number TGBFRF202402), and Outstanding Youth Fund Project of Natural Science Foundation of Henan Province (grant number 202300410119).

Data Availability Statement

Data are contained within the article and Supplementary Materials.

Conflicts of Interest

The authors declare no conflicts of interest.

References

  1. Dietz, K.-J.; Vogel, M.O.; Viehhauser, A. AP2/EREBP Transcription Factors Are Part of Gene Regulatory Networks and Integrate Metabolic, Hormonal and Environmental Signals in Stress Acclimation and Retrograde Signalling. Protoplasma 2010, 245, 3–14. [Google Scholar] [CrossRef]
  2. Feng, K.; Hou, X.-L.; Xing, G.-M.; Liu, J.-X.; Duan, A.-Q.; Xu, Z.-S.; Li, M.-Y.; Zhuang, J.; Xiong, A.-S. Advances in AP2/ERF Super-Family Transcription Factors in Plant. Crit. Rev. Biotechnol. 2020, 40, 750–776. [Google Scholar] [CrossRef] [PubMed]
  3. Kim, S.; Soltis, P.S.; Wall, K.; Soltis, D.E. Phylogeny and Domain Evolution in the APETALA2-like Gene Family. Mol. Biol. Evol. 2006, 23, 107–120. [Google Scholar] [CrossRef]
  4. Jofuku, K.D.; BoerI, B.G.W.; den MontaguI, M.V.; Okamuro, J.K. Control of Arabidopsis Flower and Seed Development by the Homeotic Gene APETALA2. Plant Cell 1994, 6, 1211–1225. [Google Scholar] [CrossRef] [PubMed]
  5. Zhang, Y.; Huang, S.; Wang, X.; Liu, J.; Guo, X.; Mu, J.; Tian, J.; Wang, X. Defective APETALA2 Genes Lead to Sepal Modification in Brassica Crops. Front. Plant Sci. 2018, 9, 367. [Google Scholar] [CrossRef]
  6. TIAN, M.; XU, Z.; LIU, X.; SUI, S.; LI, M.; LI, Z. Identification of the AP2 Subfamily Transcription Factors in Chimonanthus Praecox and the Functional Study of CpAP2-L11. Acta Hortic. Sin. 2023, 50, 382–396. [Google Scholar] [CrossRef]
  7. Jofuku, K.D.; Omidyar, P.K.; Gee, Z.; Okamuro, J.K. Control of Seed Mass and Seed Yield by the Floral Homeotic Gene APETALA2. Proc. Natl. Acad. Sci. USA 2005, 102, 3117–3122. [Google Scholar] [CrossRef] [PubMed]
  8. Luo, C.; Wang, S.; Ning, K.; Chen, Z.; Wang, Y.; Yang, J.; Wang, Q. LsAP2 Regulates Leaf Morphology by Inhibiting CIN-like TCP Transcription Factors and Repressing LsKAN2 in Lettuce. Hortic. Res. 2021, 8, 184. [Google Scholar] [CrossRef]
  9. Rigal, A.; Yordanov, Y.S.; Perrone, I.; Karlberg, A.; Tisserant, E.; Bellini, C.; Busov, V.B.; Martin, F.; Kohler, A.; Bhalerao, R.; et al. The AINTEGUMENTA LIKE1 Homeotic Transcription Factor PtAIL1 Controls the Formation of Adventitious Root Primordia in Poplar. Plant Physiol. 2012, 160, 1996–2006. [Google Scholar] [CrossRef] [PubMed]
  10. Shukla, R.K.; Raha, S.; Tripathi, V.; Chattopadhyay, D. Expression of CAP2, an APETALA2-Family Transcription Factor from Chickpea, Enhances Growth and Tolerance to Dehydration and Salt Stress in Transgenic Tobacco. Plant Physiol. 2006, 142, 113–123. [Google Scholar] [CrossRef]
  11. Hawku, M.D.; Goher, F.; Islam, M.A.; Guo, J.; He, F.; Bai, X.; Yuan, P.; Kang, Z.; Guo, J. TaAP2-15, An AP2/ERF Transcription Factor, Is Positively Involved in Wheat Resistance to Puccinia striiformis f. Sp. Tritici. Int. J. Mol. Sci. 2021, 22, 2080. [Google Scholar] [CrossRef] [PubMed]
  12. Meng, L.-S.; Wang, Y.-B.; Yao, S.-Q.; Liu, A. Arabidopsis AINTEGUMENTA Mediates Salt Tolerance by Trans-Repressing SCABP8. J. Cell Sci. 2015, 128, 2919–2927. [Google Scholar] [CrossRef] [PubMed]
  13. Chen, Y.; Dai, Y.; Li, Y.; Yang, J.; Jiang, Y.; Liu, G.; Yu, C.; Zhong, F.; Lian, B.; Zhang, J. Overexpression of the Salix Matsudana SmAP2-17 Gene Improves Arabidopsis Salinity Tolerance by Enhancing the Expression of SOS3 and ABI5. BMC Plant Biol. 2022, 22, 102. [Google Scholar] [CrossRef]
  14. Nakano, T.; Suzuki, K.; Fujimura, T.; Shinshi, H. Genome-Wide Analysis of the ERF Gene Family in Arabidopsis and Rice. Plant Physiol. 2006, 140, 411–432. [Google Scholar] [CrossRef]
  15. Li, D.; He, Y.; Li, S.; Shi, S.; Li, L.; Liu, Y.; Chen, H. Genome-Wide Characterization and Expression Analysis of AP2/ERF Genes in Eggplant (Solanum melongena L.). Plant Physiol. Biochem. 2021, 167, 492–503. [Google Scholar] [CrossRef] [PubMed]
  16. Liu, M.; Sun, W.; Ma, Z.; Zheng, T.; Huang, L.; Wu, Q.; Zhao, G.; Tang, Z.; Bu, T.; Li, C.; et al. Genome-Wide Investigation of the AP2/ERF Gene Family in Tartary Buckwheat (Fagopyum tataricum). BMC Plant Biol. 2019, 19, 84. [Google Scholar] [CrossRef] [PubMed]
  17. Licausi, F.; Giorgi, F.M.; Zenoni, S.; Osti, F.; Pezzotti, M.; Perata, P. Genomic and Transcriptomic Analysis of the AP2/ERF Superfamily in Vitis Vinifera. BMC Genom. 2010, 11, 719. [Google Scholar] [CrossRef]
  18. Li, P.; Chai, Z.; Lin, P.; Huang, C.; Huang, G.; Xu, L.; Deng, Z.; Zhang, M.; Zhang, Y.; Zhao, X. Genome-Wide Identification and Expression Analysis of AP2/ERF Transcription Factors in Sugarcane (Saccharum spontaneum L.). BMC Genom. 2020, 21, 685. [Google Scholar] [CrossRef]
  19. Zhang, J.; Zhang Shi, S.; Jiang, Y.; Zhong, F.; Liu, G.; Yu, C.; Lian, B.; Chen, Y. Genome-Wide Investigation of the AP2/ERF Superfamily and Their Expression under Salt Stress in Chinese Willow (Salix matsudana). PeerJ 2021, 9, e11076. [Google Scholar] [CrossRef]
  20. Zhang, X.; Liu, L.; Chen, B.; Qin, Z.; Xiao, Y.; Zhang, Y.; Yao, R.; Liu, H.; Yang, H. Progress in Understanding the Physiological and Molecular Responses of Populus to Salt Stress. Int. J. Mol. Sci. 2019, 20, 1312. [Google Scholar] [CrossRef] [PubMed]
  21. Zhao, C.; Zhang, H.; Song, C.; Zhu, J.-K.; Shabala, S. Mechanisms of Plant Responses and Adaptation to Soil Salinity. Innovation 2020, 1, 100017. [Google Scholar] [CrossRef]
  22. Mukhopadhyay, R.; Sarkar, B.; Jat, H.S.; Sharma, P.C.; Bolan, N.S. Soil Salinity under Climate Change: Challenges for Sustainable Agriculture and Food Security. J. Environ. Manag. 2021, 280, 111736. [Google Scholar] [CrossRef] [PubMed]
  23. Gasteiger, E.; Alexandre, G.; Christine, H.; Ivan, I.; Ron, D.A.; Amos, B. ExPASy: The Proteomics Server for in-Depth Protein Knowledge and Analysis. Nucleic Acids Res. 2003, 31, 3784–3788. [Google Scholar] [CrossRef] [PubMed]
  24. Horton, P.; Park, K.-J.; Obayashi, T.; Fujita, N.; Harada, H.; Adams-Collier, C.J.; Nakai, K. WoLF PSORT: Protein Localization Predictor. Nucleic Acids Res. 2007, 35, W585–W587. [Google Scholar] [CrossRef]
  25. Zhang, J.; Liao, J.; Ling, Q.; Xi, Y.; Qian, Y. Genome-Wide Identification and Expression Profiling Analysis of Maize AP2/ERF Superfamily Genes Reveal Essential Roles in Abiotic Stress Tolerance. BMC Genom. 2022, 23, 125. [Google Scholar] [CrossRef] [PubMed]
  26. Chen, C.; Wu, Y.; Li, J.; Wang, X.; Zeng, Z.; Xu, J.; Liu, Y.; Feng, J.; Chen, H.; He, Y.; et al. TBtools-II: A “One for All, All for One” Bioinformatics Platform for Biological Big-Data Mining. Mol. Plant 2023, 16, 1733–1742. [Google Scholar] [CrossRef]
  27. Koressaar, T.; Lepamets, M.; Kaplinski, L.; Raime, K.; Andreson, R.; Remm, M. Primer3_masker: Integrating Masking of Template Sequence with Primer Design Software. Bioinformatics 2018, 34, 1937–1938. [Google Scholar] [CrossRef] [PubMed]
  28. Chrysanthou, S.; Tang, Q.; Lee, J.; Taylor, S.J.; Zhao, Y.; Steidl, U.; Zheng, D.; Dawlaty, M.M. The DNA Dioxygenase Tet1 Regulates H3K27 Modification and Embryonic Stem Cell Biology Independent of Its Catalytic Activity. Nucleic Acids Res. 2022, 50, 3169–3189. [Google Scholar] [CrossRef]
  29. Zhang, W.; Yang, G.; Zou, X.; Mu, D.; Li, H.; Zang, D.; Wang, Y. Expression of Ethylene Response Factors (ERFs) from Betula platyphylla and the Confer Salt and Drought Tolerance Analysis in a Yeast. J. Plant Biochem. Biotechnol. 2017, 26, 35–42. [Google Scholar] [CrossRef]
  30. McLeay, R.C.; Bailey, T.L. Motif Enrichment Analysis: A Unified Framework and an Evaluation on ChIP Data. BMC Bioinform. 2010, 11, 165. [Google Scholar] [CrossRef] [PubMed]
  31. Zhu, K.; Fan, P.; Liu, H.; Tan, P.; Ma, W.; Mo, Z.; Zhao, J.; Chu, G.; Peng, F. Insight into the CBL and CIPK Gene Families in Pecan (Carya illinoinensis): Identification, Evolution and Expression Patterns in Drought Response. BMC Plant Biol. 2022, 22, 221. [Google Scholar] [CrossRef] [PubMed]
  32. Marand, A.P.; Eveland, A.L.; Kaufmann, K.; Springer, N.M. Cis-Regulatory Elements in Plant Development, Adaptation, and Evolution. Annu. Rev. Plant Biol. 2023, 74, 111–137. [Google Scholar] [CrossRef]
  33. Kim, J.-S.; Mizoi, J.; Yoshida, T.; Fujita, Y.; Nakajima, J.; Ohori, T.; Todaka, D.; Nakashima, K.; Hirayama, T.; Shinozaki, K.; et al. An ABRE Promoter Sequence Is Involved in Osmotic Stress-Responsive Expression of the DREB2A Gene, Which Encodes a Transcription Factor Regulating Drought-Inducible Genes in Arabidopsis. Plant Cell Physiol. 2011, 52, 2136–2146. [Google Scholar] [CrossRef] [PubMed]
  34. Du, J.; Wang, Y.; Chen, W.; Xu, M.; Zhou, R.; Shou, H.; Chen, J. High-Resolution Anatomical and Spatial Transcriptome Analyses Reveal Two Types of Meristematic Cell Pools within the Secondary Vascular Tissue of Poplar Stem. Mol. Plant 2023, 16, 809–828. [Google Scholar] [CrossRef] [PubMed]
  35. Zhuang, J.; Cai, B.; Peng, R.-H.; Zhu, B.; Jin, X.-F.; Xue, Y.; Gao, F.; Fu, X.-Y.; Tian, Y.-S.; Zhao, W.; et al. Genome-Wide Analysis of the AP2/ERF Gene Family in Populus trichocarpa. Biochem. Biophys. Res. Commun. 2008, 371, 468–474. [Google Scholar] [CrossRef]
  36. Okamuro, J.K.; Caster, B.; Villarroel, R.; Van Montagu, M.; Jofuku, K.D. The AP2 Domain of APETALA2 Defines a Large New Family of DNA Binding Proteins in Arabidopsis. Proc. Natl. Acad. Sci. USA 1997, 94, 7076–7081. [Google Scholar] [CrossRef] [PubMed]
  37. Yang, Z.; Jin, H.; Chen, J.; Li, C.; Wang, J.; Luo, J.; Wang, Z. Identification and Analysis of the AP2 Subfamily Transcription Factors in the Pecan (Carya illinoinensis). Int. J. Mol. Sci 2021, 22, 13568. [Google Scholar] [CrossRef]
  38. Zhao, Y.; Ma, R.; Xu, D.; Bi, H.; Xia, Z.; Peng, H. Genome-Wide Identification and Analysis of the AP2 Transcription Factor Gene Family in Wheat (Triticum aestivum L.). Front. Plant Sci. 2019, 10, 1286. [Google Scholar] [CrossRef]
  39. Lian, H.; Wang, L.; Ma, N.; Zhou, C.-M.; Han, L.; Zhang, T.-Q.; Wang, J.-W. Redundant and Specific Roles of Individual MIR172 Genes in Plant Development. PLoS Biol. 2021, 19, e3001044. [Google Scholar] [CrossRef]
  40. Xu, G.; Guo, C.; Shan, H.; Kong, H. Divergence of Duplicate Genes in Exon–Intron Structure. Proc. Natl. Acad. Sci. USA 2012, 109, 1187–1192. [Google Scholar] [CrossRef] [PubMed]
  41. Jiang, Q.; Wang, Z.; Hu, G.; Yao, X. Genome-Wide Identification and Characterization of AP2/ERF Gene Superfamily during Flower Development in Actinidia eriantha. BMC Genom. 2022, 23, 650. [Google Scholar] [CrossRef] [PubMed]
  42. Le, D.T.; Nishiyama, R.; Watanabe, Y.; Mochida, K.; Yamaguchi-Shinozaki, K.; Shinozaki, K.; Tran, L.-S.P. Genome-Wide Survey and Expression Analysis of the Plant-Specific NAC Transcription Factor Family in Soybean during Development and Dehydration Stress. DNA Res. 2011, 18, 263–276. [Google Scholar] [CrossRef]
  43. Liu, H.; Lyu, H.-M.; Zhu, K.; Van de Peer, Y.; (Max) Cheng, Z.-M. The Emergence and Evolution of Intron-Poor and Intronless Genes in Intron-Rich Plant Gene Families. Plant J. 2021, 105, 1072–1082. [Google Scholar] [CrossRef]
  44. Panchy, N.L.; Azodi, C.B.; Winship, E.F.; O’Malley, R.C.; Shiu, S.-H. Expression and Regulatory Asymmetry of Retained Arabidopsis thaliana Transcription Factor Genes Derived from Whole Genome Duplication. BMC Evol. Biol. 2019, 19, 77. [Google Scholar] [CrossRef] [PubMed]
  45. Hanada, K.; Zou, C.; Lehti-Shiu, M.D.; Shinozaki, K.; Shiu, S.-H. Importance of Lineage-Specific Expansion of Plant Tandem Duplicates in the Adaptive Response to Environmental Stimuli. Plant Physiol. 2008, 148, 993–1003. [Google Scholar] [CrossRef]
  46. Wang, Y.; Tang, H.; DeBarry, J.D.; Tan, X.; Li, J.; Wang, X.; Lee, T.; Jin, H.; Marler, B.; Guo, H.; et al. MCScanX: A Toolkit for Detection and Evolutionary Analysis of Gene Synteny and Collinearity. Nucleic Acids Res. 2012, 40, e49. [Google Scholar] [CrossRef] [PubMed]
  47. Liao, B.; Wang, C.; Li, X.; Man, Y.; Ruan, H.; Zhao, Y. Genome-Wide Analysis of the Populus trichocarpa Laccase Gene Family and Functional Identification of PtrLAC23. Front. Plant Sci. 2023, 13, 1063813. [Google Scholar] [CrossRef] [PubMed]
  48. Liu, Y.; Wang, R.; Yu, J.; Huang, S.; Zhang, Y.; Wei, H.; Wei, Z. Genome-Wide Identification and Characterization of Auxin Response Factor (ARF) Gene Family Involved in Wood Formation and Response to Exogenous Hormone Treatment in Populus trichocarpa. Int. J. Mol. Sci. 2023, 24, 740. [Google Scholar] [CrossRef] [PubMed]
  49. Zhang, X.; Wang, H.; Chen, Y.; Huang, M.; Zhu, S. Comprehensive Genome-Wide Analyses of Poplar R2R3-MYB Transcription Factors and Tissue-Specific Expression Patterns under Drought Stress. Int. J. Mol. Sci. 2023, 24, 5389. [Google Scholar] [CrossRef] [PubMed]
  50. Nole-Wilson, S.; Tranby, T.L.; Krizek, B.A. AINTEGUMENTA-like (AIL) Genes Are Expressed in Young Tissues and May Specify Meristematic or Division-Competent States. Plant Mol. Biol. 2005, 57, 613–628. [Google Scholar] [CrossRef] [PubMed]
  51. Liu, W.-Y.; Lin, H.-H.; Yu, C.-P.; Chang, C.-K.; Chen, H.-J.; Lin, J.-J.; Lu, M.-Y.J.; Tu, S.-L.; Shiu, S.-H.; Wu, S.-H.; et al. Maize ANT1 Modulates Vascular Development, Chloroplast Development, Photosynthesis, and Plant Growth. Proc. Natl. Acad. Sci. USA 2020, 117, 21747–21756. [Google Scholar] [CrossRef] [PubMed]
  52. Zhao, S.; Zhang, Q.; Liu, M.; Zhou, H.; Ma, C.; Wang, P. Regulation of Plant Responses to Salt Stress. Int. J. Mol. Sci. 2021, 22, 4609. [Google Scholar] [CrossRef] [PubMed]
  53. Hossain, M.A.; Cho, J.-I.; Han, M.; Ahn, C.-H.; Jeon, J.-S.; An, G.; Park, P.B. The ABRE-Binding bZIP Transcription Factor OsABF2 Is a Positive Regulator of Abiotic Stress and ABA Signaling in Rice. J. Plant Physiol. 2010, 167, 1512–1520. [Google Scholar] [CrossRef]
  54. Jeong, W.-S.; Jun, M.; Kong, A.-N.T. Nrf2: A Potential Molecular Target for Cancer Chemoprevention by Natural Compounds. Antioxid. Redox Signal. 2006, 8, 99–106. [Google Scholar] [CrossRef]
  55. Scholes, A.N.; Lewis, J.A. Comparison of RNA Isolation Methods on RNA-Seq: Implications for Differential Expression and Meta-Analyses. BMC Genom. 2020, 21, 249. [Google Scholar] [CrossRef]
  56. Zhao, Y.; Jia, K.; Tian, Y.; Han, K.; El-Kassaby, Y.A.; Yang, H.; Si, H.; Sun, Y.; Li, Y. Time-Course Transcriptomics Analysis Reveals Key Responses of Populus to Salt Stress. Ind. Crops Prod. 2023, 194, 116278. [Google Scholar] [CrossRef]
  57. Gao, L.-W.; Yang, S.-L.; Wei, S.-W.; Huang, D.-F.; Zhang, Y.-D. Supportive Role of the Na+ Transporter CmHKT1;1 from Cucumis Melo in Transgenic Arabidopsis Salt Tolerance through Improved K+/Na+ Balance. Plant Mol. Biol. 2020, 103, 561–580. [Google Scholar] [CrossRef] [PubMed]
  58. Cheng, B.; Zhou, M.; Tang, T.; Hassan, M.J.; Zhou, J.; Tan, M.; Li, Z.; Peng, Y. A Trifolium Repens Flavodoxin-like Quinone Reductase 1 (TrFQR1) Improves Plant Adaptability to High Temperature Associated with Oxidative Homeostasis and Lipids Remodeling. Plant J. 2023, 115, 369–385. [Google Scholar] [CrossRef] [PubMed]
  59. Li, X.; Zhang, D.; Li, H.; Wang, Y.; Zhang, Y.; Wood, A.J. EsDREB2B, a Novel Truncated DREB2-Type Transcription Factor in the Desert Legume Eremosparton songoricum, Enhances Tolerance to Multiple Abiotic Stresses in Yeast and Transgenic Tobacco. BMC Plant Biol. 2014, 14, 44. [Google Scholar] [CrossRef]
  60. Ma, J.; Wang, R.; Zhao, H.; Li, L.; Zeng, F.; Wang, Y.; Chen, M.; Chang, J.; He, G.; Yang, G.; et al. Genome-Wide Characterization of the VQ Genes in Triticeae and Their Functionalization Driven by Polyploidization and Gene Duplication Events in Wheat. Int. J. Biol. Macromol. 2023, 243, 125264. [Google Scholar] [CrossRef] [PubMed]
  61. Cai, K.; Song, X.; Yue, W.; Liu, L.; Ge, F.; Wang, J. Identification and Functional Characterization of Abiotic Stress Tolerance-Related PLATZ Transcription Factor Family in Barley (Hordeum vulgare L.). Int. J. Mol. Sci. 2024, 25, 10191. [Google Scholar] [CrossRef] [PubMed]
Figure 1. Phylogenetic tree of poplar AP2 gene family. AP2 polypeptide sequences derived from poplar, maize, and Arabidopsis were used to construct a phylogenetic tree utilizing the neighbor-joining (NJ) method with 1000 bootstrap replicates in MEGA 6.0. Different colors and shapes represent different clades of the AP2 family. The red triangle, green box, and blue circle represent AP2 protein of Populus trichocarpa, Arabidopsis thaliana, and Zea mays, respectively.
Forests 16 00094 g001
Figure 2. Evolutionary relationships, conserved protein motifs, domains, and gene structures of the 29 PtAP2s. (a) The phylogenetic tree was constructed based on protein sequences using the NJ method by MEGA7.0; differently colored bars represent grouping of PtAP2 genes. (b) Gene structures. Green boxes represent 5′UTR or 3′UTR regions, and black lines represent introns regions. (c) Motif composition of PtAP2s. Differently colored boxes indicate different motifs. The length of genes or proteins can be estimated using the scale at the bottom.
Forests 16 00094 g002
Figure 3. Localization and collinear relations of PtAP2 genes. (a) Each gene was mapped to the chromosome based on its physical location. The chromosomes of poplar are depicted as blue bar charts, with white numbers corresponding to the chromosomes of poplar. The column charts represent the gene density on the chromosomes. The yellow lines represent collinear pairs of PtAP2 genes. (b) Syntenic relationships of the AP2 genes among Populus trichocarpa, Arabidopsis thaliana, Zea mays, and Setaria viridis. The blue lines delineate the syntenic AP2 gene pairs, while the gray lines illustrate the collinear blocks in poplar that correspond to the four plant genomes.
Forests 16 00094 g003
Figure 4. Analysis of cis-acting elements in PtAP2 Genes. (a) The phylogenetic tree of 29 PtAP2 genes. (b) Analysis of cis-acting elements within the 2000 bp upstream promoter region of PtAP2 genes, where distinct colors of boxes signify various cis-acting elements. (c) Quantity of cis-acting elements found in the promoters of each PtAP2 gene.
Forests 16 00094 g004
Figure 5. Expression profiles of PtAP2 genes in 25 samples including different tissues and developmental stages. The expression level of PtAP2 genes was transformed through log2 FPKM+1.
Forests 16 00094 g005
Figure 6. RT-qPCR profiles of 9 PtAP2s in 84K with salt treatment. The relative expression values of these PtAP2 genes were calculated by the 2−ΔΔCT method. The leaves were harvested at 0, 6, 12, 24, and 72 h salt treatment. An asterisk indicates that the expression level after stress was significantly different to the level before the stress (* p < 0.05, ** p < 0.01, *** p < 0.001, **** p < 0.0001).
Forests 16 00094 g006
Figure 7. Expression of PteuANT1, PteuANT2, PtAIL5-1, and PtAIL5-4 in yeast with induced sensitivity to salt stress. The left panel represents the growth of yeast cells under normal conditions, and the right panel represents the growth of yeast cells under salt stress.
Forests 16 00094 g007
Table 1. AP2 subfamily genes in P. trichocarpa.
Gene Accession NumberGene NameGeneProteinClade
Chromosome LocationCDS (bp)Size
(aa)
MW
(kDa)
pISubcellular Localization
Potri.001G169500PtAIL1-1Chr01:4692443..14305089164754960.66 6.50 nucleuseuANT
Potri.003G064700PtAIL1-2Chr03:8039191..9350664170456863.03 8.44 nucleus
Potri.001G018400PtAIL3-1Chr01:1345695..1349157163854660.396.18nucleus
Potri.003G205700PtAIL3-2Chr03:11385939..20649330164754960.57 6.20 nucleus
Potri.006G167700PtAIL5-1Chr06:18079435..17286293163854659.52 8.18 nucleus
Potri.008G076400PtAIL5-2Chr08:29793053..4764074216672279.23 6.00 nucleus
Potri.010G181000PtAIL5-3Chr10:33139801..17939215216072078.66 6.05 nucleus
Potri.018G091600PtAIL5-4Chr18:44853419..12089067163254459.22 6.97 nucleus
Potri.007G011600PtAIL7-1Chr07:23099557..924669152150755.60 5.90 nucleus
Potri.002G114800PteuANT1Chr02:6365817..8647364199266473.05 6.47 nucleus
Potri.005G148400PteuANT2Chr05:14732687..13163410200466873.26 6.93 nucleus
Potri.007G007400PteuANT3Chr07:21426183..520362202867674.80 6.52 nucleus
Potri.014G008100PteuANT4Chr14:38159923..839194165055061.15 7.08 nucleus
Potri.014G012200PteuANT5Chr14:39833297..1269003205868675.94 6.35 nucleus
Potri.001G041500PtbasalANT1Chr01:3019069..3023748112537542.34 6.52 chloroplastbasalANT
Potri.003G185300PtbasalANT2Chr03:9712565..19101511105635239.71 7.14 chloroplast
Potri.006G179900PtbasalANT3Chr06:19752809..1941224791830634.85 8.72 chloroplast
Potri.008G011900PtbasalANT4Chr08:26446305..664128114338140.61 5.91 chloroplast
Potri.010G092800PtbasalANT5Chr10:31466427..11580707126642247.69 8.69 nucleus
Potri.010G247200PtbasalANT6Chr10:36486549..22108246126342146.68 5.59 chloroplast
Potri.017G078600PtbasalANT7Chr17:43180045..9177502116138743.74 8.22 nucleus
Potri.018G102200PtbasalANT8Chr18:46526793..12967019106235439.87 6.67 chloroplast
Potri.T081332PtbasalANT9scaffold92:48200167..82174105635239.71 7.14 chloroplast
Potri.005G140700PteuAP2-1Chr05:13059313..11809464151250455.92 6.48 nucleuseuAP2
Potri.006G132400PteuAP2-2Chr06:16406061..10884850149149754.48 6.34 nucleus
Potri.007G046200PteuAP2-3Chr07:24772931..4214823160553559.51 6.75 nucleus
Potri.008G045300PteuAP2-4Chr08:28119679..2606980152150756.14 6.84 nucleus
Potri.010G216200PteuAP2-5Chr10:34813175..20337268151250455.32 6.40 nucleus
Potri.016G084500PteuAP2-6Chr16:41506671..6602171148549553.96 8.33 nucleus
Disclaimer/Publisher’s Note: The statements, opinions and data contained in all publications are solely those of the individual author(s) and contributor(s) and not of MDPI and/or the editor(s). MDPI and/or the editor(s) disclaim responsibility for any injury to people or property resulting from any ideas, methods, instructions or products referred to in the content.

