Article

Response of Understory Plant Diversity to Edge Effects in Plantation Forests on the Loess Plateau

1
College of Landscape Architecture and Art, Northwest A&F University, Yangling 712100, China
2
College of Agriculture and Rural Development, Hainan Open University, Haikou 570208, China
*
Author to whom correspondence should be addressed.
These authors contributed equally to this work.
Forests 2025, 16(1), 87; https://doi.org/10.3390/f16010087
Submission received: 16 December 2024 / Revised: 5 January 2025 / Accepted: 6 January 2025 / Published: 8 January 2025
(This article belongs to the Section Forest Biodiversity)

Abstract

:
The majority of the world’s forests are located at landscape edges and are highly fragmented; the plantations on the Loess Plateau are no exception, experiencing pronounced edge effects. However, edge effects are often overlooked in assessments of carbon storage and biodiversity, and the extent and impact of these effects on Loess Plateau plantations remain inadequately understood. The objective of this study is to reveal how edge effects influence biodiversity and species composition and to examine their long-term impacts on ecosystem structure and function. Furthermore, it aims to explore the mechanisms underlying edge effects in plantation systems. Examining these effects is essential for guiding forest management practices and formulating effective biodiversity conservation strategies, thereby providing scientific insights to support the ecological restoration and sustainable management of plantations. In this study, we classified 44 sample plots into four groups according to their distances from the plantation edges to compare and analyze species composition. Additionally, we evaluated the intensity and range of edge effects on stand structure, species diversity, and carbon storage. The Shannon index of understory vegetation was used as the dependent variable, with canopy cover, edge distance, and stand density as independent variables. We used multiple linear regression to examine the effects of these factors on the Shannon index of understory vegetation (shrubs, herbs, and trees). The key findings were as follows: (1) Tree height did not exhibit edge effects across any distance range, while the Shannon index, species richness, and carbon storage showed edge effects within 54 m from the edge. Diameter at breast height (DBH), stand density, and canopy cover exhibited edge effects within 0–83 m from the edge. (2) The significance values for edge distance and canopy cover in the linear regression with the Shannon index were 0.99 and 0.51, respectively, showing no significant correlation. In contrast, stand density had a significant positive effect on the Shannon index (p = 0.03). (3) Notable differences in understory species composition were observed between the outermost and innermost groups of the plantation. Climatic conditions on the Loess Plateau exert a dominant influence on understory plants, altering species composition and abundance. High stand density appeared to moderate the microclimate, contributing to a higher understory Shannon index, but reducing carbon storage. Our findings suggest that the edge effects of plantation forests on the Loess Plateau exert varying degrees of influence on different indicators. Management decisions should be guided by the specific silvicultural objectives, whether the manager’s goals are to optimize biomass accumulation, enhance species recovery, or achieve a balance between these two goals.

1. Introduction

A substantial proportion of Earth’s forests are currently located within 100 m of forest edges, and this trend toward marginalization continues to intensify [1], with significant implications for global ecosystems [2]. In response to severe soil erosion, China implemented the Grain for Green Program (GFGP) in 1999, which has yielded significant benefits for the global climate [3,4]. However, the ongoing fragmentation of plantations and the expansion of edge habitats have diverse effects on these ecosystems [5]. The edge effect is defined as the difference in biotic and abiotic factors that exist at the border of a fragmented habitat relative to the interior environment [6]. Importantly, edge effects are often overlooked in carbon storage estimations and biodiversity assessments, resulting in significant inaccuracies [7,8]. Therefore, it is essential to assess edge effects on key ecological indicators within the Loess Plateau plantations. Such studies are vital for effective forest management and biodiversity conservation in plantations and contribute to a more comprehensive understanding of how edge habitats affect stand structure and biodiversity.
Photosynthetically Active Radiation (PAR) is higher in the vicinity of the forest edge [9]. The increase in average daily air temperature is associated with the edge effect, and this rise applies to the majority of forest fragments located within 50 m of the forest edge [10]. Due to alterations in air mixing, solar radiation, and humidity, the microclimate at the forest edge markedly differs from that of the forest interior, rendering edge environments increasingly vulnerable to the impacts of climate change [11]. These variations contribute to the emergence of edge effects that significantly influence biodiversity and stand structure [12,13,14]. However, the magnitude and spatial extent of edge effects are not uniform across different ecological indicators [15]. Generally, understory plant diversity and composition, which are sensitive to abiotic factors, exhibit more pronounced edge effects than those observed in stand structure [16]. In many cases, biodiversity loss is particularly notable at forest edges, and this effect becomes increasingly severe closer to the edge [1,17,18]. Conversely, recent reviews suggest that improved environmental conditions and increased heterogeneity near well-established edges may promote greater abundance and diversity of forest species [13,14]. Species richness responses to edge distance can vary across forest types, with studies documenting increases, decreases, or negligible variations [19,20].
Additionally, edge effects can indirectly affect forest biodiversity through alterations in stand structural dynamics [21]. For instance, variations in stand density and canopy coverage, which impact tree mortality rates, can lead to the redistribution of resources beneath the canopy. Reduced stand density often results in diminished competition for soil nutrients, thereby promoting understory development [22,23], a finding that aligns with research on plantation forests [24]. Openings in the canopy, whether caused by treefalls or planting methods, increase light availability, facilitating the establishment and proliferation of light-dependent understory species [25,26]. Moreover, edge environments often exhibit greater species composition homogeneity across the landscape [17,27], potentially due to the prevalence of disturbance-tolerant species or those adapted to marginal conditions [28,29]. However, changes in community composition near edges may exhibit significant heterogeneity, shaped by factors such as the shape of forest edges, which induce spatial variability in abiotic conditions like light, temperature, and humidity [30,31]. These observations underscore the critical need for a nuanced understanding of how edge effects shape biodiversity and species composition. When grasslands are invaded by trees or shrubs, or when such plantations are established, the deeply rooted woody vegetation transpires large amounts of water, lowering the water table and hindering the survival of native grasses and other species [32]. Previous studies have primarily focused on the relationship between native tree species and edge effects. In contrast, we have examined the response of plantation forests to edge effects. Additionally, we have innovatively considered the species diversity of understory plants. Based on these observations, we propose the following hypotheses: (1) The intensity and spatial extent of edge effects on understory species are greater than those associated with stand structure. (2) Proximity to the edge and the degree of canopy cover are positively correlated with shrub diversity, while stand density shows a negative correlation with shrub diversity. (3) Species composition at forest edges changes with the distance from the forest boundary.

2. Materials and Methods
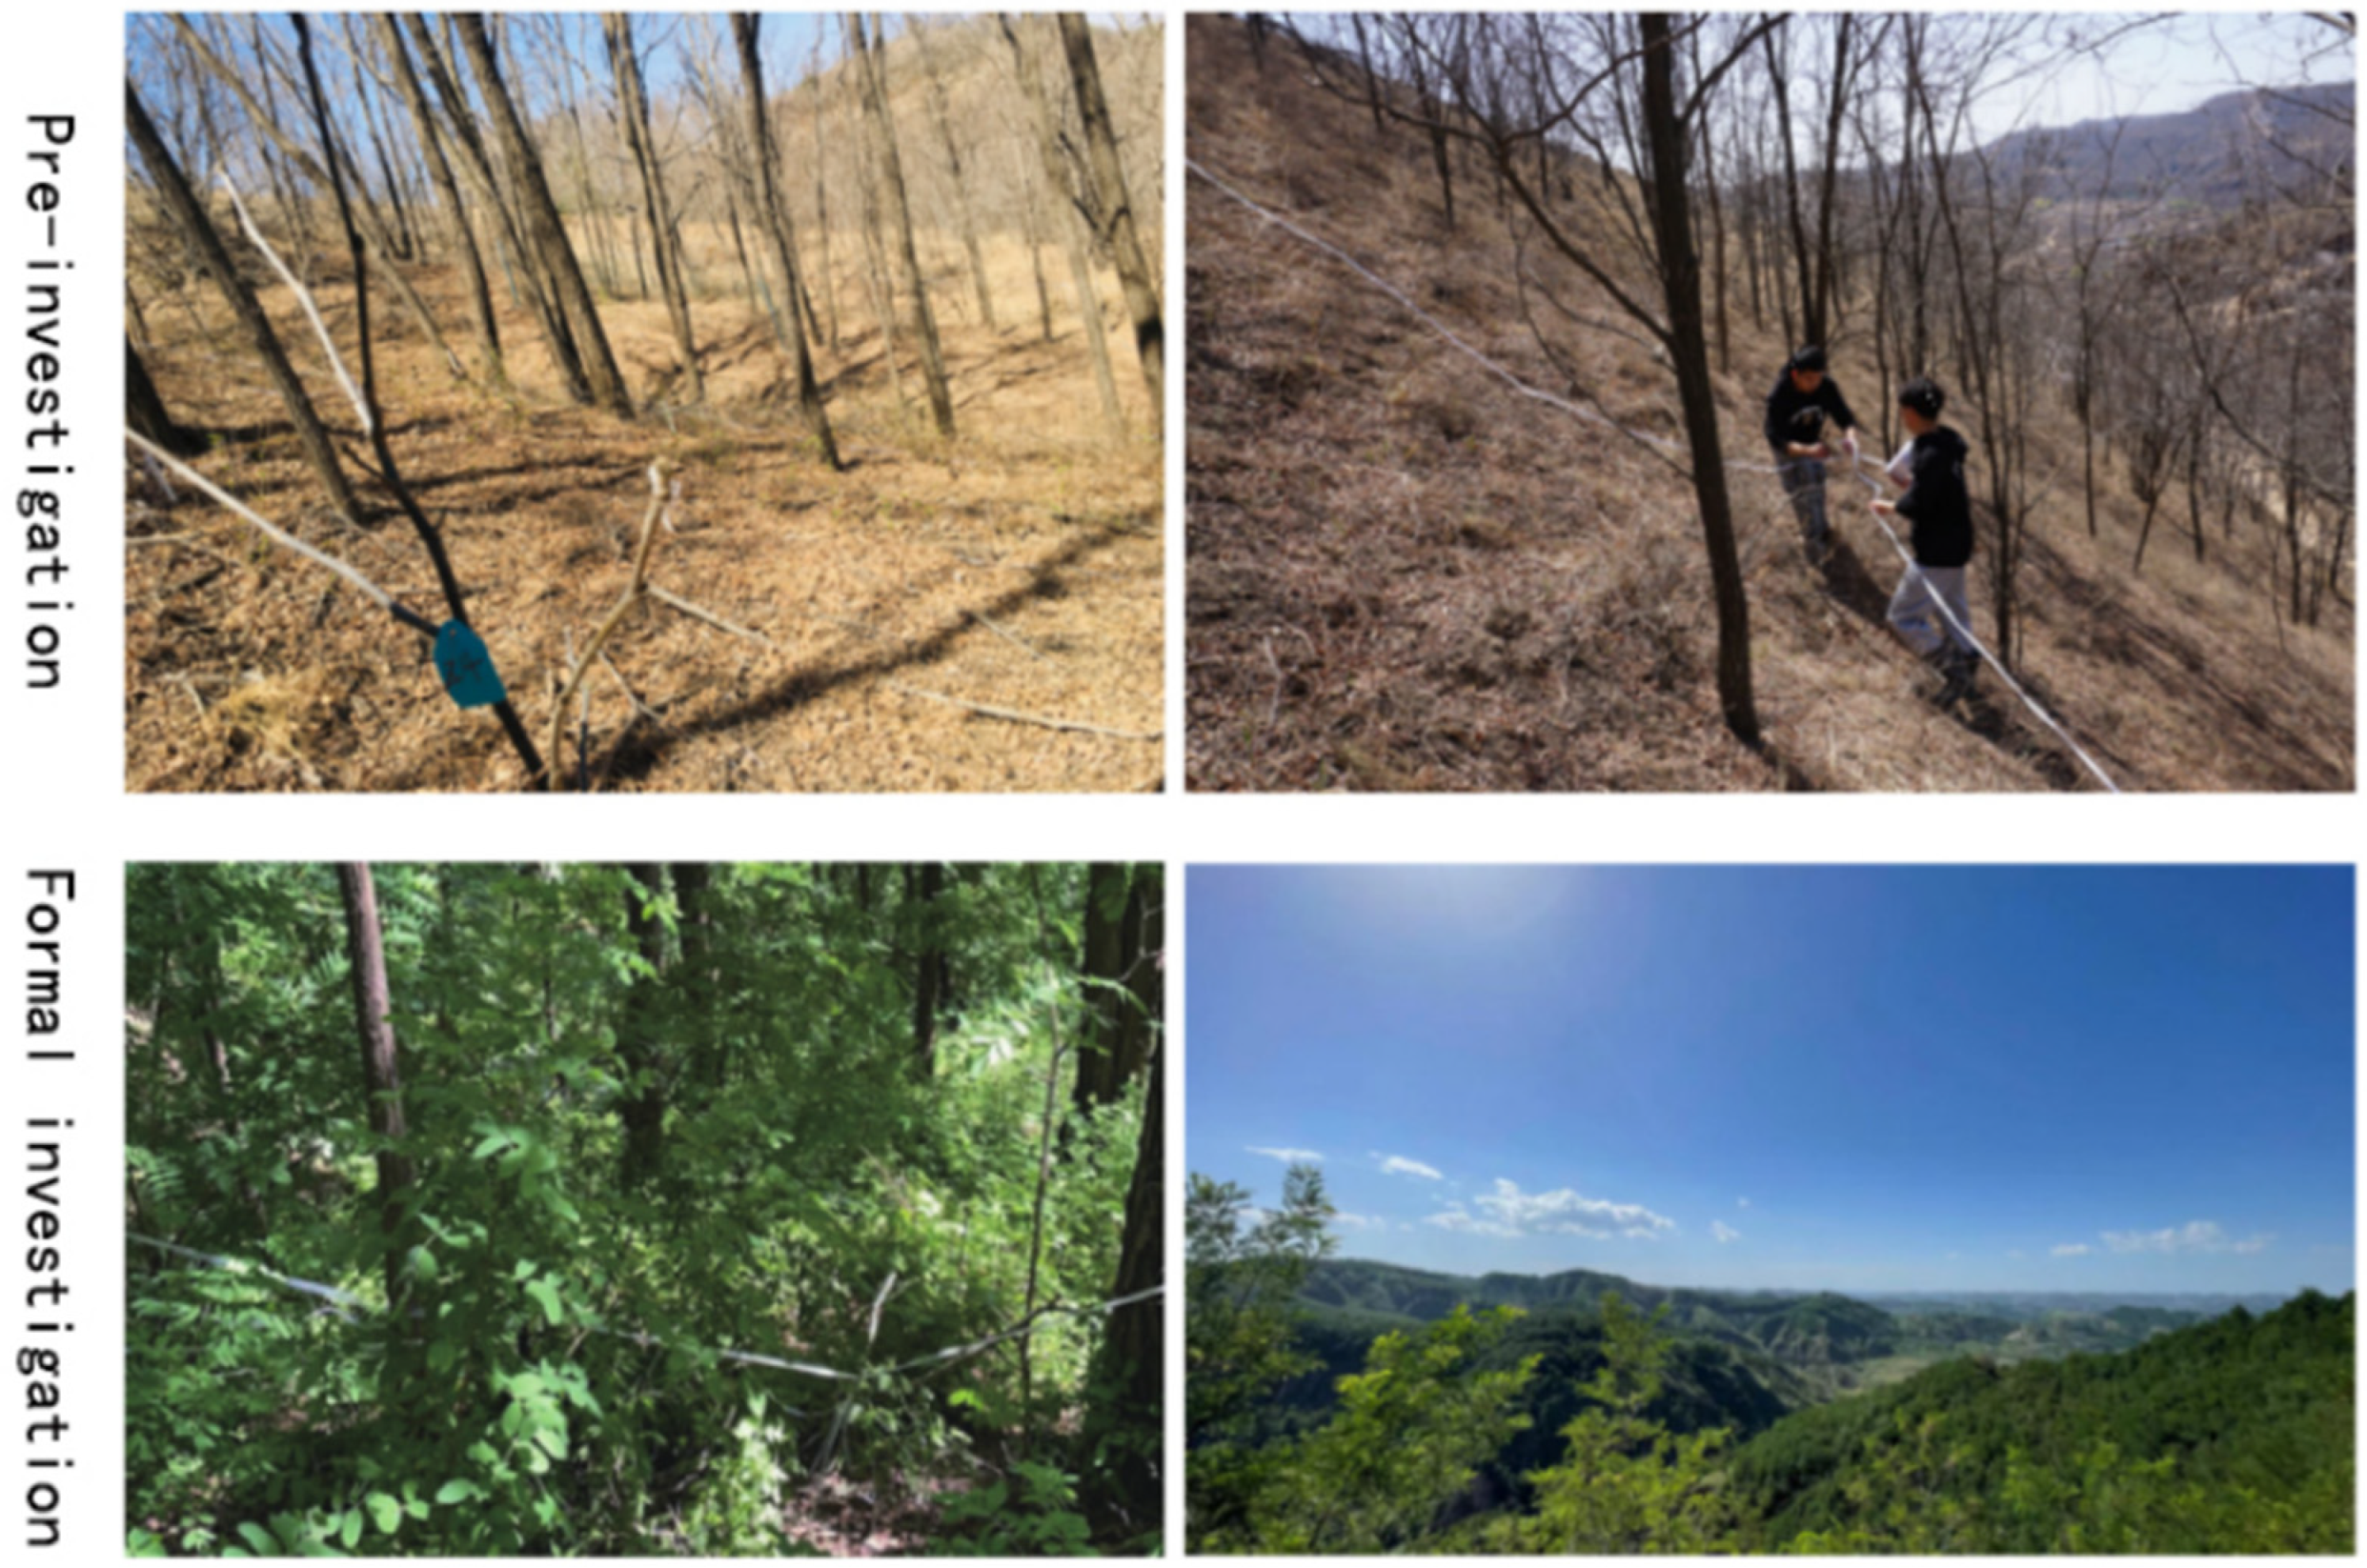
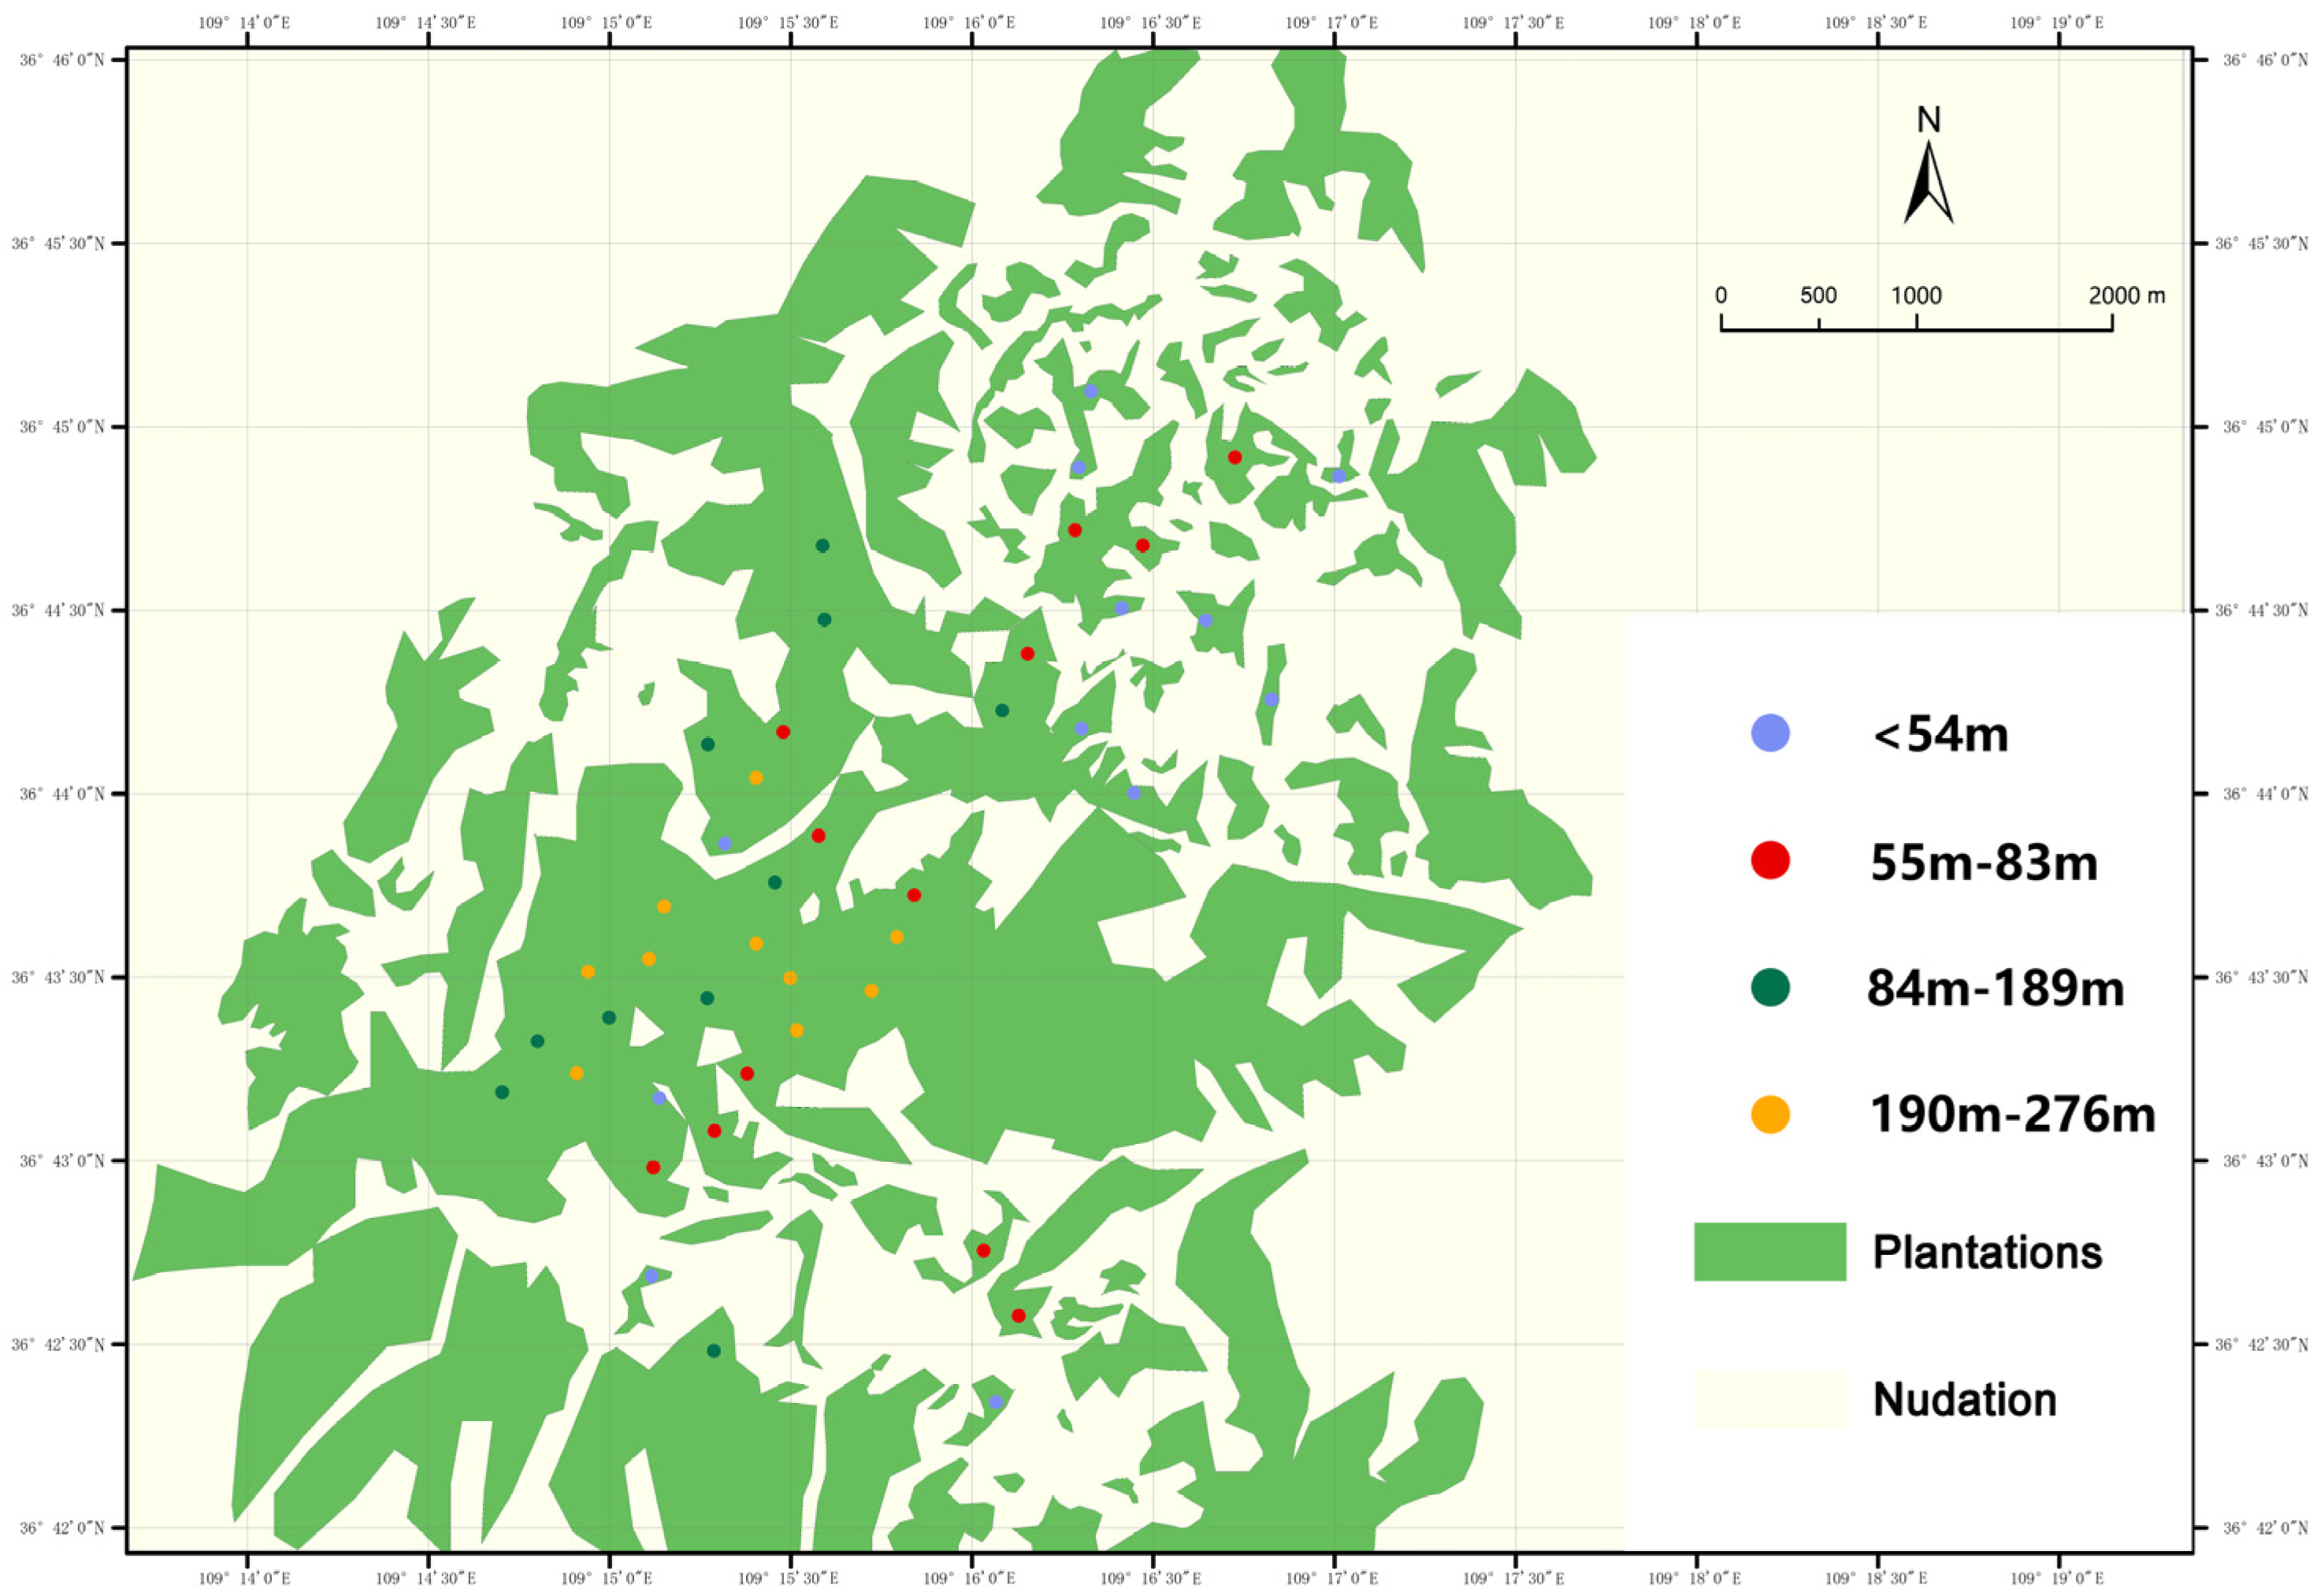
2.1. Study Site

This study was conducted in the Ansai District, Yanan City, Shaanxi Province (36°30′45″–37°19′31″ N, 108°51′44″–109°26′18″ E), on the Loess Plateau in northwest China, which belongs to Humid continental climate (climate data: https://en.climate-data.org/, accessed on 2 December 2024). The annual average precipitation is 505.3 mm (700 mm in wet year and 300 mm in dry year) (date sources: http://www.ansai.gov.cn/, accessed on 11 February 2023). Yanan has been returning farmland to forests since 1999, and Ansai District is second in the ecological benefits of plantations to forests in Yanan. Black locust (Robinia pseudoacacia L.), Pinus tabulaeformis (Pinus tabuliformis Carrière), and Platycladus orientalis (Platycladus orientalis (L.) Franco) are the main plantation species [33].
The 44 plots were randomly selected from patches dominated by black locust (Robinia pseudoacacia L.). The plots were chosen to have similar slopes and to ensure no significant differences between sunny and shaded aspects. To minimize human disturbance, all plots were placed at least 50 m from the nearest forest edge and over 200 m from any roads. Additionally, plots were located away from areas with canopy gaps or recent disturbances. A minimum distance of 300 m was maintained between each plot, and all plots were within plantation patches of similar age, free from recent human activities such as harvesting, grazing, or invasive species, to reduce the influence of spatial autocorrelation.

2.2. Experimental Design

This study utilized 44 sample plots measuring 10 × 10 m, selected from our previous research in the Ansai acacia forest (Figure 1). Stand structure data, including carbon stock, diameter at breast height (DBH), tree height, and tree density, were collected for analysis. The proximity of each sample point to the forest edge was determined using ArcGIS 10.8 software. The K-means clustering algorithm starts by randomly selecting K initial centroids. Each object is then assigned to the nearest centroid based on distance, forming clusters. Once all objects are assigned, the centroids are recalculated as the mean of the objects in each cluster. This process is repeated iteratively until the termination criteria are met. The 44 sample points were classified into four groups based on their distance from the edge using K-means classification: <54 m, 55–83 m, 84–189 m, and 190–276 m (Figure 2). A 1 × 1 m sample was collected at the center of each large sample plot, as well as at five points in the four corners, to represent the understory species. A data log sheet was employed to record species and abundance data from these smaller samples, which were then aggregated to obtain overall understory species data for each large sample plot. The presence or absence of canopy cover was recorded every meter along two adjacent sides of each 10 × 10 m sample plot, with presence recorded as 1 and absence recorded as 0. The percentage of presence was taken as the canopy cover.
Species counting represented species richness, while the Shannon index reflected species richness from multiple perspectives. The calculation formula for the Shannon index is as follows:
H = i = 1 s p i ln ( p i )
H represents the Shannon–Wiener diversity index. S is the total number of species in the sample. p i is the proportion of individuals that belong to the i -th species.

2.3. Data Processing and Analysis

The data were assessed for residual normality using a chi-square test [34], while the independence of residuals was evaluated using the Durbin–Watson test [35]. To compare the variability in each distance gradient data indicator, a one-way ANOVA was conducted for multiple comparisons. The range of the edge effect was determined as the maximum distance exhibiting significant variability. Given that all indicators showed changes in a single direction with increasing distance from the edge, a standardized t-test was performed to compare each indicator between the group closest to the edge (<54 m) and the group nearest to the interior of the forest (190–276 m). Volcano plots were generated to illustrate the maximum magnitude of the effect. Canonical correlation analysis (CCA) was used to compare the understory species composition of the four groups, ranking species similarity in a two-dimensional space, where closer proximity between sample points indicates more similar species composition. A multiple linear regression was conducted to examine the impact of edge effects, using canopy cover, tree density, and distance to the edge as independent variables, with the Shannon index serving as the dependent variable in the analysis.

3. Results

3.1. Edge Effect Intensity and Depth

All indicators exhibited consistent changes in a single direction as the distance from the edge increased. The volcano plot (Figure 2), which compares the standardized data for the distances <54 m and 190–276 m, revealed that, with the exception of H, there were no significant differences. However, all other indicators showed significant differences, with canopy cover displaying the most pronounced distinction. The edge effect positively influenced diameter at breast height (DBH) and carbon storage, with the greatest impact observed on DBH and canopy cover, followed by stand density. Additionally, the edge effect had a stronger influence on the Shannon index compared to species richness.
Our research findings indicate that topographic factors have no significant impact on carbon storage and stand structure. This is likely due to the sparse rainfall in the Ansai region, which limits the amount of water that can be stored in the terrain, resulting in little distinction between lowland and upland areas. As a result, the influence of topographic moisture factors is not pronounced [36].
Carbon storage, species diversity, and the Shannon index were assessed at distances of <54 m from the edge. In contrast, diameter at breast height (DBH), tree density, and canopy cover were evaluated at distances ranging from 0 to 83 m from the edge (Figure 3 and Figure 4).

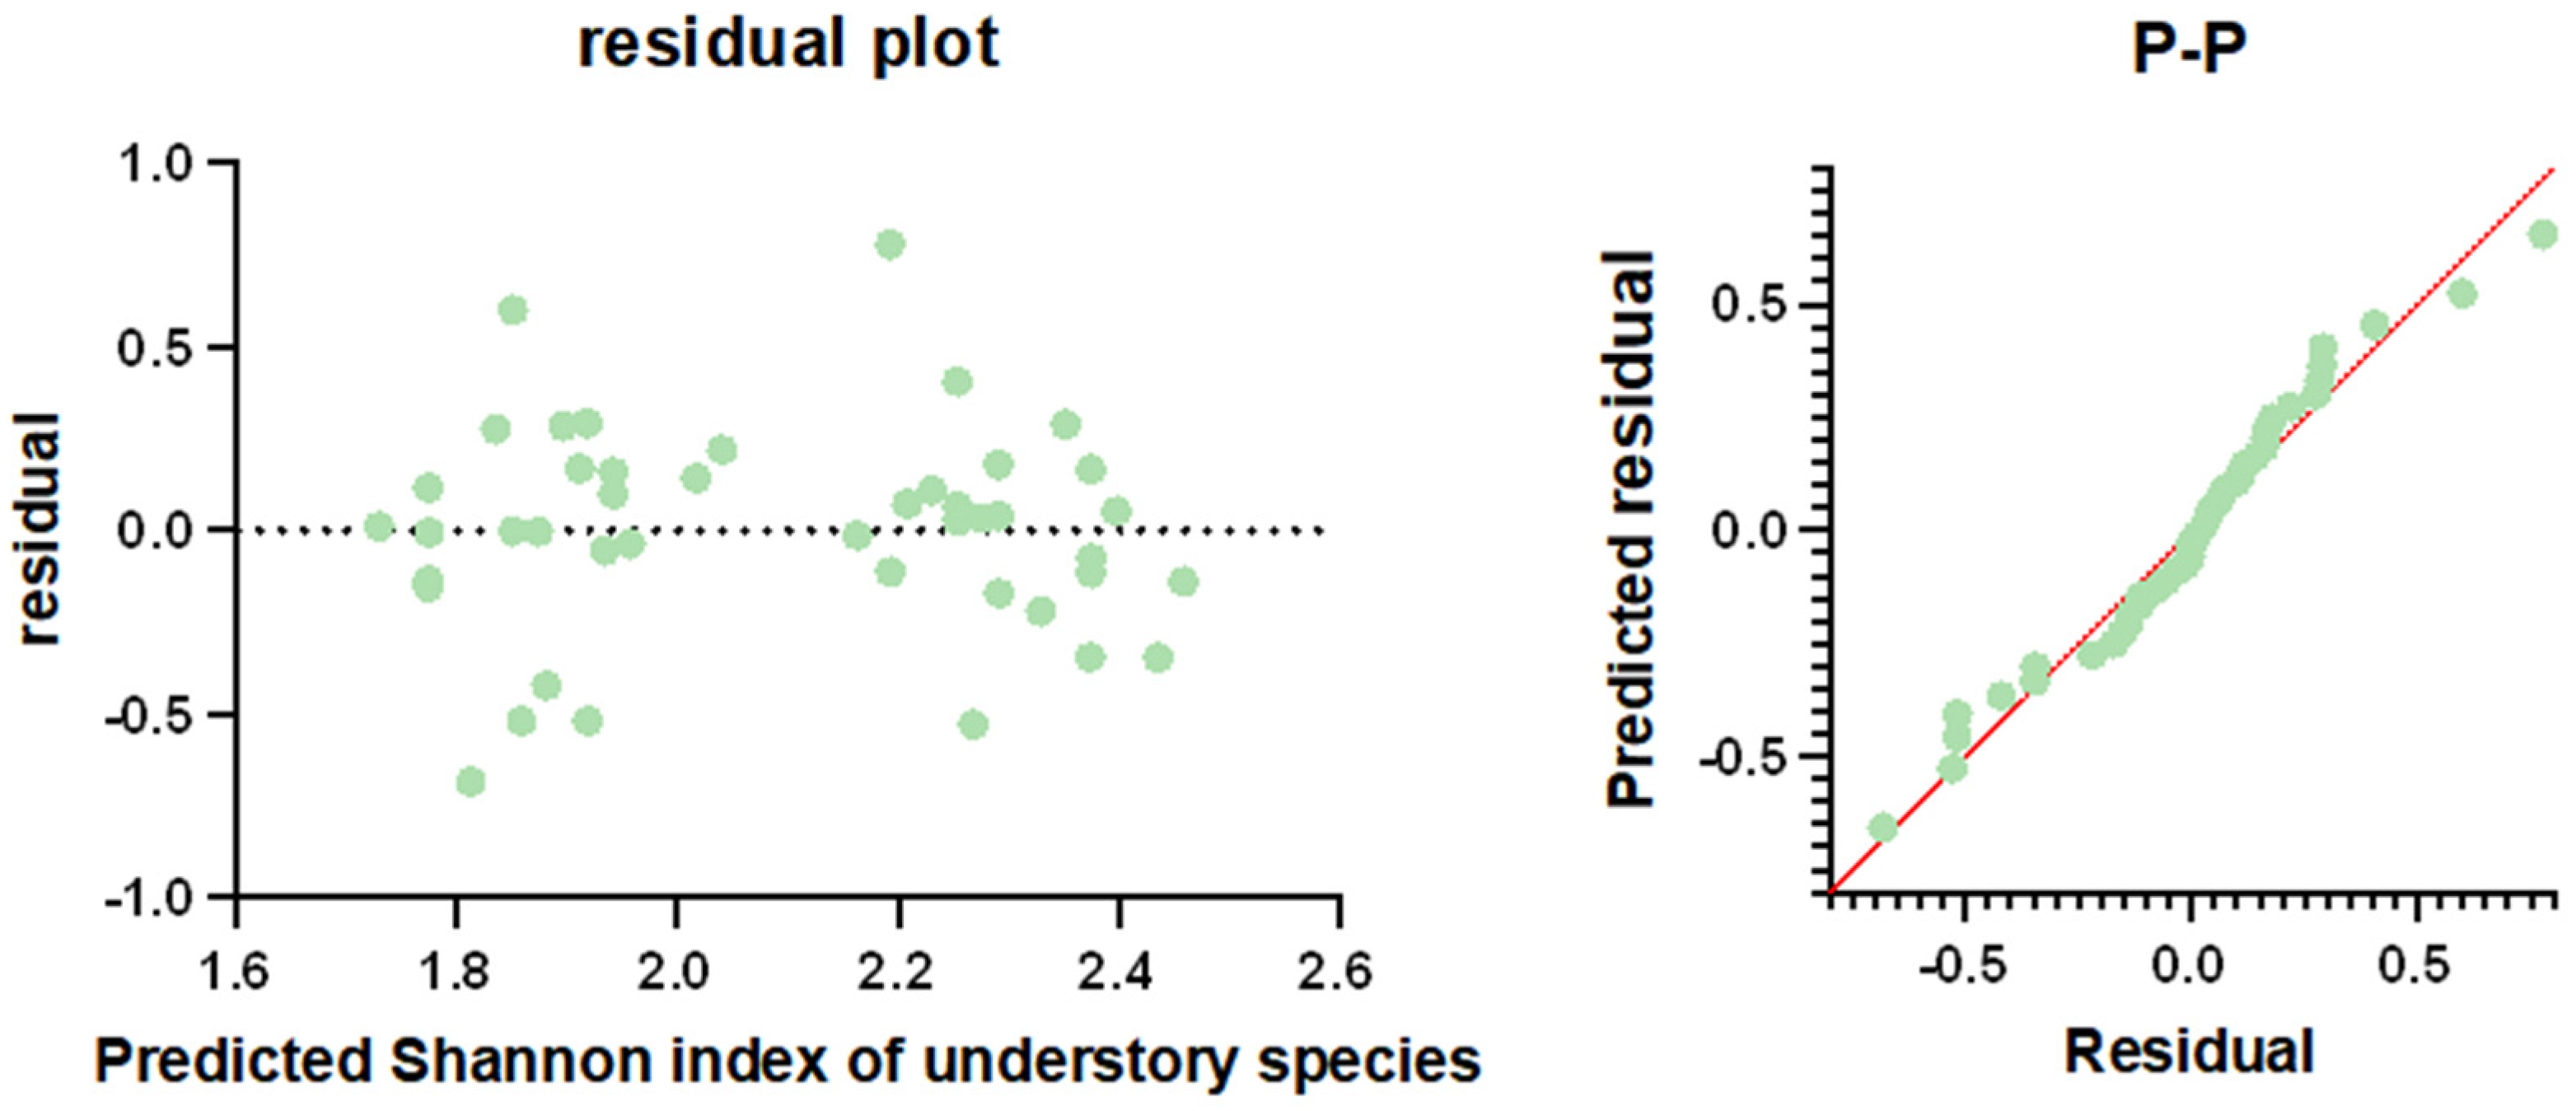
3.2. Effect of Edge Distance, Canopy Cover, and Stand Density on Biodiversity

The multiple linear regression analysis revealed that the distance from the edge and canopy cover did not exhibit a significant correlation with the understory Shannon index. However, stand density showed a significant positive effect on the understory Shannon index (Table 1, R2 = 0.34, p = 0.03) (Figure 5).

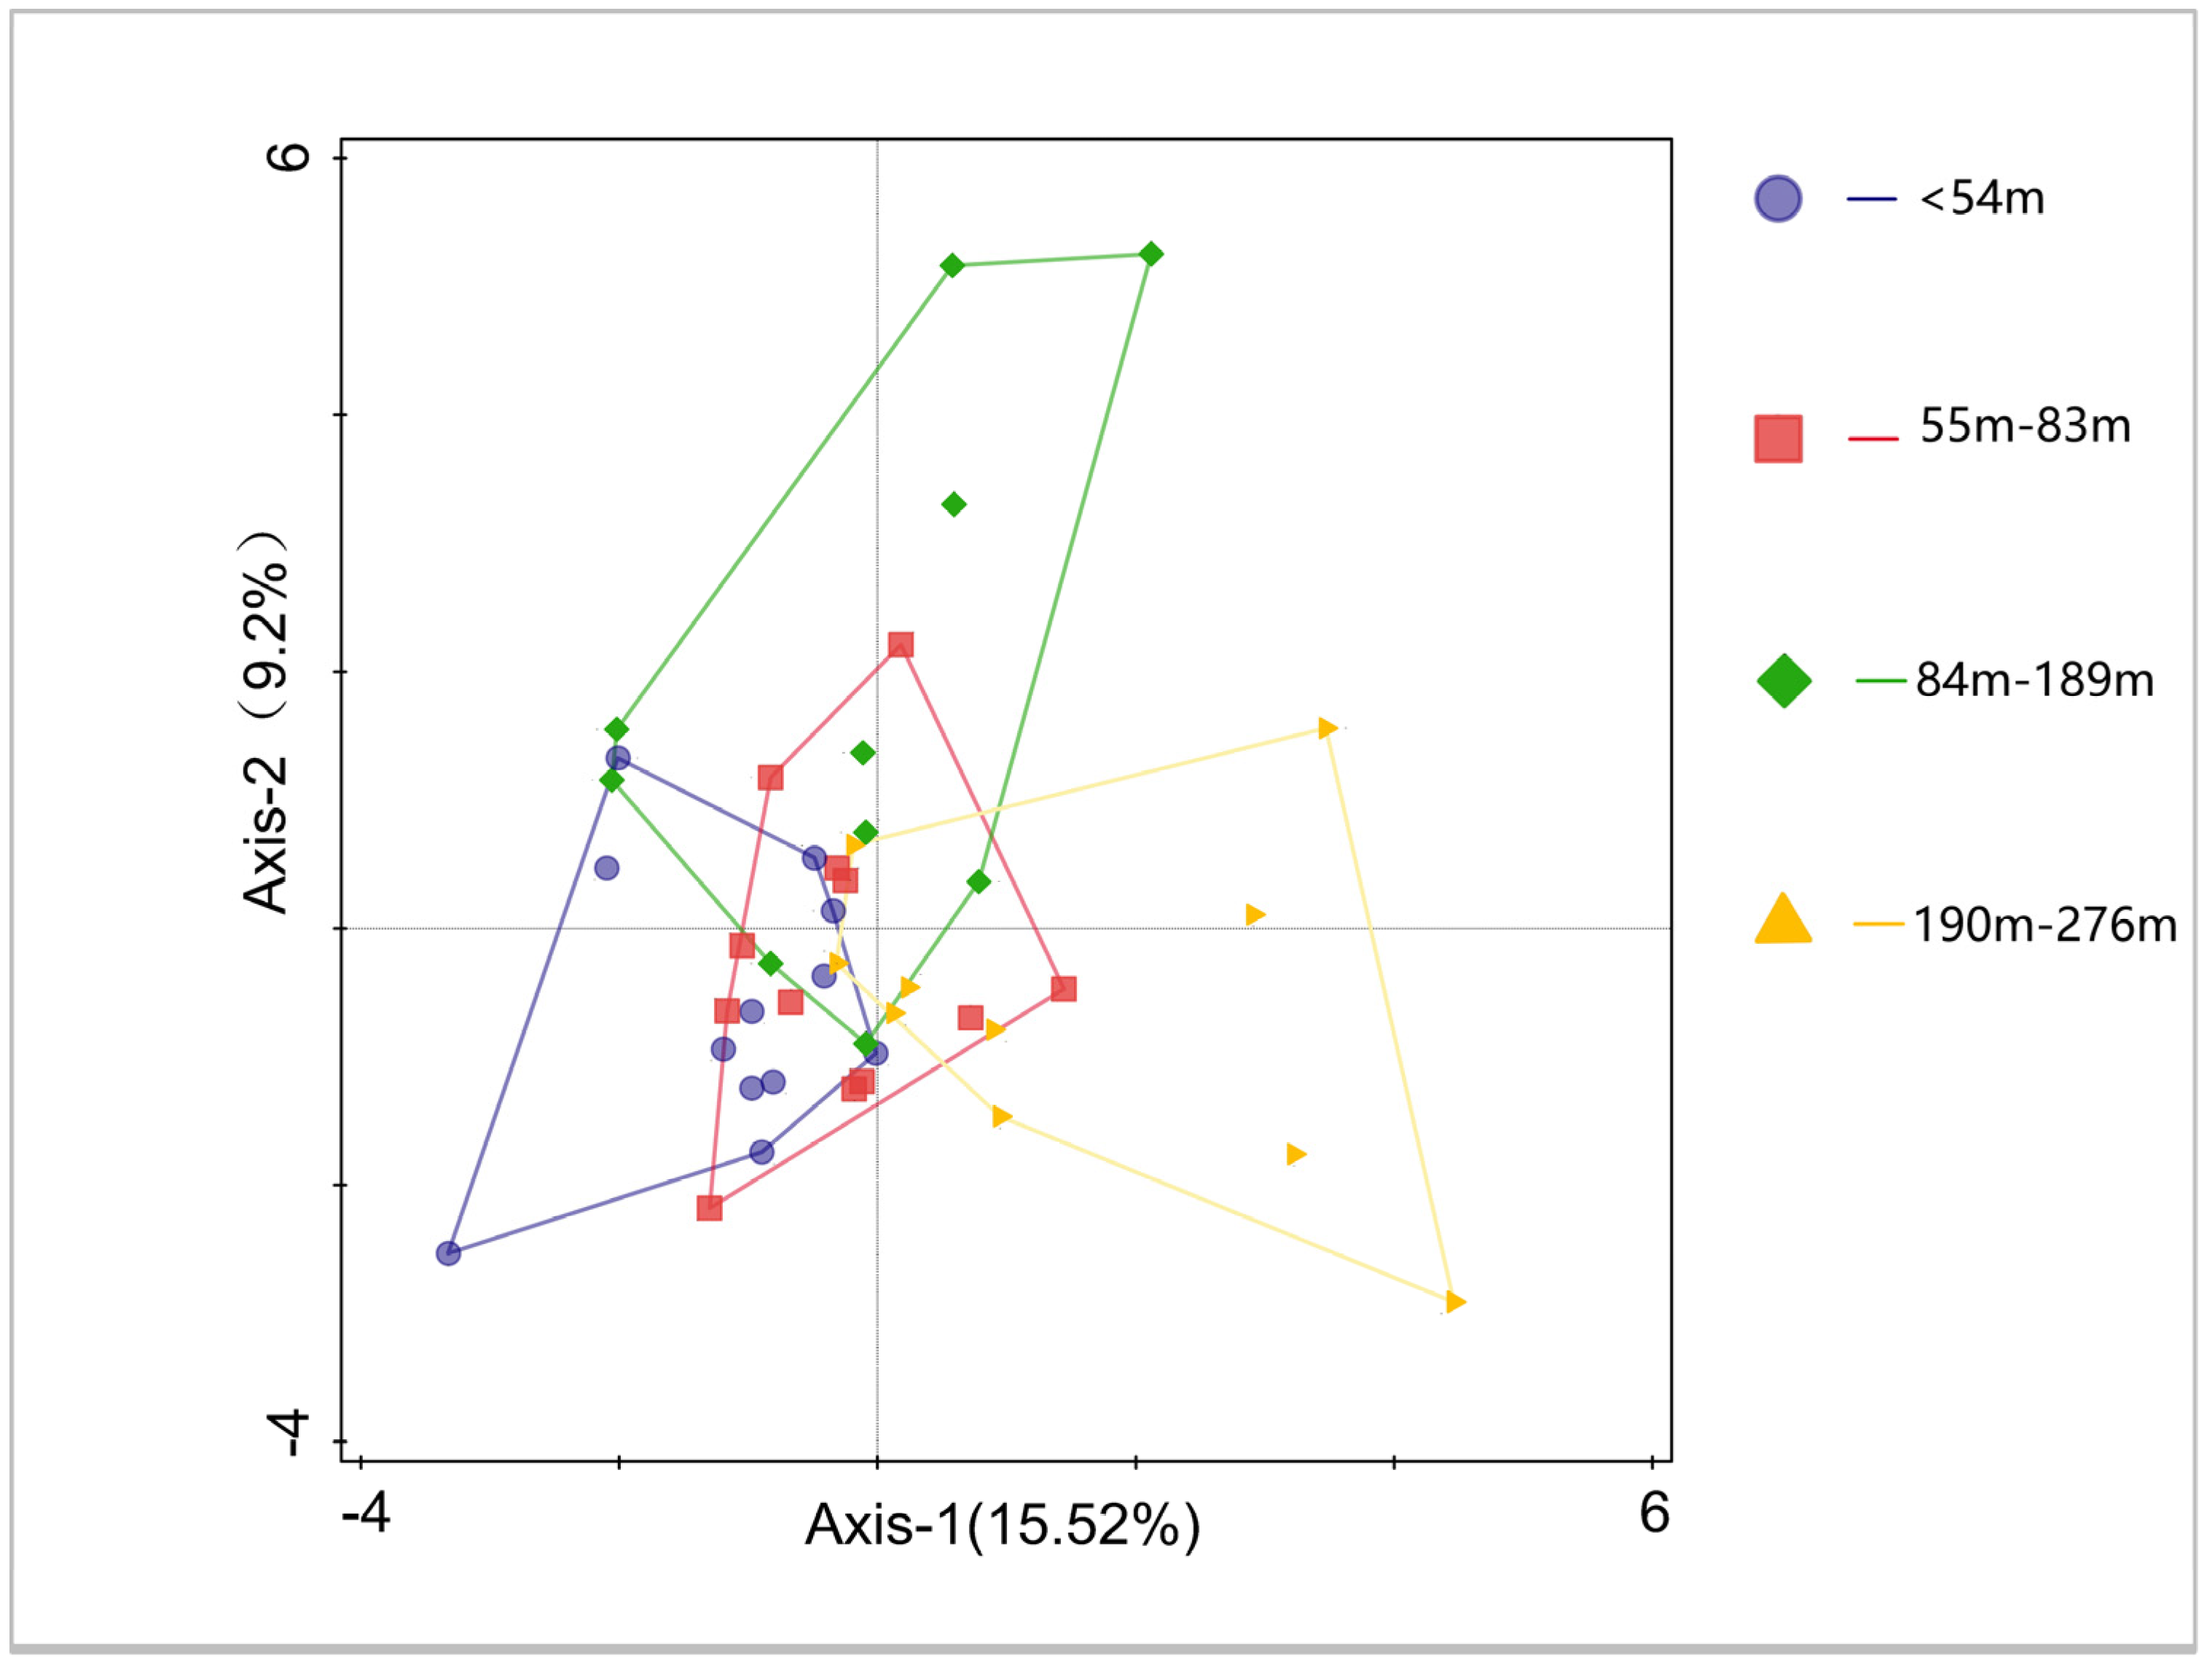
3.3. Species Composition

Areas < 54 m from the edge differed significantly in species composition from those located between 190 and 276 m, while those located between 55 and 83 m (only three sample sites were far from the three clusters) and 84–189 m ranged between the innermost (190–276 m) and outermost (<54 m) parts of the forest (Figure 6).

4. Discussion

4.1. The Strength and Distance of Edge Effects on Each Indicator

The results reveal that edge effects had a stronger and more pronounced impact on stand structure compared to understory plant diversity. This finding suggests that stand structure is more vulnerable to edge effects, which contradicts our initial predictions. This discrepancy may be attributed to edge effects promoting turnover among understory species, favoring the establishment of species that are better adapted to edge habitats. The Canonical Correspondence Analysis (CCA) ordination results reveal distinct variations in species composition between areas located < 54 m from the edge and those located 190–276 m from the edge. Fragmentation has been identified as a contributing factor to the increased heterogeneity of sites near forest edges relative to interior sites, which is influenced by both abiotic and biotic factors. The combination of elevated ambient temperatures, increased aridity, and enhanced light availability at forest edges creates conditions that favor heliophilous plants [21], resulting in the selective filtration of plant species driven by these abiotic factors. Furthermore, reduced biotic interactions near edges may contribute to the dominance of certain species [37]. Together, these factors lead to changes in understory plant composition and increased turnover rates at forest edges [19,38].
However, the decline in the Shannon index exhibited greater intensity compared to species diversity, indicating that both species diversity and evenness were higher in the forest interior than at the edges, underscoring the influence of edge effects. This pattern may be attributed to the prevailing dry and hot winds characteristic of the Loess Plateau region’s dry climate (Data Sources: http://www.weather.com.cn/, accessed in 15 September 2024). Plants situated at the forest edge are more vulnerable to climatic influences, while the forest interior offers greater availability of microclimatic resources, including water, temperature regulation, and humidity [39]. These conditions support a larger number and abundance of species compared to the forest edges. Moreover, the challenging climatic conditions at the forest edges have led to reduced survival of acacia stands, resulting in lower stand density and canopy cover compared to the forest interior [38]. Interestingly, acacia trees located at the edges exhibited higher diameter at breast height (DBH) and carbon storage than those in the forest interior. This phenomenon may be attributed to the high similarity in species composition and the dense tree population of the planted forests, which leads to intense competition for specific soil nutrients [40,41]. Consequently, the scarcity of certain soil nutrients may constrain tree growth within the forest [42].
Generally, the edge effect on acacia forests in the Loess Plateau extends up to 100 m; however, regional variations in the magnitude of the edge effect have been observed. For instance, in tropical forests, edge effects can extend up to 1.5 km from the edge [19,43], while in dry broad-leaved forests, they can reach up to 0.8 km within the forest [7]. In temperate zones, the range of the forest edge effect typically extends up to 100 m. This may be attributed to the broader ecological tolerance of temperate plants, resulting in a lesser extent of edge penetration compared to tropical forests [15,16].

4.2. Effect of Edge Distance, Canopy Cover, and Stand Density on Shannon Index

The multiple linear regression model indicated that distance from the edge and canopy cover did not have a significant effect on the understory Shannon index. This lack of significance may be attributed to the adaptive responses of natural species selection to the edge environment and canopy cover. Through natural selection, species may have developed specialized survival strategies to adapt to the challenges posed by edge effects and canopy cover, thereby maintaining a relatively stable level of biodiversity in the understory. Surprisingly, stand density exhibited a significant positive correlation, contradicting our initial expectations. This phenomenon can be linked to the influential role of harsh climatic conditions at the edge of the Loess Plateau on understory plants. Typically, high-density forests result in reduced light availability, lower soil nutrient levels, and limited space for growth [44,45], which consequently leads to decreased understory diversity and species abundance [22]. However, this pattern is contingent upon maintaining a specific stand density threshold [46], as higher tree density can positively influence the stability of local microclimates and enhance resilience to understory stressors [47]. Lower stand density increases sunlight penetration to the understory, which may reduce the abundance of shade-tolerant species, replacing them with light-preferring species. This process of species replacement leads to a decrease in understory biodiversity. Increased stand densities can mitigate extreme temperature rises and significant humidity decreases during summer, as well as alleviate stressor impacts during autumn and winter nights [48,49]. Therefore, if stand densities fall below the critical threshold necessary to sustain the stability of the surrounding microclimate and withstand harsh climatic conditions, this may result in reduced understory biodiversity and abundance [50].

4.3. For the Follow-Up Management Measures Recommended

Afforestation does not necessarily promote biodiversity if monocultures are established [51]. While edges exhibit higher carbon stocks, they also demonstrate lower levels of biodiversity and species evenness. Appropriate management measures should be tailored to the objectives of the plantation and the trade-off decisions made by managers. Tall plants, positioned in the upper layers, have greater access to light, potentially reducing the growth space available for understory plants. In contrast, understory plants may experience slow growth or even mortality due to insufficient light. This asymmetric competition can lead to an imbalance in plant community structure, affecting ecosystem stability [52]. To promote higher biomass accumulation in plantation forests, it is advisable to judiciously reduce stand density, thereby facilitating faster growth. Conversely, if the goal is to enhance biodiversity, increasing stand density is recommended, which can be achieved by replanting along the edges of the plantation or conducting tree planting activities to restore fragmented patches and reduce the quantity of edge habitats. Further research in the Loess Plateau is essential to explore strategies for achieving a balance between various stand densities or to identify more straightforward and effective approaches for attaining optimal ecological benefits.

5. Conclusions

The edge effects of plantation forests on the Loess Plateau exert varying degrees of influence on different indicators, with their extent of penetration within 100 m being consistent with findings from most studies conducted in temperate zones. Due to the dominant influence of climatic conditions in this region, understory plants are significantly affected by the filtering effect of the edge environment, leading to alterations in species composition and abundance. Furthermore, high stand density serves as a regulating and stabilizing factor for the local microclimate, resulting in an increase in the understory Shannon index while simultaneously decreasing carbon storage. The choice of management measures should align with the manager’s silvicultural goals, whether they prioritize biomass accumulation, species recovery, or aim to strike a balance between the two.

Author Contributions

All authors contributed to the study conception and design. Material preparation, data collection and analysis were performed by S.D., H.L., H.G. and B.Z. The first draft of the manuscript was written by H.L., S.D. and B.Z. The valuable suggestions for revising this article are put forward by X.L. and all authors commented on previous versions of the manuscript. All authors have read and agreed to the published version of the manuscript.

Funding

This research was funded by the National Natural Science Foundation of China Ministry (no. 32201429).

Data Availability Statement

The datasets generated during and/or analyzed during the current study are available from the corresponding author on reasonable request.

Acknowledgments

This work thanks to College of Landscape Architecture and Art, Northwest A&F University for the equipment.

Conflicts of Interest

The authors have no relevant financial or non-financial interests to disclose.

References

  1. Haddad, N.M.; Brudvig, L.A.; Clobert, J.; Davies, K.F.; Gonzalez, A.; Holt, R.D.; Lovejoy, T.E.; Sexton, J.O.; Austin, M.P.; Collins, C.D.; et al. Habitat fragmentation and its lasting impact on Earth’s ecosystems. Sci. Adv. 2015, 1, e1500052. [Google Scholar] [CrossRef] [PubMed]
  2. Laurance, W.F.; Lovejoy, T.E.; Vasconcelos, H.L.; Bruna, E.M.; Didham, R.K.; Stouffer, P.C.; Gascon, C.; Bierregaard, R.O.; Laurance, S.G.; Sampaio, E. Ecosystem Decay of Amazonian Forest Fragments: A 22-Year Investigation. Conserv. Biol. 2002, 16, 605–618. [Google Scholar] [CrossRef]
  3. Liu, J.G.; Li, S.X.; Ouyang, Z.Y.; Christine, T.; Chen, X.D. Ecological and socioeconomic effects of China’s policies for ecosystem services. Proc. Natl. Acad. Sci. USA 2008, 105, 9477–9482. [Google Scholar] [CrossRef]
  4. Lü, Y.; Fu, B.; Feng, X.; Zeng, Y.; Liu, Y.; Chang, R.; Sun, G.; Wu, B. A policy-driven large scale ecological restoration: Quantifying ecosystem services changes in the Loess Plateau of China. PLoS ONE 2017, 7, e31782. [Google Scholar] [CrossRef] [PubMed]
  5. Liu, J.; Coomes, D.A.; Gibson, L.; Hu, G.; Liu, J.; Luo, Y.; Wu, C.; Yu, M. Forest fragmentation in China and its effect on biodiversity. Biol. Rev. 2019, 94, 1636–1657. [Google Scholar] [CrossRef]
  6. Carolina, M. Edge effects in fragmented forests: Implications for conservation. Trends Ecol. Evol. 1995, 10, 58–62. [Google Scholar]
  7. Chaplin-Kramer, R.; Ramler, I.; Sharp, R.; Haddad, N.M.; Gerber, J.S.; West, P.C.; Mandle, L.; Engstrom, P.; Baccini, A.; Sim, S.; et al. Degradation in carbon stocks near tropical forest edges. Nat. Commun. 2015, 6, 10158. [Google Scholar] [CrossRef]
  8. Smith, I.A.; Hutyra, L.R.; Reinmann, A.B.; Marrs, J.K.; Thompson, J.R. Piecing together the fragments: Elucidating edge effects on forest carbon dynamics. Front. Ecol. Environ. 2018, 16, 213–221. [Google Scholar] [CrossRef]
  9. Catherine, L.P.; Stephen, M.T.; Miriam, G. Edge Effects of Linear Canopy Openings on Tropical Rain Forest Understory Microclimate. Biotropica 2007, 39, 62–71. [Google Scholar]
  10. Hofmeister, J.; Hošek, J.; Brabec, M.; Střalková, R.; Mýlová, P.; Bouda, M.; Pettit, J.L.; Rydval, M.; Svoboda, M. Microclimate edge effect in small fragments of temperate forests in the context of climate change. For. Ecol. Manag. 2019, 48, 48–56. [Google Scholar] [CrossRef]
  11. Schmidt, M.; Jochheim, H.; Kersebaum, K.C.; Lischeid, G.; Nendel, C. Gradients of microclimate, carbon and nitrogen in transition zones of fragmented landscapes—A review. Agric. For. Meteorol. 2017, 232, 659–671. [Google Scholar] [CrossRef]
  12. Briant, G.; Gond, V.; Laurance, S.G.W. Habitat fragmentation and the desiccation of forest canopies: A case study from eastern Amazonia. Biol. Conserv. 2010, 143, 2763–2769. [Google Scholar] [CrossRef]
  13. Laurance, W.F.; Nascimento, H.E.M.; Laurance, S.G.; Andrade, A.; Ewers, R.M.; Harms, K.E.; Luizão, R.C.C.; Ribeiro, J.E. Habitat fragmentation, variable edge effects, and the landscape-divergence hypothesis. PLoS ONE 2007, 2, e1017. [Google Scholar] [CrossRef] [PubMed]
  14. Mehmood, S.; Zhang, D. Forest parcelization in the United States—A study of contributingfactors. J. For. 2001, 99, 30–34. [Google Scholar]
  15. Willmer, J.N.G.; Püttker, T.; Prevedello, J.A. Global impacts of edge effects on species richness. Biol. Conserv. 2022, 272, 109654. [Google Scholar] [CrossRef]
  16. Franklin, C.M.A.; Harper, K.A.; Clarke, M.J. Trends in studies of edge influence on vegetation at human-created and natural forest edges across time and space. Can. J. For. Res. 2021, 51, 274–282. [Google Scholar] [CrossRef]
  17. Solar, R.R.d.C.; Barlow, J.; Ferreira, J.; Berenguer, E.; Lees, A.C.; Thomson, J.R.; Louzada, J.; Maués, M.; Moura, N.G.; Oliveira, V.H.F.; et al. How pervasive is biotic homogenization in human-modified tropical forest landscapes? Ecol. Lett. 2015, 18, 1108–1118. [Google Scholar] [CrossRef] [PubMed]
  18. Pfeifer, M.; Lefebvre, V.; Peres, C.A.; Banks, L.C.; Wearn, O.R.; Marsh, C.J.; Butchart, S.H.M.; Arroyo-Rodríguez, V.; Barlow, J.; Cerezo, A.; et al. Creation of forest edges has a global impact on forest vertebrates. Nature 2017, 551, 187. [Google Scholar] [CrossRef] [PubMed]
  19. Sfair, J.C.; Arroyo-Rodríguez, V.; Santos, B.A.; Tabarelli, M. Taxonomic and functional divergence of tree assemblages in a fragmented tropical forest. Ecol. Appl. 2016, 26, 1816–1826. [Google Scholar] [CrossRef]
  20. Collins, C.D.; Banks-Leite, C.; Brudvig, L.A.; Foster, B.L.; Cook, W.M.; Damschen, E.I.; Andrade, A.; Austin, M.; Camargo, J.L.; Driscoll, D.A.; et al. Fragmentation affects plant community composition over time. Ecography 2017, 40, 119–130. [Google Scholar] [CrossRef]
  21. Harper, K.A.; Macdonald, S.E.; Burton, P.J.; Chen, J.; Brosofske, K.D.; Saunders, S.C.; Euskirchen, E.S.; Roberts, D.; Jaiteh, M.S.; Esseen, P.-A. Edge Influence on Forest Structure and Composition in Fragmented Landscapes. Conserv. Biol. 2005, 19, 768–782. [Google Scholar] [CrossRef]
  22. Paulson, A.K.; Peña, H.; Alexander, H.D.; Davydov, S.P.; Loranty, M.M.; Mack, M.C.; Natali, S.M. Understory plant diversity and composition across a postfire tree density gradient in a Siberian Arctic boreal forest. Can. J. For. Res. 2021, 51, 720–731. [Google Scholar] [CrossRef]
  23. Zhang, Y.; Liu, T.; Guo, J.; Tan, Z.; Dong, W.; Wang, H. Changes in the understory diversity of secondary Pinus tabulaeformis forests are the result of stand density and soil properties. Glob. Ecol. Conserv. 2021, 28, e01628. [Google Scholar] [CrossRef]
  24. Hedwall, P.O.; Holmström, E.; Lindbladh, M.; Felton, A. Concealed by darkness: How stand density can override the biodiversity benefits of mixed forests. Ecosphere 2019, 10, e02835. [Google Scholar] [CrossRef]
  25. Mestre, L.; Toro-Manríquez, M.; Soler, R.; Huertas-Herrera, A.; Martínez-Pastur, G.; Lencinas, M.V. The influence of canopy-layer composition on understory plant diversity in southern temperate forests. For. Ecosyst. 2017, 4, 6. [Google Scholar] [CrossRef]
  26. Jagodzinski, A.M.; Oleksyn, J. Ecological consequences of silviculture at variable stand densities. III. Stand stability, phytoclimate and biodiversity. SYLWAN 2009, 153, 219–230. [Google Scholar]
  27. Benchimol, M.; Peres, C.A.; Bellingham, P. Edge-mediated compositional and functional decay of tree assemblages in Amazonian forest islands after 26 years of isolation. J. Ecol. 2015, 103, 408–420. [Google Scholar] [CrossRef]
  28. Ries, L.; Fletcher, R.J.; Battin, J.; Sisk, T.D. Ecological Responses to Habitat Edges: Mechanisms, Models, and Variability Explained. Annu. Rev. Ecol. Evol. Syst. 2004, 35, 491–522. [Google Scholar] [CrossRef]
  29. Tabarelli, M.; Peres, C.A.; Melo, F.P.L. The ‘few winners and many losers’ paradigm revisited: Emerging prospects for tropical forest biodiversity. Biol. Conserv. 2012, 155, 136–140. [Google Scholar] [CrossRef]
  30. Laurance, W.F.; Nascimento, H.E.M.; Laurance, S.G.; Fearnside, A.C.; Fearnside, P.M.; Fearnside, P.M.; Ribeiro, J.E.L.; Capretz, R.L. Rain forest fragmentation and the proliferation of successional trees. Ecology 2006, 87, 469–482. [Google Scholar] [CrossRef] [PubMed]
  31. Víctor, A.R.; Melo, F.P.L.; Miguel, M.R.; Bongers, F.; Chazdon, R.L.; Meave, J.A.; Norden, N.; Santos, B.A.; Leal, I.R.; Tabarelli, M. Multiple successional pathways in human-modified tropical landscapes: New insights from forest succession, forest fragmentation and landscape ecology research. Biol. Rev. Camb. Philos. Soc. 2017, 92, 326–340. [Google Scholar]
  32. Normile, D. Getting at the Roots of Killer Dust Storms. Science 2007, 317, 314–316. [Google Scholar] [CrossRef]
  33. Yang, Z.Y.; Liu, Q.J.; Qin, L.H.; Liu, F.Z.; Siqing, B.L. Ecological Beneft Assessment of the Grain for Green Project in Yan an. J. Northwest For. Univ. 2022, 37, 259–266. [Google Scholar]
  34. Zhang, C.X.; Lu, X.; Gao, S. Residual Chi-square Test and DAVAR Based on Fault Diagnosis and Positioning. Navig. Control. 2018, 17, 25–31. [Google Scholar]
  35. Liu, M.; Wang, Y.Y. Exploring in Durbin-Watson Autocorrelation Test. J. Quant. Tech. Econ. 2014, 31, 153–160. [Google Scholar]
  36. Li, H.; Li, C.; Zha, T.; Liu, J.; Jia, X.; Wang, X.; Chen, W.; He, G. Patterns of biomass allocation in an age-sequence of secondary Pinus bungeana forests in China. For. Chron. 2014, 90, 169–176. [Google Scholar] [CrossRef]
  37. Krishnadas, M.; Bagchi, R.; Sridhara, S.; Comita, L.S. Weaker plant-enemy interactions decrease tree seedling diversity with edge-effects in a fragmented tropical forest. Nat. Commun. 2018, 9, 4523. [Google Scholar] [CrossRef] [PubMed]
  38. Zaninovich, S.C.; Gatti, M.G. Carbon stock densities of semi-deciduous Atlantic forest and pine plantations in Argentina. Sci. Total Environ. 2020, 747, 41085. [Google Scholar] [CrossRef]
  39. Meeussen, C.; Govaert, S.; Vanneste, T.; Haesen, S.; Van Meerbeek, K.; Bollmann, K.; Brunet, J.; Calders, K.; Cousins, S.A.O.; Diekmann, M.; et al. Drivers of carbon stocks in forest edges across Europe. Sci. Total Environ. 2020, 759, 143497. [Google Scholar] [CrossRef] [PubMed]
  40. Sandoval, L.D.M.; Arturi, M.F.; Goya, J.F.; Pérez, C.A.; Frangi, J.L. Eucalyptus grandis plantations: Effects of management on soil carbon, nutrient contents and yields. J. For. Res. 2018, 31, 601–611. [Google Scholar] [CrossRef]
  41. Gao, Y.; Wang, Y. Medium and Long-Term Influences of Typical Plantations on Surface Soil Nutrients in the Temperate Zone of Mount Meng, China. Appl. Ecol. Environ. Res. 2018, 16, 6385–6393. [Google Scholar] [CrossRef]
  42. Stine, A.R.; Huybers, P. Implications of Liebig’s law of the minimum for tree-ring reconstructions of climate. Environ. Res. Lett. 2017, 12, 114018. [Google Scholar] [CrossRef]
  43. Laurance, W.F.; Laurance, S.G.; Ferreira, L.V.; Merona, J.M.R.D.; Gascon, C.; Lovejoy, T.E. Biomass Collapse in Amazonian Forest Fragments. Science 1997, 278, 1117–1118. [Google Scholar] [CrossRef]
  44. Grandpré, L.D.; Gagnon, D.; Bergeron, Y. Changes in the Understory of Canadian Southern Boreal Forest after Fire. J. Veg. Sci. 1993, 4, 803–810. [Google Scholar] [CrossRef]
  45. Hart, S.A.; Chen, H.Y.H. Understory Vegetation Dynamics of North American Boreal Forests. Crit. Rev. Plant Sci. 2006, 25, 381–397. [Google Scholar] [CrossRef]
  46. Aussenac, G. Interactions between forest stands and microclimate: Ecophysiological aspects and consequences for silviculture. Ann. For. Sci. 2000, 57, 287–301. [Google Scholar] [CrossRef]
  47. Rambo, T.R.; North, M.P. Canopy microclimate response to pattern and density of thinning in a Sierra Nevada forest. For. Ecol. Manag. 2009, 257, 435–442. [Google Scholar] [CrossRef]
  48. Holbo, H.R.; Childs, S.W. Summertime Radiation Balances of Clearcut and Shelterwood Slopes in Southwest Oregon. For. Sci. 1987, 33, 504–516. [Google Scholar] [CrossRef]
  49. Moore, R.; Spittlehouse, D.L.; Story, A. Riparian microclimate and stream temperature response to forest harvesting: A review. JAWRA J. Am. Water Resour. Assoc. 2005, 41, 813–834. [Google Scholar] [CrossRef]
  50. Park, S.G.; Kurosawa, K. Evaluation of Regeneration Potential for an Artificial Larch Forest Using Light Condition, Plant Species Diversity, and Plant Coverage and Biomass of the Forest Understory. J. Fac. Agric. Kyushu Univ. 2017, 62, 47–52. [Google Scholar] [CrossRef]
  51. Xu, J. China’s new forests aren’t as green as they seem. Nature 2011, 477, 371. [Google Scholar] [CrossRef] [PubMed]
  52. Su, S.; Deng, N.; Ma, F.; Song, Q.; Tian, Y. Crown and diameter structure of pure Pinus massoniana Lamb. forest in Hunan province, China. Open Life Sci. 2023, 18, 20220574. [Google Scholar] [CrossRef]
Figure 1. Comparison chart of pre-investigation and formal investigation environment.
Forests 16 00087 g001
Figure 2. Map of study sites. Purple dots represent 12 sample plots located within 54 m of the edge, red dots represent 12 sample plots located at 55–83 m from the edge, dark green dots represent 10 sample plots located at 84–189 m, and orange dots represent 10 sample plots located at 190–276 m. light green blocks represent planted forests and yellow blocks represent bare land.
Forests 16 00087 g002
Figure 3. Multiple comparisons of each index chart and T test volcano plots. * represents a significant difference, ** represents a more significant difference and *** represents a most significant difference. (ag) represent DBH, tree height (H), carbon storage, tree density, canopy cover, species richness, and Shannon index, respectively. The multiple comparisons of each index are shown in the chart, and the T-test volcano plots are presented for statistical analysis. (h) refers to multiple unpaired t-tests conducted for these comparisons. The horizontal dashed line of (h) represents the significance line, above which a significant difference is represented by the t-test and the vertical dashed line distinguishes between positive and negative values of the difference.
Forests 16 00087 g003
Figure 4. Edge effect action range diagram. The larger the radius of the sector represents the more distant the action range. Red represents stand structure data, yellow represents forest function data, and blue represents understory species diversity data.
Forests 16 00087 g004
Figure 5. The minimum value is −0.68 and the maximum value is 0.78. The standardized residual plot shows a symmetric distribution around 0, with no apparent change in distribution characteristics as the predicted values increase. This suggests that the assumptions of homoscedasticity and independence are satisfied. Additionally, the P-P plot indicates that the normality assumption holds.
Forests 16 00087 g005
Figure 6. CCA species ranking diagram. Purple circle represents < 54 m, red square represents 55–83 m, green prism represents 84–189 m, and yellow triangle represents 190–276 m. Points farther away represents the greater difference in species composition.
Forests 16 00087 g006
Table 1. Multiple linear regression table.
R2 = 0.34Unstandardized CoefficientStandardized CoefficienttSignificance95.0% Confidence Interval of B
BSEBeta Lower limit Upper limit
intercept distance1.16±0.27 4.320.00 *0.621.70
Distance (m)0.00±0.000.000.010.990.000.00
Tree density (/0.01 ha)0.06±0.030.492.240.03 *0.010.12
Canopy (%)0.46±0.690.160.670.51−0.921.85
Dependent variable: Shannon index of understory species, * represents a significant difference.
Disclaimer/Publisher’s Note: The statements, opinions and data contained in all publications are solely those of the individual author(s) and contributor(s) and not of MDPI and/or the editor(s). MDPI and/or the editor(s) disclaim responsibility for any injury to people or property resulting from any ideas, methods, instructions or products referred to in the content.

