Article

Evaluation of Height Changes in Uneven-Aged Spruce–Fir–Beech Forest with Freely Available Nationwide Lidar and Aerial Photogrammetry Data

by
Anže Martin Pintar
1,2,* and
Mitja Skudnik
1,2
1
Slovenian Forestry Institute, Večna pot 2, 1000 Ljubljana, Slovenia
2
Biotechnical Faculty, University of Ljubljana, Jamnikarjeva 101, 1000 Ljubljana, Slovenia
*
Author to whom correspondence should be addressed.
Forests 2025, 16(1), 35; https://doi.org/10.3390/f16010035
Submission received: 4 December 2024 / Revised: 23 December 2024 / Accepted: 26 December 2024 / Published: 28 December 2024
(This article belongs to the Section Forest Inventory, Modeling and Remote Sensing)

Abstract

:
Tree height and vertical forest structure are important attributes in forestry, but their traditional measurement or assessment in the field is expensive, time-consuming, and often inaccurate. One of the main advantages of using remote sensing data to estimate vertical forest structure is the ability to obtain accurate data for larger areas in a more time- and cost-efficient manner. Temporal changes are also important for estimating and analysing tree heights, and in many countries, national airborne laser scanning (ALS) surveys have been conducted either only once or at specific, longer intervals, whereas aerial surveys are more often arranged in cycles with shorter intervals. In this study, we reviewed all freely available national airborne remote sensing data describing three-dimensional forest structures in Slovenia and compared them with traditional field measurements in an area dominated by uneven-aged forests. The comparison of ALS and digital aerial photogrammetry (DAP) data revealed that freely available national ALS data provide better estimates of dominant forest heights, vertical structural diversity, and their changes compared to cyclic DAP data, but they are still useful due to their temporally dense data. Up-to-date data are very important for forest management and the study of forest resilience and resistance to disturbance. Based on field measurements (2013 and 2023) and all remote sensing data, dominant and maximum heights are statistically significantly higher in uneven-aged forests than in mature, even-aged forests. Canopy height diversity (CHD) information, derived from lidar ALS and DAP data, has also proven to be suitable for distinguishing between even-aged and uneven-aged forests. The CHDALS 2023 was 1.64, and the CHDCAS 2022 was 1.38 in uneven-aged stands, which were statistically significantly higher than in even-aged forest stands.

1. Introduction

The height of trees is an important attribute in forestry, but its traditional field measurement is expensive, time-consuming and often imprecise [1]. Furthermore, the use of comprehensive data derived from field measurements to evaluate the vertical structure of uneven-aged forest stands is a laborious and costly endeavour. This is primarily due to the substantial demands of fieldwork, particularly when numerous stands necessitate surveys in extensive forest areas [2]. A further challenge inherent in field measurement pertains to the objectivity of data collection by individual teams [3]. Similarly, the vertical structure of a forest is an important component in forest management planning [4]. The vertical forest structure can be described by the representation of the vertical layers of vegetation [5]. One of the main advantages of using remote sensing data to estimate vertical forest structure is the ability to obtain accurate data for larger areas in a more time- and cost-efficient manner [6,7]. Estimating tree height and vertical structure using remote sensing data is very useful for improving the comparability of data retrieved from different areas and shortening periods without data resulting from the multi-year intervals between successive forest inventories [8]. In particular, the use of airborne laser scanning (ALS) data enables systematic and reliable estimations of tree heights and changes in tree heights over large areas. Estimating tree heights under optimal conditions with remote sensing data can also be more accurate and efficient than traditional field measurements using triangulation techniques [9]. This also applies to the evaluation of other stand parameters in forests with irregular topography and unfavourable weather conditions, where fieldwork is much more challenging [7].
Temporal changes are also important for estimating and analysing tree heights, and in many countries, national ALS surveys have been conducted either only once or at specific longer intervals [10], while aerial surveys are more often arranged in cycles with shorter intervals. Timeliness in forestry is particularly important when applying precise management practises, as rapid structural changes can occur due to both abiotic and biotic disturbances [11]. Therefore, the use of a photogrammetric point cloud derived from cyclic aerial photography is an alternative to ALS data [12,13]. One of the disadvantages of monitoring forest stands with ALS data is the current high cost of acquisition and processing [8,14]. Aerial photography is more affordable, and sequential or cyclic aerial surveys have been introduced in many areas in Europe [8]. Aerial surveys are also conducted with increasing overlap between two adjacent images (e.g., with a longitudinal overlap greater than 70% [15]), which can produce a higher-quality photogrammetric point cloud.
With the automatic processing of aerial images and advances in computer technology, it is possible to extract information about the height of objects and, thus, the canopy height from aerial images [16]. A photogrammetric point cloud, which is derived from aerial images using image-matching technology, can be generated to represent the upper part of the tree canopy surface [8]. The height of the trees above the surface can be determined (referred to as the normalisation of the photogrammetric point cloud) by subtracting the ALS digital terrain model (DTM) from the digital aerial photogrammetry (DAP) digital surface model (DSM) [12]. In this study, the used DSM was created in Slovenia from national ALS data [17], as photogrammetric DTMs are often not accurate enough in forested areas [14]. ALS and DAP data are suitable for estimating height and vertical structural changes at the stand and individual tree levels [18]. Examples of small differences in canopy height estimation using ALS and DAP data have been presented by e.g., Gobakken et al. [19] and Rahlf et al. [20]. Due to the lower cost of DAP-based canopy height model (CHM) generation, Fassnacht et al. [21] found an increased interest in its use among forest surveyors, forest managers, district foresters, and forest owners in Southern and Central Europe. Fassnacht et al. [21] also point out the importance of using CHMs from several different sources to provide up-to-date data in an operational practice.
In the present study, we investigated the possibility of determining tree heights, vertical diversity, and height changes using freely available national cyclic DAP and ALS data, which could also be used in operational practice. Currently, the use of ALS data is often limited to a few study cases due to high data costs, the limited availability of remote sensing data over large areas, and, to some extent, resistance from forest practitioners [22]. In this study, we aim to address how practical challenges in forestry align with attributes that match the spatial scales and thematic information requirements of end users, which Fassnacht et al. [23] name as one of the key future challenges in increasing the acceptability, suitability, and integration of remote sensing data into operational inventory and monitoring programmes.
The analysis was conducted in an area dominated by uneven-aged forests [24,25,26]. While even-aged forests still dominate across Europe [27], numerous studies [28,29] have highlighted the importance of addressing these disturbances. Specifically, they emphasise the need to convert uniform forests into structurally diverse ones to enhance resilience, resistance, and biodiversity, particularly in forests with silver fir at higher altitudes [30].
In this study, we review all freely available national airborne remote sensing data describing the three-dimensional structure of forests in Slovenia. Most previous studies have used remote sensing data to obtain plot-wide height data (e.g., Stepper, Straub, and Pretzsch [8]), but in this study, we wanted to test the possibility of calculating the dominant tree height based on the individual trees detected in the plot—just like in field measurements. The dominant height is defined as the average height of a fixed number of trees in relation to the spatial unit with the largest diameters at breast height (top height) or the highest height (predominant height) [31]. Values of 40 to 100 trees/ha are most commonly used [31]. The dominant height is used in forestry, for example, to assess stand productivity [31,32] and stand growth [33], and it is also used as a standardised measure for comparing the growth potential of different forest stands [26].
DAP data were selected because they are usually recorded at denser time intervals and because the recordings are taken with increasing overlap of adjacent images (up to 70 or even 80%) [15]. ALS data were used because of their general suitability for determining the vertical structure diversity of the forest and the heights of the trees. In this study, we wanted to demonstrate the use of freely available national DAP and ALS data with a lower resolution and point density than could be collected for smaller areas with more precise remote sensing techniques [11,34,35].
The main aim of the study is to improve the detection of tree heights and their changes, as well as differences in vertical structure in areas where uneven-aged forests are prevalent. The study’s findings are conducive to the development of forest management strategies that are more resilient to climatic change, and which support the sustainable management of forests in Slovenia and other regions worldwide.

2. Materials and Methods

2.1. Study Area

The analysis of canopy height changes was carried out based on canopy height models (CHMs) obtained from DAP, ALS, and field measurements in the Pahernik Forest Estate (Figure 1). This extends into the northeastern part of Slovenia (located in the transition zone between Central and South-eastern Europe [29]) on the Drava–Pohorje mountain range between the Drava River in the north and the Pohorje Ridge in the south. The study area is dominated by the heterogeneous slopes of the northern part of the Drava-Pohorje mountain range. The lowest altitude of the forest property is 350 m, and the highest is 1543 m. The Pahernik property is located in an area where Alpine and Pannonian climates intersect [36]. This study area was chosen due to its diverse forest structure [24,25,26] and its history of planned forest management spanning over a century [37], which has led to the development of uneven-aged forest structures. In addition to the primary focus on uneven-aged forests, the site was selected because it also contains areas of even-aged forests. These forests are now being managed on a small-area basis, gradually transforming from even-aged to increasingly uneven-aged structures. In addition, a denser systematic sample grid of permanent sample plots (250 × 250 m) is available than in the surrounding forests, for which the Slovenian Forest Service has drawn up a detailed estate plan (2014–2023) based on field measurements [36].
In the forests of the Pahernik forest estate, the dominant tree species is Norway spruce (Picea abies), comprising 71% of the growing stock in 2013 and 68% of the growing stock in 2023, followed by European beech (Fagus sylvatica), comprising 13% in 2013 and 14% in 2023, and silver fir (Abies alba), comprising 11% in 2013 and 13% in 2023 [26,38]. The three most prevalent tree species on the property are all autochthonous in the area. Historically, Norway spruce has been more extensively promoted in the study area compared to European beech, as is also typical for many Slovenian forests due to Norway spruce commercial timber value [28]. These three tree species are also dominant in Slovenian forests [39]. The area of the forests in the study area is 570.1 ha.

2.2. Data Acquisition and Preparation

2.2.1. Field Measurement of Tree Heights

Tree height measurements were collected from 88 permanent concentric sample plots located in uneven-aged and mature even-aged forests, each with a radius of 12.61 m (500 m2 area), in 2013 and 2023 by the Slovenia Forest Service (SFS) [36,38]. The SFS is a public institution in Slovenia that is responsible for the preparation of forest management plans for all Slovenian forests [40]. The data used in this study were collected within stand-wise and plot-wise forest inventories. For the latter, the SFS has a dense sampling network throughout the whole country, and plots are re-measured every 10 years [40]. Trees with a diameter at breast height (DBH) of at least 30 cm are measured on 500 m2 plots, and trees with a DBH of at least 10 cm on 200 m2 plots. The coordinates of the centre of each plot were measured using a handheld GNSS receiver. The location of each tree was determined by the distance from the centre of the plot and the azimuth, which is the angle between the north and the location of the tree. The sample plots were then explicitly positioned based on manual correction between the location of the canopy trees determined from the field measurements and the same trees identified on the generated lidar CHM [26].
In 2013, the heights of all trees in the canopy were measured. A total of 720 tree heights were measured, with an average of 8 tree heights and a maximum of 19 tree heights per sample plot. In 2023, 7 trees were measured in the canopy on each plot (in plots with less than 7 trees in total, all tree heights were measured). In 2023, a total of 457 tree heights were measured, with an average of 6 trees per plot. Tree heights were measured using a Vertex ultrasonic hypsometer. For the trees in the canopy (253) that were not measured in 2023, the tree height was calculated using the height curve models [8].

2.2.2. Remote Sensing Data

The first Slovenian national ALS was carried out in 2014–2015, and the second is being carried out from 2023 to 2025. The first digital surface model for the entirety of Slovenia was created from 2017 to 2019 from cyclic aerial survey data. In this study, we analysed freely available national ALS—Laser scanning of Slovenia (LSS) data from 2014 [41] (acquired in late September and early October at the time of tree foliage) and 2023 (acquired in late September and early October at the time of tree foliage) [42], as well as cyclic aerial survey data (CAS) from 2019 [43] and 2022 [44] (both acquired in spring at the time of tree foliage). The provider of the LSS and CAS data is the Surveying and Mapping Authority of the Republic of Slovenia. The ALS of Slovenia in 2014 was conducted using a Eurocopter EC 120B helicopter, with flight heights ranging from 1200 to 1400 m above the ground. The lidar system comprised a RIEGL LMS-Q780 laser scanner and a positioning and orientation system (differential GNSS Novatel OEMV-3, INS IGI Aerocontrol Mark II rotation measurement system (E 256 Hz)). The average recording density was 5 points per m2 [45].
In 2023, ALS was carried out using a Diamond Aircraft Industries DA42; OE-FFC. A RIEGL VQ-78IIS laser scanner and a Sepentrio AsteRx4 GNSS Receiver, as well as an AEC-Compact Inertial Measurement Unit, were used. [46]. The prevailing flight altitude was 1200 m. The average recording density was 21 points/m2. The canopy height model (CHM) with a resolution of 1 m from the lidar data of 2014 was created by Kobler [47]. For the 2023 lidar data, we obtained the DSM and DTM from the Surveying and Mapping Authority and created the CHM for the entire study area by subtracting the DTM from the DSM.
We also used DSMs obtained by image matching with a point density of at least 1 point/m2 [48] from the Cyclic Aerial Survey of Slovenia 2019 [43] and 2022 [44] projects. Two CHMs with a spatial resolution of 1 m were generated by subtracting the DTM from the lidar data with a pixel size of 1 m from the two DSMs obtained from the CAS data to obtain the CAS 2019 and CAS 2022 canopy height models.

2.3. Data Analysis

2.3.1. Analysis of Field Measurements

The 88 permanent sample plots, which were in the mature forest area, were then classified as even-aged or uneven-aged using the Shannon–Wiener diversity index based on the basal area of tree species by 10 cm diameter class. pi is the proportion of basal area per hectare of trees in each DBH class to the total basal area (Equation (1)):
H = p i ln p i ,
We classified plots with a Shannon–Wiener index above 1.3 into the uneven-aged plots. The dividing line was reasonably adjusted based on analyses of forests in the Pohorje area [24,26,49] and visual inspections of the lidar point cloud data in the area of the permanent sampling plots.
The determination of the dominant height of trees was made for each permanent sample plot, with this being achieved by considering the 100 highest trees per hectare [32]. We also indicated the maximum tree height for each plot. The dominant and maximum tree heights obtained from field measurements were then compared with those obtained from remote sensing data. We also investigated the differences in parameter estimates between even-aged and uneven-aged forest stands. Since the variables were normally distributed and homogeneity of variances was confirmed, differences between the groups were tested using a Two-Sample t-test.

2.3.2. Extraction of Tree Heights from National ALS and DAP Data

In each canopy height model (LSS 2014, LSS 2023, CAS 2019, and CAS 2022), we searched for local maxima considering circular neighbourhood associations with a radius of 3 m, which was determined based on measurements of tree canopy radii for prevalent species in the area, as resented by Pretzsch et al. [50], and which has already been used in the Pohorje area [26]. We then detected tree height data and thus generated a digital model of the treetops. The determination of the dominant height of trees was made for each permanent sample plot, with this being achieved by considering the 100 highest trees per hectare [32]. For each plot, we have also presented the maximum heights of all used remote sensing data (LSS2014, LSS2023, CAS 2019, and CAS 2022). We also investigated the differences in parameter estimates between even-aged and uneven-aged forest stands. If the variables were normally distributed and homogeneity of variances was confirmed, the Two-Sample t-test was used; otherwise, the Wilcoxon rank sum test was used (dominant and maximum tree height based on CAS 2022).
The dominant and maximum tree heights obtained from field measurements were then compared with those obtained from remote sensing data. We used Person’s correlation coefficient because all variables were linearly related. All variables except dominant and maximum tree height based on CAS 2022 were also normally distributed, and the latter two variables were also nearly normally distributed.

2.3.3. Canopy Height Diversity Analysis

All four CHMs were classified into 5 m height classes. The first class included tree heights from 0 to 5 m, and the last class comprised tree heights above 40 m. These proposed height classes have already been applied in the Pohorje area [26,49], where the studied site is located. The CHDs were then calculated based on the height classes in the 500 m2 area of the sample plot (Equation (2)). The pi value represents the proportion of the area of each height class to the total area of the permanent sample plot. The CHDs were calculated for all studied CHMs (LSS 2014, LSS 2023, CAS 2019, and CAS 2022). We chose to use the CHD based on CAS and LSS CHMs to estimate the vertical structure, as this allows for a comparable analysis between LSS and CAS since the CAS data represent the upper part of the canopy surface [8]. In the Pohorje region, the CHDCHM from lidar data has already proven to be suitable for assessing the diversity of vertical forest structures [26]. We also investigated the differences in parameter estimates between even-aged and uneven-aged forest stands. If the variables were normally distributed and homogeneity of variances was found, the Two-Sample t-test was used; otherwise, the Wilcoxon rank sum test was used (LSS 2023 and CAS 2022 CHDs).
C H D C H M = p i ln p i ,

2.3.4. Detection and Analysis of Changes in the Dominant Heights of Trees

The analysis of changes in the dominant height was estimated at the level of permanent sample plots for field measurements (Equation (3)), ALS data (Equation (4), Figure 2) and aerial survey data (Equation (5), Figure 2). The periodic annual increments (PAIs) of the dominant heights were calculated for each permanent sample plot. PAIs were calculated by dividing the dominant heights in the sample plot by the number of periods of shoot elongation [8]. We also investigated the differences in PAI estimates between even-aged and uneven-aged forest stands. Since the data are not normally distributed, we used the Wilcoxon rank sum test to determine whether there were differences between the medians of the PAIs calculated from all three data sources.
P A I h d o m ( f i e l d ) = h d o m ( f i e l d )   2023 h d o m ( f i e l d ) ( 2013 ) 10 ,
P A I h d o m ( L S S ) = h d o m ( L S S )   2023 h d o m ( L S S ) ( 2014 ) 9 ,
P A I h d o m ( C A S ) = h d o m ( C A S )   2022 h d o m ( C A S ) ( 2019 ) 3 ,
Spatial analyses were conducted using ArcMap 10.8 [51], and statistical analyses were executed and graphs were constructed using R 4.4.1 software [52].

3. Results

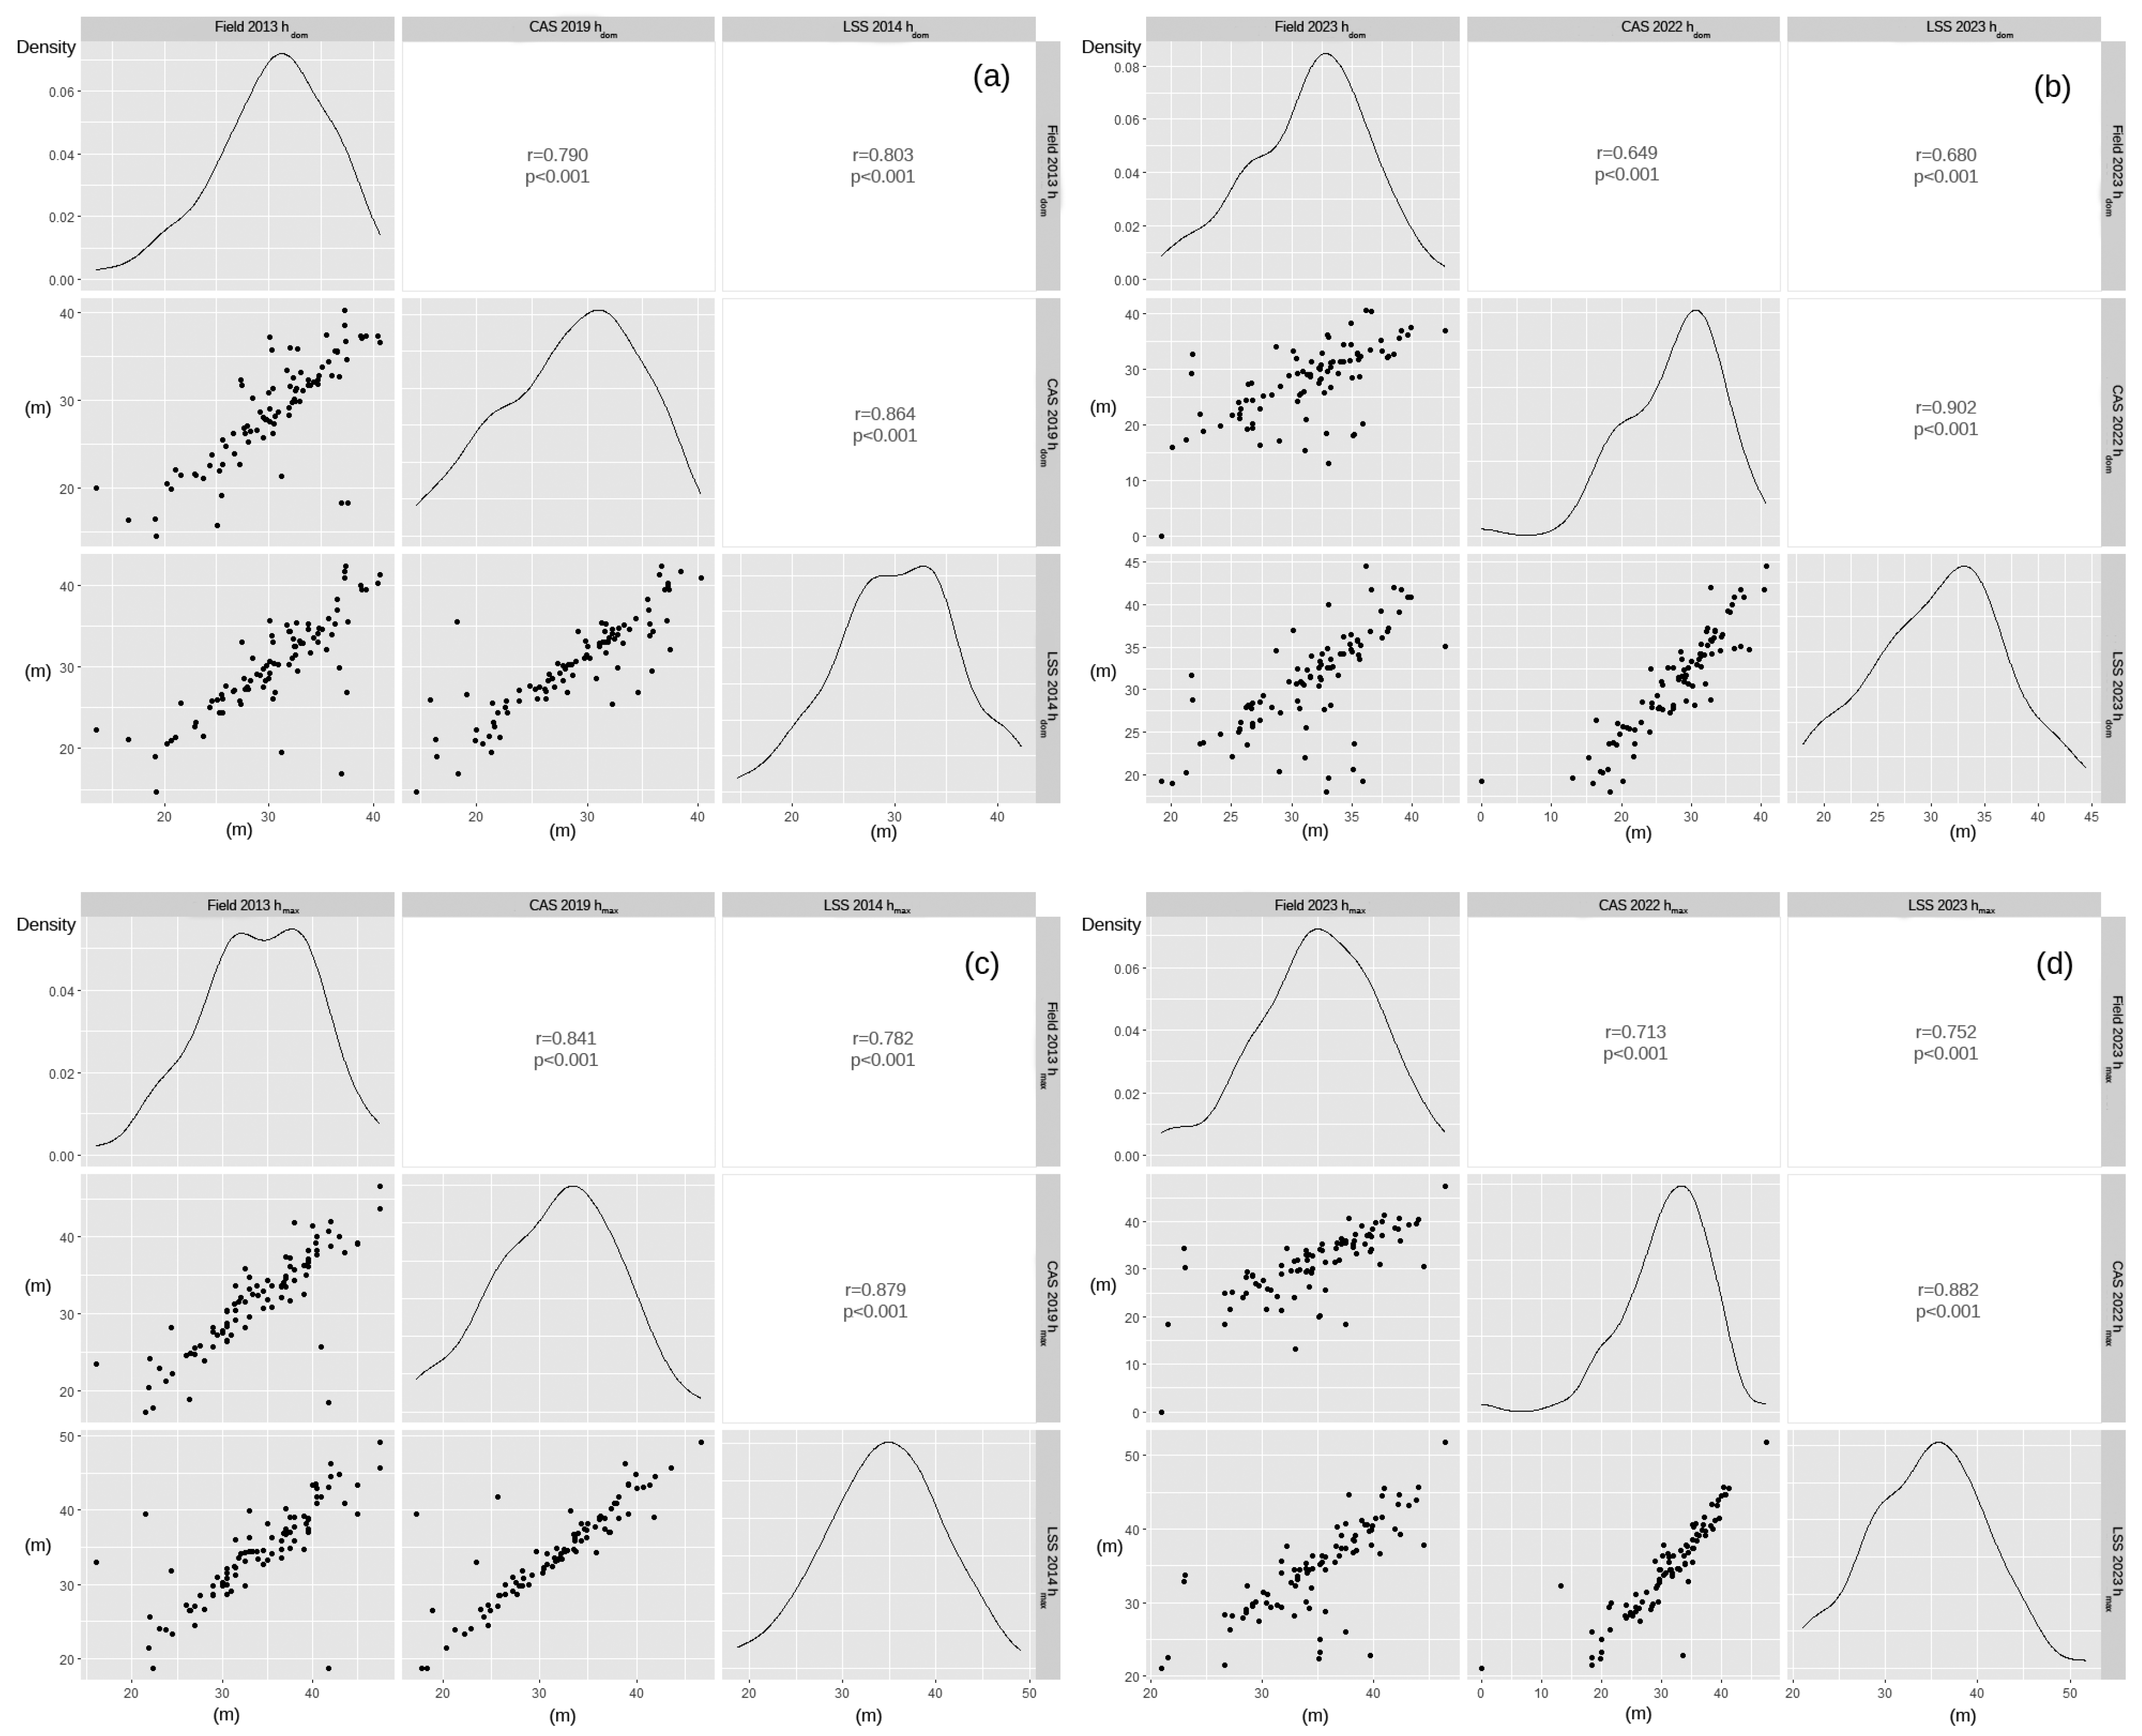
3.1. Analyses of Dominant and Maximum Tree Heights and Canopy Height Diversity Derived from Field Measurements, Lidar Data, and Cyclic Aerial Survey Data

The hdom obtained from the 2013 field measurements was strongly correlated with the hdom obtained from the 2014 lidar data and the CAS data (the Pearson correlation coefficient, r, ranged from 0.7 to 0.8, p < 0.001), as was the hmax (Figure 3). The hdom derived from the 2023 field measurements showed a slightly lower but still high correlation with the hdom derived from the 2023 lidar data (r = 0.68, p < 0.001) and the 2022 cyclic aerial survey data (r = 0.65, p < 0.001), while the maximum heights derived in the 2022–2023 period showed a higher correlation (the Pearson correlation coefficient ranged from 0.7 to 0.8, p < 0.001)) (Figure 3).
In the Pahernik Forest Estate, we further analysed 51 permanent sample plots classified as uneven-aged forests, and 37 plots classified as even-aged forests. Figure 4 shows an example of the even-aged and uneven-aged forests in the permanent sample plot area. hdom and hmax increased slightly based on the 2013–2023 field measurements and the 2014–2023 lidar data (Table 1). With the CAS data, we could not detect this increase, and especially in 2022, the estimates of hdom and hmax from CAS were much lower than those from field measurements and lidar data (Table 1). hdom was statistically significantly higher in uneven-aged forests for all data sources (Table 1). Similarly, hmax was statistically significantly higher in uneven-aged forests for all measurements (Table 1).
The CHDs derived from all four data sources were statistically significantly higher in the uneven-aged forests (Table 2). The standard deviation was higher for the calculated CHDs from the cyclic aerial survey data (2019 and 2022) than from the lidar data (2014 and 2023). All CHD estimates using LSS data were higher than CHD estimates using CAS data (Table 2).

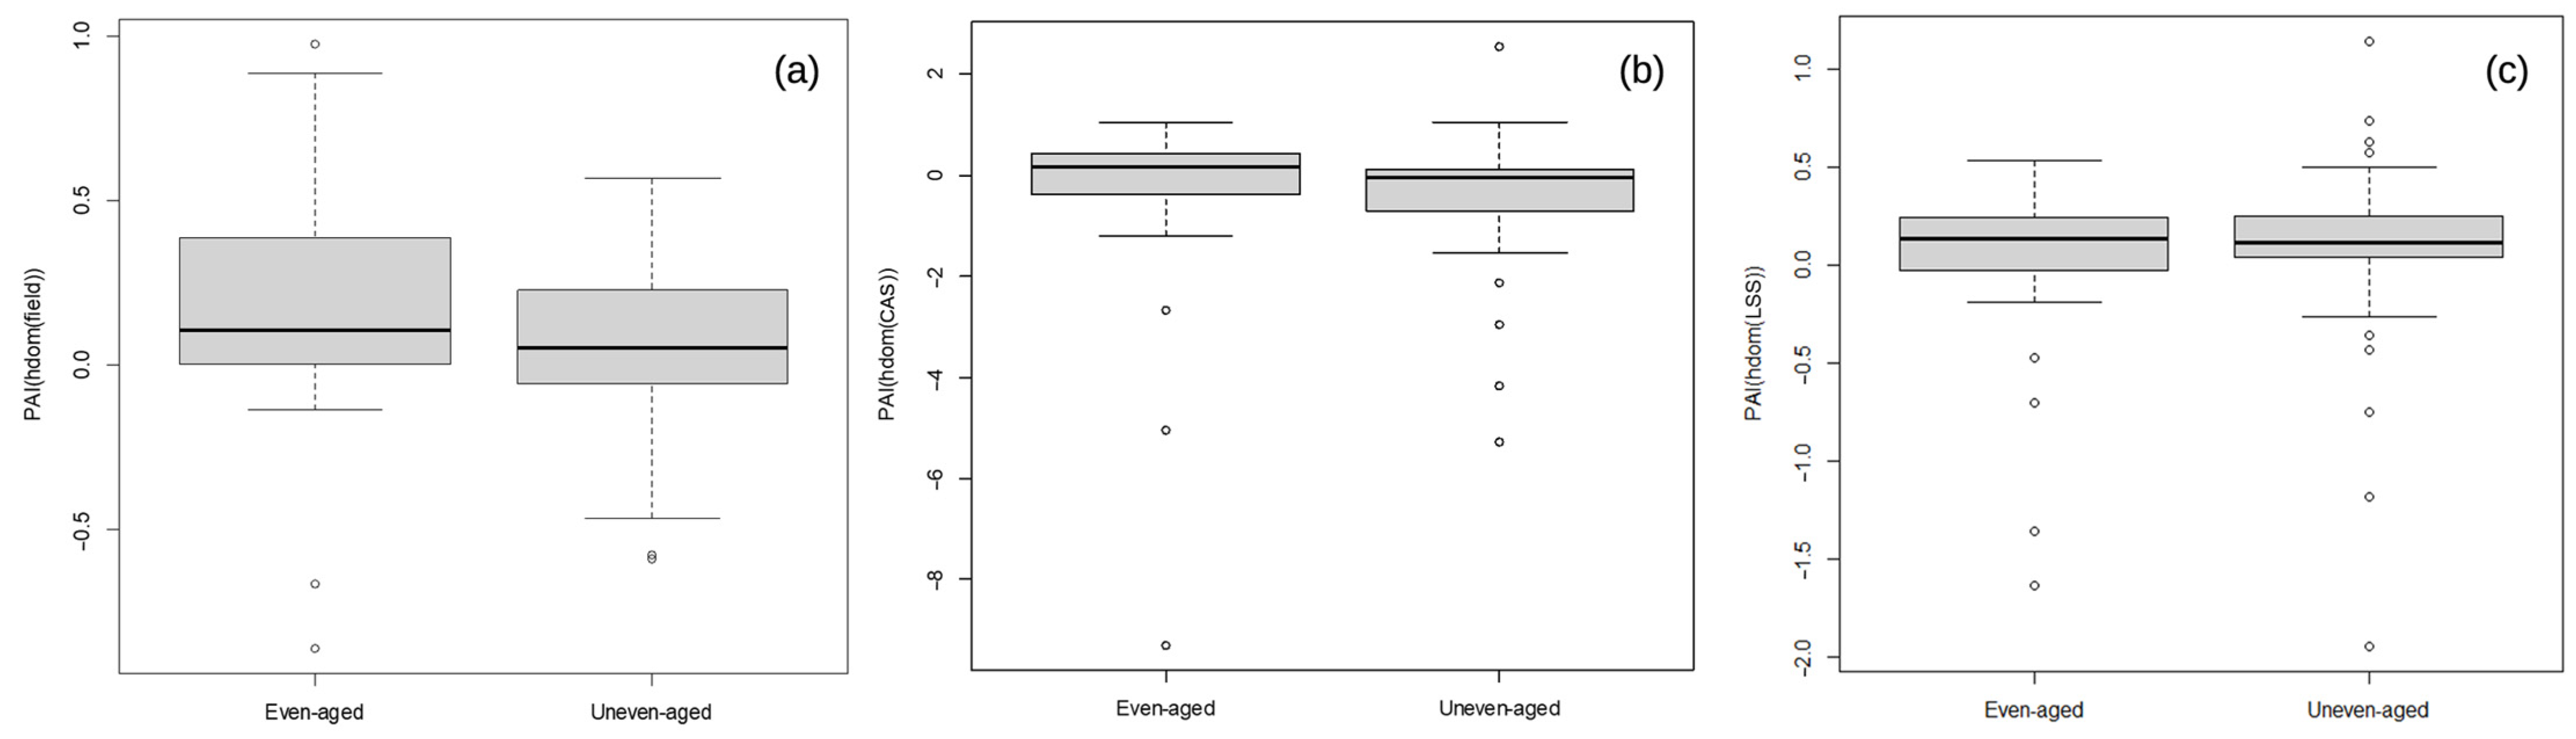
3.2. Periodic Annual Increment Assessment

The medians in all three analyses (field measurements, LSS, and CAS) were higher in even-aged forests, but the differences in the median values were not statistically significant (Table 3, Figure 5). Negative values and high positive values of the PAI, which were determined in all three analyses (field measurements, LSS, and CAS), represented forest stands in which timber harvesting was carried out. Due to the high negative values in the PAI(hdom(CAS)) analysis, the average PAI(hdom(CAS)) was negative for both even-aged and uneven-aged stands. In addition, the PAI(hdom) estimated from the CAS data had the highest standard deviation for both even-aged and uneven-aged forests.

4. Discussion

In the present study, we verified the estimation of heights, height changes and vertical diversity of forest stands in an area dominated by uneven-aged forests [24,25,26]. We found a strong correlation between the dominant and maximum heights obtained from field measurements and remote sensing data. The slightly lower Pearson correlation coefficient values (hdom derived from the 2023 field measurements with the hdom derived from the 2023 lidar data (r = 0.68) and the 2022 cyclic aerial survey data (r = 0.65) could be due to the steep terrain, the heterogeneity of the forest or shadows and occlusions [14] of mature trees that affected the production of the two CAS CHMs (Figure 4b). The influence of shadows on the production of CAS CHMs was also shown, for example, by Pintar and Skudnik [25]. The influence of shadows is greater in vertically heterogeneous stands, as taller trees shade smaller patches of younger trees or canopy gaps [25]. Additionally, the impact on detection accuracy with DAP and ALS is greater in heterogeneous terrain. [20,53]. A similar Person correlation coefficient as that obtained in the present study for hdom and hmax between field measurements and ALS and DAP data between tree heights derived from DAP CHMs and field measurements (r = 0.83) was also presented by Ginzler and Hobi [54].
Similarly to previous studies comparing ALS and DAP data, we found that freely available national ALS data provided better estimates of dominant forest heights and vertical structural diversity compared to cyclic DAP data. The consistency of CHMCAS data was also lower than that of ALS data in steep terrain [54]. Using CHMCAS data, we estimated lower dominant and maximum heights in both even-aged and uneven-aged forests. Lower heights derived from DAP CHMs than from lidar and field measurements were also presented by Ganz, Käber, and Adler [9]. Ganz, Käber, and Adler [9] and Sibona et al. [55], also noted that ALS measurements of tree height can be more accurate than traditional triangulation techniques, supporting the use of freely available national ALS data to complement field measurements over larger areas. For example, as Lisein et al. [56] noted, our study showed that DAP CHMs typically smoothen the canopy surface, but they are still useful due to their temporally dense data. This is particularly relevant in the context of climate change, when natural disturbances are common in temperate forests [28,29], and up-to-date data are very important for forest management and the study of forest resilience and resistance to disturbances.
Dominant and maximum heights are higher in uneven-aged forests than in mature even-aged forests based on field measurements (2013 and 2023) and all remote sensing data (LSS 2014, LSS 2023, CAS 2019, and CAS 2022). Higher dominant heights in uneven-aged forests based on ALS data and field measurements had been presented earlier by Pintar and Skudnik [26] for the larger area of Pahernik Forest Estate.
The statistically significant differences in CHD between even-aged and uneven-aged forests based on CHMs derived from ALS and DAP data suggested that the use of both data sources is appropriate for assessing the vertical diversity of forest stands. We chose to use CHD based on CAS and LSS CHMs to estimate vertical structure because it allows for a comparable analysis between LSS and CAS, as CAS data represent the upper part of the canopy surface [8,14]. CHMs have been shown to be more intuitive [57] and easier to apply in operational practice [21] when larger areas are studied. However, they have the disadvantage that some shade-tolerant trees cannot be identified when a dense canopy of mature, dominant trees are present in stands with low height diversity visible from above, compared to the approach using voxels derived from ALS data [58,59,60,61]. In the Pahernik Forest Estate area, stand regeneration is concentrated in small gaps [25], so the trees in the understory had no significant influence on the determination of CHD, which was also shown by Pintar and Skudnik [26] for the larger Pahernik Forest Estate area. Furthermore, the resilience of stands to natural disturbances is primarily affected by the height heterogeneity of the canopy layer trees [62], which was shown to be appropriate based on the CHDs derived from the CHM.
Negative and high positive PAI values derived from field measurements and LSS and CAS data represented harvest were also presented by Stepper, Straub, and Pretzsch [8] from both field and DAP data. For PAI(hdom(CAS)), the high negative values represented not only harvest, but also the influence of shadows and occlusion of mature trees on DMPCAS production. For the latter reason, the estimation of PAI(hdom(CAS)) (median) in even-aged stands is comparable to estimates of PAI(hdom) obtained from field measurements and ALS data, but is greatly underestimated in uneven-aged forests. The fact that the median value of PAI(hdom(LSS)) was higher than that of PAI(hdom(field)) in even-aged forests could be explained by the complexity of field measurements in structurally diverse forests (it is more difficult to see the tree tops) and, thus, by the slightly lower accuracy of field measurements in uneven-aged forests. The lower accuracy of traditional field measurements in comparison to lidar data was also presented by Ganz, Käber, and Adler [9], and it was possible that this influenced the negative PAI values. External disturbances, such as extreme weather events, could also have influenced the negative PAI values, but did not occur in the study area during the study period [25].
The non-significantly lower PAI(hdom) in uneven-aged stands could be explained by the fact that the dominant layer grows similarly to even-aged stands, with the exception that in uneven-aged stands, some of the height increment is still transferred to the non-dominant trees in even-aged stands. A higher PAI of lower trees was presented by Stepper, Straub, and Pretzsch [8].
In this study, we tested the possibility of calculating the dominant height and its changes based on the individual trees detected in the plot—just as in the field measurements. In a further step, it would also be useful to analyse the estimation of dominant height and its changes based on plots from different national forest inventories as well as ALS and DAP data, which are already available in some other European countries [21] and in other uneven-aged temperate and other climatic zones forests. The radius for determining treetops, which we determined to be 3 m in our analysis, would need to be adjusted depending on the tree composition and vegetation conditions of other possible study areas.
The CHDs derived from lidar ALS and DAP data have also been shown to be suitable for distinguishing between even-aged and uneven-aged forests. In previous studies, CHD has already proven its suitability in forestry for the classification of forest stands [26] and forest edges [57]. Similarly, FHD (foliage height diversity), a voxel-based CHD, has been shown to be useful in biodiversity conservation studies [63]. Therefore, it would be useful in further studies to also analyse CHD estimates from plots of different national forest inventories and ALS and DAP data in other temperate uneven-aged forests, as well as forests in other climate zones. This would require an adjustment of the height classes for CHD (in our case, 5 m) depending on the tree composition and vegetation conditions in other study areas.
In an era of climate change, characterised by increased variability in disturbances and the accelerated rate of change in the disturbance regimes shifts, the establishment of uneven-aged forest stands is imperative for enhancing resilience to disturbances and accelerating recovery from them [64]. This is important for temperate forests as well as for forests in other regions worldwide. The methodology and results of the present study are, therefore, of particular significance, as they demonstrate the potential for enhanced detection and monitoring of uneven-aged forests following disturbances at shorter time intervals. The utilisation of freely available national DAP and ALS data has been demonstrated to provide a timely, cost-effective and objective alternative to traditional field measurements for the detection and monitoring of height changes in uneven-aged forests.

5. Conclusions

The use of freely available national remote sensing data is very important in order to shorten the time gaps between actual field measurements and to obtain an independent estimate from the different field measurements based on the remote sensing data, since these field measurements are often carried out by different field workers.
The comparison of ALS and DAP data revealed that freely available national ALS data provide better estimates of dominant forest heights, vertical structural diversity, and their changes compared to cyclic DAP data. DAP CHMs typically smoothen the canopy surface, but they are still useful due to their temporally dense data. Based on field measurements (2013 and 2023) and all remote sensing data, dominant and maximum heights are higher in uneven-aged forests than in mature, even-aged forests. Canopy height diversity information derived from lidar ALS and DAP data has also proven to be suitable for distinguishing between even-aged and uneven-aged forests. Future studies should also employ voxel-based lidar data analyses to assess vertical forest diversity and higher-resolution datasets to assess vertical forest diversity and height changes, which will become increasingly available in the future.

Author Contributions

Conceptualization, A.M.P. and M.S.; methodology, A.M.P. and M.S.; software, A.M.P. and M.S.; validation, A.M.P. and M.S.; formal analysis, A.M.P. and M.S.; investigation, A.M.P. and M.S.; resources, A.M.P. and M.S.; data curation, A.M.P. and M.S.; writing—original draft preparation, A.M.P. and M.S.; writing—review and editing, A.M.P. and M.S.; visualisation, A.M.P. and M.S.; supervision, M.S.; project administration, A.M.P. and M.S.; funding acquisition, A.M.P. and M.S. All authors have read and agreed to the published version of the manuscript.

Funding

The work was produced as a section of the first author’s doctoral study programme in Biosciences, funded by the Ministry of Education, Science and Sport of the Republic of Slovenia and the Pahernik Foundation, and as part of the Research Programme P4-0107 Forest Biology, Ecology and Technology; the Development funding pillar of the Slovenian Forestry Institute funded by the Slovenian Research and Innovation Agency; and the project Obtaining information on changes in carbon stocks in living and dead biomass in forests, funded by the Ministry of Agriculture, Forestry and Food of the Republic of Slovenia and the Ministry of the Environment and Spatial Planning of the Republic of Slovenia.

Data Availability Statement

The authors confirm that the data underlying this research are included in the article. The raw data that support the results are available upon reasonable request from the corresponding author.

Acknowledgments

We would like to thank Andrej Grah for his help in preparing the figures. We greatly appreciate the valuable suggestions for improvement made by all reviewers.

Conflicts of Interest

The authors declare no conflicts of interest. The funders had no role in the design of the study; in the collection, analyses, or interpretation of data; in the writing of the manuscript; or in the decision to publish the results.

References

  1. St-Onge, B.; Jumelet, J.; Cobello, M.; Véga, C. Measuring individual tree height using a combination of stereophotogrammetry and lidar. Can. J. For. Res. 2004, 34, 2122–2130. [Google Scholar] [CrossRef]
  2. Hall, S.A.; Burke, I.C.; Box, D.O.; Kaufmann, M.R.; Stoker, J.M. Estimating stand structure using discrete-return lidar: An example from low density, fire prone ponderosa pine forests. For. Ecol. Manag. 2005, 208, 189–209. [Google Scholar] [CrossRef]
  3. Rahimizadeh, N.; Sahebi, M.R.; Babaie Kafaky, S.; Mataji, A. Estimation of trees height and vertical structure using SAR interferometry in uneven-aged and mixed forests. Environ. Monit. Assess. 2021, 193, 298. [Google Scholar] [CrossRef]
  4. Zimble, D.A.; Evans, D.L.; Carlson, G.C.; Parker, R.C.; Grado, S.C.; Gerard, P.D. Characterizing vertical forest structure using small-footprint airborne LiDAR. Remote Sens. Environ. 2003, 87, 171–182. [Google Scholar] [CrossRef]
  5. Bončina, A. Primerjava strukture gozdnih sestojev in sestave rastlinskih vrst v pragozdu in gospodarskem gozdu ter presoja uporabnosti izsledkov za gozdarsko načrtovanje. Zb. Gozdarstva Lesar. 2000, 63, 153–181. [Google Scholar]
  6. Lim, K.; Treitz, P.; Wulder, M.; St-Onge, B.; Flood, M. LiDAR remote sensing of forest structure. Prog. Phys. Geogr. Earth Environ. 2003, 27, 88–106. [Google Scholar] [CrossRef]
  7. Rodríguez-Vivancos, A.; Manzanera, J.A.; Martín-Fernández, S.; García-Cimarras, A.; García-Abril, A. Analysis of structure from motion and airborne laser scanning features for the evaluation of forest structure. Eur. J. For. Res. 2022, 141, 447–465. [Google Scholar] [CrossRef]
  8. Stepper, C.; Straub, C.; Pretzsch, H. Assessing height changes in a highly structured forest using regularly acquired aerial image data. For. Int. J. For. Res. 2015, 88, 304–316. [Google Scholar] [CrossRef]
  9. Ganz, S.; Käber, Y.; Adler, P. Measuring Tree Height with Remote Sensing—A Comparison of Photogrammetric and LiDAR Data with Different Field Measurements. Forests 2019, 10, 694. [Google Scholar] [CrossRef]
  10. Næsset, E. Airborne laser scanning as a method in operational forest inventory: Status of accuracy assessments accomplished in Scandinavia. Scand. J. For. Res. 2007, 22, 433–442. [Google Scholar] [CrossRef]
  11. Iglhaut, J.; Cabo, C.; Puliti, S.; Piermattei, L.; O’Connor, J.; Rosette, J. Structure from Motion Photogrammetry in Forestry: A Review. Curr. For. Rep. 2019, 5, 155–168. [Google Scholar] [CrossRef]
  12. White, J.C.; Wulder, M.A.; Vastaranta, M.; Coops, N.C.; Pitt, D.; Woods, M. The Utility of Image-Based Point Clouds for Forest Inventory: A Comparison with Airborne Laser Scanning. Forests 2013, 4, 518–536. [Google Scholar] [CrossRef]
  13. White, J.C.; Tompalski, P.; Coops, N.C.; Wulder, M.A. Comparison of airborne laser scanning and digital stereo imagery for characterizing forest canopy gaps in coastal temperate rainforests. Remote Sens. Environ. 2018, 208, 1–14. [Google Scholar] [CrossRef]
  14. Goodbody, T.R.H.; Coops, N.C.; White, J.C. Digital Aerial Photogrammetry for Updating Area-Based Forest Inventories: A Review of Opportunities, Challenges, and Future Directions. Curr. For. Rep. 2019, 5, 55–75. [Google Scholar] [CrossRef]
  15. GURS. Daljinsko zaznavanje. 2024. Available online: https://www.e-prostor.gov.si/podrocja/drzavni-topografski-sistem/daljinsko-zaznavanje/ (accessed on 13 November 2024).
  16. Haala, N. The landscape image matching algorithms. In Proceedings of the 54th Photogrammetric Week, Stuttgart, Germany, 9–13 September 2013; pp. 271–284. [Google Scholar]
  17. Triglav Čekada, M.; Bric, V. Končan je projekt Laserskega skeniranja Slovenije. Geod. Vestn. 2015, 59, 586–592. [Google Scholar]
  18. Coops, N.C.; Tompalski, P.; Goodbody, T.R.H.; Achim, A.; Mulverhill, C. Framework for near real-time forest inventory using multi source remote sensing data. For. Int. J. For. Res. 2022, 96, 1–19. [Google Scholar] [CrossRef]
  19. Gobakken, T.; Bollandsås, O.M.; Næsset, E. Comparing biophysical forest characteristics estimated from photogrammetric matching of aerial images and airborne laser scanning data. Scand. J. For. Res. 2015, 30, 73–86. [Google Scholar] [CrossRef]
  20. Rahlf, J.; Breidenbach, J.; Solberg, S.; Næsset, E.; Astrup, R. Digital aerial photogrammetry can efficiently support large-area forest inventories in Norway. For. Int. J. For. Res. 2017, 90, 710–718. [Google Scholar] [CrossRef]
  21. Fassnacht, F.E.; Mager, C.; Waser, L.T.; Kanjir, U.; Schäfer, J.; Buhvald, A.P.; Shafeian, E.; Schiefer, F.; Stančič, L.; Immitzer, M.; et al. Forest practitioners’ requirements for remote sensing-based canopy height, wood-volume, tree species, and disturbance products. For. Int. J. For. Res. 2024, cpae021, 1–20. [Google Scholar] [CrossRef]
  22. Fassnacht, F.E.; Mangold, D.; Schäfer, J.; Immitzer, M.; Kattenborn, T.; Koch, B.; Latifi, H. Estimating stand density, biomass and tree species from very high resolution stereo-imagery–towards an all-in-one sensor for forestry applications? For. Int. J. For. Res. 2017, 90, 613–631. [Google Scholar] [CrossRef]
  23. Fassnacht, F.E.; White, J.C.; Wulder, M.A.; Næsset, E. Remote sensing in forestry: Current challenges, considerations and directions. For. Int. J. For. Res. 2023, 97, 11–37. [Google Scholar] [CrossRef]
  24. Pintar, A.M.; Hladnik, D. Strukturna pestrost gozdnih sestojev na Pahernikovi gozdni posesti. Acta Silvae Ligni 2018, 117, 1–16. [Google Scholar] [CrossRef]
  25. Pintar, A.M.; Skudnik, M. Usefulness of National Airborne Laser Scanning and Aerial Survey Data in Forest Canopy Gap Detection. Geod. Vestn. 2024, 68, 180–193. Available online: https://10.0.59.188/geodetski-vestnik.2024.02.180-193 (accessed on 1 September 2024). [CrossRef]
  26. Pintar, A.M.; Skudnik, M. Identifying Even- and Uneven-Aged Forest Stands Using Low-Resolution Nationwide Lidar Data. Forests 2024, 15, 1407. [Google Scholar] [CrossRef]
  27. ForestEurope. State of Europe’s Forests 2015 Report. In Ministerial Conference on the Protection of Forests in Europe; FOREST EUROPE Liaison Unit Madrid: Madrid, Spain, 2015; p. 312. [Google Scholar]
  28. Kutnar, L.; Kermavnar, J.; Pintar, A.M. Climate change and disturbances will shape future temperate forests in the transition zone between Central and SE Europe. Ann. For. Res. 2021, 64, 67–86. [Google Scholar] [CrossRef]
  29. Kermavnar, J.; Kutnar, L.; Pintar, A.M. Ecological factors affecting the recent Picea abies decline in Slovenia: The importance of bedrock type and forest naturalness. Iforest-Biogeosciences For. 2023, 16, 105–115. [Google Scholar] [CrossRef]
  30. Leiter, M.; Pucher, C.; Kessler, M.; Hönigsberger, F.; Lexer, M.J.; Vacik, H.; Hasenauer, H. Identifying suitable areas for plenter forest management. For. Ecosyst. 2024, 100267. [Google Scholar] [CrossRef]
  31. West, P.W. Tree and Forest Measurement, 3rd ed.; Springer: Cham, Switzerland, 2015; pp. XII, 214. [Google Scholar] [CrossRef]
  32. Tarmu, T.; Laarmann, D.; Kiviste, A. Mean height or dominant height–what to prefer for modelling the site index of Estonian forests? For. Stud. 2020, 72, 121–138. [Google Scholar] [CrossRef]
  33. Burkhart, H.E.; Tomé, M. Modeling Forest Trees and Stands; Springer: Dordrecht, The Netherlands, 2012; pp. XIV, 458. [Google Scholar] [CrossRef]
  34. Krause, S.; Sanders, T.G.M.; Mund, J.-P.; Greve, K. UAV-Based Photogrammetric Tree Height Measurement for Intensive Forest Monitoring. Remote Sens. 2019, 11, 758. [Google Scholar] [CrossRef]
  35. Gyawali, A.; Aalto, M.; Peuhkurinen, J.; Villikka, M.; Ranta, T. Comparison of Individual Tree Height Estimated from LiDAR and Digital Aerial Photogrammetry in Young Forests. Sustainability 2022, 14, 3720. [Google Scholar] [CrossRef]
  36. SFS. Posestni načrt za Gozdove Pahernikove Ustanove 2014–2023; Slovenia Forest Service: Slovenj Gradec, Slovenia, 2015; p. 90. [Google Scholar]
  37. Sušek, M. Pahernikovi Gozdovi: Biografija Rodbine Pahernik; Pahernikov sklad: Radlje, Slovenia, 2005; p. 83. [Google Scholar]
  38. SFS. Permanent Sample Plots Data; Slovenia Forest Service: Slovenj Gradec, Slovenia, 2023. [Google Scholar]
  39. Pintar, A.; Ferreira, A.; Krajnc, L.; Kušar, G.; Skudnik, M. Pestrost in pojavljanje domačih in tujerodnih drevesnih in grmovnih vrst na ploskvah Nacionalne gozdne inventure v Sloveniji. Acta Silvae Ligni 2024, 134, 11–26. [Google Scholar] [CrossRef]
  40. SFS. Slovenia Forest Service. 2024. Available online: http://www.zgs.si/eng/homepage/index.html (accessed on 10 July 2024).
  41. GURS. Data from the Laser Scanning of Slovenia 2014 Project; MNRSP—Surveying and Mapping Authority of the Republic of Slovenia: Ljubljana, Slovenia, 2015. [Google Scholar]
  42. GURS. Data from the Cyclic Laser Scanning of Slovenia 2023 Project; MNRSP—Surveying and Mapping Authority of the Republic of Slovenia: Ljubljana, Slovenia, 2024. [Google Scholar]
  43. GURS. Data from the Cyclic Aerial Survey of Slovenia 2019 Project; MNRSP—Surveying and Mapping Authority of the Republic of Slovenia: Ljubljana, Slovenia, 2019. [Google Scholar]
  44. GURS. Data from the Cyclic Aerial Survey of Slovenia 2022 Project; MNRSP—Surveying and Mapping Authority of the Republic of Slovenia: Ljubljana, Slovenia, 2022. [Google Scholar]
  45. Pegan Žvokelj, B.; Bric, V.; Triglav Čekada, M.; Obreza, A.; Tršan, S.; Dejak, B.; Karničnik, I. Izvedba Lasreskega Skeniranja Slovenije: Blok 23: Tehnično Poročilo o Izdelavi Izdelkov; Geodetski inštitut Slovenije: Ljubljana, Slovenia, 2015; p. 19. [Google Scholar]
  46. FT. CLSS 2023—Velenje—Tehnično Poročilo ZLS; Flycom Techologies: Ljubljana, Slovenia, 2023. [Google Scholar]
  47. Kobler, A. Canopy height model derived from the Laser Scanning of Slovenia; Slovenian Forestry Institute: Ljubljana, Slovenia, 2015. [Google Scholar]
  48. GCV. Tehnično Poročilo—Digitalni Model Višin OAF 12 Velenje; Geodetski zavod Celje: Celje, Slovenia, 2022. [Google Scholar]
  49. Šprah, R. Ocenjevanje ekotipov v gozdnogospodarski enoti Lovrenc na Pohorju. Biotehniška fakulteta, Oddelek za gozdarstvo in obnovljive gozdne vire: Ljubljana, Slovenia, 2019. [Google Scholar]
  50. Pretzsch, H.; Biber, P.; Uhl, E.; Dahlhausen, J.; Rötzer, T.; Caldentey, J.; Koike, T.; van Con, T.; Chavanne, A.; Seifert, T.; et al. Crown size and growing space requirement of common tree species in urban centres, parks, and forests. Urban For. Urban Green. 2015, 14, 466–479. [Google Scholar] [CrossRef]
  51. ESRI. ArcMap 10.8; ESRI: Redlands, CA, USA, 2018. [Google Scholar]
  52. R Core Team. R: A Language and Environment for Statistical Computing; R Foundation for Statistical Computing: Vienna, Austria, 2024; Available online: http://www.R-project.org (accessed on 23 September 2024).
  53. Fradette, M.-S.; Leboeuf, A.; Riopel, M.; Bégin, J. Method to Reduce the Bias on Digital Terrain Model and Canopy Height Model from LiDAR Data. Remote Sens. 2019, 11, 863. [Google Scholar] [CrossRef]
  54. Ginzler, C.; Hobi, M.L. Countrywide Stereo-Image Matching for Updating Digital Surface Models in the Framework of the Swiss National Forest Inventory. Remote Sens. 2015, 7, 4343–4370. [Google Scholar] [CrossRef]
  55. Sibona, E.; Vitali, A.; Meloni, F.; Caffo, L.; Dotta, A.; Lingua, E.; Motta, R.; Garbarino, M. Direct Measurement of Tree Height Provides Different Results on the Assessment of LiDAR Accuracy. Forests 2017, 8, 7. [Google Scholar] [CrossRef]
  56. Lisein, J.; Pierrot-Deseilligny, M.; Bonnet, S.; Lejeune, P. A Photogrammetric Workflow for the Creation of a Forest Canopy Height Model from Small Unmanned Aerial System Imagery. Forests 2013, 4, 922–944. [Google Scholar] [CrossRef]
  57. Hladnik, D.; Kobler, A.; Pirnat, J. Evaluation of Forest Edge Structure and Stability in Peri-Urban Forests. Forests 2020, 11, 338. [Google Scholar] [CrossRef]
  58. Pearse, G.D.; Watt, M.S.; Dash, J.P.; Stone, C.; Caccamo, G. Comparison of models describing forest inventory attributes using standard and voxel-based lidar predictors across a range of pulse densities. Int. J. Appl. Earth Obs. Geoinf. 2019, 78, 341–351. [Google Scholar] [CrossRef]
  59. Jacon, A.D.; Galvão, L.S.; Martins-Neto, R.P.; Crespo-Peremarch, P.; Aragão, L.E.O.C.; Ometto, J.P.; Anderson, L.O.; Vedovato, L.B.; Silva-Junior, C.H.L.; Lopes, A.P.; et al. Characterizing Canopy Structure Variability in Amazonian Secondary Successions with Full-Waveform Airborne LiDAR. Remote Sens. 2024, 16, 2085. [Google Scholar] [CrossRef]
  60. Liu, X.; Ma, Q.; Wu, X.; Hu, T.; Liu, Z.; Liu, L.; Guo, Q.; Su, Y. A novel entropy-based method to quantify forest canopy structural complexity from multiplatform lidar point clouds. Remote Sens. Environ. 2022, 282, 113280. [Google Scholar] [CrossRef]
  61. Ming, L.; Liu, J.; Quan, Y.; Li, M.; Wang, B.; Wei, G. Mapping tree species diversity in a typical natural secondary forest by combining multispectral and LiDAR data. Ecol. Indic. 2024, 159, 111711. [Google Scholar] [CrossRef]
  62. Senf, C.; Mori, A.S.; Müller, J.; Seidl, R. The response of canopy height diversity to natural disturbances in two temperate forest landscapes. Landsc. Ecol. 2020, 35, 2101–2112. [Google Scholar] [CrossRef]
  63. Bakx, T.R.M.; Koma, Z.; Seijmonsbergen, A.C.; Kissling, W.D. Use and categorization of Light Detection and Ranging vegetation metrics in avian diversity and species distribution research. Divers. Distrib. 2019, 25, 1045–1059. [Google Scholar] [CrossRef]
  64. O’Hara, K.L.; Ramage, B.S. Silviculture in an uncertain world: Utilizing multi-aged management systems to integrate disturbance. For. Int. J. For. Res. 2013, 86, 401–410. [Google Scholar] [CrossRef]
Figure 1. The Pahernik estate, which represents the study area, with marked permanent sample plots.
Forests 16 00035 g001
Figure 2. Flowchart for the remote sensing (ALS vs. DAP) data collection and analysis process.
Forests 16 00035 g002
Figure 3. Scatter (lower triangle) and density (diagonal) plots as well as Pearson correlation coefficients (r) and p-values for hdom (a,b) and hmax (c,d) calculated from various time periods.
Forests 16 00035 g003
Figure 4. Cross-sections of point clouds from lidar data (light to dark green) (2023) and CAS (blue) (2022) through even-aged (a) and uneven-aged (b) stands in the sample plots.
Forests 16 00035 g004
Figure 5. Boxplots of PAI(hdom) (m/year) derived from field measurements (a), DAP (b) and ALS (c) data for even-aged and uneven-aged stands.
Forests 16 00035 g005
Table 1. hdom and hmax derived from data canopy heights models using field measurements (2013 and 2023), lidar data (2014 and 2023) and cyclic aerial surveys (2019 and 2022). Standard deviations (SD1—hdom; SD2—hmax) and statistical tests and their significance are also presented.
hdom (m)SD1 (m)Statistical Test and p Value (hdom)hmax (m)SD2 (m)Statistical Test and p Value (hmax)
Field 2013Even-aged28.76.3Two-Sample t-test31.66.7Two-Sample t-test
Uneven-aged31.64.6p < 0.0535.85.6p < 0.01
LSS 2014Even-aged28.66.0Two-Sample t-test32.55.7Two-Sample t-test
Uneven-aged31.45.5p < 0.0535.86.4p < 0.05
CAS 2019Even-aged27.06.0Two-Sample t-test29.85.7Two-Sample t-test
Uneven-aged29.95.8p < 0.0533.16.4p < 0.05
Field 2023Even-aged30.25.3Two-Sample t-test33.05.1Two-Sample t-test
Uneven-aged32.24.5p < 0.0536.35.2p < 0.01
LSS 2023Even-aged29.05.4Two-Sample t-test32.85.4Two-Sample t-test
Uneven-aged32.06.2p < 0.0535.96.5p < 0.05
CAS 2022Even-aged26.16.3Wilcoxon rank sum test28.96.2Wilcoxon rank sum test
Uneven-aged28.87.3p < 0.0532.47.5p < 0.01
Table 2. Canopy height diversity derived from data canopy heights models using lidar data (2014 and 2023) and cyclic aerial surveys (2019 and 2022).
Mean SDStatistical Test and p Value
LSS 2014Even-aged CHD1.460.23Two-Sample t-test
Uneven-aged CHD1.660.26p < 0.001
CAS 2019Even-aged CHD1.160.32Two-Sample t-test
Uneven-aged CHD1.300.31p < 0.05
LSS 2023Even-aged CHD1.470.24Wilcoxon rank sum test
Uneven-aged CHD1.640.25p < 0.01
CAS 2022Even-aged CHD1.200.28Wilcoxon rank sum test
Uneven-aged CHD1.380.36p < 0.01
Table 3. Descriptive statistics of PAI(hdom) derived from field measurements, lidar data and aerial survey data for even-aged and uneven-aged stands.
PAIMean (m/year)Median (m/year)Min (m/year)Max (m/year)SD (m/year)Statistical Test and p Value
Even-aged PAI(hdom(field))0.160.11−0.860.980.34Wilcoxon rank sum test
Uneven-aged PAI(hdom(field))0.060.05−0.590.570.23p > 0.05
Even-aged PAI(hdom(LSS))0.040.14−1.640.530.45Wilcoxon rank sum test
Uneven-aged PAI(hdom(LSS))0.080.11−1.951.150.45p > 0.05
Even-aged PAI(hdom(CAS))−0.420.17−9.321.051.84Wilcoxon rank sum test
Uneven-aged PAI(hdom(CAS))−0.42−0.04−5.272.561.22p > 0.05
Disclaimer/Publisher’s Note: The statements, opinions and data contained in all publications are solely those of the individual author(s) and contributor(s) and not of MDPI and/or the editor(s). MDPI and/or the editor(s) disclaim responsibility for any injury to people or property resulting from any ideas, methods, instructions or products referred to in the content.

