
Sources of Genetic Variation in Faidherbia albida (Del.) A. Chev. Sub-Saharan African Populations

 , and
, and 
Abstract
1. Introduction
2. Materials and Methods
2.1. Plant Materials and Growth Conditions
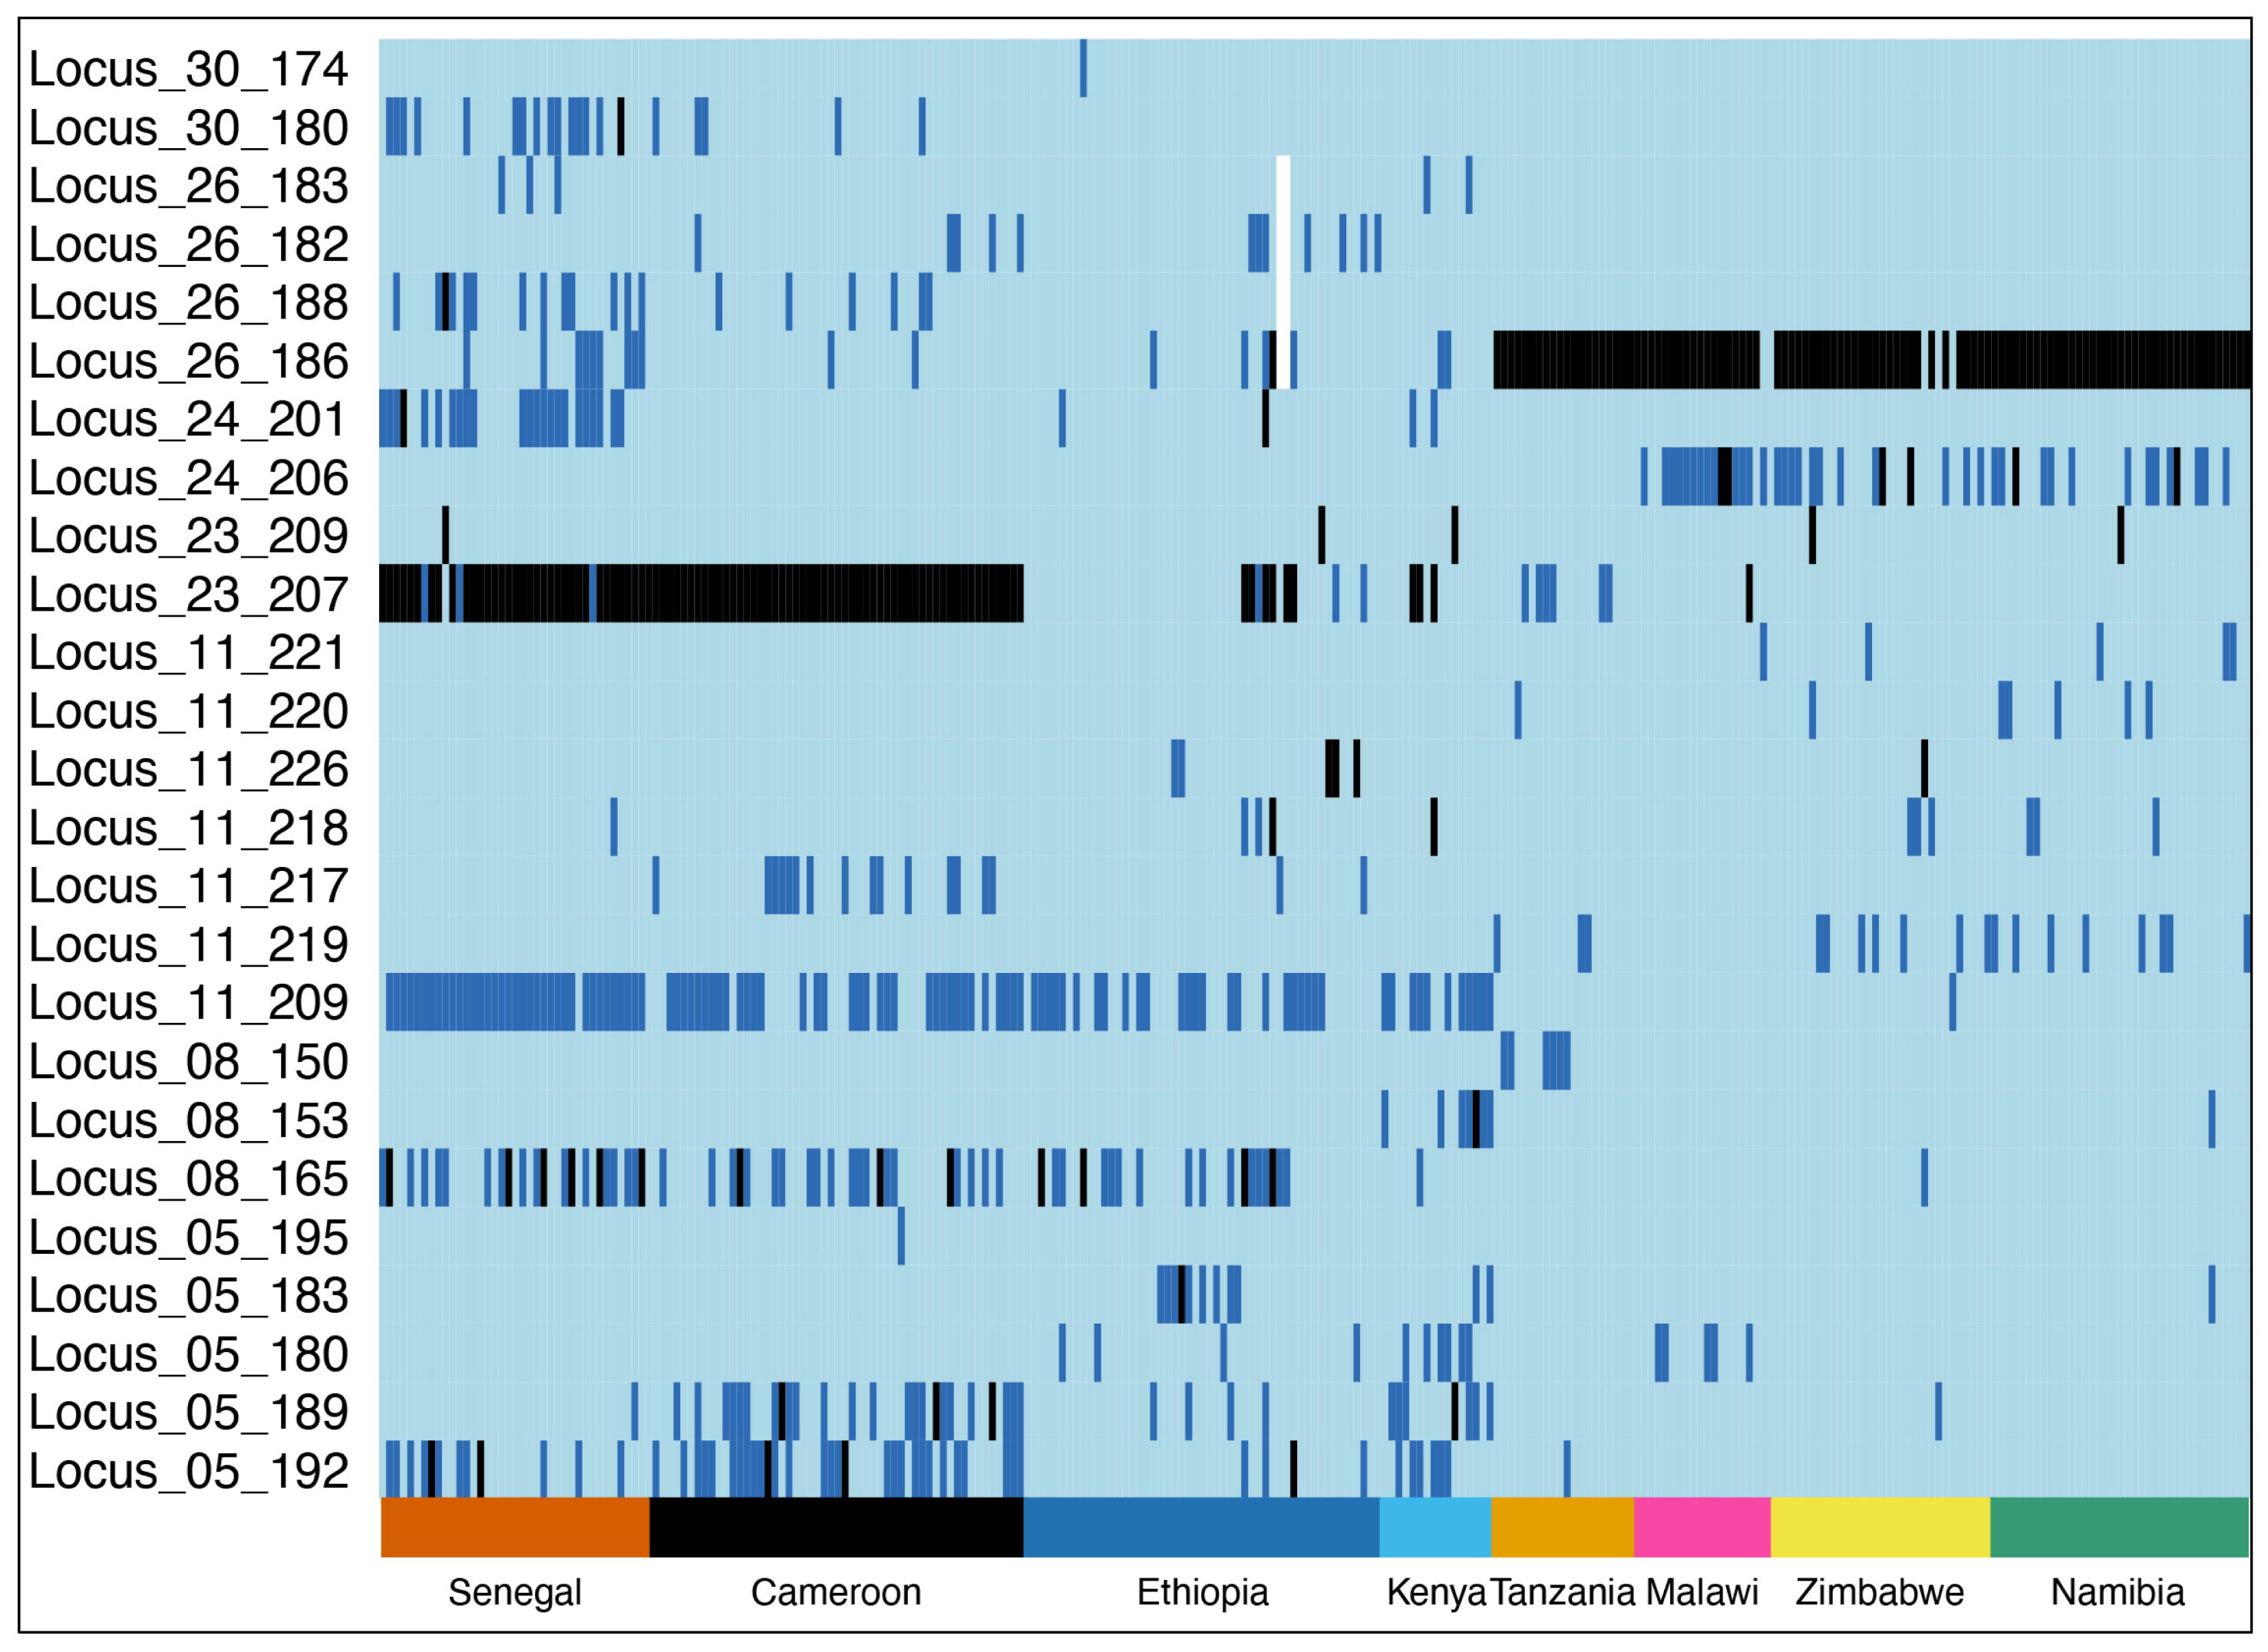
2.2. Genetic Analysis
2.3. Data Analysis
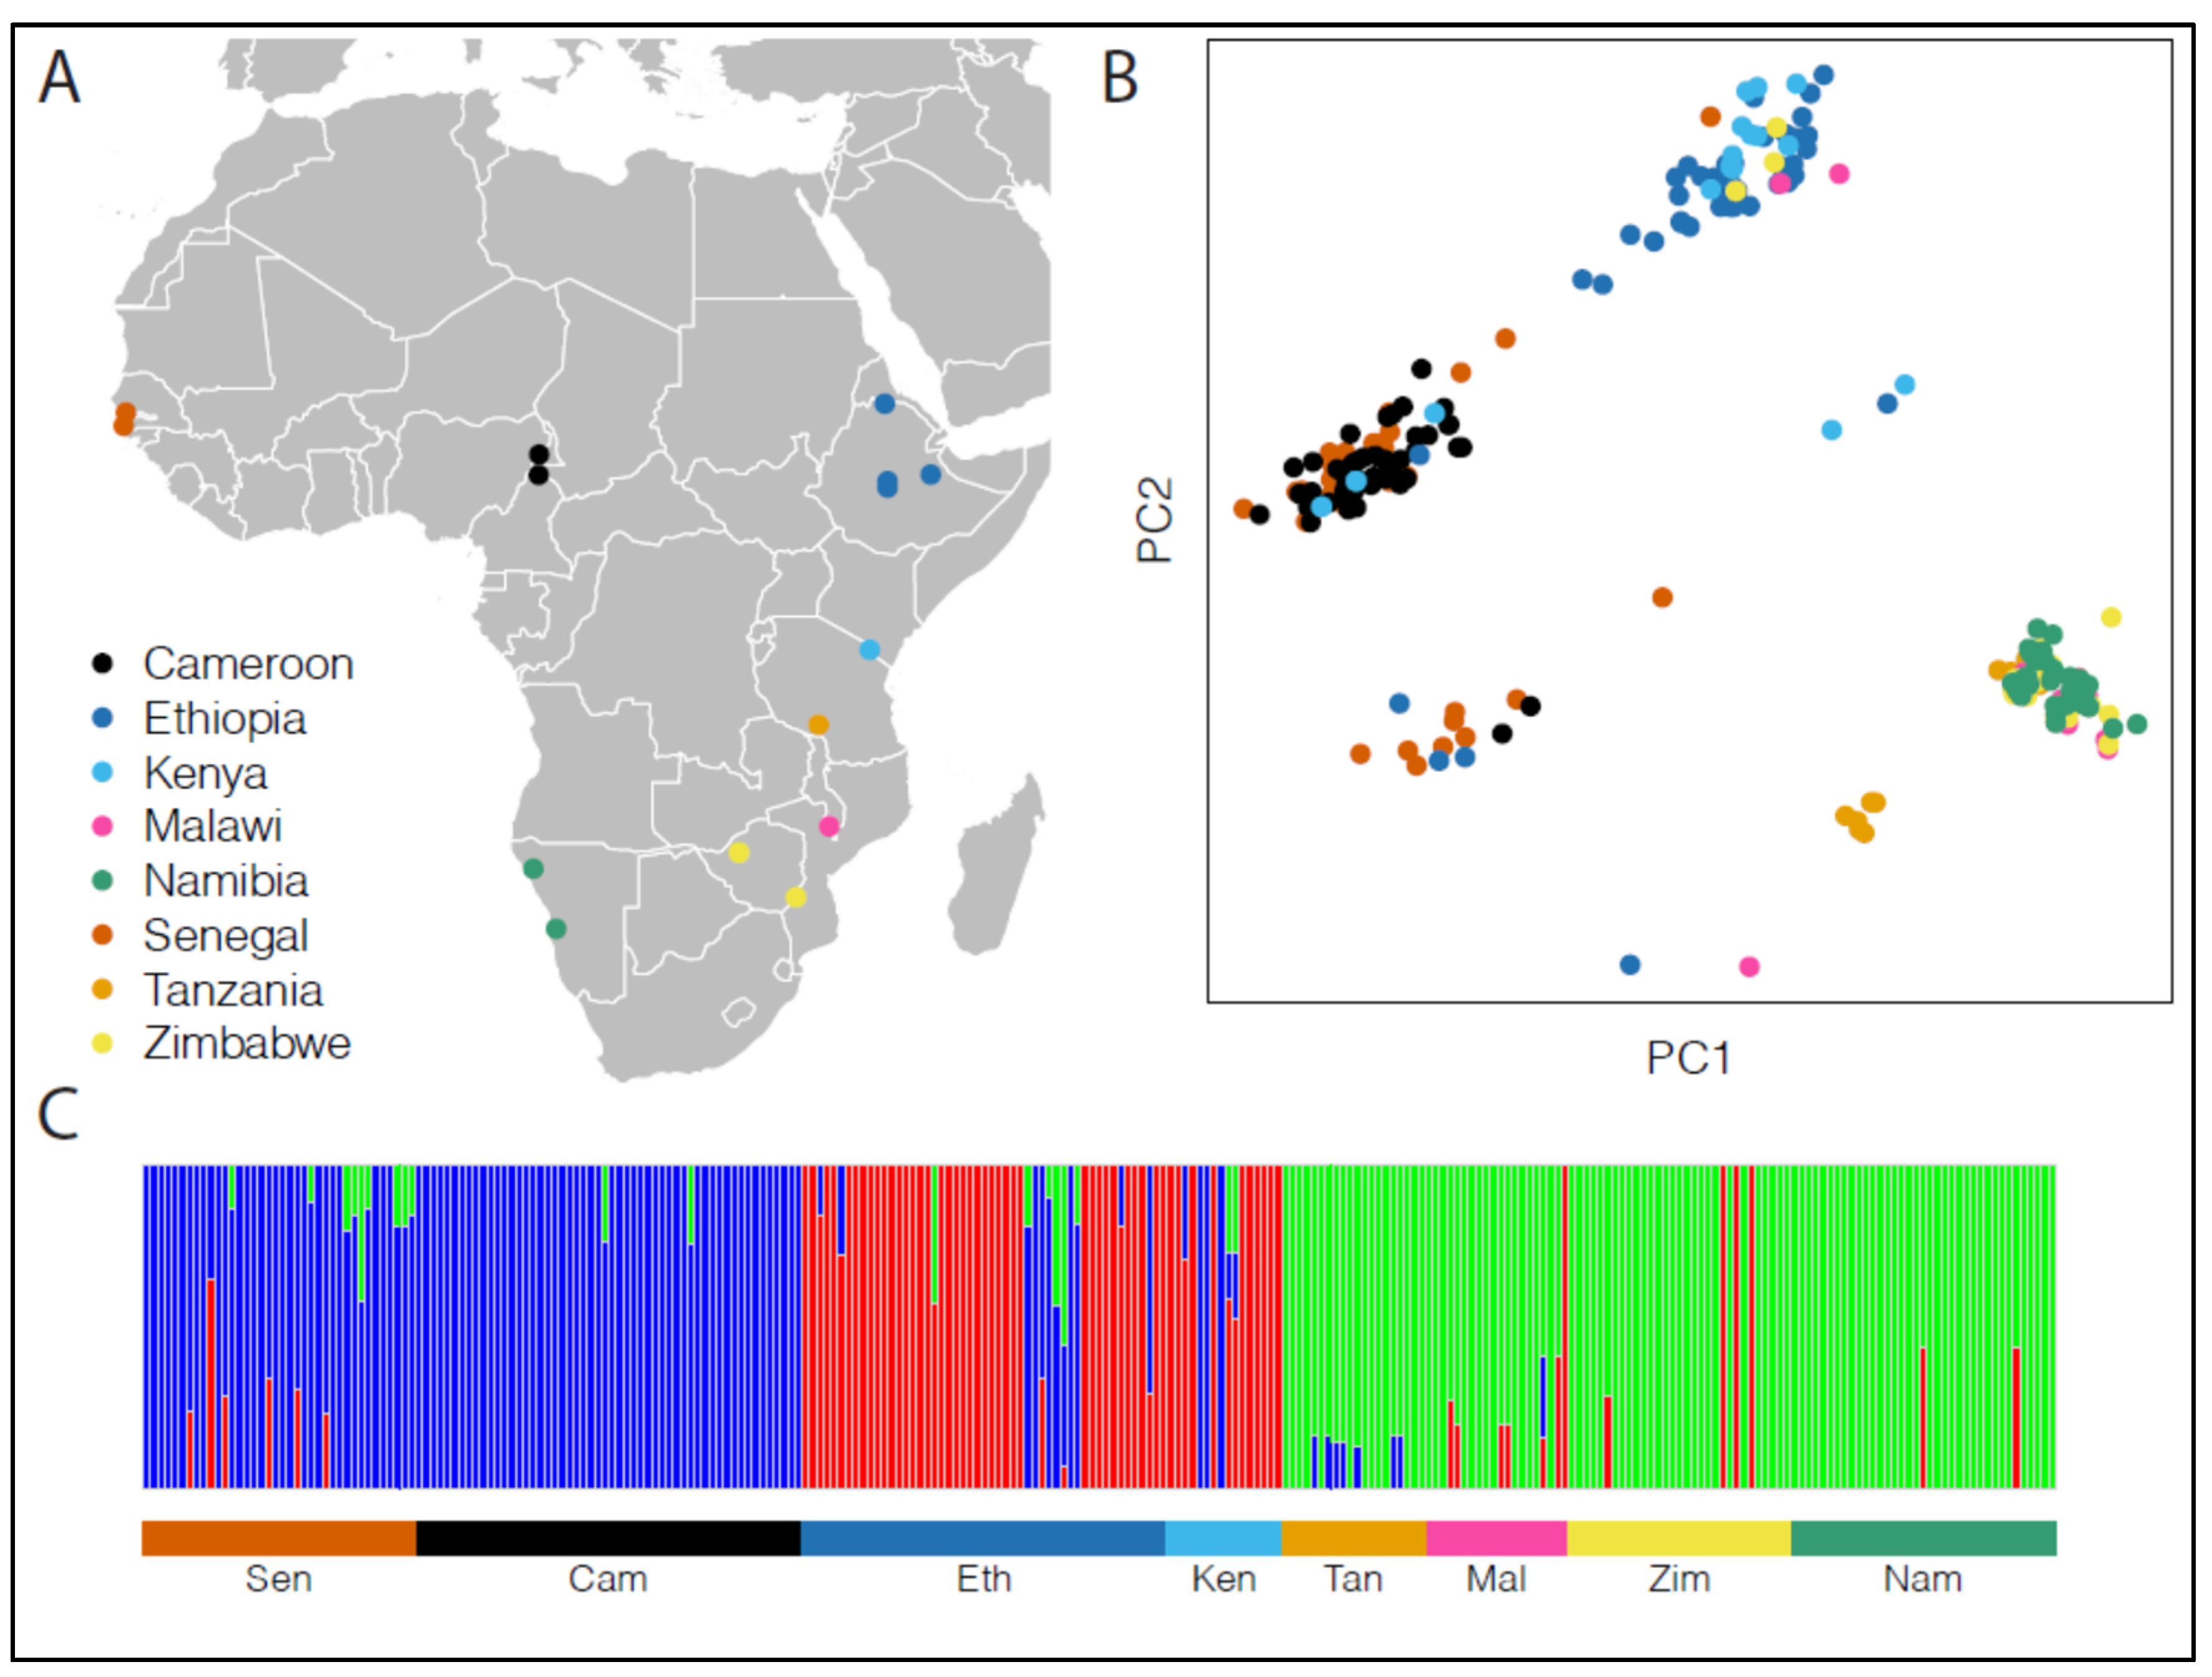
3. Results
3.1. Genetic Diversity of Populations
3.2. Population Structure
3.3. Nei’s Genetic Distance
4. Conclusions
Supplementary Materials
Author Contributions
Funding
Data Availability Statement
Acknowledgments
Conflicts of Interest
References
- Centre Technique Forestier Tropical. Faidherbia albida; A monograph; Wood, P.J., Translator; Oxford Forestry Institute: Oxford, UK, 1989; 66p. [Google Scholar]
- Barnes, R.D.; Fagg, C.W. Faidherbia albida Monograph and Annotated Bibliography; Tropical Forestry Papers 41; Oxford Forestry Institute: Oxford, UK, 2003; 288p. [Google Scholar]
- Roupsard, O.; Ferhi, A.; Granier, A.; Pallo, F.; Depommier, D.; Mallet, B.; Roupsard, E.D. Reverse phenology and dry-season water uptake by Faidherbia albida (Del.) A. Chev. in an agroforestry parkland of Sudanese west Africa. Funct. Ecol. 1999, 13, 460–472. [Google Scholar] [CrossRef]
- Getahun, H.F.; Mulugeta, L. Status of soil properties of scattered Faidherbia albida (Del.) in agricultural landscapes in central highlands of Ethiopia. Afr. Agric. Res. 2014, 9, 3379–3387. [Google Scholar]
- Saka, A.R.; Bunderson, W.T.; Mbekeani, Y.; Itimu, O.A. Planning and Implementing Agroforestry for Small-Holder Farmers in Malawi: Planning for Agroforestry; Budd, W.D., Ed.; Elsevier Science Publishers: Amsterdam, The Netherlands, 1990. [Google Scholar]
- Poschen, P. An evaluation of the Acacia albida-based agroforestry practices in the Hararghe highlands of eastern Ethiopia. Agrofor. Syst. 1986, 4, 129–143. [Google Scholar] [CrossRef]
- Van Noordwijk, M.; Lusiana, B.; Khasanah, N.; Mulia, R. WaNuLCAS Version 2.0: Background on a Model of Water, Nutrient and Light Capture in Agroforesty Systems; ICRAF: Nairobi, Kenya, 2000. [Google Scholar]
- Atchison, E. Studies in the Leguminosae. I. Cytogeography of Acacia (Tourne.) L. Amer. J. Bot. 1948, 35, 651–655. [Google Scholar] [CrossRef]
- Gassam-Dia, Y.F.; Sane, D.; N’Doye, M. Reproductive biology of Faidherbia albida (Del.) A. Chev. Silva Fenn. 2003, 37, 429–436. [Google Scholar] [CrossRef]
- Bozzano, M.; Jalonen, R.; Thomas, E.; Boshier, D.; Gallo, L.; Cavers, S.; Bordács, S.; Smith, P.; Loo, J. (Eds.) Genetic Considerations in Ecosystem Restoration Using Native Tree Species. State of the World’s Forest Genetic Resources—Thematic Study; FAO: Québec City, Canada; Biodiversity International: Rome, Italy, 2014. [Google Scholar]
- Montagnini, F.; Finney, C. (Eds.) Restoring Degraded Landscapes with Native Species in Latin America; Nova Science Publishers: Hauppauge, NY, USA, 2011. [Google Scholar]
- Newton, A.C.; Tejedor, N. (Eds.) Principles and Practice of Forest Landscape Restoration: Case Studies from the Drylands of Latin America; IUCN: Gland, Switzerland, 2011; 353p. [Google Scholar]
- Lamb, D. Forest restoration—The third big silvicultural challenge. J. Trop. For. Sci. 2012, 24, 295–299. [Google Scholar]
- Miccolis, A.; Peneireiro, F.M.; Marques, H.R.; Vieira, D.L.M.; Arcoverde, M.F.; Hoffmann, M.R.; Rehder, T.; Pereira, A.V.B. Agroforestry Systems for Ecological Restoration: How to reconcile conservation and production. In Options for Brazil’s Cerrado and Caatinga Biomes; Instituto Sociedade, População e Natureza—ISPN: Brasília, Brazil; World Agroforestry Centre—ICRAF: Nairobi, Kenya, 2016; 240p. [Google Scholar]
- Rogers, D.L.; Montalvo, A.M. Genetically Appropriate Choices for Plant Materials to Maintain Biological Diversity; Report to the USDA Forest Service, Rocky Mountain Region, Lakewood, CO, USA; University of California: Oakland, CA, USA, 2004; Available online: https://www.researchgate.net/profile/Arlee-Montalvo/publication/228494807_Genetically_appropriate_choices_for_plant_materials_to_maintain_biological_diversity/links/553921460cf247b858809120/Genetically-appropriate-choices-for-plant-materials-to-maintain-biological-diversity.pdf (accessed on 22 November 2024).
- Ibrahim, A.M. Conservation and utilisation of Faidherbia albida (Del.) A. Chev. (syn. Acacia albida) gene resources. In Tree Improvement for Sustainable Tropical Forestry. QRFI-IUFRO Conference, Caloundra, Queensland, Australia, 27 October–1 November 1996; Dieter, M.J., Matheson, A.C., Nikles, D.G., Hanvood, C.E., Walker, S.M., Eds.; Queensland Forestry Research Institute: Gympie, Australia, 1996. [Google Scholar]
- Dangasuk, O.G.; Seurei, P.; Gudu, S. Genetic variation in seed and seedling traits in 12 African provenances of Faidherbia albida (Del.) A. Chev. at Lodwar, Kenya. Agrofor. Syst. 1997, 37, 133–141. [Google Scholar] [CrossRef]
- Tagne, T.B.A.; Tchatchoua, D.T.; Caspa, R.G.; Poethig, S.; Carlson, J.E.; Zhebentyayeva, T. Adaptation of Sub Saharan African Faidherbia albida (Del.) A. Chev. provenances in the Sudano-Sahelian climatic condition of Cameroon. J. Anim. Plant Sci. 2021, 49, 8903–8919. [Google Scholar]
- Montagne, P. Faidherbia albida: Son Dévelopment au Niger; Unpublished report; Association Bois de Feu: Paris, France, 1984; 90p. [Google Scholar]
- Cazet, M. La Regeneration Artificielle de Faidherbia albida en Zone Sahelienne: Plantation ou Sernis Direct? Premiers résultats de l’expérimentation conduite á Thienaba (Senegal) au 1986; Unpublished report; Institut Senegalais de Recherches Agricoles, Ministere du Developpement Rural: Dakar, Senegal, 1987. [Google Scholar]
- Peltier, R.; Eyog-Matig, O. Les essais d’agroforesterie au Nord-Cameroun. Bois For. Des Trop. 1988, 217, 3–31. [Google Scholar]
- Sniezko, R.A.; Stewart, H.T.L. Range-wide provenance variation in growth and nutrition of Acacia albida seedlings propagated in Zimbabwe. For. Ecol. Manag. 1989, 27, 179–197. [Google Scholar] [CrossRef]
- Torrekens, P.; Lemane, I.; Gambo, S. Trial of nine Acacia albida provenances in Dosso, Niger. In Faidherbia albida in the West African Semi-Arid Tropics: Proceedings of a Workshop, Niamey, Niger, 22–26 April 1991; Vandenbeldt, R.J., Ed.; International Crops Research Institute for the Semi-Arid Tropics: Patancheru, India; International Centre for Research in Agroforestry: Nairobi, Kenya, 1992; pp. 77–78. [Google Scholar]
- Vandenbeldt, R.J. Rooting systems of western and southern African Faidherbia albida (Del.) A. Chev. (syn. Acacia albida Del.)—A comparative analysis with biogeographic implications. Agrofor. Syst. 1991, 14, 233–244. [Google Scholar] [CrossRef]
- Harmand, J.M.; Njiti, C.F. Faidherbia albida in northern Cameroon: Provenance trials and crop associations. In Faidherbia albida in the West African Semi-Arid Tropics: Proceedings of a Workshop, Niamey, Niger, 22–26 April 1991; Vandenbeldt, R.J., Ed.; International Crops Research Institute for the Semi-Arid Tropics: Patancheru, India; International Centre for Research in Agroforestry: Nairobi, Kenya, 1992; pp. 79–81. [Google Scholar]
- Zeh-Nlo, M.; Joly, H. First observations on the phenology of Acacia albida: Study of a population in northern Cameroon. In Faidherbia Albida in the West African Semi-Arid Tropics: Proceedings of a Workshop, Niamey, Niger, 22–26 April 1991; Vandenbeldt, R.J., Ed.; International Crops Research Institute for the Semi-Arid Tropics: Patancheru, India; International Centre for Research in Agroforestry: Nairobi, Kenya, 1992; pp. 63–66. [Google Scholar]
- Joly, H.I.; Zeh Nlo, M.; Danthu, P.; Aygalent, C. Population Genetics of an African Acacia, Acacia albida. Genetic Diversity of Populations from West Africa. Aust. J. Bot. 1992, 40, 59–73. [Google Scholar] [CrossRef]
- Harris, S.A.; Fagg, C.W.; Barnes, R.D. Isozyme variation in Faidherbia albida (Leguminosae, Mimosoideae). Plant Syst. Evol. 1997, 207, 119–132. [Google Scholar] [CrossRef]
- Dangasuk, O.G.; Gudu, S. Allozyme variation in 16 natural populations of Faidherbia albida (Del.) A. Chev. Hereditas 2000, 133, 133–145. [Google Scholar] [CrossRef]
- Dangasuk, O.G.; Gudu, S.; Aman, R.A.; Brandl, T. Isozyme variation and growth performance in 16 provenances of African Faidherbia albida (Del.) A. Chev. in Kenya. Discov. Innov. 2002, 19, 108–116. [Google Scholar]
- Dangasuk, O.G.; Odago, P.O.; Were, B.A.; Gudu, S. Analysis of Geographic Variation among Sixteen African Provenances of Faidherbia albida using PCR Based ITS and RAPD Techniques. Discov. Innov. 2007, 19, 108–116. [Google Scholar]
- Kithure, R.K.; Muchugi, A.; Jamnadass, R.; Njoka, F.M.; Mwaura, L. Genetic diversity of Faidherbia albida (Del.) A. Chev accessions held at the World Agroforestry Centre. For. Trees Livelihoods 2015, 24, 219–230. [Google Scholar] [CrossRef]
- Powell, W.; Morgante, M.; Andre, C.; Hanafey, M.; Vogel, J.; Tingey, S.; Rafalski, A. The comparison of RFLP, RAPD, AFLP and SSR (microsatellite) markers for germplasm analysis. Mol. Breed. 1996, 2, 225–238. [Google Scholar] [CrossRef]
- Russel, R.J.; Hedley, E.P.; Cardle, L.; Dancey, S.; Morris, J.; Booth, A.; Ode, D.; Mwaura, J.; Muchugi, A.; Milne, L.; et al. TropiTree: An NGS—Based EST—SSR Resource for 24 Tropical Tree species. PLoS ONE 2014, 9, e102502. [Google Scholar] [CrossRef]
- Tchatchoua, D.T.; Carlson, J.E.; Zembower, N.; Poethig, S.; Hamadou, O. Molecular markers analysis of Faidherbia albida (Del.) A. Chev. populations from Sub Saharan Africa. In Proceedings of the Plant and Animal Genomic Conference, San Diego, CA, USA, 12–16 January 2019. [Google Scholar]
- Tchatchoua, T.D.; Poethig, R.S.; Doody, E.; Weathers, T.C.; Swartz, K.; Mathieson, I.; Zembower, N.; Zhebentyayeva, T.; Carlson, J.E. Genetic diversity of Faidherbia albida populations in the Sudano Sahelian region of Cameroon, using simple sequence repeat (SSR) markers. Afr. J. Biotech. 2020, 19, 415–425. [Google Scholar]
- Fagg, C.W. Germplasm collection of Faidherbia albida in eastern and southern Africa. In Faidherbia Albida in the West African Semi-Arid Tropics: Proceedings of a Workshop, Niamey, Niger, 22–26 April 1991; Vandenbeldt, R.J., Ed.; International Crops Research Institute for the Semi-Arid Tropics: Patancheru, India; International Centre for Research in Agroforestry: Nairobi, Kenya, 1992; pp. 19–24. [Google Scholar]
- Peakall, R.; Smouse, P.E. Genalex 6.5: Genetic analysis in Excel. Population genetic software for teaching and research-an update. Bioinformatics 2012, 28, 2537–2539. [Google Scholar] [CrossRef]
- Alexander, D.H.; Novembre, J.; Lange, K. Fast model-based estimation of ancestry in unrelated individuals. Genome Res. 2009, 19, 1655–1664. [Google Scholar] [CrossRef]
- Sterck, L.; Billiau, K.; Abeel, T.; Rouzé, P.; Van de Peer, Y. ORCAE: Online Resource for Community Annotation of Eukaryotes. Nat. Methods 2012, 9, 1041. [Google Scholar] [CrossRef] [PubMed]
- Yssel, K.; Van de Peer, Y.; Sterck, I. ORCAE-AOCC: A Centralized Portal for the Annotation of African Orphan Crop Genomes. Genes 2019, 10, 950. [Google Scholar] [CrossRef] [PubMed]


| Locus_5 | Locus_8 | Locus_11 | Locus_23 | Locus_24 | Locus_26 | Locus_30 | |||||||
|---|---|---|---|---|---|---|---|---|---|---|---|---|---|
| Allele (bp) | Freq. | Allele | Freq. | Allele | Freq. | Allele | Freq. | Allele | Freq. | Allele | Freq. | Allele | Freq. |
| 180 | 0.028 | 150 | 0.011 | 209 | 0.198 | 207 | 0.389 | 201 | 0.055 | 182 | 0.023 | 174 | 0.002 |
| 183 | 0.024 | 153 | 0.017 | 217 | 0.032 | 209 | 0.019 | 202 | 0.855 | 183 | 0.009 | 177 | 0.959 |
| 186 | 0.762 | 165 | 0.141 | 218 | 0.025 | 210 | 0.430 | 206 | 0.090 | 184 | 0.504 | 180 | 0.039 |
| 189 | 0.077 | 168 | 0.83 | 219 | 0.030 | 186 | 0.426 | ||||||
| 192 | 0.107 | 220 | 0.013 | 188 | 0.038 | ||||||||
| 195 | 0.002 | 221 | 0.009 | ||||||||||
| 226 | 0.019 | ||||||||||||
| 227 | 0.672 | ||||||||||||
| Population (# Samples) | Na | Ne | I | Ho | He |
|---|---|---|---|---|---|
| Senegal (38) | 2.857 | 1.700 | 0.629 | 0.466 | 0.387 |
| Cameroon (54) | 2.429 | 1.594 | 0.469 | 0.307 | 0.270 |
| Ethiopia (51) | 3.143 | 1.450 | 0.510 | 0.227 | 0.267 |
| Kenya (16) | 2.857 | 1.884 | 0.636 | 0.330 | 0.350 |
| Tanzania (20) | 1.714 | 1.137 | 0.192 | 0.129 | 0.106 |
| Malawi (20) | 1.714 | 1.230 | 0.243 | 0.143 | 0.147 |
| Zimbabwe (31) | 2.571 | 1.231 | 0.299 | 0.147 | 0.154 |
| Namibia (37) | 2.143 | 1.196 | 0.242 | 0.151 | 0.125 |
| Senegal | Cameroon | Ethiopia | Kenya | Tanzania | Malawi | Zimbabwe | Namibia | |
|---|---|---|---|---|---|---|---|---|
| Senegal | 0.000 | |||||||
| Cameroon | 0.063 | 0.000 | ||||||
| Ethiopia | 0.208 | 0.183 | 0.000 | |||||
| Kenya | 0.256 | 0.171 | 0.044 | 0.000 | ||||
| Tanzania | 0.383 | 0.418 | 0.180 | 0.254 | 0.000 | |||
| Malawi | 0.440 | 0.488 | 0.193 | 0.258 | 0.041 | 0.000 | ||
| Zimbabwe | 0.424 | 0.471 | 0.161 | 0.239 | 0.021 | 0.014 | 0.000 | |
| Namibia | 0.456 | 0.511 | 0.192 | 0.272 | 0.018 | 0.017 | 0.002 | 0.000 |
Disclaimer/Publisher’s Note: The statements, opinions and data contained in all publications are solely those of the individual author(s) and contributor(s) and not of MDPI and/or the editor(s). MDPI and/or the editor(s) disclaim responsibility for any injury to people or property resulting from any ideas, methods, instructions or products referred to in the content. |
© 2025 by the authors. Licensee MDPI, Basel, Switzerland. This article is an open access article distributed under the terms and conditions of the Creative Commons Attribution (CC BY) license (https://creativecommons.org/licenses/by/4.0/).
Share and Cite
Tchatchoua, T.D.; Mathieson, I.; Zhebentyayeva, T.; Poethig, R.S.; Carlson, J.E. Sources of Genetic Variation in Faidherbia albida (Del.) A. Chev. Sub-Saharan African Populations. Forests 2025, 16, 113. https://doi.org/10.3390/f16010113
Tchatchoua TD, Mathieson I, Zhebentyayeva T, Poethig RS, Carlson JE. Sources of Genetic Variation in Faidherbia albida (Del.) A. Chev. Sub-Saharan African Populations. Forests. 2025; 16(1):113. https://doi.org/10.3390/f16010113
Chicago/Turabian StyleTchatchoua, Tchapda Dorothy, Iain Mathieson, Tetyana Zhebentyayeva, R. Scott Poethig, and John E. Carlson. 2025. "Sources of Genetic Variation in Faidherbia albida (Del.) A. Chev. Sub-Saharan African Populations" Forests 16, no. 1: 113. https://doi.org/10.3390/f16010113
APA StyleTchatchoua, T. D., Mathieson, I., Zhebentyayeva, T., Poethig, R. S., & Carlson, J. E. (2025). Sources of Genetic Variation in Faidherbia albida (Del.) A. Chev. Sub-Saharan African Populations. Forests, 16(1), 113. https://doi.org/10.3390/f16010113