Article

Comparison and Evaluation the Forest Spatial Data in the Context of Modeling Terrain Passability for Operational Purposes

by
Krzysztof Pokonieczny
* and
Wojciech Dawid
Institute of Geospatial Engineering and Geodesy, Faculty of Civil Engineering and Geodesy, Military University of Technology, 00-908 Warszawa, Poland
*
Author to whom correspondence should be addressed.
Forests 2025, 16(1), 112; https://doi.org/10.3390/f16010112
Submission received: 24 November 2024 / Revised: 20 December 2024 / Accepted: 3 January 2025 / Published: 9 January 2025
(This article belongs to the Special Issue Modeling of Vehicle Mobility in Forests and Rugged Terrain)

Abstract

:
This article addresses a significant aspect of evaluating and comparing spatial forest data from various databases developed and maintained in Poland and globally. The study focused on the application of these data to create terrain passability maps, which are useful in planning military and crisis operations. The research was conducted in a test area near Warsaw, encompassing the Kampinos Forest. In the study, the “forest” layers from the tested databases were compared. Their spatial extents were analyzed, and terrain passability maps were generated in different configurations, which were comprehensively compared with one another. The results indicated that the quality and detail of forest data are not critical for generating passability maps. Only in the case of creating highly detailed maps does the use of precise data prove justified. As the level of detail in the maps decreases, they become increasingly similar, reducing the influence of the forest data on their accuracy and operational applicability. The study enabled the selection of the most accurate data sources on forested areas—those that most faithfully represent the structure of forested regions in Poland.

1. Introduction

The study of vehicle mobility outside the regular road network is a crucial aspect of military operation planning. Although modern vehicles are primarily designed for high-speed travel on paved roads, situations arise where vehicles must move off-road (i.e., across unpaved terrain (commonly referred to as cross country movement—CCM [1]). Such scenarios typically occur during military operations or while conducting activities related to broad crisis management efforts. This necessity often stems from the need to execute a maneuver that surprises the opponent or reach a location situated at a certain distance from established roads. To effectively plan such actions, precise information about all relevant aspects of the geographical environment in which operations will take place is essential. This includes the use of topographic maps and specialized products known as terrain passability maps. These maps synthesize geospatial data, classifying terrain based on its suitability for the movement of various types of vehicles. The criteria for creating such maps are defined, among other sources, in military standardization documents [2]. Vegetation, particularly forests, is given special consideration in these analyses due to its significant impact on passability. According to military standardization documents, forests play a critical role in determining terrain passability. These documents [3] classify forest areas where trees have a diameter greater than 0.15 m and are spaced less than 5 m apart as impassable terrain (NO-GO), meaning terrain that severely restricts military movement in all directions. Conversely, forests composed of trees with diameters ranging from 0.05 m to 0.15 m are classified as difficult to pass (SLOW-GO). Considering that the vast majority of dense forest areas in Poland meet the criteria for NO-GO terrain, and given that nearly 30% of Poland’s land area is forested, it can be estimated that approximately one-quarter of Poland’s surface constitutes impassable terrain. This makes these areas inaccessible for military vehicles, effectively rendering them strategically challenging from a military perspective. Given this, it is evident that accurately representing the forest coverage is of paramount importance for planning military operations and crisis management activities. The subject matter addressed in this study is therefore highly significant and represents a novel contribution to research on forests in the context of their importance as a factor in national defense.

1.1. Related Papers

The issue of terrain passability is currently an area of interest for many researchers and associated institutions. They address various aspects of modeling passability. Given the time-consuming nature of creating such maps, scientists are exploring ways to automate the map generation process. Many studies have focused on the impact of vegetation on vehicle mobility, which aligns with the topic of this article [4,5,6]. These works often involve direct measurements conducted in forested areas, showcasing the varying capabilities of military vehicles to navigate such terrains. A particularly important study on acquiring forest information using laser scanning techniques is presented in [7]. The passability of terrain is also a key area of focus for designers and developers of UGVs (unmanned ground vehicles), who are conducting research on these vehicles’ ability to navigate and identify the optimal paths to designated locations [8,9,10,11]. Research related to creating detailed passability maps using high-resolution spatial data was included in [12] while the application of diverse spatial datasets for generating terrain passability maps was explored in [13]. This study conducted comprehensive research on leveraging the full range of spatial data (not limited to forests) to generate passability maps. Additional studies on the use of diverse datasets for terrain passability modeling can be found in [14], which presented a model for passability in forested areas. The algorithm for applying a custom mathematical model to determine a terrain passability coefficient was discussed in [15]. Meanwhile, methods for generating passability maps using artificial neural networks were covered in [16] while a novel approach to creating passability maps was detailed in [17]. The authors presented an algorithm for calculating a passability coefficient for square base units with side lengths of 10 and 25 m. This coefficient was determined by analyzing the surface morphology and land cover features. A very interesting approach to generating detailed passability maps, designed for individual vehicles or small groups of similar vehicles, and utilizing them for planning purposes was presented in [18]. Finally, studies incorporating soil and weather parameters into passability analysis were presented in [19,20,21]. Reference [22] further illustrated the influence of weather on passability, presenting research on vehicle operations in snow-covered terrains. These studies collectively emphasize the complexity and significance of terrain and environmental factors in mobility modeling.
The NATO Reference Mobility Model (NRMM) is a significant project focused on cross country movement modeling. Originally developed and validated during the 1960s and 1970s by the U.S. Army’s Tank Automotive Research, Development, and Engineering Center (TARDEC) and the Engineer Research and Development Center (ERDC), the NRMM has undergone numerous revisions, with its latest version being v2.8.2b. This model is used to simulate the mobility of various military vehicles, incorporating detailed planning elements such as scenarios, terrain, and vehicle data [23]. Further details on the Next-Generation NRMM are provided in the final report [24]. Numerous studies have explored military terrain passability in relation to the NRMM. For example, Ref. [25] proposed a stochastic framework for predicting vehicle mobility over extensive areas, addressing uncertainties in terrain elevation derived from the high-resolution sampling of digital elevation models. Verification of earlier versions of the NRMM was detailed in [26], while [27] compared the NRMM’s performance with other models in evaluating the ability of military vehicles to traverse soft soils.
The problem of modeling the passability of exclusively forested areas has also received the attention of the authors of many publications. In [28], the authors looked at the accuracy of the position of individual tree trunks in the context of their impact on UGV passability, while in [29], attempts were made to find the relationship between the results of the analysis of forest passability and the quality of the input data. The most important layers and attributes affecting forest passability analysis were identified. The article also included a survey of available forest data in the Czech Republic and NATO. An extremely interesting paper was [30], in which the authors analyzed data on post-individual trees acquired using photogrammetric and remote sensing techniques. One article addressed the issue of vehicle movement between trees [6], while a comprehensive assessment of the feasibility of using non-contact data collection methods—in particular, unmanned aerial vehicles (UAVs) and terrestrial laser scanning technologies—for assessing the congestion of forest stands was presented in [31]. A similar issue was described in [32], in which the authors analyzed the routes determined by an algorithm guiding them between tree trunks. As can be seen, the above-mentioned works focused on a detailed approach to the description of forests as an obstacle to be overcome by vehicles, which distinguishes them from the issues addressed in this article.
The quality of spatial data, encompassing attributes such as accuracy, completeness, consistency, and timeliness, is a topic of interest not only to geographic information systems (GIS) specialists, but also to researchers across various disciplines who increasingly incorporate spatial data into their work. Recognizing this, numerous articles have been dedicated to the assessment of geodata quality, with a significant focus on OpenStreetMap (OSM), the world’s largest open data repository. For instance, in [33], researchers evaluated the quality of OSM data by comparing it to proprietary datasets and data from government mapping agencies. This study provides an overview of OSM data quality assessments and explores future directions for its improvement. Similarly, Ref. [34] examined the quality of OSM data in comparison with official datasets, using selected counties in Poland as case studies. This paper also contrasted the data quality with socio-economic indicators in the analyzed regions. The broader issue of geospatial data quality, along with the history of research on volunteered geographic information (VGI), was explored in [35]. This work outlined three approaches to quality assurance, discussing their respective strengths and limitations. Meanwhile, Ref. [36] investigated the characteristics of digital geographic data and their influence on the quality of databases used in decision-making processes and examined these characteristics primarily from the perspective of technical parameters and the performance of technological indicators during data acquisition. A notable article, Ref. [37], introduced the concept of “OSM science”, presenting a framework for scientific research on OSM as a cohesive discipline rather than as a collection of individual studies. This work provided a conceptual basis for advancing unified research on OSM. Finally, a comprehensive and classic resource addressing the accuracy of spatial databases can be found in [38], which remains a foundational reference in the field.
Forests are a very important element of land cover and are included in practically every spatial database. There are also studies dedicated to forests. In the territory of Poland, such a database is the Forest Data Bank (BDL [39]). However, it contains data only on state forests, so its use in this work (due to a lack of sufficient completeness) was impossible.

1.2. Research Purpose

The primary objective of this study was to determine the extent to which the use of different spatial data sources on forests affects the resulting terrain passability maps. This paper considered passability at the operational level, in which the accessibility of a terrain is determined from a general (overall) perspective. This aspect is particularly significant given that variations in how forests are represented across different cartographic sources can lead to differing decisions regarding the execution of maneuvers during military operation planning or crisis response. The value of this study is further enhanced by its broader perspective: while focusing on the “forest” layer, it treats it as just one of many factors considered in the process of creating terrain passability maps. This approach allowed us to address another critical question: What is the actual significance of forests in terrain passability modeling? Are they a decisive factor that fundamentally influences the results of passability analysis? The study also examined the accuracy of the generated passability maps and the impact of incorporating different forest data sources on the automated generation of passability maps at varying levels of detail. Due to the test area being analyzed, the paper used data available in the territory of Poland.

2. Materials and Methods
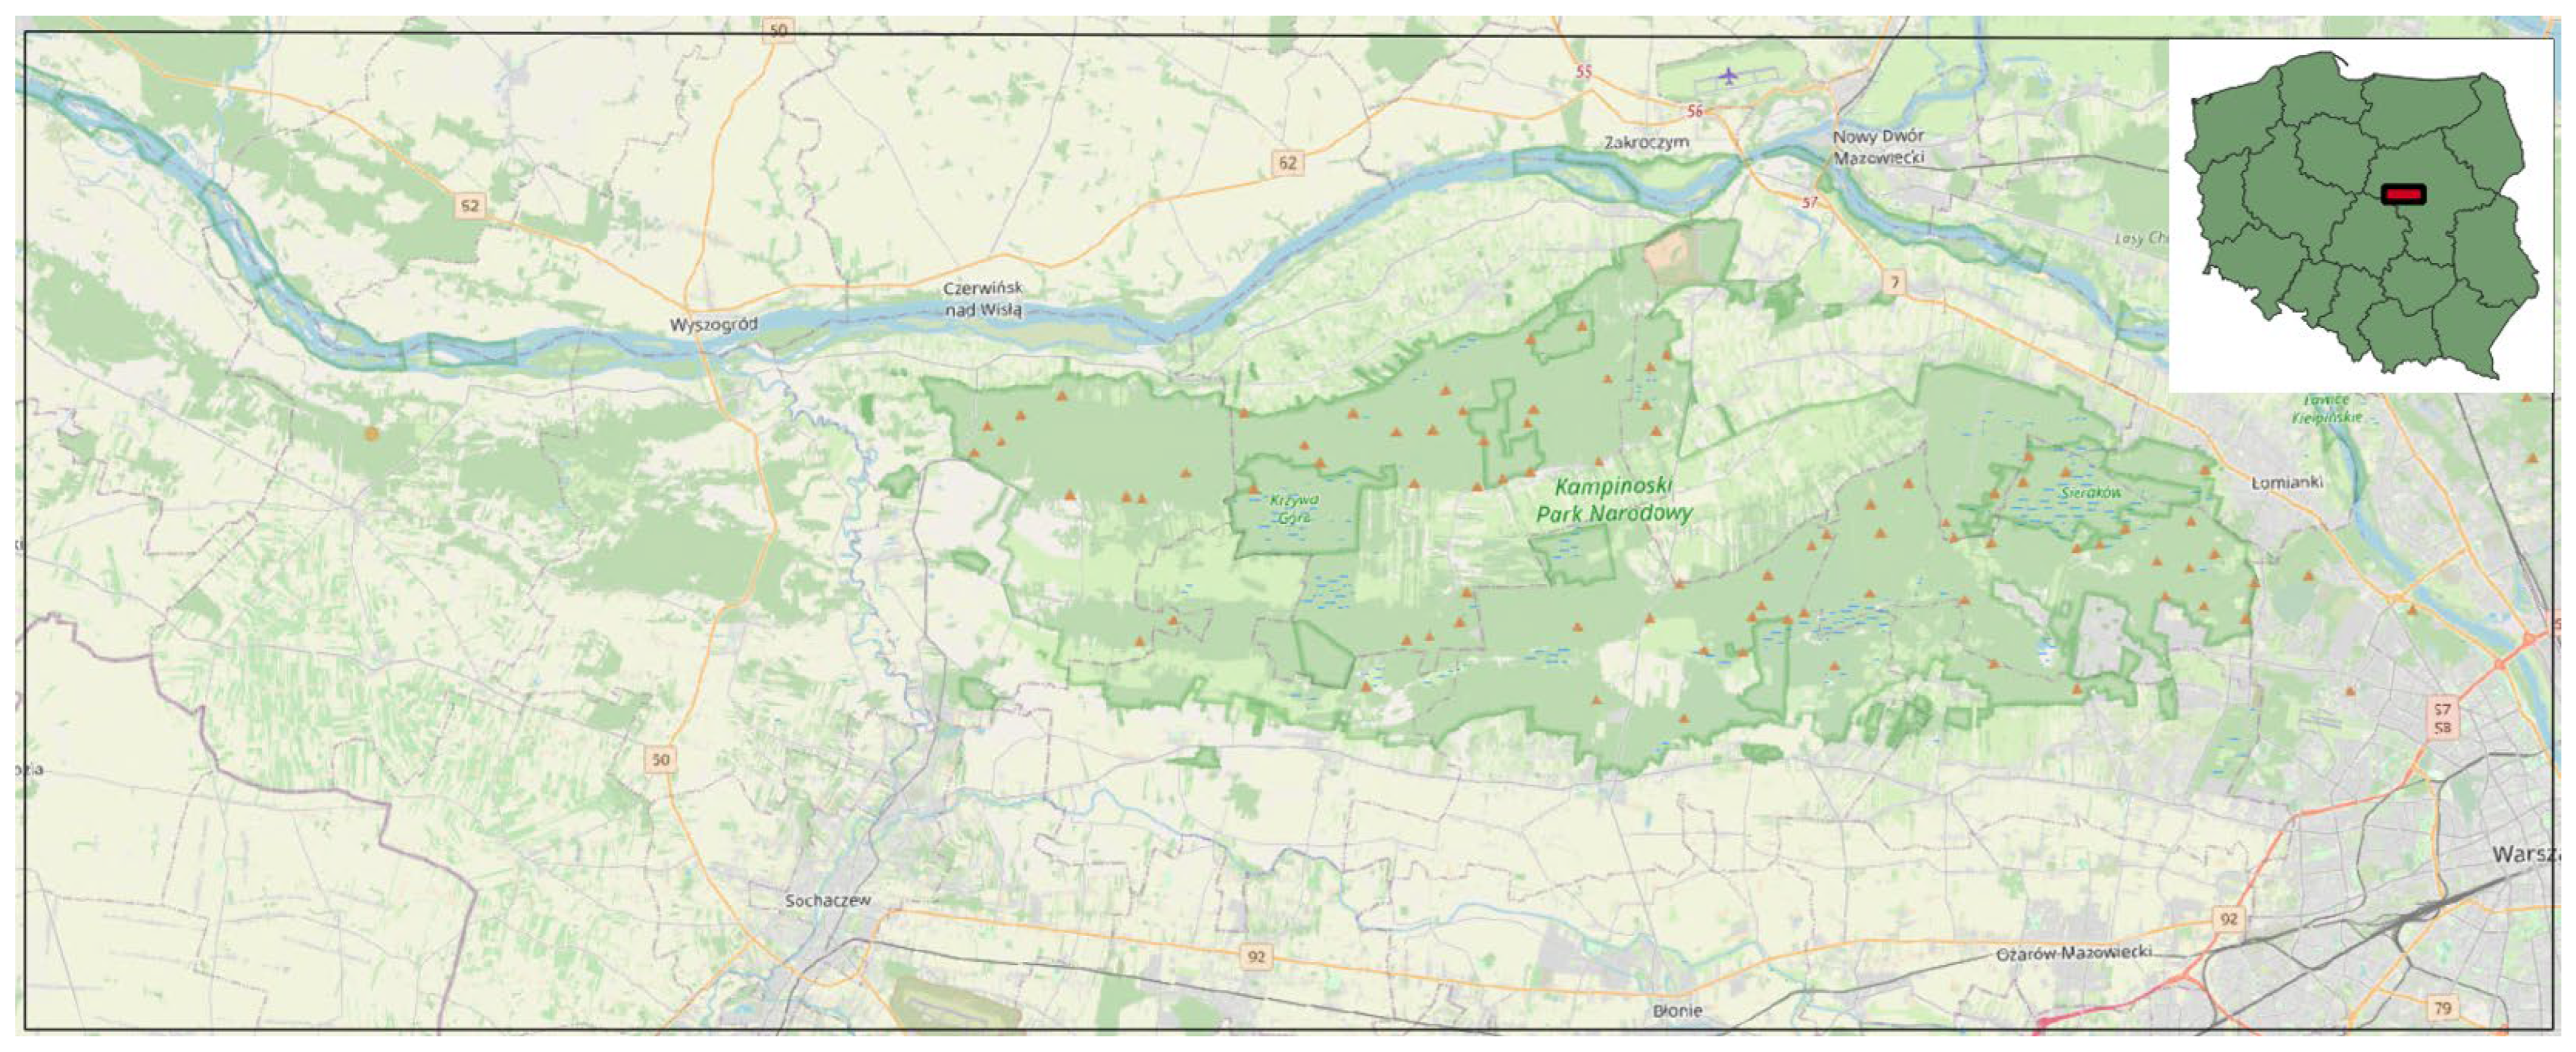
2.1. Test Area

The study was conducted in an area located approximately 30 km from Warsaw. The test area covered a surface of 2355 km2 and included a vast forest complex known as the Kampinos Forest (Figure 1).
The Kampinos Forest is a vast area located in central Poland, in the Masovian Voivodeship, to the northwest of Warsaw. It covers an area of approximately 380 km2, making it one of the largest forest complexes near the capital. The forest is flat and forms part of the Masovian Landscape Park. Due to its natural value, it has been designated as a protected area under the Natura 2000 program. The Kampinos Forest features a diverse landscape, ranging from flat, marshy terrain to dunes and sandy plains, with sections of riparian forests and oak forests. The surrounding area also includes numerous streams, lakes, and peat bogs. This region is ideal for hiking, cycling, and nature observation. Its proximity to Warsaw also makes it strategically important for the defense of the state, both historically and in the present day. In addition to the expansive Kampinos Forest, the test area includes plains primarily used for agriculture and scattered settlements.

2.2. Used Data

Military terrain passability maps were generated for the test area. To achieve this, spatial databases that were created and maintained up to date in Poland were used. The study aimed to incorporate both military databases dedicated to defense purposes and datasets used in the national economy, which are maintained by civil institutions as well as volunteered geographic data managed by user communities that collect and input data into publicly accessible repositories (Figure 2):
  • Vector Map Level 2 (VML2, military development, the timeliness of the information 2014). This database has a level of detail similar to that of a military topographic map at a 1:50,000 scale. It encompasses nine object categories including borders, relief, physiography, transport, buildings, hydrography, vegetation, and air traffic infrastructure. The database structure adheres to the DIGEST standard. Due to its high level of detail and cost, this product has not been created for the entire area of interest of the NATO alliance. The forest data were extracted from the layer “FORESTA_AFT”.
  • Vector Map Level 1 (VML1, military development, the timeliness of the information 2014). This map aligns with the information found on a military operational map, Joint Operations Graphics (JOG), at a 1:250,000 scale. It represents the first global military vector product. The data scope and encoding method are similar to VML2. The creators of this product are the military geographic services of NATO member countries. This project is no longer being developed, and the data used for the research date back to 2006 [41]. The forest data were extracted from the layer “FORESTA_AFT”.
  • Corine Land Cover (CLC, civil development, the timeliness of the information 2018). These data provide information on land cover and land use across Europe, collected in regular cycles, typically every six years. It also includes details about changes occurring between cycles. The database focuses exclusively on surface features categorized into the following classes: urban areas, agricultural land, forests, wetlands, and water bodies. Since the CLC2000 project, the European Environment Agency (EEA) has been responsible for coordinating the CLC projects at the European level. This study utilized the most recent version of the CLC data from 2018 [42]. The forest data were extracted using query: “code_18” LIKE ‘31_’.
  • BDOT10k (Topographic Object Database at a scale of 1:10,000, civil development, the timeliness of the information 2021). This database matches the level of detail found in a topographic map at a scale of 1:10,000. It serves as a foundational reference dataset and is included in the State Geodetic and Cartographic Resource. The dataset organizes objects into nine categories: water networks, transport networks, land infrastructure networks, land cover, buildings, structures and facilities, land use complexes, protected areas, administrative units, and other objects [43]. These data are available from the Polish National Geoportal [44]. The forest data were extracted from the layer “PTLZ01”.
  • BDOO (General Geographic Object Database, civil development, the timeliness of the information 2021). This database corresponds to a map with a scale of 1:250,000 and was developed by generalizing data from BDOT10k. As a result, both datasets share a similar structure and organization [43]. These data are available from the Polish National Geoportal [44]. The forest data were extracted from the layer “PTLZ”.
  • OSM (OpenStreetMap, community-driven project, the timeliness of the information 2024). This project aims to develop a free and publicly accessible map of the entire Earth. The database is built using data contributed by registered users, sourced from GPS tracks, satellite imagery, maps in the public domain, and the users’ local knowledge of the areas they edit. Along with general geographic information, the database includes descriptive details presented as points of interest (POIs) [40]. Data have been downloaded from publicly available sources [45]. The forest data were extracted using the query: “landuse” = ‘forest’ or “natural” = ‘wood’).
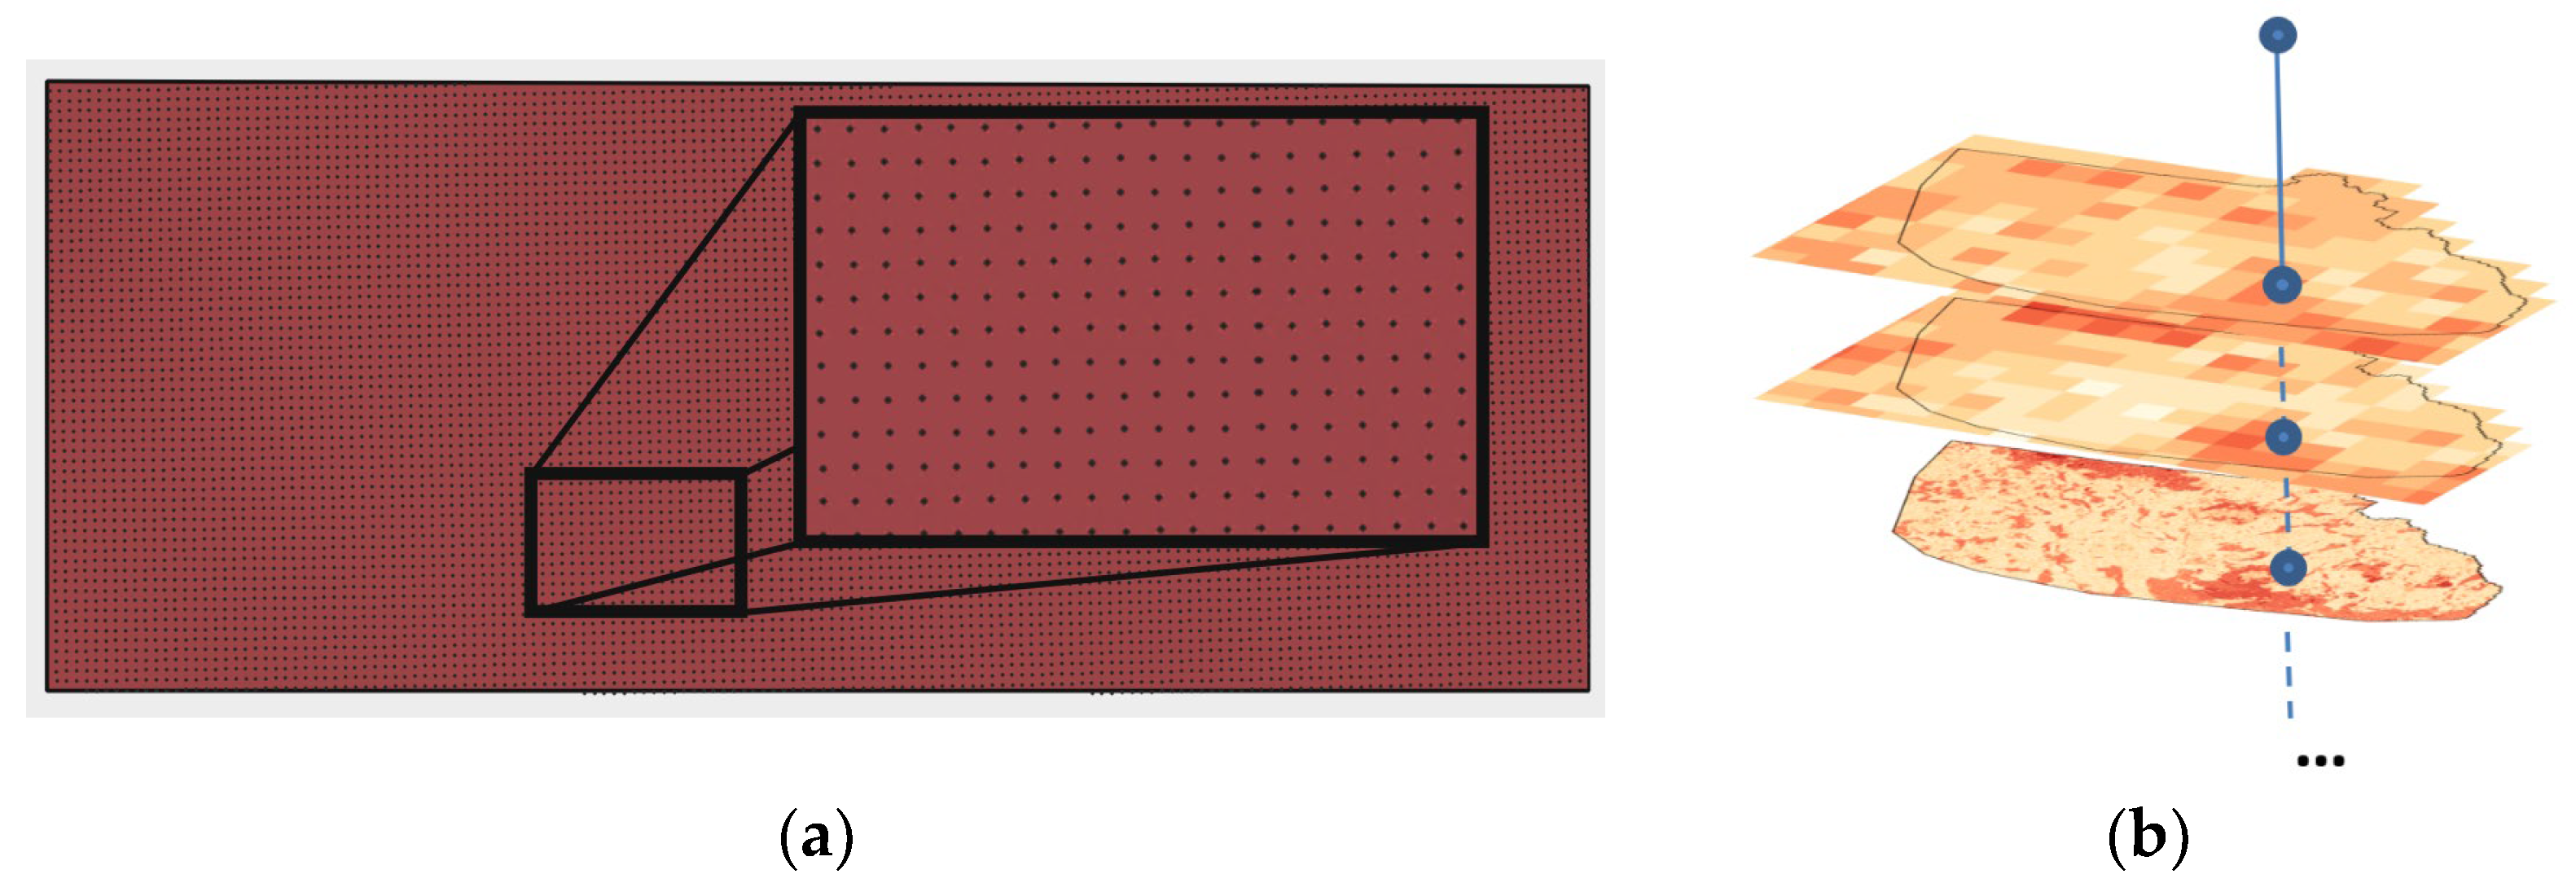
2.3. Method

The first stage of the study involved analyzing the “forest” layers from various spatial databases. To this end, after visualizing them in GIS software (QGIS v. 3.36, Figure 8), parameters were determined for each database such as the area covered by forests in the test area and the number of geometric (area) objects that make up the forest layer. Additionally, the percentage of the test area covered by forests was calculated, along with the common area of forests present across all of the analyzed databases. The percentage of the common forest area across all databases, relative to the total forest area in a given database, was also calculated (Table 1). To further assess the completeness of the data in the individual databases, the common forest area in the BDOT10k database was compared with each of the other spatial databases (Table 2). In this analysis, the data were referenced to the BDOT10k database as it contained the most detailed information (including forest data, since its level of detail is at a 1:10,000 scale, compared to other sources at scales such as 1:50,000 for VML2 or 1:250,000 for BDOO).
After conducting preliminary analyses focused solely on comparing the “forest” layers from the individual databases, tests were carried out to determine the impact of this layer on terrain passability.
Passability maps were generated for the test area, each using a different source of forest data. Other elements, which can be grouped into classes such as buildings, road networks, water bodies, and other vegetation (excluding forests), were taken from the VML2 database. This approach aimed to ensure that the only difference between the maps would be the forest layer.
The methodology for creating passability maps involved calculating the passability index (IOP, index of passability) for conventionally defined terrain sections called “primary fields” (square-shaped in this study). To assess passability, the methodology considered the composition of various land cover elements within each primary field. To ensure universality, a specific weight was assigned to each land cover class, reflecting its influence on passability. Classes with a positive impact were given positive weights, those with minimal impact received neutral weights, and those with a negative impact were assigned zero or negative weights. This approach accounted for all land cover elements within each primary field, enabling the calculation of an averaged passability value for each analyzed field.
All calculations were carried out using a self-developed software system written in .NET technology [46], which facilitates the generation of primary fields in various sizes and shapes. This flexibility allows the system to create different compositions of primary fields, resulting in either more detailed maps (with a larger number of smaller primary fields) or more generalized maps (where larger primary fields aggregate multiple elements with varying impacts on passability). In this study, maps were generated using primary fields with side lengths of 100 m, 200 m, and 500 m, respectively.
The calculation of the IOP is based on the land cover elements present within each primary field including:
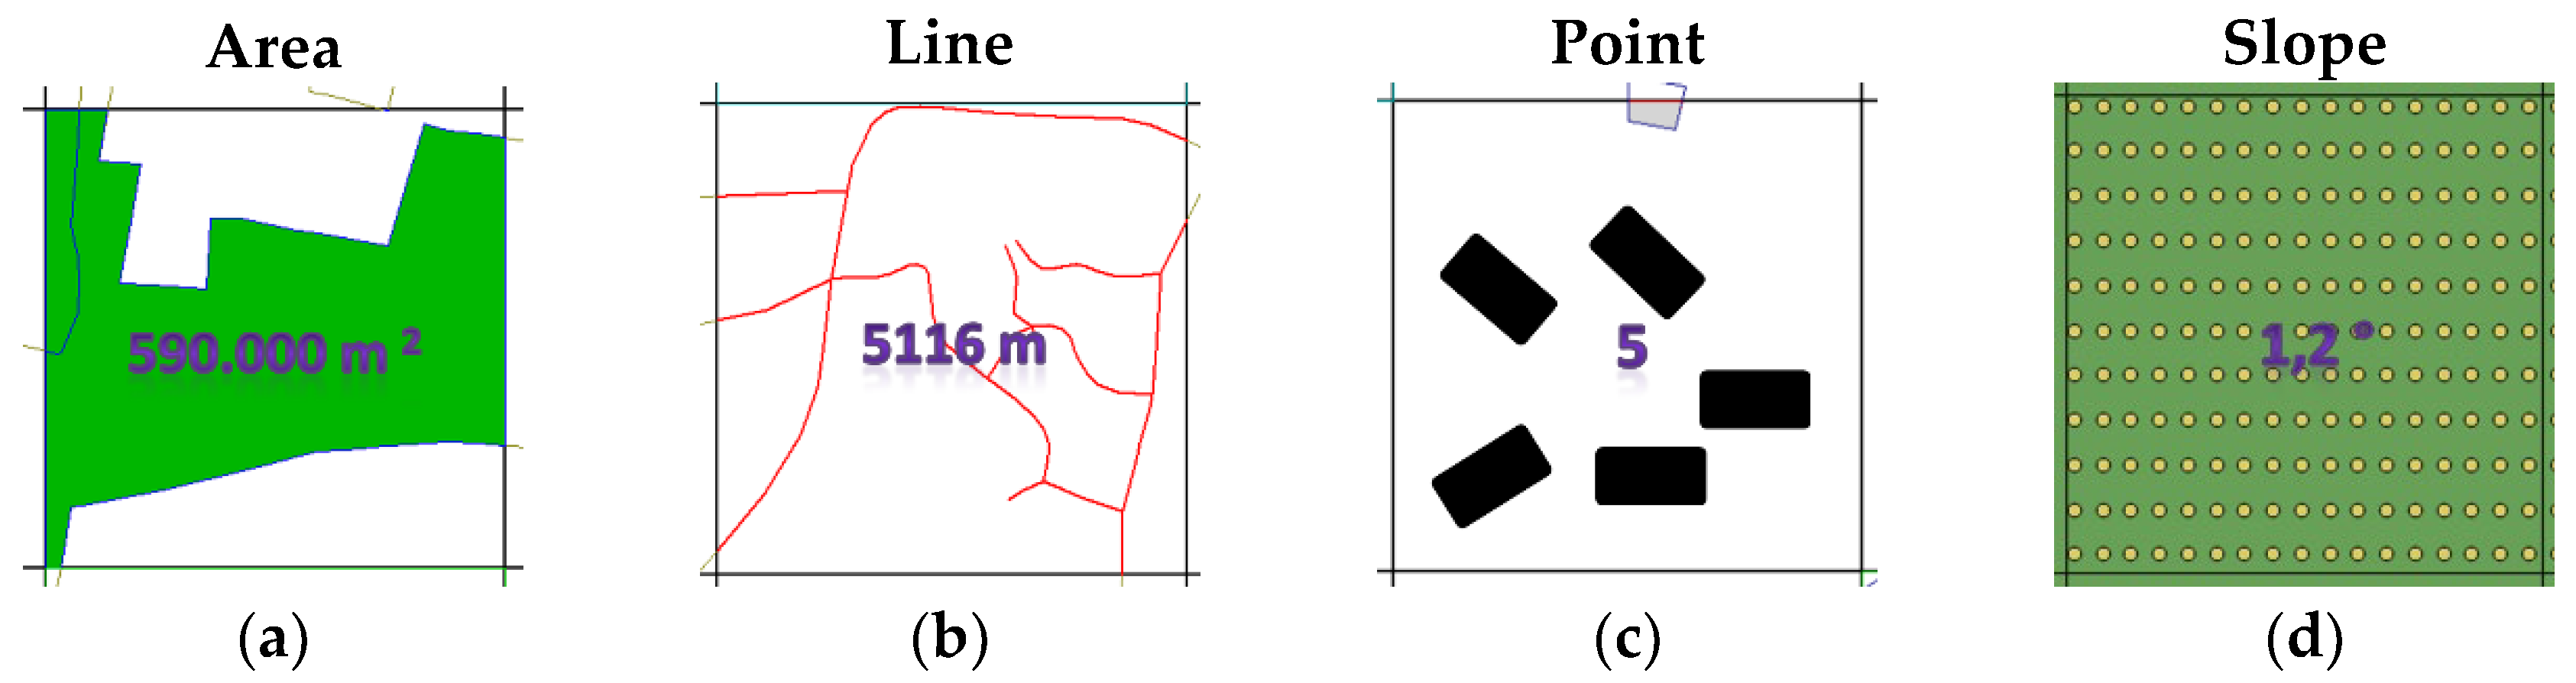
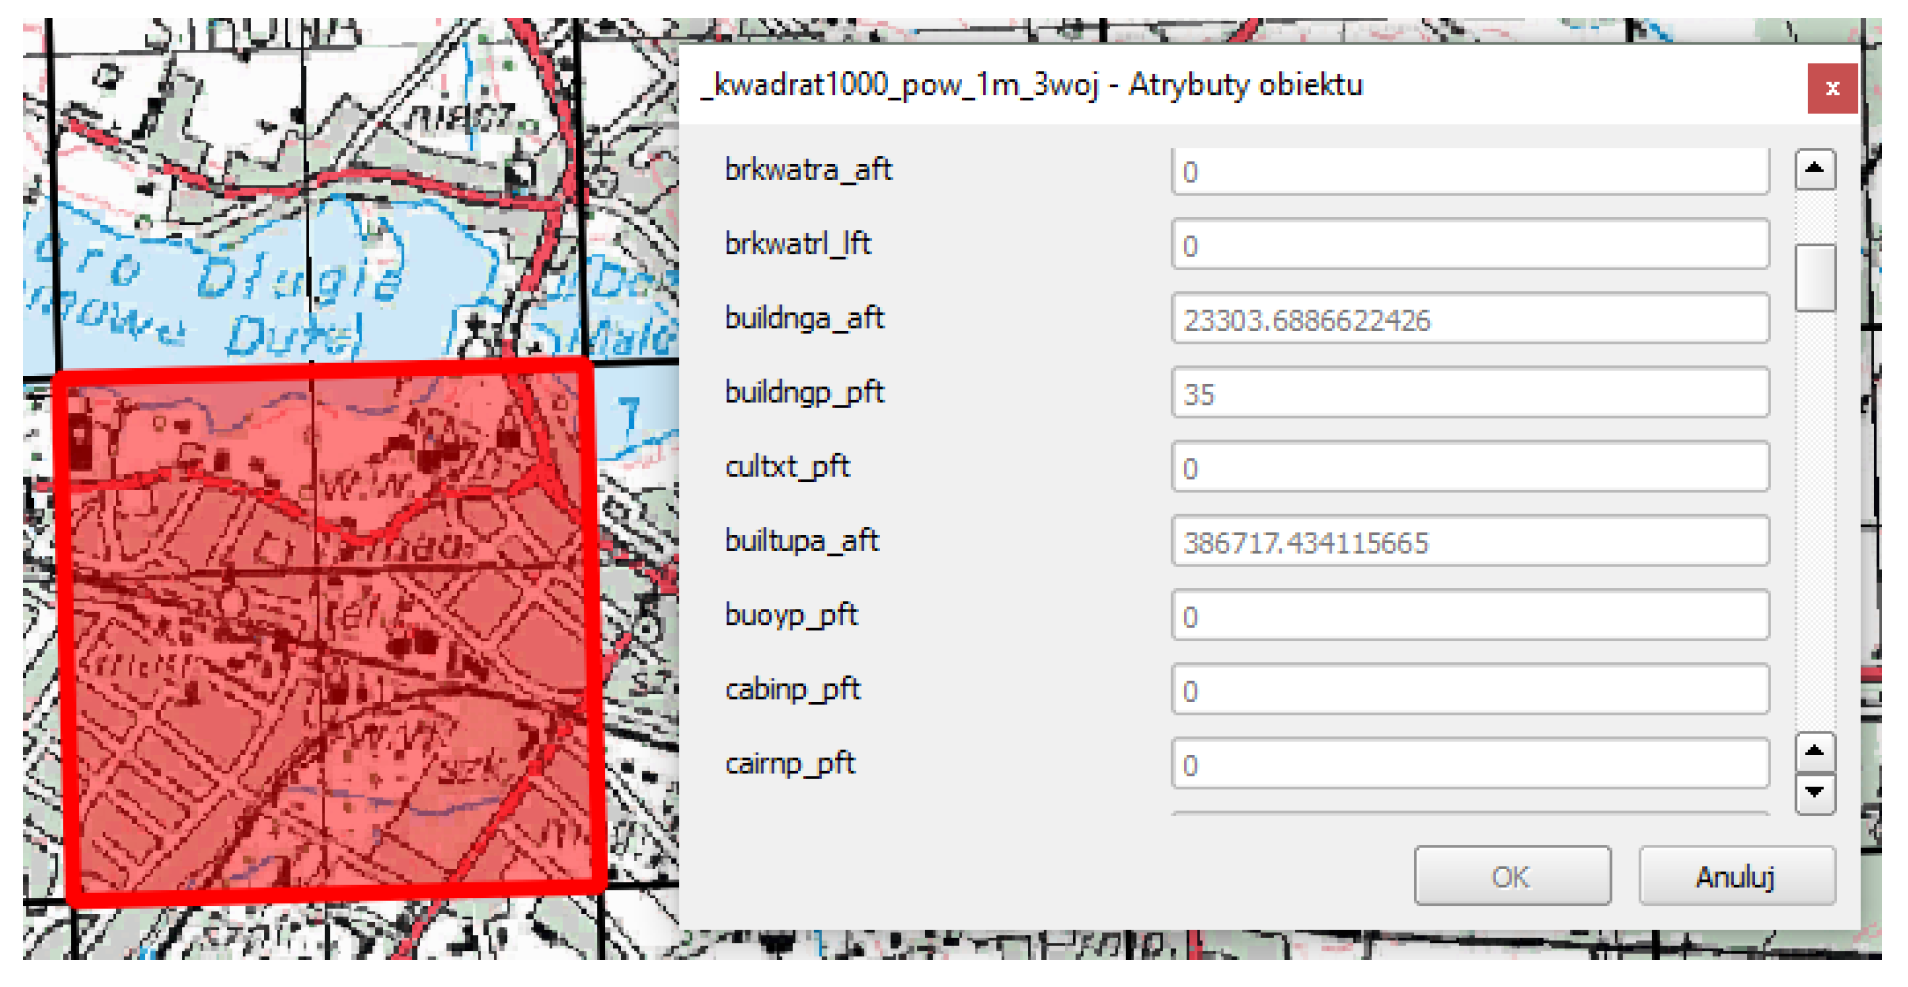
  • Surface objects (e.g., forests, lakes, built-up areas): The total surface area of each type of object within the primary field.
  • Linear objects (e.g., rivers, roads, railways, contour lines): The total length of linear features within the primary field.
  • Singular objects (e.g., buildings, enclosures): The total number of such objects in the primary field.
Additionally, each primary field was assigned an average land denivelation parameter, calculated using all points from the digital terrain model (DTM), which represented the slope variations within the field (Figure 3).
The described approach represents a transformation of a vector-based, discrete data model into a continuous raster model (Figure 4), where each primary field is characterized by a set of defined parameters (Figure 5). This method of organizing data facilitates statistical analyses, allowing for the calculation of the passability index for each primary field.
In the discussed method, the authors determined the passability index (IOP) based on the vegetation roughness factor (VRF, denoted as IVRF). The VRF represents a numerical value that quantifies the impact of various land cover types on vehicle movement, particularly in terms of speed limitations. The factor is expressed on a continuous scale from −1 (elements that impede passability) to 1 (elements that enhance passability). The authors proposed the following algorithm to calculate the passability index using the VRF:
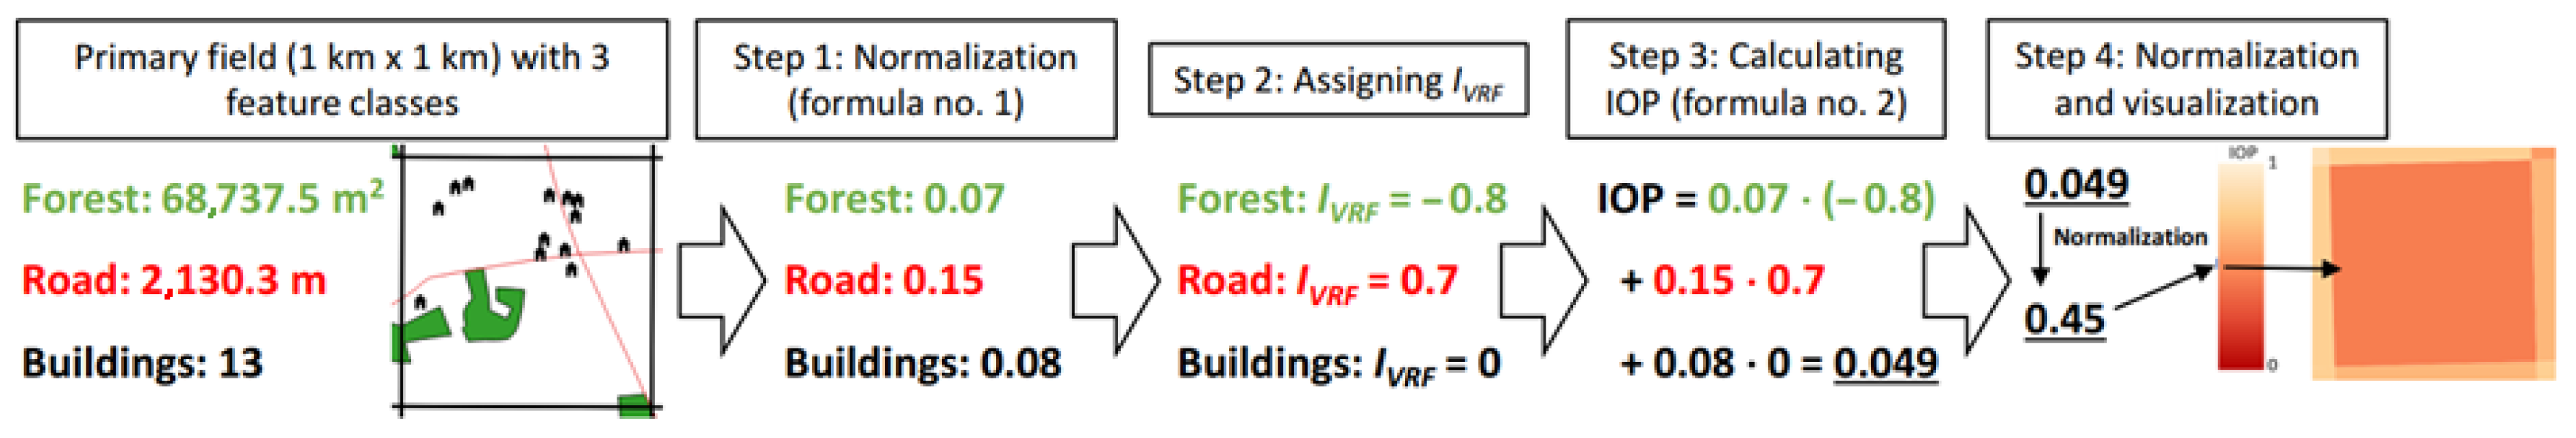
  • Normalization of land cover data: The land cover data for each primary field are normalized to a range of 0 to 1.
  • Assignment of VRF coefficients: A VRF coefficient is assigned to each object category. Object classes are grouped as follows: those that obstruct passability (IVRF < 0), those that facilitate passability (IVRF > 0), and those that do not affect passability (mainly point objects, IVRF = 0).
    The parameters can be freely adjusted by defining custom VRF coefficients, making the method adaptable.
  • The passability index is determined using the following equation:
    I O P i = A i n 1 · I V R F n 1 + L i n 2 · I V R F n 2 + N i n 3 · I V R F n 3 +
    where:
    I O P i is the index of passability of the primary field I;
    for surface objects A i n 1 is the normalized surface (located inside the primary field i) of objects from the n1 thematic category;
    for linear objects, L i n 2 is the normalised length (located inside the primary field i) of objects from the n2 thematic category;
    for point objects, N i n 3 is the normalised number (located inside the primary field i) of objects from the n3 thematic category;
    I V R F is the vegetation roughness factor for object classes n1, n2, and n3.
    Equation (1) incorporates all object classes present in the spatial database. A specific class can be excluded from the analysis by either removing it or assigning it an IVRF of 0, meaning that it does not influence the passability.
  • The resulting IOP values are then normalized to a continuous scale ranging from 0 to 1.
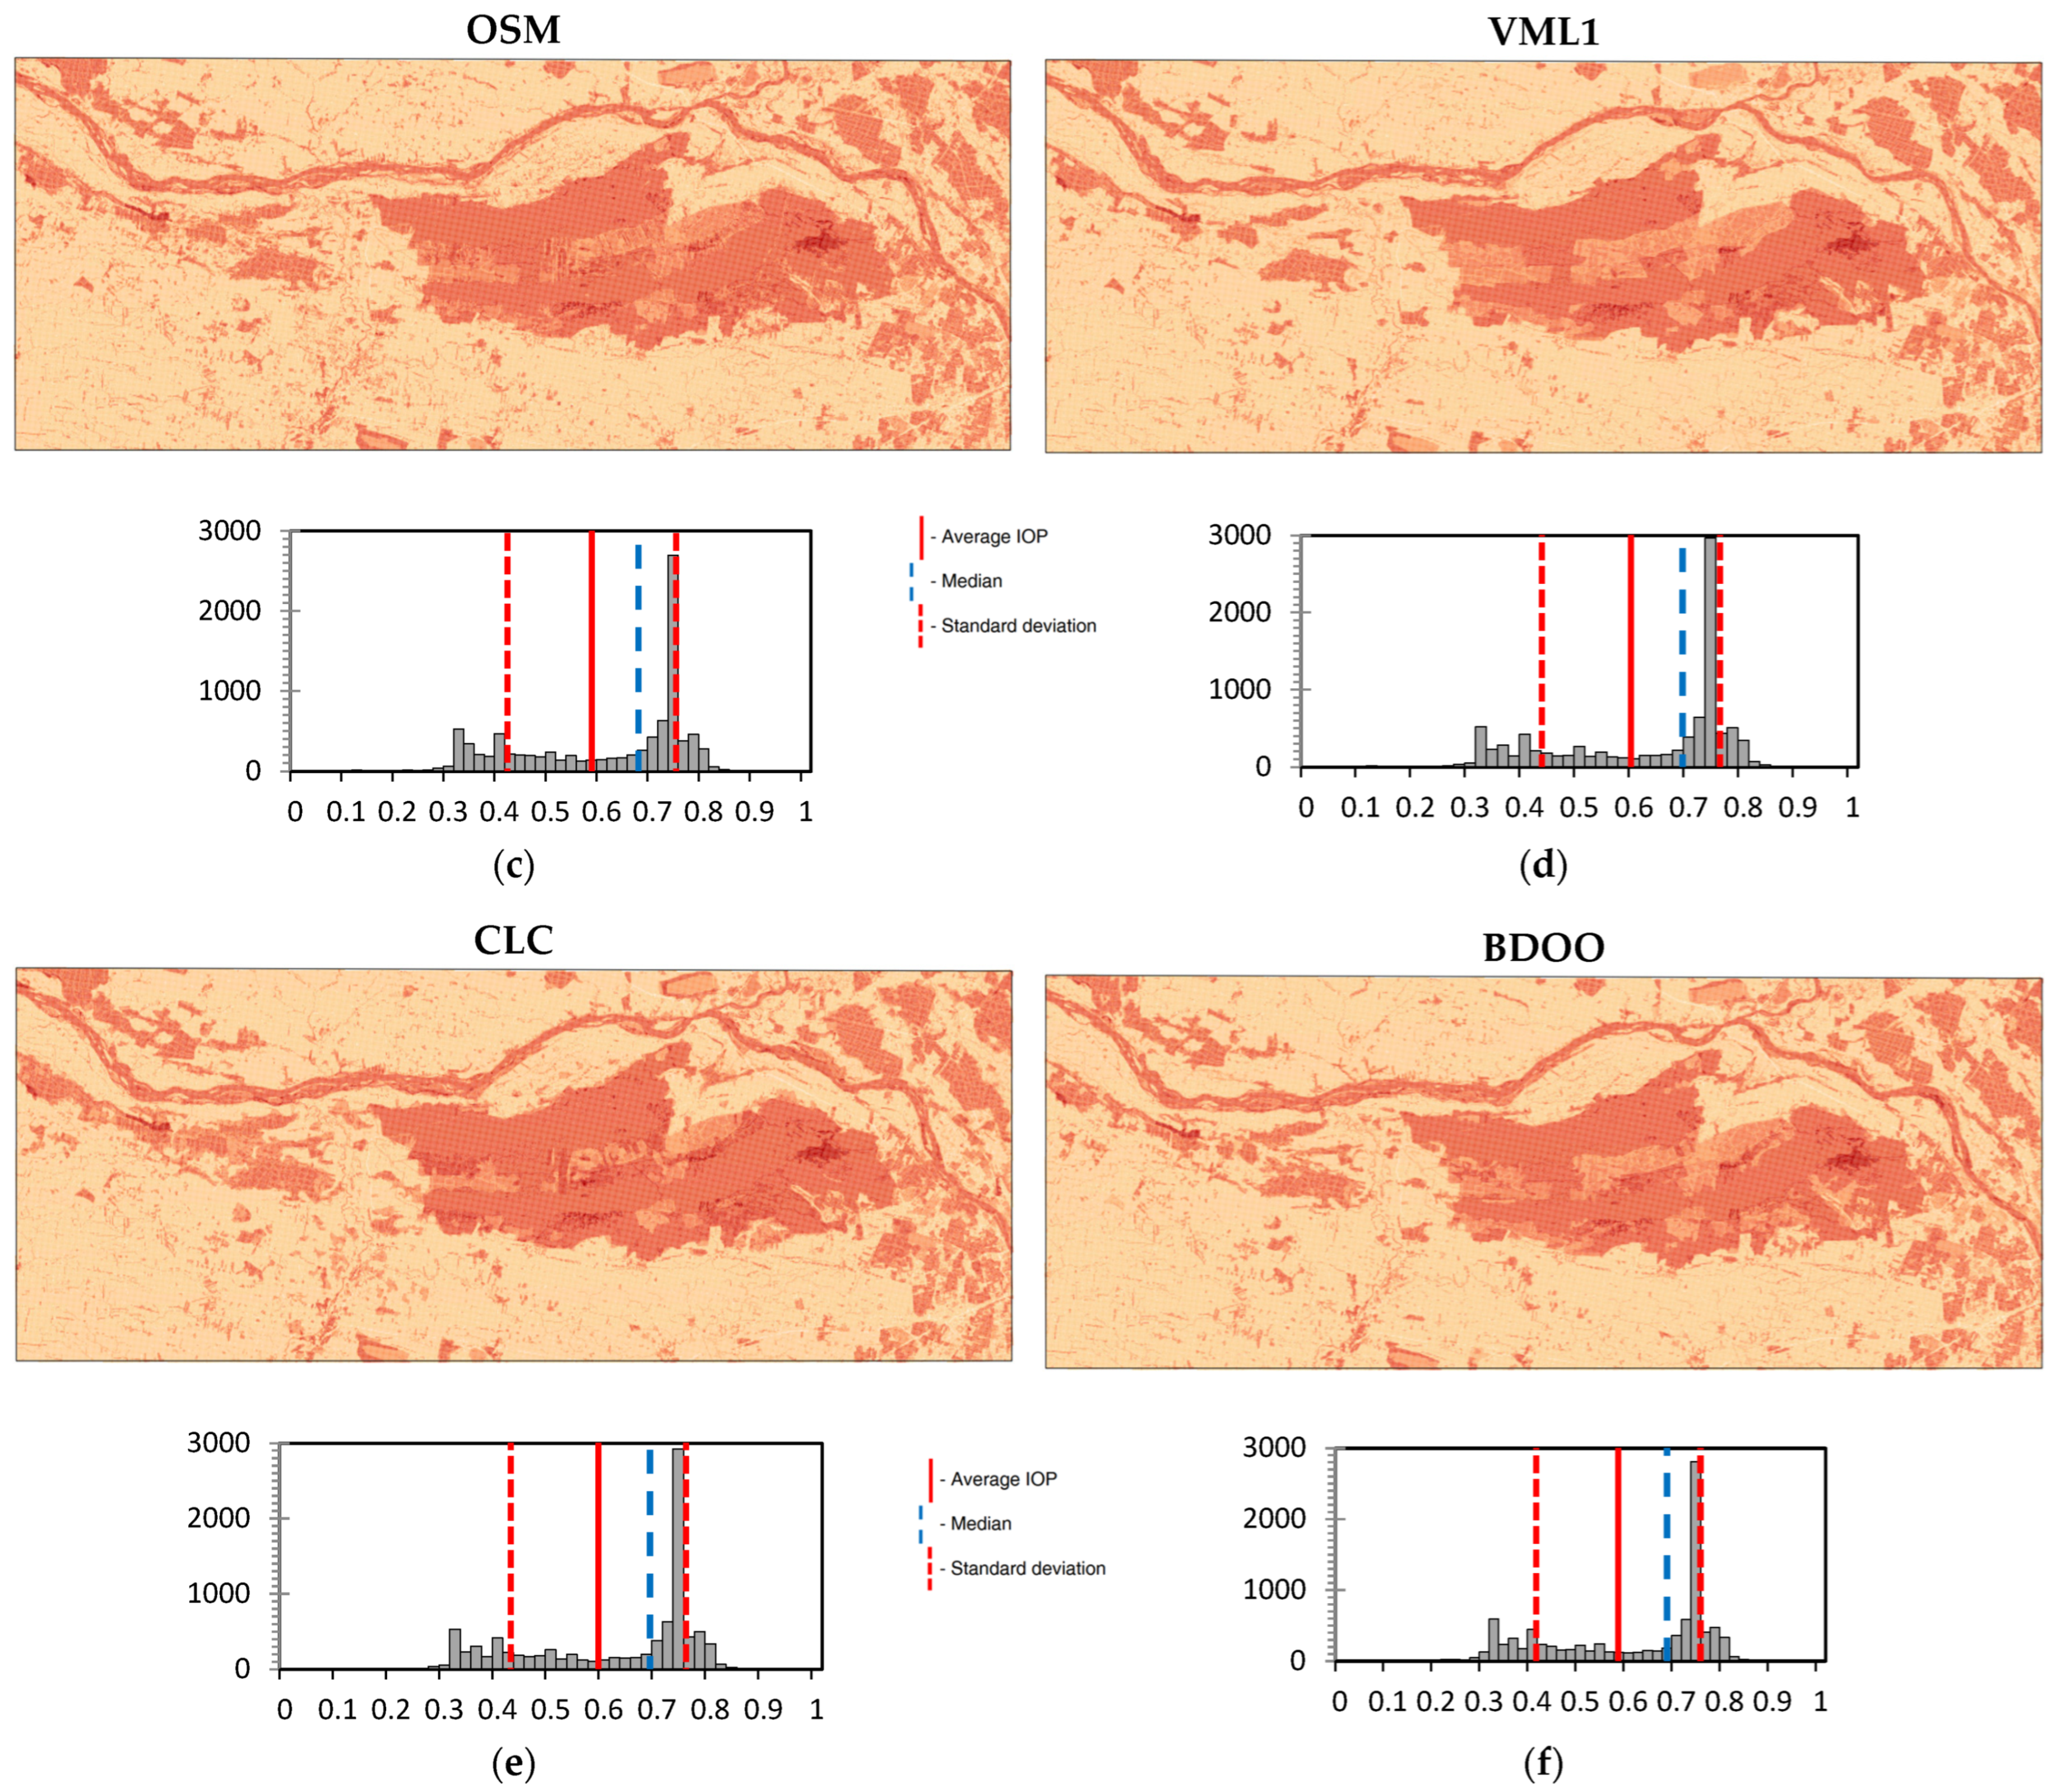
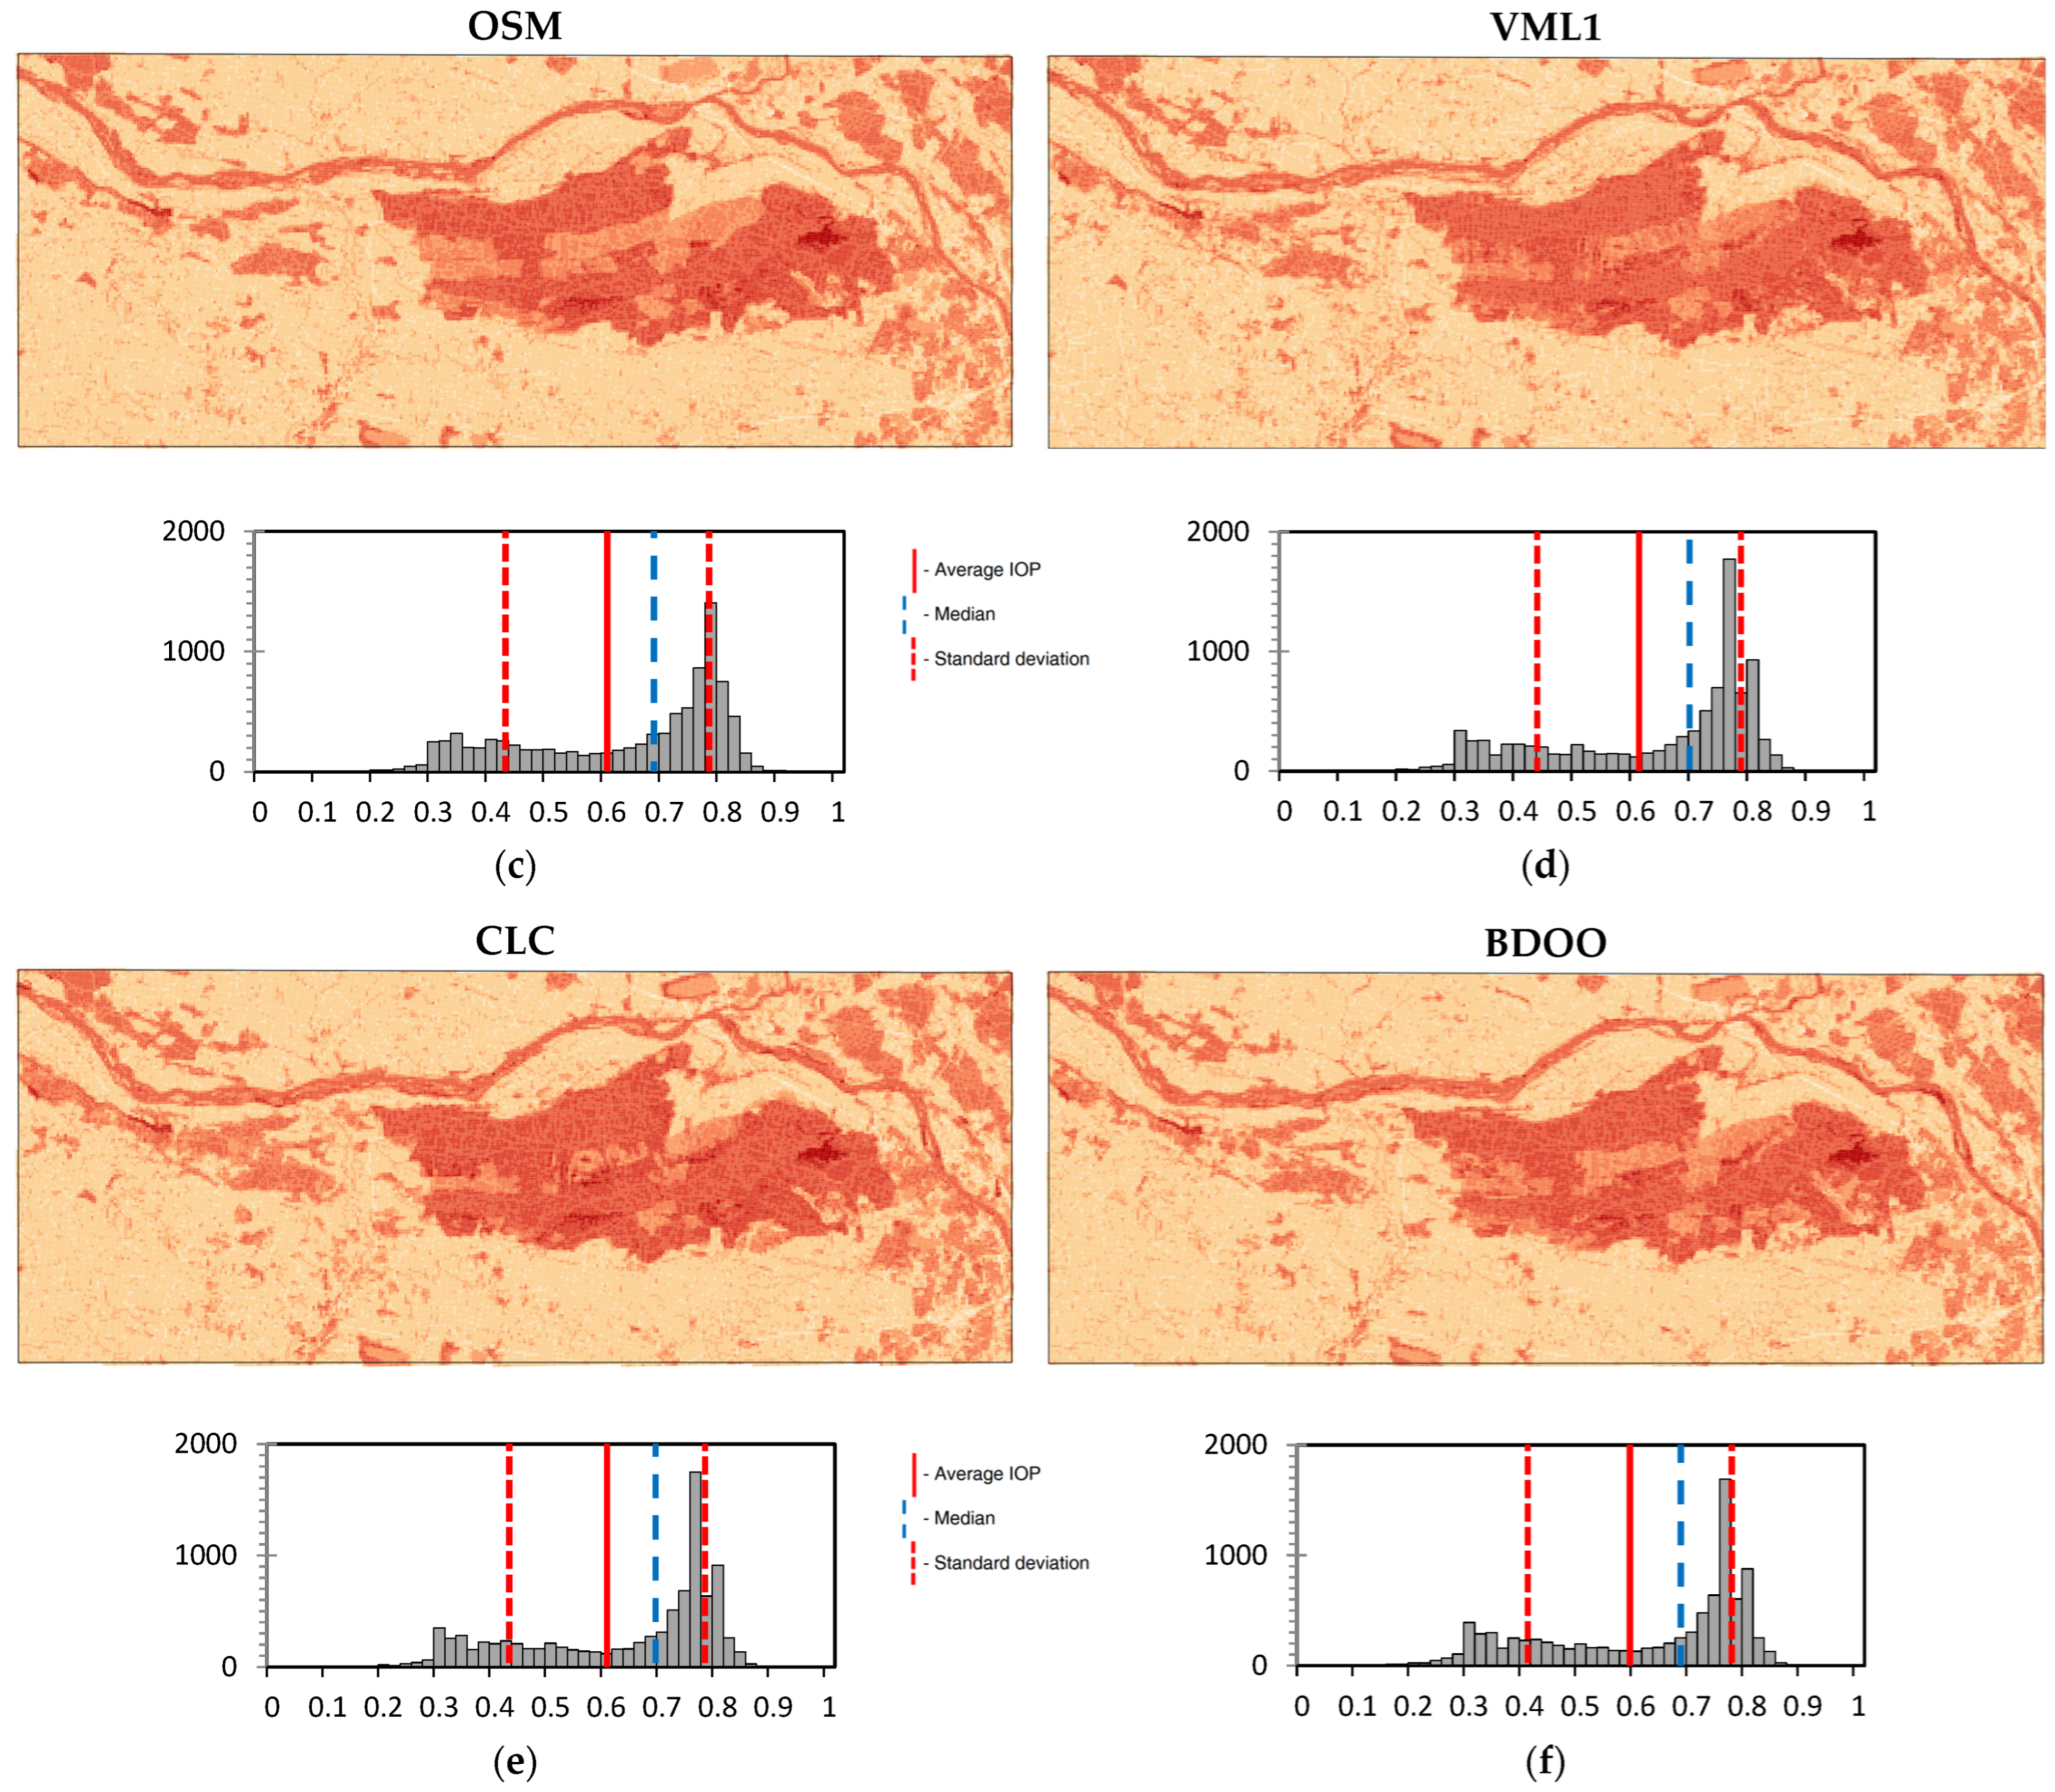
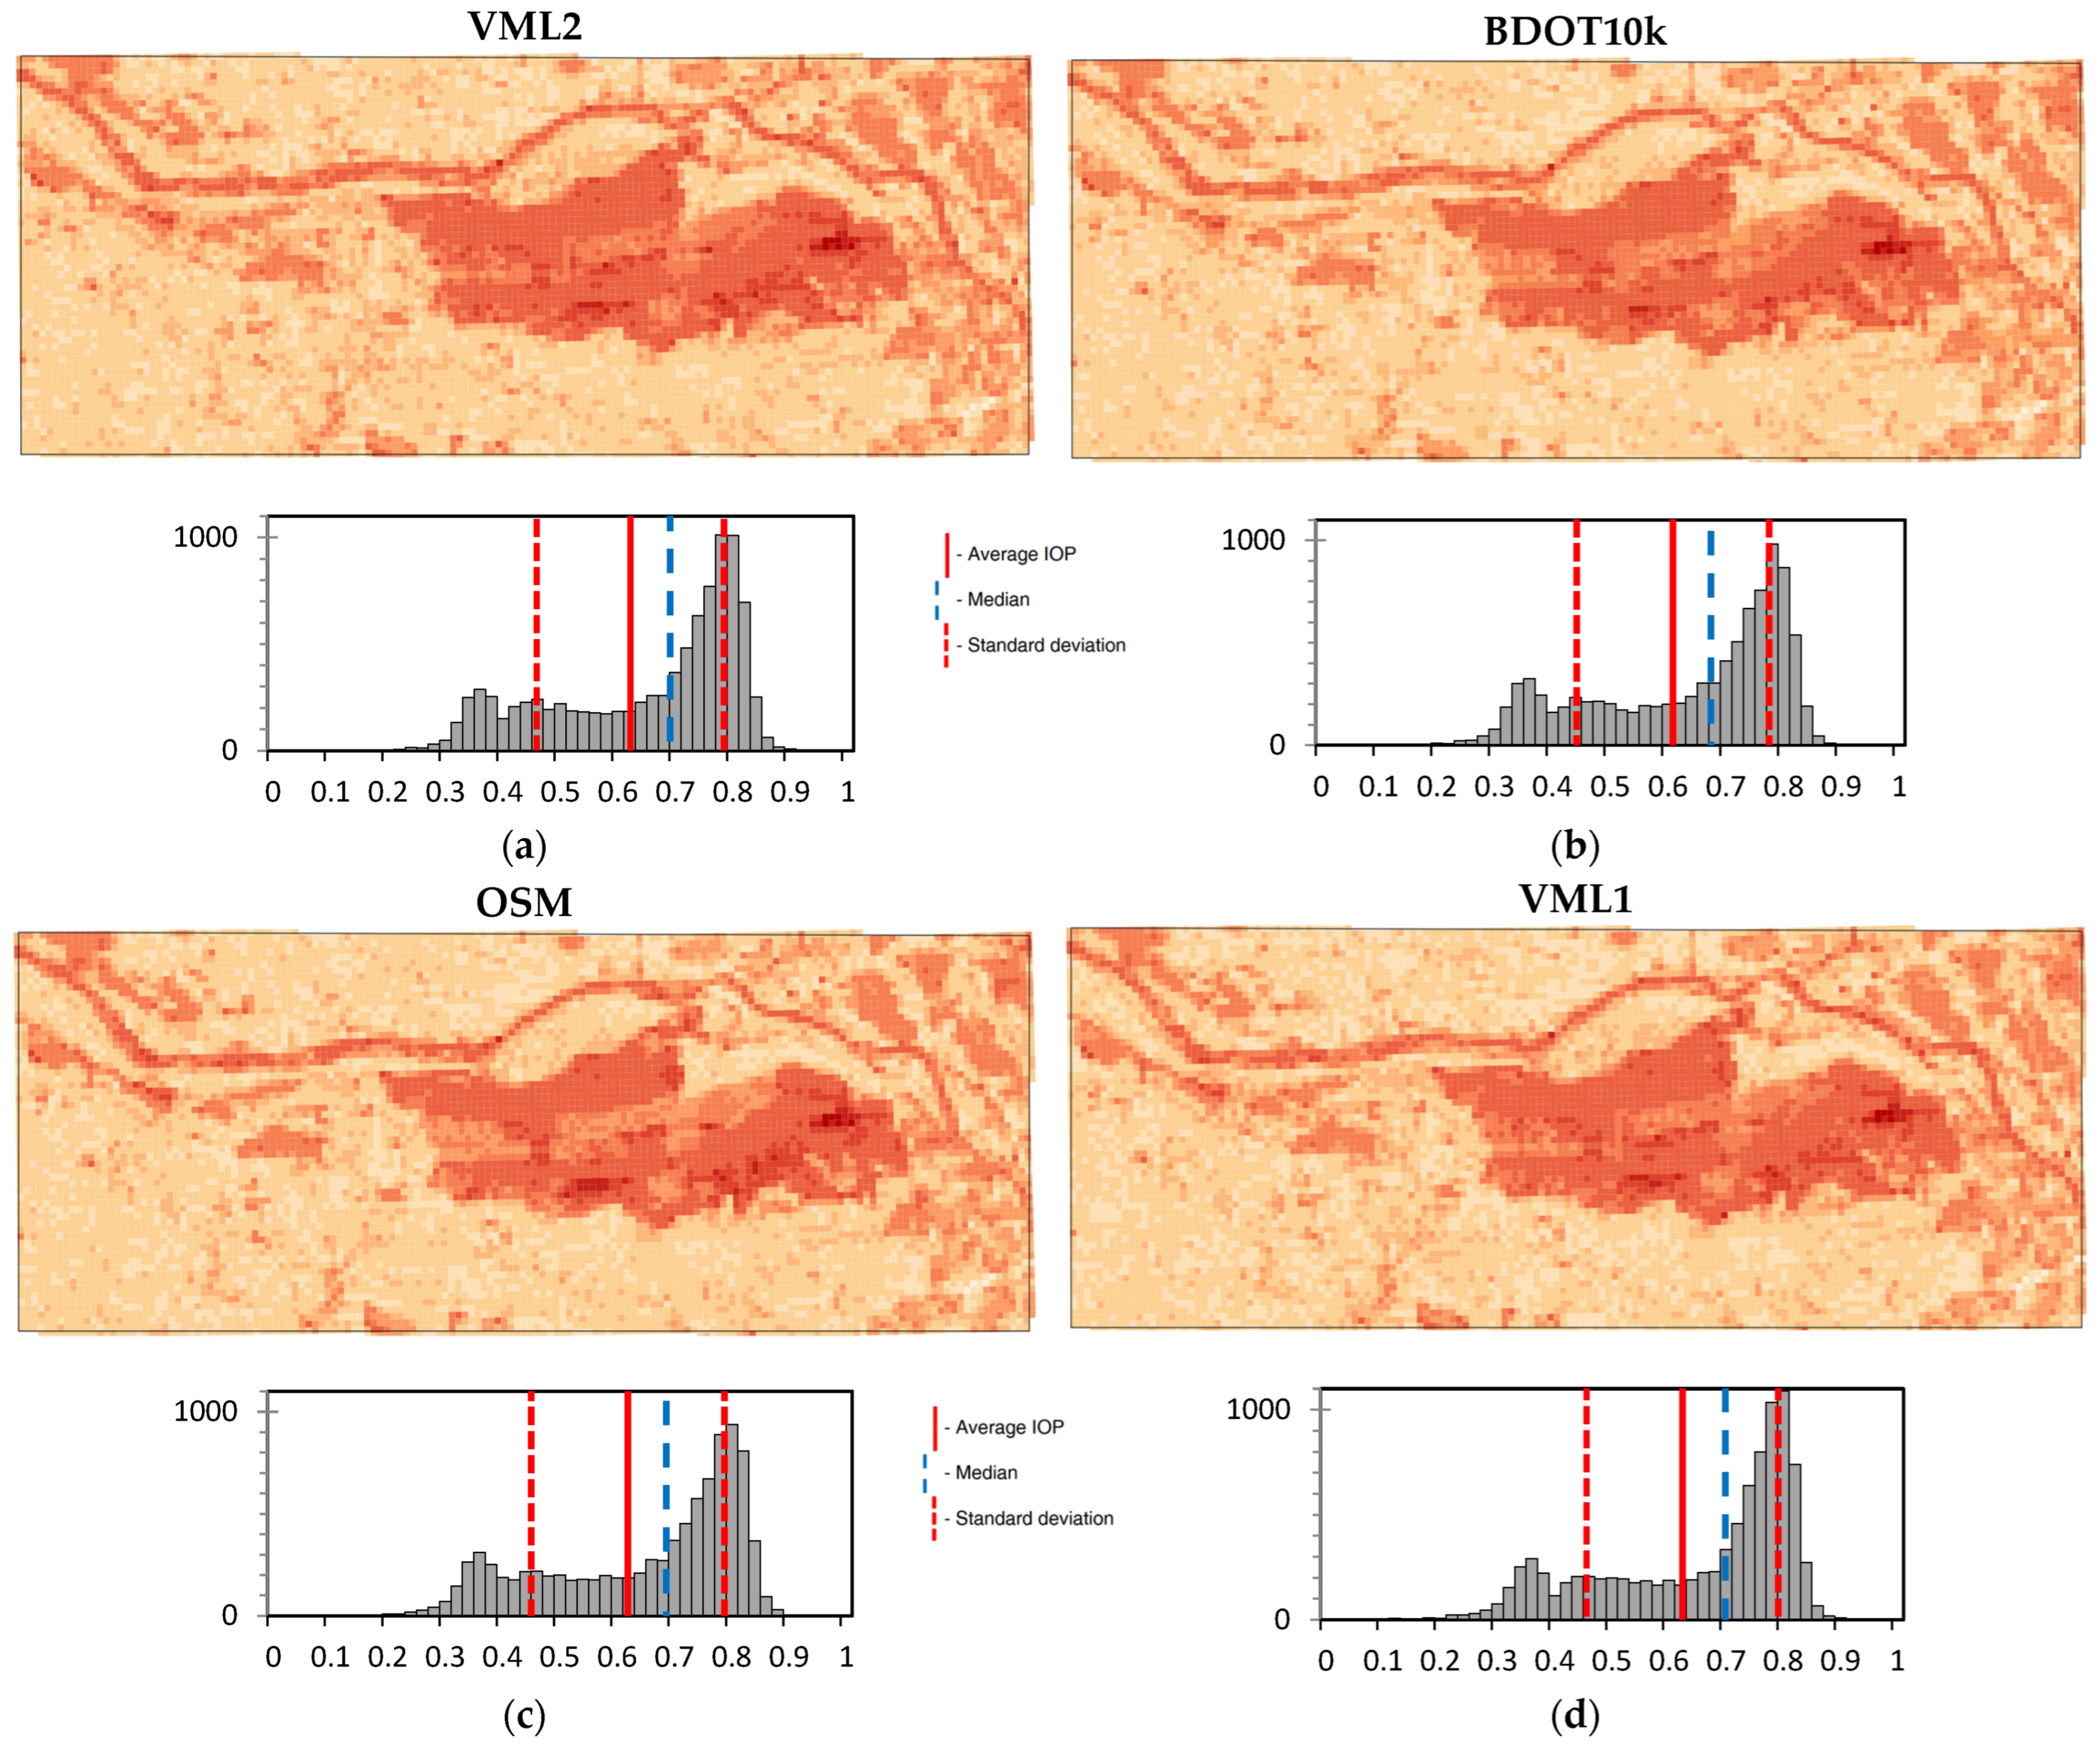
A detailed description of the method outlined above is provided in [46] and in Figure 6. As a result of applying the algorithm, eighteen passability maps were generated (using six spatial databases, with maps created for each database for three different primary field sizes). To compare the contents of these maps within the test area, control points were randomly placed on a 500 m × 500 m grid (Figure 7a). For each of these points, passability data for the corresponding basic field were collected (Figure 7b).
This process was repeated for all 18 maps, so that each control point was assigned 18 passability coefficients. To explore the relationships between the generated maps, Pearson correlation matrices were computed for the passability coefficients from all control points. The calculations were conducted separately for each primary field size. Basic statistics of the resulting distributions were also calculated (mean, standard deviation, and kurtosis). Additionally, the distributions of the passability coefficients were presented as histograms (Figures 10–12). The results were subjected to comprehensive analysis, and the findings are discussed in the “Discussion” section.

3. Results

The spatial extent of the forested areas in each of the analyzed databases is shown in Figure 8. Table 1 provides a quantitative representation of the forest area within the analyzed region as well as the number of objects included in the “forest” layer for each of the analyzed spatial databases.
To assess the completeness of the data, a spatial analysis was conducted, which allowed for the determination of the common areas of all forested regions within the test area across all analyzed spatial databases (Figure 9). Table 2, on the other hand, presents the percentage of the common forest area in relation to the BDOT10k database, which was selected due to its highest level of detail in representing the forest data.
Based on the “forest” layer from all of the analyzed spatial databases, passability maps were generated. These maps were created for three different primary field sizes: 100 m × 100 m (Figure 10), 200 m × 200 m (Figure 11), and 500 m × 500 m (Figure 12). In addition to the visualizations, the figures display the distribution of the IOP values. Furthermore, Pearson correlation matrices and basic statistical parameters of the IOP distribution were calculated (Table 3, Table 4 and Table 5).

4. Discussion

A visual analysis of the results from the analyzed databases, presenting the spatial extent of the “forest” layer in each of the databases (Figure 8), led to a key conclusion, where two main levels of detail could be distinguished in the analyzed databases. In the BDOT10k and OSM databases, even the smallest forest areas were represented, with sizes as small as 1000 m2–2000 m2. The VML2 data were slightly less detailed, with the smallest forest fragments covering up to 10,000 m2. The remaining databases (BDOO, VML1, and CLC) were highly generalized, with the smallest visualized forest areas covering at least 0.25 km2 or more (Figure 13).
The level of detail in representing even the smallest forest fragments significantly impacts the depiction of terrain obstacles on passability maps. This is especially important for detailed passability maps. The precision in representing land cover was directly related to the number of objects in the “forest” layer for each analyzed database (Table 1). In the two most detailed databases, the number of objects was between 11,000 and 12,000, while in the small-scale databases, this number ranged from 100 to nearly 300 (from 120 to 40 times fewer!). Between these two values was the VML2 database, where the number of objects was 1272, nearly 10 times smaller than for the most detailed datasets.
While the number of objects did not directly translate to data accuracy, it confirmed the visual analysis of the databases (Figure 8), which showed which data sources were the most detailed in representing forest occurrence in the studied area. An interesting result emerged from the analysis of the percentage of forest coverage in the test area. Contrary to previous findings, the largest forest coverage was found in the least detailed BDOO database (28%). Slightly less coverage was recorded for the most detailed BDOT (27%) and OSM (26%) databases. Less detailed databases showed lower coverage (respectively CLC—22%, VML2—21%, and VML1—21%).
These results reflect the different methods used to determine forest areas during the vectorization (creation) of these data sources. In the case of BDOO, areas were merged and simplified during generalization, which artificially increased the area marked as forest and extended its range to areas not actually covered by forests. In the case of the VML1 database, a different technique was applied—small forest fragments were simply removed, leading to a reduction in the forested area within this database (Figure 14).
The analysis of the common forest areas found in all databases (Figure 9) allowed for the identification of the core and key forest area. The area of this region was 382 km2, which constitutes approximately 64% of all forests, assuming that the average forest area in the analyzed databases is around 600 km2. This indicator is extremely important, as using the VML1 database (which is primarily used for military purposes) and conducting a passability analysis could result in the omission of nearly 40% of critical terrain obstacles, namely forests.
The results presented in Table 2 show the degree of overlap between the forest extent and the most detailed BDOT10k database. This overlap was high, averaging 78% for all analyzed databases. However, when considering the least accurate databases, there were significant differences. For the CLC database, the overlap was 74%, while for VML1, it was only 70%. This practically excludes these datasets from operational use, as they failed to account for both small and larger forest areas, leading to incorrect results (Figure 15).
Based on the forest data discussed above, terrain passability maps of varying detail were generated. It is crucial to emphasize that the analysis considered all land cover and terrain features affecting passability including hydrology, built-up areas, road networks, and others. While forests were a significant factor, they were just one of several elements considered. This approach was justified as it aimed to demonstrate the extent to which forests (and the differences in forest data across various databases) influenced the final passability analysis results.
A preliminary visual examination of the generated maps for the smallest primary field size, measuring 100 × 100 m (Figure 10), revealed that these maps were very similar. The extent of impassable areas generally occurred in the same locations. However, upon closer inspection and detailed analysis of the maps, significant discrepancies become evident in certain areas, especially between maps based on detailed forest data (BDOT10k and OSM) and those using small-scale data (BDOO or VML1). These differences arose from the previously discussed variations in representing small forested areas, which were particularly noticeable when the smallest primary field size of 100 m was applied (Figure 16).
Increasing the size of the primary field slightly reduced the visual differences in the passability maps. This is because the larger primary fields encompassed multiple elements that simultaneously influenced terrain passability. As a result, the maps became more generalized, with smaller forest divisions disappearing.
The numerical estimators presented in Table 3, Table 4 and Table 5 clearly demonstrate that the parameters characterizing the distribution of passability coefficients (IOP) did not differ significantly across datasets. The mean IOP values remained consistent within each primary field size: for 100 m, the average was approximately 0.60; it slightly increased to 0.64 for the 200 m fields, and then decreased to 0.62 for the 500 m fields. The standard deviation of the IOP distribution also remained similar in all cases, ranging between 0.16 and 0.18. These findings indicate that on a macro scale, the use of different forest datasets did not lead to significant or fundamental changes in the generated passability maps. The differences were localized to small areas, which may alter the passability conditions, particularly in maps generated with the smallest primary fields.
A highly intriguing aspect of this study was the analysis of correlation coefficients between the generated maps. These coefficients compared the calculated IOP values and were determined for all combinations of maps (across all datasets and primary field sizes). The first notable observation was that these coefficients were consistently very high. The lowest correlation value was 0.944 (BDOO—VML1), while the highest reached 0.996 (OSM—BDOT for 500 × 500 m fields). This strongly supports the conclusion that the overall content of all of the generated maps was highly similar. The degree of similarity was highest when comparing detailed passability maps (BDOT, OSM, VML2), with correlation values ranging from 0.96 to 0.99. For less detailed datasets, the average correlation values were slightly lower, between 0.94 and 0.97. Particularly interesting insights emerged from the analysis of average correlation coefficients calculated for each primary field size (Figure 17).
The above graph clearly shows that as the size of the primary field increased, the generated passability maps became more similar to each other. This occurred due to the increasing level of generalization, which diminished the differences visible with smaller primary fields.

5. Conclusions

Forests are a critical factor affecting terrain passability, as they represent a significant obstacle for vehicles traversing off-road areas. Given this, the accurate topographic modeling of forested areas is essential for effective military movement planning. The results of the presented studies strongly emphasize that certain data sources, particularly small-scale ones, exhibit inaccuracies in representing forest areas. This issue is especially pronounced in the VML1 database, where generalization rules mandated the removal of small or detailed forest fragments. Such practices led to the erroneous classification of large areas as passable terrain, a designation that did not align with the on-ground reality.
A more effective approach was demonstrated in the BDOO database, where small forested areas were merged into larger contiguous zones. While this method classified these regions as impassable, it aligned more closely with the operational realities. From a practical perspective, it is preferable to overestimate the extent of impassable terrain than to misclassify areas as passable, potentially directing resources and personnel into inaccessible regions. The study also highlighted the high geometric quality of OSM data within the test area. These datasets demonstrated a remarkable accuracy in forest representation, rivalling the official BDOT10k database.
In addressing the research questions posed in this article, it is evident that forests are a significant component of passability maps. However, the use of various forest data sources does not fundamentally alter the resulting passability maps, as evidenced by the very high correlation coefficients observed between them. For maps generated with small primary field sizes (e.g., 100 m × 100 m), the use of detailed spatial data sources is recommended. Conversely, for larger primary field sizes (e.g., 500 m × 500 m or greater), the level of detail in the input data becomes less critical. This is because the maps themselves undergo generalization, rendering smaller forest divisions invisible.
Future research will focus on incorporating descriptive data on the characteristics of forested areas into the generated passability maps. Additionally, it will be of significant interest to assess the quality of forest data in other countries, applying methodologies developed within these territories to evaluate the applicability and accuracy of data in diverse geographical and operational contexts.

Author Contributions

Conceptualization, K.P. and W.D.; Methodology, K.P.; Software, K.P.; Validation, K.P. and W.D.; Formal analysis, K.P.; Investigation, K.P.; Resources, K.P.; Data curation, K.P.; Writing—original draft preparation, K.P. and W.D.; Writing—review and editing, W.D.; Visualization, K.P.; Supervision, K.P.; Project administration, K.P.; Funding acquisition, K.P. All authors have read and agreed to the published version of the manuscript.

Funding

This research was funded by the Military University of Technology in Warsaw, Faculty of Civil Engineering and Geodesy, Institute of Geospatial Engineering and Geodesy, research grant for 2025.

Data Availability Statement

The original data from the Topographic Objects Database, General Geographic Object Database, OpenStreetMap and Corine Land Cover presented in the study are openly available through the Polish national geoportal at [https://www.geoportal.gov.pl (accessed on 15 December 2024)], OSM download service at [https://www.geofabrik.de/ (accessed on 15 December 2024)], and the Copernicus Land Monitoring Service at [https://land.copernicus.eu/en/products/corine-land-cover (accessed on 15 December 2024)], respectively. The Vector Map Level 1 and Level 2 data are not publicly available as they are classified and used exclusively by the Polish Armed Forces.

Conflicts of Interest

The authors declare no conflicts of interest.

References

  1. Rybansky, M. Effect of the Geographic Factors on the Cross Country Movement During Military Operations and the Natural Disasters; Rerucha, V., Ed.; Univ Defence: Brno, Czeh Republic, 2007; ISBN 978-80-7231-238-2. [Google Scholar]
  2. Field Manual No. 5-33 Terrain Analysis. 1990. Available online: http://www.bits.de/NRANEU/others/amd-us-archive/fm5-33(90).pdf (accessed on 23 November 2024).
  3. NO-06-A015:2012; Terrain—Rules of Classification—Terrain Analysis on Operational Level 2012. Polish National Standardization Document: Warsaw, Poland, 2012; unpublished work.
  4. Rybansky, M. Trafficability Analysis through Vegetation. In Proceedings of the 2017 International Conference on Military Technologies (ICMT), Brno, Czech Republic, 31 May–2 June 2017; pp. 207–210. [Google Scholar]
  5. Rybansky, M. Determination of Forest Structure from Remote Sensing Data for Modeling the Navigation of Rescue Vehicles. Appl. Sci. 2022, 12, 3939. [Google Scholar] [CrossRef]
  6. Čapek, J.; Zerzán, P.; Šimková, K. Influence of Tree Spacing on Vehicle Manoeuvers in Forests. In Proceedings of the 2019 International Conference on Military Technologies (ICMT), Brno, Czech Republic, 30–31 May 2019; pp. 1–7. [Google Scholar]
  7. Hyyppae, J.M.; Pyysalo, U.; Hyyppae, H.; Haggren, H.G.; Ruppert, G.S. Accuracy of Laser Scanning for DTM Generation in Forested Areas. In Laser Radar Technology and Applications V; SPIE: Bellingham, WD, USA, 2000; Volume 4035. [Google Scholar]
  8. Rybansky, M.; Dohnal, F.; Hoskova-Mayerova, S.; Svatonova, H. The Impact of Drainage on Terrain UGV Movement. IOP Conf. Ser. Earth Environ. Sci. 2018, 169, 012021. [Google Scholar] [CrossRef]
  9. Kapi, A.Y.; Sunar, M.S.; Algfoor, Z.A. Summary of Pathfinding in Off-Road Environment. In Proceedings of the 2020 6th International Conference on Interactive Digital Media (ICIDM), Virtual, 14–15 December 2020; pp. 1–4. [Google Scholar]
  10. Abd Algfoor, Z.; Sunar, M.S.; Kolivand, H. A Comprehensive Study on Pathfinding Techniques for Robotics and Video Games. Int. J. Comput. Games Technol. 2015, 2015, e736138. [Google Scholar] [CrossRef]
  11. Borges, C.D.B.; Almeida, A.M.A.; Paula Júnior, I.C.; Sá Junior, J.J.d.M. A Strategy and Evaluation Method for Ground Global Path Planning Based on Aerial Images. Expert Syst. Appl. 2019, 137, 232–252. [Google Scholar] [CrossRef]
  12. Pokonieczny, K.; Borkowska, S. Using High Resolution Spatial Data to Develop Military Maps of Passability. In Proceedings of the 2019 International Conference on Military Technologies (ICMT), Brno, Czech Republic, 30–31 May 2019; pp. 1–8. [Google Scholar]
  13. Pokonieczny, K. Comparison of Land Passability Maps Created with Use of Different Spatial Data Bases. Geografie 2018, 123, 317–352. [Google Scholar] [CrossRef]
  14. Hubacek, M.; Ceplova, L.; Brenova, M.; Mikita, T.; Zerzan, P. Analysis of Vehicle Movement Possibilities in Terrain Covered by Vegetation; IEEE: Piscataway, NJ, USA, 2015; pp. 1–5. [Google Scholar]
  15. Hofmann, A.; Hošková-Mayerová, Š.; Talhofer, V.; Kovařík, V. Creation of Models for Calculation of Coefficients of Terrain Passability. Qual. Quant. 2014, 49, 1679–1691. [Google Scholar] [CrossRef]
  16. Pokonieczny, K. Use of a Multilayer Perceptron to Automate Terrain Assessment for the Needs of the Armed Forces. ISPRS Int. J. Geo-Inf. 2018, 7, 430. [Google Scholar] [CrossRef]
  17. Rybansky, M.; Hofmann, A.; Hubacek, M.; Kovarik, V.; Talhofer, V. Modelling of Cross-Country Transport in Raster Format. Environ Earth Sci. 2015, 74, 7049–7058. [Google Scholar] [CrossRef]
  18. Dawid, W.; Pokonieczny, K. Analysis of the Possibilities of Using Different Resolution Digital Elevation Models in the Study of Microrelief on the Example of Terrain Passability. Remote Sens. 2020, 12, 4146. [Google Scholar] [CrossRef]
  19. Hubáček, M.; Rybansky, M.; Cibulova, K.; Brenov, M.; Ceplova, L. Mapping the Passability of Soils for Vehicle Movement. KVÜÕA Toimetised 2015, 5–18. [Google Scholar]
  20. Jayakumar, P.; Mechergui, D.; Wasfy, T.M. Understanding the Effects of Soil Characteristics on Mobility. In International Design Engineering Technical Conferences and Computers and Information in Engineering Conference; American Society of Mechanical Engineers: New York, NY, USA, 2017. [Google Scholar] [CrossRef]
  21. Rybansky, M. Soil Trafficability Analysis. In Proceedings of the International Conference on Military Technologies (ICMT) 2015, Brno, Czech Republic, 19–21 May 2015; pp. 1–5. [Google Scholar]
  22. Shoop, S.; Knuth, M.; Wieder, W. Measuring Vehicle Impacts on Snow Roads. J. Terramechanics 2013, 50, 63–71. [Google Scholar] [CrossRef]
  23. McCullough, M.; Jayakumar, P.; Dasch, J.; Gorsich, D. The Next Generation NATO Reference Mobility Model Development. J. Terramechanics 2017, 73, 49–60. [Google Scholar] [CrossRef]
  24. Paramsothy, J.; Bradbury, M.; Dasch, J.; Gonzalez, R.; Hodges, H.; Jain, A.; Iagnemma, K.; Letherwood, M.; McCullough, M.; Priddy, J.; et al. Next-Generation NATO Reference Mobility Model (NRMM) Development. J. Terramechanics 2018, 73, 49–60. [Google Scholar]
  25. Gonzalez, R.; Jayakumar, P.; Iagnemma, K. An Efficient Method for Increasing the Accuracy of Mobility Maps for Ground Vehicles. J. Terramechanics 2016, 68, 23–35. [Google Scholar] [CrossRef]
  26. Lessem, A.; Mason, G.; Ahlvin, R. Stochastic Vehicle Mobility Forecasts Using the Nato Reference Mobility Model. J. Terramechanics 1996, 33, 273–280. [Google Scholar] [CrossRef]
  27. Maclaurin, B. Comparing the NRMM (VCI), MMP and VLCI Traction Models. J. Terramechanics 2007, 44, 43–51. [Google Scholar] [CrossRef]
  28. Capek, J.; Hubacek, M.; Kristalova, D.; Mertova, E. Effect of Tree Location Accuracy on Vegetation Passability Analysis. In Proceedings of the 2023 International Conference on Military Technologies (ICMT), Brno, Czech Republic, 23–26 May 2023; pp. 1–6. [Google Scholar]
  29. Talhofer, V.; Hošková-Mayerová, Š. Spatial Data Quality in Multi-Criterial Analysis for Decision Making Process. Adv. Cartogr. GIScience ICA 2019, 1, 1–8. [Google Scholar] [CrossRef]
  30. Rada, J.; Rybansky, M.; Dohnal, F. Influence of Quality of Remote Sensing Data on Vegetation Passability by Terrain Vehicles. ISPRS Int. J. Geo-Inf. 2020, 9, 684. [Google Scholar] [CrossRef]
  31. Mikita, T.; Rybansky, M.; Krausková, D.; Dohnal, F.; Vystavěl, O.; Hollmannová, S. Mapping Forest Parameters to Model the Mobility of Terrain Vehicles. Forests 2024, 15, 1882. [Google Scholar] [CrossRef]
  32. Kristalova, D.; Capek, J.; Adamek, R.; Nohel, J.; Kriz, J. Practical Applicability of Tree Spacing Passability Analysis on Vehicle Path Planning. In Modelling and Simulation for Autonomous Systems; Mazal, J., Fagiolini, A., Vasik, P., Pacillo, F., Bruzzone, A., Pickl, S., Stodola, P., Eds.; Springer Nature: Cham, Switzerland, 2025; pp. 68–91. [Google Scholar]
  33. Sehra, S.; Singh, J.; Rai, H. Assessment of OpenStreetMap Data—A Review. Int. J. Comput. Appl. 2013, 76, 17–20. [Google Scholar]
  34. Borkowska, S.; Bielecka, E.; Pokonieczny, K. OpenStreetMap—Building Data Completeness Visualization in Terms of “Fitness for Purpose”. Adv. Geod. Geoinf. 2023, 72, e35. [Google Scholar] [CrossRef]
  35. Goodchild, M.F.; Li, L. Assuring the Quality of Volunteered Geographic Information. Spat. Stat. 2012, 1, 110–120. [Google Scholar] [CrossRef]
  36. Talhofer, V.; Hošková-Mayerová, Š.; Hofmann, A. Improvement of Digital Geographic Data Quality. Int. J. Prod. Res. 2012, 50, 4846–4859. [Google Scholar] [CrossRef]
  37. Grinberger, A.Y.; Minghini, M.; Juhász, L.; Yeboah, G.; Mooney, P. OSM Science—The Academic Study of the OpenStreetMap Project, Data, Contributors, Community, and Applications. ISPRS Int. J. Geo-Inf. 2022, 11, 230. [Google Scholar] [CrossRef]
  38. Goodchild, M.F.; Gopal, S. (Eds.) The Accuracy of Spatial Databases; CRC Press: London, UK, 1989; ISBN 978-0-429-20831-7. [Google Scholar]
  39. Bank Danych o Lasach. Available online: https://www.bdl.lasy.gov.pl/portal/ (accessed on 20 December 2024).
  40. OpenStreetMap Wiki. Available online: https://wiki.openstreetmap.org/wiki/Main_Page (accessed on 17 July 2018).
  41. STANAG 7163; Vector Map (VMAP) Level 1 2003. NATO Standardization Document: Washington, DC, USA, 2013; unpublished work.
  42. CORINE Land Cover—Copernicus Land Monitoring Service. Available online: http://land.copernicus.eu/pan-european/corine-land-cover (accessed on 1 October 2017).
  43. Rozporządzenie Ministra Rozwoju, Pracy i Technologii z Dnia 23 Lipca 2021 r. w Sprawie Bazy Danych Obiektów Topograficznych Oraz Mapy Zasadniczej. Available online: https://isap.sejm.gov.pl/isap.nsf/DocDetails.xsp?id=WDU20210001385 (accessed on 15 May 2024).
  44. geoportal.gov.pl. Available online: https://mapy.geoportal.gov.pl/imap/Imgp_2.html?gpmap=gp0 (accessed on 15 December 2024).
  45. Geofabrik Download Server. Available online: https://download.geofabrik.de/europe/poland.html (accessed on 15 December 2024).
  46. Pokonieczny, K. Automatic Military Passability Map Generation System. In Proceedings of the 2017 International Conference on Military Technologies (ICMT), Brno, Czech Republic, 31 May–2 June 2017; pp. 285–292. [Google Scholar]
Figure 1. Extent of test area (source: [40]).
Forests 16 00112 g001
Figure 2. Exemplary visualizations of utilized spatial data sources. (a) Vector Map Level 2 (VML2); (b) Topographic Object Database (BDOT10k); (c) OpenStreetMap (OSM); (d) Vector Map Level 1 (VML1); (e) Corine Land Cover (CLC); (f) General Geographic Object Database (BDOO).
Forests 16 00112 g002
Figure 3. Sample land cover parameters for a primary field: (a) area (e.g., forest layer); (b) line (e.g., road layer); (c) point (e.g., building layer); (d) slope.
Forests 16 00112 g003
Figure 4. Conversion of a vector model based on the example of the “built-up area” category.
Forests 16 00112 g004
Figure 5. Sample land cover parameters for a primary field.
Forests 16 00112 g005
Figure 6. A schematic presentation of the operation of the algorithm [13].
Forests 16 00112 g006
Figure 7. (a) Distribution of control points; (b) visualization of data collection for the control point.
Forests 16 00112 g007
Figure 8. The spatial extent of the “forest” layer in the analyzed databases: (a) VML2; (b) BDOT10k; (c) OSM; (d) VML1; (e) CLC; (f) BDOO.
Forests 16 00112 g008
Figure 9. Common area of forest layers across all spatial data sources.
Forests 16 00112 g009
Figure 10. Visualization of the passability maps generated using forest layers from different spatial data sources, with a primary field size of 100 m × 100 m, along with histograms: (a) VML2; (b) BDOT10k; (c) OSM; (d) VML1; (e) CLC; (f) BDOO.
Forests 16 00112 g010aForests 16 00112 g010b
Figure 11. Visualization of passability maps generated using forest layers from different spatial data sources, with a primary field size of 200 m × 200 m, along with histograms: (a) VML2; (b) BDOT10k; (c) OSM; (d) VML1; (e) CLC; (f) BDOO.
Forests 16 00112 g011aForests 16 00112 g011b
Figure 12. Visualization of the passability maps generated using forest layers from different spatial data sources, with a primary field size of 500 m × 500 m, along with histograms: (a) VML2; (b) BDOT10k; (c) OSM; (d) VML1; (e) CLC; (f) BDOO.
Forests 16 00112 g012aForests 16 00112 g012b
Figure 13. Examples of the smallest forest divisions presented at the same scale.
Forests 16 00112 g013
Figure 14. Examples of different methods of generalization for a selected forest fragment in various databases.
Forests 16 00112 g014
Figure 15. Visualization of forest areas omitted in the CLC and VML1 databases compared to the BDOT10k database including a zoomed-in view of a selected area.
Forests 16 00112 g015
Figure 16. A passability map incorporating small forest sub-areas, developed based on forest data from BDOT10k using various primary field sizes.
Forests 16 00112 g016
Figure 17. The change in the average Pearson correlation coefficient depending on the size of the primary field.
Forests 16 00112 g017
Table 1. The parameters of the “forest” layer in the individual spatial databases.
DatabaseArea of Forests [km2]Percentage of Coverage of the Test AreaNo. of Features
BDOO659.7528.02133
BDOT10k638.5527.1212,717
CLC527.6122.40262
OSM610.4925.9211,353
VML1485.9520.6499
VML2502.7721.351272
Total area of the test area2354.94 km2
Table 2. Area of the common forest layer referring to BDOT10k data.
DatabaseArea of the Common Forest Layer Relative to BDOT10k [km2]Percentage of Coverage of the Common Area in Relation to BDOT 10k [%]
BDOO539.3584.5
BDOT10k638.55100.0
CLC475.2574.4
OSM568.0889.0
VML1445.2369.7
VML2471.9073.9
Table 3. The parameters of the distribution and Pearson correlation coefficients for the passability maps with a primary field size of 100 m × 100 m.
AverageStd. Dev.MedianSkewnessPearson Correlation Coefficient
VML2BDOT10kOSMVML1CLCBDOO
VML20.610.160.71−0.7510.9700.9700.9670.9660.944
BDOT10k0.600.170.69−0.66 10.9880.9570.9630.963
OSM0.600.170.69−0.69 10.9590.9660.960
VML10.610.160.71−0.82 10.9610.944
CLC0.610.160.71−0.76 10.951
BDOO0.600.170.70−0.66 1
Table 4. The parameters of the distribution and Pearson correlation coefficients for the passability maps with a primary field size of 200 m × 200 m.
AverageStd. Dev.MedianSkewnessPearson Correlation Coefficient
VML2BDOT10kOSMVML1CLCBDOO
VML20.640.160.71−0.7810.9800.9790.9730.9740.954
BDOT10k0.630.170.69−0.72 10.9920.9660.9720.972
OSM0.640.170.71−0.74 10.9670.9730.969
VML10.640.170.72−0.85 10.9640.949
CLC0.640.170.71−0.80 10.957
BDOO0.630.180.70−0.72 1
Table 5. The parameters of the distribution and Pearson correlation coefficients for the passability maps with a primary field size of 500 m × 500 m.
AverageStd. Dev.MedianSkewnessPearson Correlation Coefficient
VML2BDOT10kOSMVML1CLCBDOO
VML20.620.170.71−0.7710.9880.9870.9830.9830.967
BDOT10k0.610.170.69−0.69 10.9960.9780.9820.984
OSM0.620.180.70−0.72 10.9780.9830.981
VML10.630.170.71−0.85 10.9740.960
CLC0.620.180.71−0.79 10.970
BDOO0.610.180.70−0.69 1
Disclaimer/Publisher’s Note: The statements, opinions and data contained in all publications are solely those of the individual author(s) and contributor(s) and not of MDPI and/or the editor(s). MDPI and/or the editor(s) disclaim responsibility for any injury to people or property resulting from any ideas, methods, instructions or products referred to in the content.

