Abstract
Vegetation restoration has played a significant role in preventing soil erosion and enhancing soil carbon sequestration in the hilly regions of subtropical China. However, under long-term vegetation restoration, it remains unclear how soil organic carbon and nitrogen components synergistically change and whether their dynamics are consistent across different soil depths. This study investigates the soils of four major vegetation types in subtropical hilly regions: enclosed Masson pine forest (EMP), Masson pine forest (MP), slash pine forest (SP), and mixed broadleaf–conifer forest (MBC). Soil organic carbon (SOC) components, nitrogen components, and physicochemical properties were analyzed across different soil depths (0–100 cm) under these vegetation restoration types. Results showed that forest type significantly influenced SOC stability. The MBC exhibited the highest mineral-associated organic carbon (MAOC) content, indicating the highest SOC stability. Both the MBC and SP forests sequestered more iron-aluminum-bound organic carbon (FeOC) and less Ca-associated organic carbon (CaOC) compared to the other forest types. The dominance of FeOC over CaOC in these acidic soils highlights the critical role of iron-aluminum oxides in SOCSOC stabilization. Vegetation restoration significantly influenced the relationship between SOC and nitrogen components in the topsoil (0–20 cm), but this effect diminished in the subsoil (>20 cm). This study confirmed the depth-dependent impacts of long-term vegetation restoration on soil carbon stability and C/N stoichiometry in subtropical plantations. Targeted vegetation restoration strategies can improve SOC stability in subtropical plantations.
1. Introduction
The composition, morphology, and stability of soil organic carbon (SOC) are key factors determining soil carbon processes [1,2]. SOC can be divided into particulate organic carbon (POC) and mineral-associated organic carbon (MAOC), which helps us to better understand the formation, stability, and functionality of SOC [2]. Table 1 shows the key characteristics and differences between POC and MAOC. The availability of soil nitrogen affects the productivity of forest ecosystems and soil microbial communities, and the rate of soil carbon cycling is directly related to nitrogen availability and controlled by environmental C/N ratio [3]. Changes in the coupling of soil carbon and nitrogen can affect microbial activity, soil structural stability, and vegetation, thereby influencing soil carbon storage [4,5]. Therefore, a deeper understanding of the synergistic changes between carbon and nitrogen in forest soils can help optimize soil management measures and improve the productivity and sustainability of forest ecosystems.

Table 1.
Key characteristics and differences between particulate organic carbon (POC) and mineral-associated organic carbon (MAOC) in soil.
Vegetation restoration promotes the formation of POC and MAOC, thereby enhancing soil carbon storage. POC is a more effective indicator of short-term SOC changes, while MAOC reflects the resistance of SOC to decomposition and microbial utilization [13]. In the Mata region of Minas Gerais, Brazil, compared to areas without vegetation cover, the POC storage in the original forest soil increased by 2.9 times, and the MAOC storage increased by 2.7 times [14]. Furthermore, vegetation restoration is beneficial for increasing soil nitrogen content, thereby affecting soil carbon cycling. In the subtropical karst region, the total nitrogen (TN) content in artificial forest topsoil (0–5 cm) increased by 21.30% compared to uncultivated land without vegetation restoration; the inorganic carbon content increased by 34.5% [15]. In Changsha County, Hunan Province, after 90 years of vegetation restoration, the content of TN, organic nitrogen, ammonium nitrogen (NH4), and nitrate nitrogen (NO3) increased by 2.7, 3.3, 1.2, and 1.3 times, respectively [16]. Therefore, the impact of vegetation restoration on the content and composition of soil organic carbon and soil nitrogen is of great significance.
Nitrogen addition or enrichment can increase vegetation primary productivity, improve the utilization rate of microbial carbon, and enhance the formation of stable SOC [17,18,19]. However, these findings and mechanisms have primarily been observed in topsoil (0–30 cm). In contrast, SOC in the subsoil (30–100 cm) initially increased with nitrogen addition but decreased over time [20]. Similarly, nitrogen-fixing tree species also promoted the storage of SOC in topsoil in various forests [21,22]. A meta-analysis of carbon age distribution over 55 tropical grassland and forest soil profiles showed that recent carbon (less than 50 years) represents 45% of topsoil carbon (0–30 cm) and 13% of deep carbon (30–100 cm) [23]. Globally, the median depth of recent carbon incorporation into mineral soil is 10 cm. This indicates that the effects of vegetation restoration on SOC content and composition are depth-dependent, with distinct mechanisms operating in topsoil and subsoil.
Large-scale deforestation in China before the 1980s led to the transformation of dominant vegetation into grasslands and shrublands, exacerbating soil erosion and degradation [24]. Therefore, extensive afforestation has been carried out since 1983 to restore soil ecological functions [25]. Vegetation restoration is known to influence SOC and nitrogen dynamics, yet it remains unclear how these processes vary with soil depth. We hypothesize that the synergistic changes of SOC and nitrogen components exhibit depth dependency under long-term vegetation restoration. This study aims to: (1) evaluate the distribution of SOC and nitrogen components across the soil profile under different vegetation restoration contexts; and (2) analyze the depth-dependent differences in the synergistic relationships between SOC and nitrogen components. This study seeks to provide new insights into soil carbon and nitrogen cycling processes under long-term vegetation restoration, contributing to improved soil management and carbon sequestration strategies.
2. Materials and Methods
2.1. Study Area
The study area is situated in the Qianyanzhou ecological station, a national field science observatory of red soil hills in Jiangxi Province (26°44′52″ N, 115°03′47″ E) (Figure 1). The station is one of the sites of the China Ecosystem Research Network (CERN) and China Flux. It is a typical red soil hilly region in southern China. According to the FAO World Reference Base for Soil Resources, the soil in the study area is classified as Acrisols, while in the USDA Soil Taxonomy, it is classified as Ultisols. These soils have developed on purple-red sandstone, conglomerate, and shale. The pH of the soil ranges from 4.4 to 6.5, and the bulk density ranges from 1.21 to 1.72 g cm−3. The climate in this area is classified as Cfa (humid subtropical climate) under the Köppen–Geiger climate classification system. It is characterized by an average annual temperature of 17.9 degrees Celsius, average annual precipitation of 1489 mm, and a shallow groundwater depth of about 3.43 m (ranging from 1.17 to 5.99 m). Originally, the area was covered by subtropical evergreen broad-leaved forest, but in the 1980s, it suffered from severe deforestation, resulting in grassland and shrubs becoming the dominant vegetation, without any other tree species, causing serious soil degradation. Since 1983, large-scale afforestation has been carried out to restore the degraded soil. Slash pine (Pinus elliottii) and Masson pine (Pinus massoniana) are the dominant conifer species, while Schima superba, Dalbergia hupeana, and Vernicia fordii are the main broad-leaved tree species.
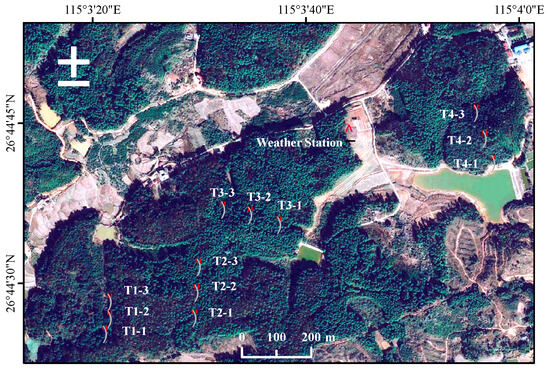
Figure 1.
Monitoring plots established at Qianyanzhou station.
2.2. Experimental Design
At the Qianyanzhou ecological station, mixed broadleaf–conifer forest, Masson pine forest, and slash pine forest accounted for 93.2% of the total forest area [26]. To enhance the representativeness of the sampling points, four dominant vegetation types were selected as the research subjects, including enclosed Masson pine forest (EMP), Masson pine forest (MP), slash pine forest (SP), and mixed broadleaf–conifer forest (MBC). The mean SOC contents in soil profiles of EMP, MP, SP, and MBC were 10.66, 9.61, 9.41, and 10.86 g kg−1 in 1999, respectively [27]. Three plots were set on each vegetation type on the hilltop, slope, and valley, totaling 12 plots (Figure 1). The distance between each forest type was at least 200 m to ensure independence among the plots. Each plot measured 20 m × 20 m. The vegetation survey of each plot was conducted in August 2019, with the basic information presented in Table 2. The total biomass of arbor trees was estimated using the allometric growth equation, which accounts for both aboveground and belowground biomass.
Table 2.
Basic information of trees in different forest types.
Three positions were randomly selected within each plot. After removing surface litter and herbaceous plants, soil samples were collected using a soil auger (0–5 cm, 5–10 cm, 10–20 cm, 20–40 cm, 40–80 cm, 80–100 cm) and placed in sealed bags. All soil samples were air-dried naturally, sieved through a 2 mm mesh, and stored for subsequent analysis.
2.3. Methods for Sample Analysis
2.3.1. Determination of Soil Physicochemical Properties
Soil bulk density (BD) was determined using the core method with a cylinder of 100 cm3 volume; soil moisture content was determined using the thermogravimetric method with a convective oven-drying [28]. Soil pH and electrical conductivity (EC) were measured using the electrometric method with a portable water quality analyzer (Ultrameter model 6PIIPFC serial number 6287593, Myron L Company, Carlsbad, CA, USA) under the condition of a soil-to-water ratio of 1:2.5 [29].
2.3.2. Determination of Soil Carbon and Nitrogen Content
Air-dried soil was ground through a 0.25 mm sieve using a ball mill, and the soil total nitrogen (TN) was measured using dumas combustion method with a Vario MAX carbon nitrogen analyzer (Elementar, Langenselbold, Germany) [28]. NH4+ and NO3− were extracted with a 1 mol L–1 KCl solution (soil to liquid mass ratio of 1:5), and then measured using colorimetric method with a segmented flow analyzer (AA3, Bran Luebbe, Hamburg, Germany). The content of available nitrogen (AN) was calculated using the summation method for NH4+ and NO3−.
Soil particles were classified into three size fractions based on USDA soil texture classification system for testing the content of particulate organic carbon: sand size (53–2000 μm), silt size (2–53 μm), and clay size (<2 μm) [30]. The main steps of the measurement were as follows: first, 10 g of air-dried soil was weighed and poured into a 250 mL beaker, and 100 mL of water was added. The mixture was treated with an ultrasonic generator for 60 min, and the solution was filtered through a 53 μm sieve to obtain the sand fraction. Then, the silt fraction with a particle size of 2–53 μm (550 r min−1, 2 min) and the clay fraction with a particle size <2 μm (5000 r min−1, 10 min) was separated according to different centrifugation times and speeds [30,31]. Finally, the three SOC contents were determined using dry combustion method with Vario MAX carbon nitrogen analyzer (Elementar, Germany) [28]. Moreover, sand-associated SOC (53–2000 μm) is referred to as POC, while silt- and clay-associated SOC (<53 μm) is referred to as MAOC [6,30].
2.3.3. Extraction and Determination of Mineral-Associated Organic Carbon
First, heavy liquid (hydrobromic acid) with a relative density of 1.7–1.8 g cm−3 was used to remove light organic carbon from the soil [32]. Then, sodium sulfate solution (0.5 mol L−1) was added to the remaining reconstituted soil, followed by 20 min of ultrasonic treatment. The samples were centrifuged at 3000 rpm for 10 min after centrifugation, and the upper liquid was collected. Centrifugation was repeated several times until there was no Ca2+ reaction in the leachate, indicating the completion of calcium-bound organic carbon (CaOC) extraction [33]. A mixed solution of sodium hydroxide and sodium pyrophosphate (0.1 mol L−1) was then added to the remaining soil, shaken, and left overnight. The next day, the solution was centrifuged at 3000 rpm for 15 min, and the upper liquid was collected. This process was repeated several times until the upper solution was nearly colorless, indicating the completion of iron-aluminum-bound organic carbon (FeOC) extraction [34,35,36]. Finally, the contents of CaOC and FeOC in the leachate were determined using high-temperature combustion method with a total organic carbon analyzer (Elementar, Germany) [28].
2.4. Statistical Analysis
Data analysis and graph construction were performed using SPSS 21 (IBM Corp., Armonk, NY, USA), MATLAB 2021b (MathWorks, Natick, MA, USA) and R (version 4.2.1; R Core Team, Vienna, Austria) in RStudio (version 2024.09.1, RStudio, PBC, Boston, MA, USA). Differences in soil carbon and nitrogen content, as well as soil physicochemical properties, under different vegetation restoration scenarios were evaluated using one-way analysis of variance (ANOVA). Prior to performing ANOVA, the Shapiro–Wilk test was used to assess the normality of the data distribution, and Levene’s test was applied to confirm homogeneity of variances. For non-normal data, non-parametric Kruskal–Wallis tests were used as alternatives. The relationship between carbon, nitrogen, and soil physicochemical properties was analyzed using Pearson correlation. The analysis was performed in R with the corrplot package [37]. Pearson’s correlation coefficients were calculated with a two-tailed significance test (p < 0.05) to determine the strength and significance of the relationships. Redundancy analysis (RDA) was conducted using soil carbon content and its components as dependent variables, and other physicochemical properties as independent variables. Graphs were constructed using MATLAB 2021b to visualize the data.
3. Results
3.1. Variations in Soil Physicochemical Properties Across Soil Depths
Different vegetation restoration types significantly influence soil physical properties, particularly soil texture, BD, and EC (Figure 2). Except for the MBC, the soil pH trends with depth were consistent across the other three forest types. In the MBC, soil pH increased more rapidly with depth, with pH values below 40 cm being significantly higher than those of the other three forest types. The soil EC in all forestlands decreased significantly with depth, with a particularly rapid decline observed in the 0–20 cm soil layer. The average EC of the Masson pine forest soil profile (37.05 µS cm−1) was the highest in all forest types (p < 0.01). Soil BD increased consistently with depth across all forest types. The Masson pine forest exhibited the lowest average BD (1.30 g cm−3) (p < 0.01). All forest types displayed distinct vertical stratification in soil texture. The average sand content in the soil profile ranked from highest to lowest as follows: MP > EMP > MBC > SP. Conversely, the average silt content followed the reverse order of sand content. The clay content in the topsoil of MP and EMP is significantly lower than that of the other two forest types. The MP had the lowest silt content and BD, while the SP exhibited the highest silt and clay contents.
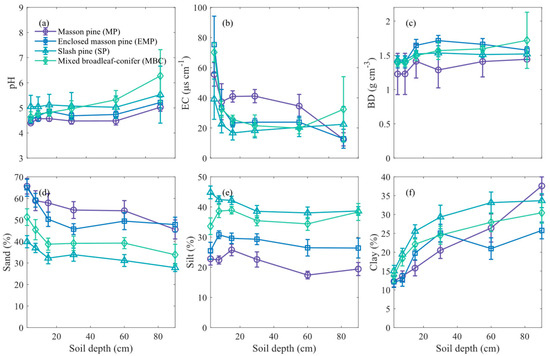
Figure 2.
Differences in soil physicochemical properties among different soil layers of various forest types. Subfigures show the dynamics of (a) pH, (b) electrical conductivity (EC), (c) soil bulk density (BD), (d) sand content, (e) silt content, and (f) clay content with soil depth. Error bars indicate standard deviation across replicates.
3.2. Distribution Characteristics of Carbon and Nitrogen Content in Soil Profile
3.2.1. Distribution of Carbon Forms in Soil
The SOC, POC, and MAOC contents in all four types of forestlands decreased significantly with increasing soil depth (p < 0.01). The highest carbon content was observed in the 0–5 cm soil layer, with a rapid decline in the 0–20 cm layer, followed by a gradual decrease and stabilization in deeper layers (Figure 3). Across different forest types, SOC and POC showed no significant differences across all soil layers (p > 0.05). However, the MAOC content in the 10–80 cm soil layers of MBC was significantly higher than that in the other three forest types (p < 0.01). Throughout the soil profile, the proportions of MAOC to SOC in EMP, MP, MBC, and SP were 63.6%, 56.3%, 65.5%, and 53.8%, respectively. The MAOC/POC ratio in the soil profile is consistently greater than 1 and significantly increases in the 0–20 cm topsoil layer (Figure 3d). Below 20 cm, the MAOC/POC ratio in SP and MBC forest soils is significantly higher than that in MP and EMP (p < 0.01). The MAOC was the dominant component of SOC in all forests.
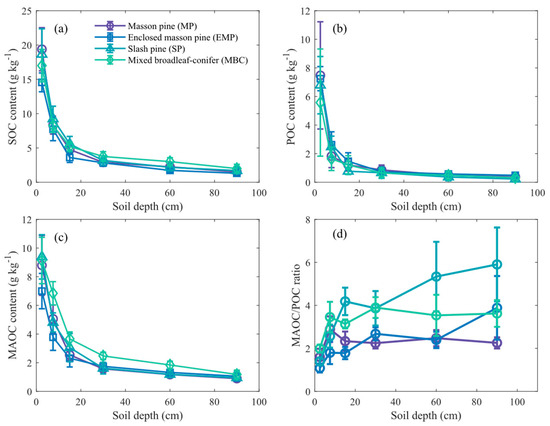
Figure 3.
The distribution characteristics of various forms of soil organic carbon (SOC) content in the soil profile in four plantations. Subfigures show (a) SOC content, (b) particulate organic carbon (POC) content, (c) mineral-associated organic carbon (MAOC) content, and (d) the ratio of MAOC to POC. Error bars indicate standard deviation across replicates.
The FeOC was the dominant form of MAOC, displaying a decreasing trend with increasing soil depth (Figure 4). The average FeOC content in MP, EMP, SP, and MBC forest was 5.3, 5.4, 12.4, and 7.4 times that of CaOC, respectively. Additionally, in the topsoil (0–20 cm), the FeOC content in the SP was significantly higher than in other forests (p < 0.05). The CaOC content in the soil followed the order: EMP > MP > MBC > SP (Figure 4b). Moreover, the ratios of FeOC/MAOC and CaOC/MAOC both showed significant increases (p < 0.01). Overall, there were no significant differences in FeOC and CaOC contents between EMP and MP. The CaOC/MAOC ratio in EMP and MP was significantly higher than that in SP and MBC (p < 0.05).
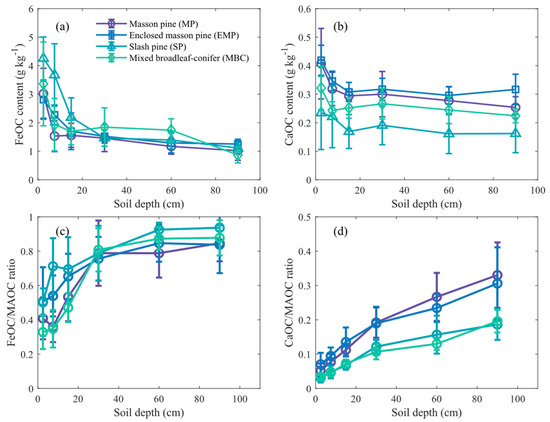
Figure 4.
The distribution characteristics of various forms of mineral-associated organic carbon (MAOC) content in the soil profile in four plantations. Subfigures show (a) iron-aluminum-bound organic carbon (FeOC) content, (b) calcium-bound organic carbon (CaOC) content, (c) the ratio of FeOC to mineral-associated organic carbon (MAOC), and (d) the ratio of CaOC to MAOC. Error bars indicate standard deviation across replicates.
3.2.2. Distribution of Nitrogen Forms in Soil
As shown in Figure 5, the contents of TN, AN, NH4+, and NO3− all decrease with increasing soil depth. The average AN content of soil profile ranks from highest to lowest as follows: MBC (3.32 mg kg−1), MP (2.80 mg kg−1), EMP (2.76 mg kg−1), and SP (2.59 mg kg−1). The NH4+ content was the predominant form of AN across all forest types, and there were no significant differences in the NH4+ content among soil profiles of different forest types. The NO3− content in topsoil (0–20 cm) in MBC is significantly higher than that in other forests (p < 0.05).
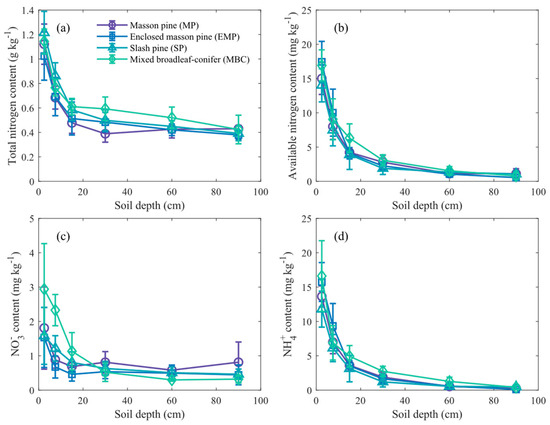
Figure 5.
The contents of four nitrogen forms in soil layers of various forest types. Subfigures show (a) total nitrogen content, (b) available nitrogen content, (c) nitrate nitrogen (NO3−) content, and (d) ammonium nitrogen (NH4+) content. Error bars indicate standard deviation across replicates.
3.3. The Relationship Between Soil Carbon and Nitrogen Contents and Physicochemical Properties Under Different Vegetation Restoration
Due to the observed decrease in various forms of carbon and nitrogen content with increasing soil depth, which is particularly significant in the 0–20 cm layer, we divided the soil into two groups based on depth: topsoil (0–20 cm) and subsoil (>20 cm). Correlation analysis revealed distinct differences between topsoil and subsoil, with stronger correlations observed among the physicochemical properties in the topsoil (Figure 6). Specifically, in the topsoil, TN, NH4+, SOC, POC, MAOC, and FeOC were all significantly positively correlated (p < 0.05). However, the NO3− showed significant positive correlations only with SOC and MAOC. Among the physicochemical properties, NH4+ was significantly positively correlated with sand and EC, but significantly negatively correlated with clay and BD. Additionally, SOC, POC, MAOC, FeOC, and CaOC were all significantly negatively correlated with clay and significantly positively correlated with EC (p < 0.05).
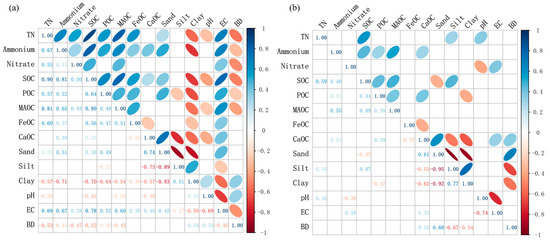
Figure 6.
Pearson correlation coefficients among carbon and nitrogen contents and soil electrochemical properties in the topsoil layer (0–20 cm, (a)) and the subsoil layer (>20 cm, (b)). Blank cells indicate non-significant results, while all other results passed the significance test at p < 0.05.
In the subsoil, NH4+, SOC, and POC remained significantly positively correlated, while the correlations of NO3− and MAOC with other carbon and nitrogen components were not significant. Furthermore, except for CaOC, the correlations between physicochemical properties (such as sand, clay, EC, and BD) and other soil carbon and nitrogen components were not significant in the subsoil. In both topsoil and subsoil, CaOC was significantly negatively correlated with FeOC, silt, and clay, and significantly positively correlated with sand and EC.
The results of the RDA analysis indicate that the two main axes for surface and subsoil in the four forest types explain 83.57% and 72.27% of the variation in soil carbon content and its components, respectively, reflecting a high explanatory capacity (Figure 7). The sample points of different forest types show a certain degree of separation, with EMP and MP being closely clustered in both topsoil and subsoil, while SP and MBC exhibit similar distributions. Among the specific indicators, soil structure (sand, silt, and clay) emerges as the dominant factor driving changes in soil carbon content and its components. Additionally, TN, NO3−, and pH contribute primarily to RDA2 in topsoil, while EC, BD, and NH4+ contribute significantly to RDA1. In subsoil, the contributions of TN, NO3−, pH, EC, BD, and NH4+ to the two axes are noticeably reduced, with soil structure playing an increasingly prominent role as the primary driving factor.
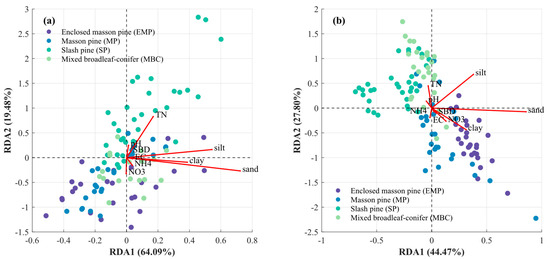
Figure 7.
Two-dimensional ordination plot of redundancy analysis between soil carbon and nitrogen contents, and soil physicochemical properties in the topsoil layer (0–20 cm, (a)) and the subsoil layer (>20 cm, (b)).
4. Discussion
4.1. Distribution Characteristics of Carbon and Nitrogen Content Under Different Vegetation Restoration Scenarios
Studies have shown that different vegetation restoration practices have a significant impact on the size of the POC and MAOC pools [14]. Although the differences in soil carbon and nitrogen content and their components among forest land types in our study are much smaller than the variations observed across different ecosystem types (e.g., forests versus grasslands), our findings reveal subtle distinctions among forest types within a more complex network of carbon and nitrogen composition indicators. Specifically, the MBC forest exhibited the highest MAOC content (Figure 2c), suggesting that MBC is beneficial for enhancing soil carbon stability. Broadleaf tree species produce more litter with a higher nutrient content, decompose faster, and release more carbon into the soil compared to coniferous species [38]. Additionally, the topsoil in MBC forests showed significantly higher NO3− content compared to other forest types, and NO3− content was positively correlated with SOC and MAOC. A previous study found that compared to coniferous litter, broadleaf tree species increased the release of nitrogen by more than 20%, and this effect was more pronounced in nutrient-poor soils of plantation forests [39]. Similarly, the Microbial Efficiency-Matrix Stabilization (MEMS) framework was proposed to illustrate the contribution of microbes to SOC [9]. This framework leads to the hypothesis that labile plant constituents are the dominant source of microbial products, relative to input rates, because they are utilized more efficiently by microbes. These microbial products of decomposition would thus become the main precursors of stable SOM by promoting aggregation and through strong chemical bonding to the mineral soil matrix [9]. This result aligns with studies indicating that increased soil nitrogen content promotes SOC storage [40]. Mechanisms for increasing soil nitrogen in these studies often include intercropping with nitrogen-fixing tree species, intensified nitrogen deposition, or artificial nitrogen fertilization [41,42]. Nitrogen-rich compounds, such as proteins and amino acids derived from microbial and plant sources, have strong affinities for mineral surfaces [10]. These compounds can form organo-mineral complexes through cation bridging or direct sorption onto mineral surfaces, enhancing MAOC stabilization [10,19,43]. In our study, the mixed forest exhibited the largest biomass of broadleaf trees and the highest biodiversity index, which enhanced litter quality, microbial activity, and nitrogen cycling, thereby promoting MAOC formation and stabilization.
Furthermore, redundancy analysis of the soil carbon–nitrogen relationship showed similarities between EMP and MP as well as SP and MBC in both topsoil and subsoil (Figure 7). This indicates that tree species have differential impacts on soil carbon and nitrogen content and composition. Significant effects of different vegetation types on soil carbon, nitrogen content, and pH have also been observed in forests with a temperate continental climate [44]. These differences are particularly evident in topsoil indicators such as MAOC, MAOC/POC ratio, FeOC, CaOC, NO3−, and soil structure. Therefore, for vegetation restoration and species configuration in subtropical red soil regions, targeted selection of mixed-species plantations is beneficial for improving soil properties comprehensively. For instance, incorporating more slash pine into mixed forests could increase the proportion of MAOC and FeOC, thereby enhancing the stability of soil carbon pools.
4.2. Depth-Dependent Differences in the Synergistic Relationships Between SOC and Nitrogen Components
In the coupling relationship between soil carbon and nitrogen, topsoil exhibits a strong positive correlation, whereas the correlation between carbon and nitrogen content and their components weakens or disappears in deeper soils (Figure 6). The C/N ratio in topsoil ranges from 8.8 to 19.3, indicating an ecosystem with balanced carbon and nitrogen supply and demand [45,46]. In contrast, the C/N ratio in deeper soils ranges from 3.8 to 8.4, suggesting relatively abundant nitrogen availability. These results indicate that carbon and nitrogen cycling tends to decouple in deeper soils, with nitrogen likely lost through processes such as nitrification or denitrification [47].
The MAOC/POC ratio was far greater than 1 and increased with soil depth, indicating that SOC in the four forest land types primarily exists in the form of mineral-associated organic matter. This suggests high microbial activity in the soil, with the soil carbon sink largely determined by limitations in carbon input [47]. The critical role of iron-aluminum oxides in storing SOC has been widely recognized through analyses of FeOC content [1,48]. In subtropical red soil regions, soils are acidic or strongly acidic, and prolonged silicate leaching has led to soils rich in iron and aluminum oxides [49]. When exogenous carbon is introduced into iron- and aluminum-rich soil, it is stabilized through adsorption or co-precipitation with iron and aluminum oxides, reducing its bioavailability. The high FeOC content in the soils of this study supports the hypothesis that mineral-associated organic matter becomes increasingly important for SOC stabilization at greater depths, where organic inputs are limited, and microbial activity is constrained.
The observed depth-dependent differences in the coupling between SOC and nitrogen components can be attributed to variations in soil properties and microbial processes across the soil profile. In the topsoil, the strong positive correlation between SOC and nitrogen may primarily drive by high microbial activity and the rapid turnover of organic matter [16,39]. The topsoil receives continuous organic inputs from litterfall, root exudates, and microbial residues, which are rich in both carbon and nitrogen. These inputs promote synchronized cycling of SOC and nitrogen, as microbes require a balanced supply of both elements for metabolism and the formation of stable MAOC [8,9].This synergistic relationship is also reflected in the relatively balanced C/N ratios in the topsoil, which support efficient microbial activity and nutrient cycling. In contrast, the decoupling of carbon and nitrogen cycling in deeper soils reflects a shift in the dominant processes governing SOC and nitrogen dynamics. This decoupling effect can be attributed to the unique microbial and nutrient dynamics at depth, where SOC stabilization mechanisms shift towards mineral interactions rather than organic matter turnover [20]. The lower C/N ratios in deeper soils indicate an ecosystem where carbon inputs are insufficient to sustain strong coupling between SOC and nitrogen components.
5. Conclusions
This study highlights the depth-dependent impacts of long-term vegetation restoration on soil carbon stability in sub-tropical plantations. Key findings include: (1) Vegetation restoration pattern significantly influenced SOC stability and components. Mixed broadleaf–conifer forests significantly improve SOC stability, with higher MAOC content compared to coniferous forests. (2) Depth-dependent differences in the synergistic relationships between SOC and nitrogen components were confirmed. Topsoil (0–20 cm) exhibited stronger carbon–nitrogen coupling and greater SOC and MAOC content compared to subsoil. These findings suggest that the strategic selection of vegetation restoration types can help enhance soil carbon stability. This study also underscores the need to assess SOC–nitrogen dynamics across soil profiles to fully understand the implications of nutrient inputs on carbon stabilization.
Author Contributions
Conceptualization, X.S., L.Y., H.N. and S.L.; methodology, X.S. and L.Y.; formal analysis, X.S. and H.N.; investigation, X.S., L.Y., H.N., S.L. and J.W.; visualization, X.S.; writing—original draft, X.S.; writing—review and editing, L.Y. and S.L.; funding acquisition, X.S. and S.L.; validation, J.W.; resources, J.W.; project administration, J.W.; data curation, L.Y. and H.N. All authors have read and agreed to the published version of the manuscript.
Funding
This work was supported by the National Natural Science Foundation of China (42301042, 42171035, 42077302).
Data Availability Statement
The data presented in this study are available on request from the corresponding author due to legal.
Acknowledgments
We gratefully acknowledge the support and assistance of the Qianyanzhou Experimental Station of Red Soil and Hilly Land, Chinese Academy of Sciences, and the Puding Karst Ecosystem Research Station-China in enabling this research work.
Conflicts of Interest
The authors state that the research was carried out without any financial or commercial relationships that would be seen as potential conflicts of interest.
References
- Wan, D.; Ye, T.; Lu, Y.; Chen, W.; Cai, P.; Huang, Q. Iron oxides selectively stabilize plant-derived polysaccharides and aliphatic compounds in agricultural soils. Eur. J. Soil. Sci. 2019, 70, 1153–1163. [Google Scholar] [CrossRef]
- Lavallee, J.M.; Soong, J.L.; Cotrufo, M.F. Conceptualizing soil organic matter into particulate and mineral-associated forms to address global change in the 21st century. Glob. Change Biol. 2020, 26, 261–273. [Google Scholar] [CrossRef]
- Gärdenäs, A.I.; Ågren, G.I.; Bird, J.A.; Clarholm, M.; Hallin, S.; Ineson, P.; Kätterer, T.; Knicker, H.; Nilsson, S.I.; Näsholm, T.; et al. Knowledge gaps in soil carbon and nitrogen interactions—From molecular to global scale. Soil Biol. Biochem. 2011, 43, 702–717. [Google Scholar] [CrossRef]
- Jian, S.; Li, J.; Chen, J.; Wang, G.; Mayes, M.A.; Dzantor, K.E.; Hui, D.; Luo, Y. Soil extracellular enzyme activities, soil carbon and nitrogen storage under nitrogen fertilization: A meta-analysis. Soil Biol. Biochem. 2016, 101, 32–43. [Google Scholar] [CrossRef]
- Tian, D.; Niu, S. A global analysis of soil acidification caused by nitrogen addition. Environ. Res. Lett. 2015, 10, 024019. [Google Scholar] [CrossRef]
- Six, J.; Conant, R.T.; Paul, E.A.; Paustian, K. Stabilization mechanisms of soil organic matter: Implications for C-saturation of soils. Plant Soil 2002, 241, 155–176. [Google Scholar] [CrossRef]
- Schmidt, M.W.; Torn, M.S.; Abiven, S.; Dittmar, T.; Guggenberger, G.; Janssens, I.A.; Kleber, M.; Kogel-Knabner, I.; Lehmann, J.; Manning, D.A.; et al. Persistence of soil organic matter as an ecosystem property. Nature 2011, 478, 49–56. [Google Scholar] [CrossRef]
- Cotrufo, M.F.; Soong, J.L.; Horton, A.J.; Campbell, E.E.; Haddix, M.L.; Wall, D.H.; Parton, W.J. Formation of soil organic matter via biochemical and physical pathways of litter mass loss. Nat. Geosci. 2015, 8, 776–779. [Google Scholar] [CrossRef]
- Cotrufo, M.F.; Wallenstein, M.D.; Boot, C.M.; Denef, K.; Paul, E. The Microbial Efficiency-Matrix Stabilization (MEMS) framework integrates plant litter decomposition with soil organic matter stabilization: Do labile plant inputs form stable soil organic matter? Glob. Change Biol. 2013, 19, 988–995. [Google Scholar] [CrossRef]
- Lehmann, J.; Kleber, M. The contentious nature of soil organic matter. Nature 2015, 528, 60–68. [Google Scholar] [CrossRef]
- Cambardella, C.A.; Elliott, E.T. Particulate soil organic-matter changes across a grassland cultivation sequence. Soil. Sci. Soc. Am. J. 1992, 56, 777–783. [Google Scholar] [CrossRef]
- Tisdall, J.M.; Oades, J.M. Organic matter and water-stable aggregates in soils. J. Soil. Sci. 2006, 33, 141–163. [Google Scholar] [CrossRef]
- Rocci, K.S.; Lavallee, J.M.; Stewart, C.E.; Cotrufo, M.F. Soil organic carbon response to global environmental change depends on its distribution between mineral-associated and particulate organic matter: A meta-analysis. Sci. Total Environ. 2021, 793, 148569. [Google Scholar] [CrossRef]
- de Almeida Valente, F.D.; de Castro, M.F.; Lustosa Filho, J.F.; Gomes, L.d.C.; Neves, J.C.L.; da Silva, I.R.; de Oliveira, T.S. Native multispecies and fast-growing forest root biomass increase C and N stocks in a reclaimed bauxite mining area. Environ. Monit. Assess. 2023, 195, 129. [Google Scholar] [CrossRef]
- Hu, P.; Zhang, W.; Xiao, L.; Yang, R.; Xiao, D.; Zhao, J.; Wang, W.; Chen, H.; Wang, K. Moss-dominated biological soil crusts modulate soil nitrogen following vegetation restoration in a subtropical karst region. Geoderma 2019, 352, 70–79. [Google Scholar] [CrossRef]
- Zhu, X.; Fang, X.; Xiang, W.; Chen, L.; Ouyang, S.; Lei, P. Vegetation restoration drives dynamics of soil nitrogen content and availability in the subtropics. Catena 2023, 220, 106720. [Google Scholar] [CrossRef]
- Chen, J.; Luo, Y.; van Groenigen, K.J.; Hungate, B.A.; Cao, J.; Zhou, X.; Wang, R.-w. A keystone microbial enzyme for nitrogen control of soil carbon storage. Sci. Adv. 2018, 4, eaaq1689. [Google Scholar] [CrossRef]
- Xu, C.; Xu, X.; Ju, C.; Chen, H.Y.H.; Wilsey, B.J.; Luo, Y.; Fan, W. Long-term, amplified responses of soil organic carbon to nitrogen addition worldwide. Glob. Change Biol. 2021, 27, 1170–1180. [Google Scholar] [CrossRef]
- Ye, C.; Chen, D.; Hall, S.J.; Pan, S.; Yan, X.; Bai, T.; Guo, H.; Zhang, Y.; Bai, Y.; Hu, S. Reconciling multiple impacts of nitrogen enrichment on soil carbon: Plant, microbial and geochemical controls. Ecol. Lett. 2018, 21, 1162–1173. [Google Scholar] [CrossRef]
- Hu, Y.; Deng, Q.; Katterer, T.; Olesen, J.E.; Ying, S.C.; Ochoa-Hueso, R.; Mueller, C.W.; Weintraub, M.N.; Chen, J. Depth-dependent responses of soil organic carbon under nitrogen deposition. Glob. Change Biol. 2024, 30, e17247. [Google Scholar] [CrossRef] [PubMed]
- Yang, H.; Liu, S.; Wang, J.; Schuler, J.; Wang, Y.; Luan, J. Nitrogen-fixing plants enhance and stabilize rhizospheric soil organic carbon in tropical rainforests, Hainan Island, China. Forest Sci. 2023, 69, 653–664. [Google Scholar] [CrossRef]
- Zhang, W.; You, Y.; Su, X.; Yan, J.; Gao, G.; Ming, A.; Shen, W.; Huang, X. Introducing N2-fixing tree species into Eucalyptus plantations promotes soil organic carbon sequestration in aggregates by increasing microbial carbon use efficiency. Catena 2023, 231, 107321. [Google Scholar] [CrossRef]
- Balesdent, J.; Basile-Doelsch, I.; Chadoeuf, J.; Cornu, S.; Derrien, D.; Fekiacova, Z.; Hatte, C. Atmosphere-soil carbon transfer as a function of soil depth. Nature 2018, 559, 599–602. [Google Scholar] [CrossRef]
- Ma, Z.; Wang, H.; Yang, F.; Fu, X.; Fang, H.; Wang, J.; Dai, X.; Kou, L.; Zhao, B. Ecological restoration and sustainable development of forest ecosystem in subtropical red soil hilly region based on long-term observation and research. Bull. Chin. Acad. Sci. 2020, 35, 1525–1536. [Google Scholar]
- Yang, F.; Feng, Z.; Wang, H.; Dai, X.; Fu, X. Deep soil water extraction helps to drought avoidance but shallow soil water uptake during dry season controls the inter-annual variation in tree growth in four subtropical plantations. Agr. Forest Meteorol. 2017, 234, 106–114. [Google Scholar] [CrossRef]
- Gao, Y.; He, N.; Yu, G.; Chen, W.; Wang, Q. Long-term effects of different land use types on C, N, and P stoichiometry and storage in subtropical ecosystems: A case study in China. Ecol. Eng. 2014, 67, 171–181. [Google Scholar] [CrossRef]
- Yuan, X.H. The Effects of Land Use Change on the Storage of Organic Carbon for the Land Ecosystems in Red Earth Hilly Area of China; Chinese Academy of Sciences: Beijing, China, 1999. [Google Scholar]
- Carter, M.R.; Gregorich, E.G. Soil Sampling and Methods of Analysis, 2nd ed.; CRC Press: Boca Raton, FL, USA, 2007. [Google Scholar]
- Sonmez, S.; Buyuktas, D.; Okturen, F.; Citak, S. Assessment of different soil to water ratios (1:1, 1:2.5, 1:5) in soil salinity studies. Geoderma 2008, 144, 361–369. [Google Scholar] [CrossRef]
- Wu, T.Y.; Schoenau, J.J.; Li, F.M.; Qian, P.Y.; Wang, F.; Malhi, S.S. Soil particle size fractionation with centrifugation method. Chin. J. Appl. Ecol. 2004, 15, 477–481. [Google Scholar]
- Jackson, M.L. Soil chemical Analysis: Advanced Course: A Manual of Methods Useful for Instruction and Research in Soil Chemistry, Physical Chemistry of Soils, Soil Fertility, and Soil Genesis, 2nd ed.; University of Wisconsin-Madison Libraries Parallel Press: Madison, WI, USA, 2005. [Google Scholar]
- Plaza, C.; Giannetta, B.; Benavente, I.; Vischetti, C.; Zaccone, C. Density-based fractionation of soil organic matter: Effects of heavy liquid and heavy fraction washing. Sci. Rep. 2019, 9, 10146. [Google Scholar] [CrossRef]
- Yang, L.; Song, X.; Lyu, S.; Shen, W.; Gao, Y. Dynamics and fractions of soil organic carbon in response to 35 years of afforestation in subtropical China. Plant Soil 2024, 500, 481–494. [Google Scholar] [CrossRef]
- Xu, J.M.; Yuan, K.N. Dissolution and fractionation of calcium-bound and iron-and aluminum-bound humus in soils. Pedosphere 1993, 3, 75–80. [Google Scholar]
- Xu, J.M.; Cheema, S.U.; Yuan, K.N. Studies on organo-mineral complexes in soil. IX. Characteristics of humus in calcium-bound and iron/aluminum-bound organo-mineral complexes in soil. Acta Pedol. Sin. 1999, 36, 168–178. [Google Scholar]
- Semenov, V.M.; Lebedeva, T.N.; Sokolov, D.A.; Zinyakova, N.B.; Lopes de Gerenu, V.O.; Semenov, M.V. Measurement of the soil organic carbon pools isolated using bio-physical-chemical fractionation methods. Eurasian Soil Sci. 2023, 56, 1327–1342. [Google Scholar] [CrossRef]
- Wei, T.; Simko, V.; Levy, M.; Xie, Y.; Jin, Y.; Zemla, J. Package “Corrplot”: Visualization of a Correlation Matrix. 2017. Version 0.84. 2021. Available online: https://github.com/taiyun/corrplot (accessed on 1 January 2025).
- Nonghuloo, I.M.; Kharbhih, S.; Suchiang, B.R.; Adhikari, D.; Upadhaya, K.; Barik, S.K. Production, decomposition and nutrient contents of litter in subtropical broadleaved forest surpass those in coniferous forest, Meghalaya. Trop. Ecol. 2020, 61, 5–12. [Google Scholar] [CrossRef]
- Yang, K.; Zhu, J.J.; Zhang, W.W.; Zhang, Q.; Lu, D.L.; Zhang, Y.K.; Zheng, X.; Xu, S.; Wang, G.G. Litter decomposition and nutrient release from monospecific and mixed litters: Comparisons of litter quality, fauna and decomposition site effects. J. Ecol. 2022, 110, 1673–1686. [Google Scholar] [CrossRef]
- Lu, X.; Hou, E.; Guo, J.; Gilliam, F.S.; Li, J.; Tang, S.; Kuang, Y. Nitrogen addition stimulates soil aggregation and enhances carbon storage in terrestrial ecosystems of China: A meta-analysis. Glob. Change Biol. 2021, 27, 2780–2792. [Google Scholar] [CrossRef]
- Berhane, M.; Xu, M.; Liang, Z.; Shi, J.; Wei, G.; Tian, X. Effects of long-term straw return on soil organic carbon storage and sequestration rate in North China upland crops: A meta-analysis. Glob. Change Biol. 2020, 26, 2686–2701. [Google Scholar] [CrossRef]
- Zhang, J.; Zhou, J.; Sayer, E.J.; Lambers, H.; Liu, Z.; Lu, X.; Li, Y.; Li, Y.; Li, H.; Wang, F. Nitrogen deposition enhances soil organic carbon and microbial residual carbon in a tropical forest. Plant Soil 2022, 484, 217–235. [Google Scholar] [CrossRef]
- Tang, B.; Rocci, K.S.; Lehmann, A.; Rillig, M.C. Nitrogen increases soil organic carbon accrual and alters its functionality. Glob. Change Biol. 2023, 29, 1971–1983. [Google Scholar] [CrossRef]
- Dawud, S.M.; Raulund-Rasmussen, K.; Domisch, T.; Finér, L.; Jaroszewicz, B.; Vesterdal, L. Is tree species diversity or species identity the more important driver of soil carbon stocks, C/N ratio, and pH? Ecosystems 2016, 19, 645–660. [Google Scholar] [CrossRef]
- Ostrowska, A.; Porębska, G. Assessment of the C/N ratio as an indicator of the decomposability of organic matter in forest soils. Ecol. Indic. 2015, 49, 104–109. [Google Scholar] [CrossRef]
- Wan, X.; Huang, Z.; He, Z.; Yu, Z.; Wang, M.; Davis, M.R.; Yang, Y. Soil C:N ratio is the major determinant of soil microbial community structure in subtropical coniferous and broadleaf forest plantations. Plant Soil 2014, 387, 103–116. [Google Scholar] [CrossRef]
- Cotrufo, M.F.; Lavallee, J.M.; Zhang, Y.; Hansen, P.M.; Paustian, K.H.; Schipanski, M.; Wallenstein, M.D. In-N-Out: A hierarchical framework to understand and predict soil carbon storage and nitrogen recycling. Glob. Change Biol. 2021, 27, 4465–4468. [Google Scholar] [CrossRef]
- Lalonde, K.; Mucci, A.; Ouellet, A.; Gelinas, Y. Preservation of organic matter in sediments promoted by iron. Nature 2012, 483, 198–200. [Google Scholar] [CrossRef]
- Yuan, Y.; Gao, S.; Dai, X.; Chen, F.; Wang, H. Effect of nitrogen and phosphorus addition on soil aggregation and its associated organic carbon. Chem. Ecol. 2021, 37, 603–615. [Google Scholar] [CrossRef]
Disclaimer/Publisher’s Note: The statements, opinions and data contained in all publications are solely those of the individual author(s) and contributor(s) and not of MDPI and/or the editor(s). MDPI and/or the editor(s) disclaim responsibility for any injury to people or property resulting from any ideas, methods, instructions or products referred to in the content. |
© 2025 by the authors. Licensee MDPI, Basel, Switzerland. This article is an open access article distributed under the terms and conditions of the Creative Commons Attribution (CC BY) license (https://creativecommons.org/licenses/by/4.0/).