Article

Effects of Forest Land Mulching on the Soil CO2 Emission Rate of Phyllostachys violascens Forests

1
College of Forestry, Jiangxi Agricultural University, Nanchang 330045, China
2
Jiangxi Provincial Key Laboratory of Subtropical Forest Resources Cultivation, Nanchang 330045, China
3
School of Business Administration, Nanchang Institute of Technology, Nanchang 330029, China
*
Author to whom correspondence should be addressed.
Forests 2025, 16(1), 106; https://doi.org/10.3390/f16010106
Submission received: 31 October 2024 / Revised: 30 December 2024 / Accepted: 6 January 2025 / Published: 9 January 2025
(This article belongs to the Special Issue Forest Inventory: The Monitoring of Biomass and Carbon Stocks)

Abstract

:
This study investigates the dynamics of soil CO2 emissions during the cover period of Phyllostachys violascens and the impact of different cover measures, aiming to provide references for reducing the environmental effects of bamboo cover. An L27 (913) orthogonal experimental design was employed, setting the following variables: (1) heating materials: chicken manure, straw cake, and wheat ash; (2) thickness of husk layer: 15 cm, 25 cm, and 35 cm; (3) soil moisture levels before covering: moisture to 10 cm, 15 cm, and 20 cm. The soil CO2 emission rate showed a unimodal curve, with a significant overall increase during the cover period. Throughout the entire cover period, the average soil CO2 emission rate (25.39 μmol·m−2·s−1) was 5.1 times higher than that of the uncovered Lei bamboo forest (5.02 μmol·m−2·s−1) during the same period. Thicker husk layers (25 cm and 35 cm) corresponded to higher soil CO2 emission rates, with significant differences noted among the thicknesses. When the soil was moist to 10 cm, the CO2 emission rate was highest (62.51 μmol·m−2·s−1); moisture to 15 cm and 20 cm resulted in significantly lower emission rates. Chicken manure produced the highest peak CO2 emissions in the third week, at 70.64 μmol·m−2·s−1, while straw cake and wheat ash reached their peaks in the fifth week, at 66.56 μmol·m−2·s−1 and 57.58 μmol·m−2·s−1, respectively. The interactions between the three factors (heating materials, husk layer thickness, and moisture levels) significantly affected the soil CO2 emission rates. By optimally configuring these factors, CO2 emissions can be regulated. This study recommends using wheat ash or straw cake as heating materials, combined with a 25 cm husk layer thickness, and moistening the soil to 15 cm before covering. This approach effectively reduces the peak and total soil CO2 emissions while ensuring suitable soil temperatures for the growth of bamboo shoots in spring. This research provides a scientific basis for the environmental management of bamboo forests, aiding in the optimization of covering measures to achieve low-carbon and sustainable bamboo management.

1. Introduction

Soil is one of the most important carbon sinks in terrestrial ecosystems, storing significant amounts of organic and inorganic carbon, and playing a key role in regulating atmospheric CO2 concentrations [1,2]. Soil respiration is the primary pathway for carbon release into the atmosphere, with global annual soil respiration flux being remarkably high, second only to CO2 released from the oceans [3,4]. Various factors, including temperature, precipitation, soil type, vegetation, and human activities, significantly influence soil respiration [5]. Human activities, especially soil cover, fertilization, and irrigation, have a pronounced impact on soil CO2 emissions [6]. The main methods to improve soil fertility include fertilization [7], soil improvement [8], and irrigation [9]. Soil cover can enhance the decomposition of organic matter, increase soil organic matter and carbon–nitrogen content, and alter soil temperature and moisture, thereby affecting CO2 release [10]. Numerous studies have shown that straw and plastic film covers significantly promote soil CO2 emissions during various crop growth stages [11]. For example, rice fields covered with straw exhibit higher CO2 emission rates during the winter fallow period, while the cover of straw and plastic film during the winter wheat growing season also significantly increases soil CO2 emissions [12,13]. Additionally, specific cover systems such as ridge-and-furrow systems can increase soil CO2 emissions while simultaneously enhancing crop yields [14]. These findings suggest that appropriate soil management and cover strategies can effectively regulate soil respiration and its impact on climate change, while also promoting agricultural productivity [15,16,17].
Phyllostachys violascens, known as Leizhu bamboo, is an excellent bamboo species for shoots, widely cultivated in the Yangtze River basin and southern regions of China [18]. Since the 1990s, through reasonable forest structure management and effective soil water and fertilizer management in key cultivation areas like Zhejiang, Jiangxi, and Anhui, the yield and quality of Leizhu bamboo shoots have significantly improved. In particular, winter forest cover practices enhance soil temperature by adding organic materials that decompose and generate heat, and by using materials like rice husks to insulate against cold air. This promotes early spring shoots and extends the harvest period, greatly increasing the economic benefits for many farmers relying on Lei bamboo for income [19]. However, prolonged forest cover has led to issues such as soil acidification [20,21], abnormal enzyme activity [22], and declines in microbial abundance and diversity [23]. These issues could all cause changes in soil CO2 emissions; therefore, studying the impact of coverage measures on CO2 emissions is very meaningful.
Despite this, there are limited reports on the response characteristics of soil CO2 emissions to forest cover and the dynamic changes in emission rates during the coverage period. This study aims to investigate (1) the dynamic changes in soil CO2 emissions during the forest cover period and (2) the effects of heat-generating material types, the thickness of the insulating layer, and pre-cover water replenishment on soil CO2 emission rates and dynamics. The goal is to provide insights into efficient, low-carbon cover models for sustaining Leizhu bamboo forests, minimizing environmental impacts and CO2 emissions during the coverage period.

2. Materials and Methods

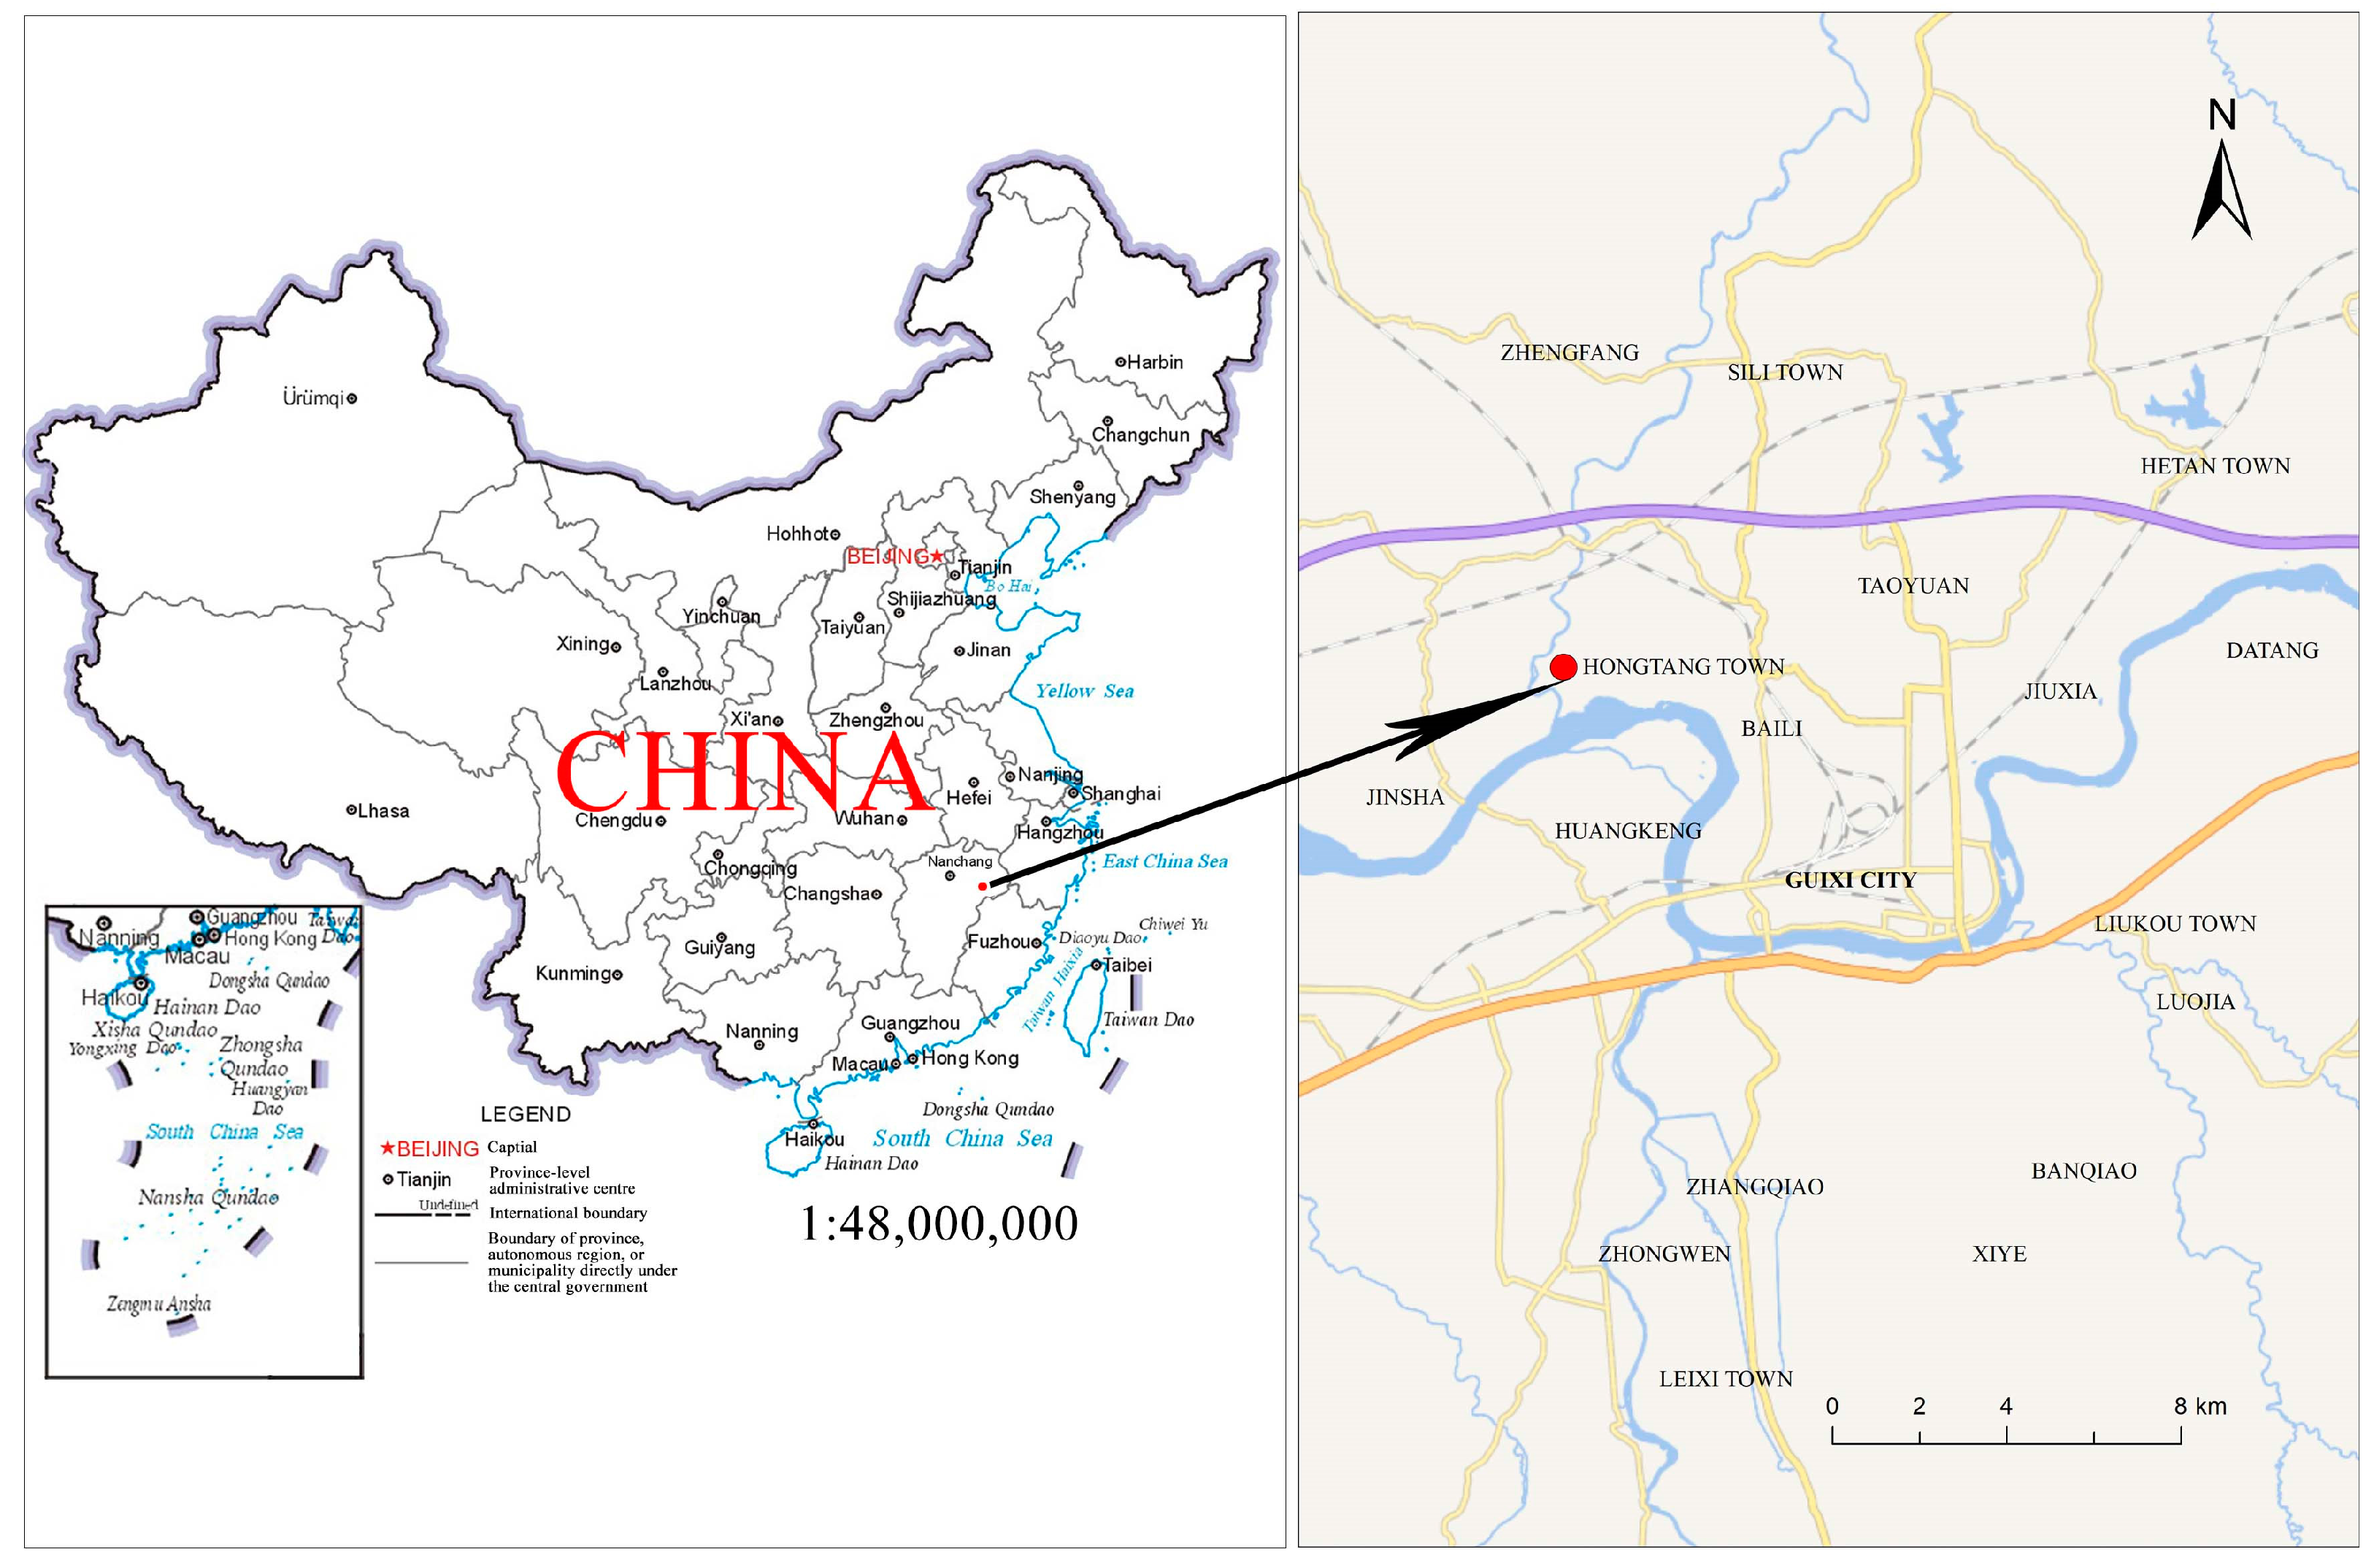
2.1. Overview of the Experimental Area

The experimental area is located in Hongtang Town, Guixi City, Jiangxi Province (28°17′44.91″ N, 117°14′24.26″ E, Figure 1). The terrain is hilly, with an elevation of 50 m. It has a subtropical humid monsoon climate, with an annual average temperature of 18.2 °C, a minimum average temperature of 10.0 °C in the coldest month, and a maximum average temperature of 22.0 °C in the hottest month. The average annual precipitation is 1850 mm. The test site features flat terrain with red soil that is deep and slightly acidic, with a pH of 4.5, making it suitable for Leizhu bamboo growth. The bamboo forest, established in 2011, covers an area of 15 hm2. Since afforestation, scientific water and fertilizer management practices and adjustments to forest structure have been implemented annually, resulting in a well-maintained and productive bamboo stand. In 2021, covering measures to promote shoot production were initiated, and by 2023, the third covering was conducted, primarily using 4–5-year-old bamboo with a density of approximately 15,000 stems·hm−2 and an average breast height diameter of 3 cm.

2.2. Experimental Methods

2.2.1. Experimental Design

A three-factor, three-level orthogonal experimental design was used to consider interactions, arranged according to the L27 (33) orthogonal table. The factors and levels are as follows:
Heat-generating materials: Three commonly used heat-generating materials in Jiangxi and other regions were selected, with the following application rates: fresh chicken manure: 7.50 t·hm−2; fresh cake residue: 3.75 t·hm−2; and wheat ash (byproduct from flour mills): 45.00 t·hm−2.
Fresh chicken manure: moisture content: 70%–80%; nitrogen (N): 2%–3%; phosphorus (P): 1%–2%; potassium (K): 1%–2%; organic matter: 20%–30%; C/N ratio: 6:1 to 8:1.
Fresh cake residue: protein: 40%–50%; fat/oil: 1%–2% (residual oil); fiber: 10%–20%; ash (minerals): 5%–10%; carbohydrates: 20%–30%; C/N ratio: 10:1 to 12:1.
Wheat ash: silica (SiO2): 50%–60%; calcium oxide (CaO): 10%–15%; potassium oxide (K2O): 5%–10%; magnesium oxide (MgO): 3%–5%; phosphorus pentoxide (P2O5): 1%–2%; aluminum oxide (Al2O3): 1%–3%.
Thickness of rice husk layer: The commonly used covering thicknesses in bamboo forests (including moso bamboo) were selected: 15 cm, 25 cm, and 35 cm. The C:N ratio of rice husks is between 80:1 and 100:1.
Pre-cover water replenishment: The soil was irrigated to achieve a moist layer of 10 cm, 15 cm, and 20 cm. A submersible pump was used to irrigate three times: The first time, all plots were irrigated to achieve a moist layer of 10 cm; for irrigation, the application rate was 4.45 t·hm−2. The second time, plots requiring a moist layer of 15 cm and 20 cm were irrigated to a moist layer of 15 cm, and the irrigation application rate was 2.22 t·hm−2. The third time, plots requiring a moist layer of 20 cm were irrigated to a moist layer of 20 cm, and the irrigation application rate was 2.22 t·hm−2.

2.2.2. Plot Setup

A total of 27 experimental plots, each measuring 25 m2 (5 m × 5 m), were established within the test area. A 2 m buffer zone was set between each plot, and the coverage model extended 1 m outward around each plot. Each plot was divided into 25 square subplots (1 m × 1 m). Three subplots (the central, northeast corner, and southwest corner) were chosen for soil CO2 emission rate measurements, with three replicates in each selected subplot. In each chosen subplot, a PVC pipe with a diameter of 20 cm (for measuring CO2 emission flux using the Li-8100 soil carbon flux automatic measurement system) was embedded, with the pipe extending 6 cm above the designed thickness of the rice husk layer. Additionally, three 6 cm high PVC pipes were installed in the uncovered Leizhu bamboo forest as controls.

2.2.3. Plot Coverage

The coverage was conducted on 25 November 2023. Prior to coverage, each experimental plot was irrigated to the specified replenishment level. The corresponding heat-generating materials were then evenly spread according to the experimental design. After applying the materials, the PVC pipes were placed vertically over the materials, and the rice husks were added to reach the designated thickness, with the same thickness of rice husks covering the inside of the PVC pipes.

2.3. Measurement of Soil CO2 Emission Rate

From the start of the Leizhu bamboo forest coverage until the end of the shoot production period (25 November 2023–16 March 2024), soil CO2 emission rates were measured and recorded for all sampled plots every Saturday from 9:00 to 11:00 using a soil carbon flux meter (Li-8100, Lincoln, NE, USA, Li-COR Biosciences). Due to the insulating effect of the rice husk layer, the daily temperature fluctuations in the soil were relatively small, and soil respiration typically exhibited a normal diurnal trend. Therefore, the soil respiration values obtained between 9:00 and 11:00 were considered representative of the daily average.

2.4. Data Processing

The experimental data were organized and initially processed using Microsoft Excel 2019. For the monitoring data, one-way and multi-way analysis of variance (ANOVA) and multiple comparisons were conducted using SPSS 24.0. Relevant charts and graphs were created using Origin 2018.

3. Results

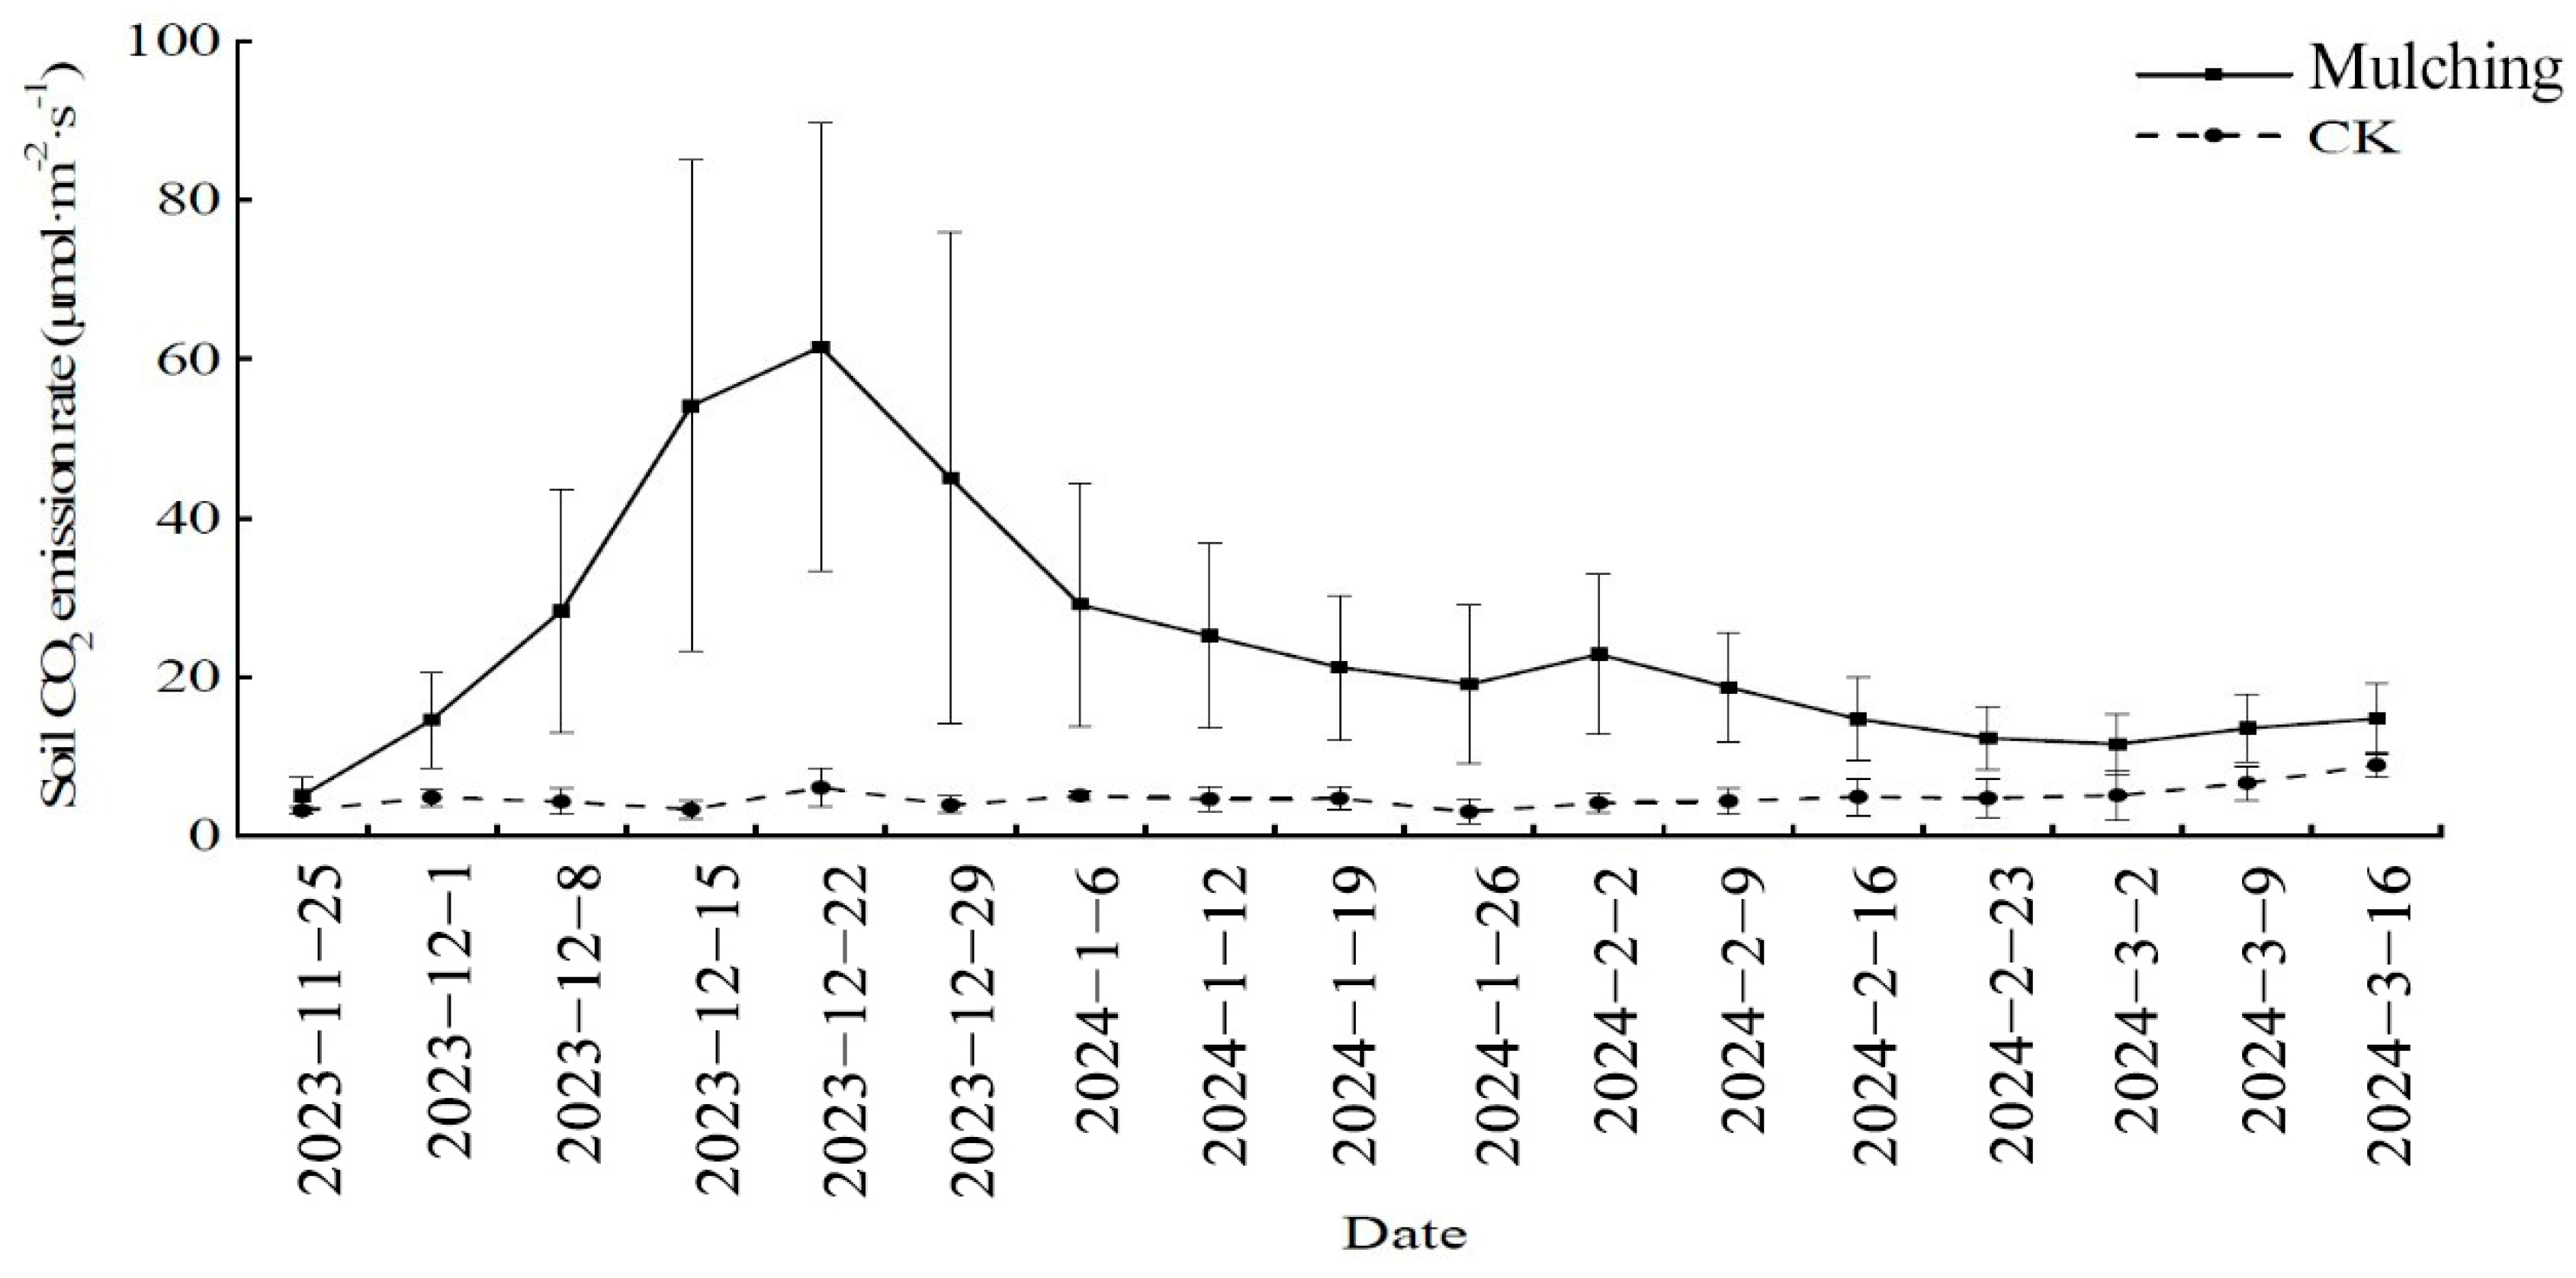
3.1. Dynamics of Soil CO2 Emissions in Covered Leizhu Bamboo Forests

The soil CO2 emission rate in the covered Leizhu bamboo forest exhibited a unimodal dynamic curve (Figure 2). In the first three weeks after coverage, the CO2 emission rate sharply increased, followed by a slowdown in the fourth week, peaking in the fifth week at 61.52 μmol·m−2·s−1. From weeks six to seven, the rate quickly declined, then gradually decreased, with a slight rebound in the tenth week before continuing to drop. The lowest emission rate was recorded in the fifteenth week (end of February the following year) at 11.54 μmol·m−2·s−1, followed by a slight increase.
During the entire coverage period, the average soil CO2 emission rate was 25.39 μmol·m−2·s−1, with a total CO2 release of approximately 2325.32 mol·m−2. In contrast, the soil CO2 emission rate in the uncovered Leizhu bamboo forest (control group) remained stable, with an average emission rate of 5.02 μmol·m−2·s−1 and a total CO2 release of around 459.75 mol·m−2. The difference in soil CO2 emission rates between the covered and uncovered Leizhu bamboo forests was highly significant (p < 0.01), indicating that winter coverage significantly enhances soil CO2 emissions.

3.2. Impact of Covering Measures on Soil CO2 Emissions

As shown in Table 1, the thickness of the rice husk layer had a highly significant effect on soil CO2 emissions (p < 0.01), with significant differences in emissions observed among the three thickness levels (p < 0.01). The amount of pre-cover irrigation also significantly influenced soil CO2 emissions (p < 0.05). Notably, when the soil was irrigated to a depth of 10 cm, CO2 emissions were significantly higher (p < 0.05), whereas differences between irrigation to 15 cm and 20 cm were not significant (p > 0.05).
Regarding the three commonly used heat-generating materials and their application rates, no significant differences in soil CO2 emissions were found (p > 0.05, Table 1). The interaction effects between rice husk thickness and both heat-generating materials and irrigation levels significantly impacted soil CO2 emissions (p < 0.01). Additionally, the interaction between heat-generating materials and irrigation levels also had a significant effect (p < 0.05).
Further analysis of the effects of covering factors on soil CO2 emission rates at different periods during the coverage phase is presented in Table 2.
Table 2 indicates that different covering factors have varying effects on soil CO2 emission rates at the same time during the coverage period. Similarly, the impact of the same covering factor on soil CO2 emission rates fluctuated over time. The thickness of the rice husk layer consistently had a highly significant effect on soil CO2 emission rates throughout the coverage period (p < 0.01). The amount of pre-cover irrigation did not significantly influence soil CO2 emission rates in the fourth week (p > 0.05), but significant (p < 0.05) or highly significant (p < 0.01) effects were observed in other periods.
The impact of heat-generating materials on soil CO2 emission rates was more complex; their effects were not significant during weeks 1, 11, 13, and 15 (p > 0.05), significant in week 6 (p < 0.05), and highly significant in other weeks (p < 0.01).
Overall, while the heat-generating materials did not significantly affect the total soil CO2 emissions over the entire coverage period, their influence reached significant or highly significant levels at most time points. This suggests that while the overall impact on total CO2 emissions may be minimal, the materials significantly affect the dynamic changes in soil CO2 emission rates.

3.3. Impact of Covering Measures on Dynamic Changes in Soil CO2 Emissions

3.3.1. Dynamic Changes in Soil CO2 Emission Rates with Different Heat-Generating Materials

As shown in Figure 3, the peak values and dynamic changes in soil CO2 emissions varied among the three widely used heat-generating materials. When fresh chicken manure was used, the peak soil CO2 emission rate occurred early, reaching its highest point of 70.64 μmol·m−2·s−1 in the third week after coverage. Following this, there was a rapid decline in emissions from weeks 4 to 9, with a noticeable increase in the 10th week.
In contrast, when cake residue and wheat ash were used as heat-generating materials, the dynamic changes in soil CO2 emissions followed a similar pattern: emissions increased over the first four weeks, peaked in the fifth week, and then declined quickly from weeks six to seven, followed by a gradual decrease. Notably, the peak emission rate with cake residue was 66.56 μmol·m−2·s−1, which was higher than that of wheat ash, which peaked at 57.58 μmol·m−2·s−1. Additionally, a slight increase in soil CO2 emission rates was observed during weeks 9 to 10 when cake residue was used.
Overall, these findings indicate that the choice of heat-generating material significantly affects both the timing and magnitude of soil CO2 emissions in covered Leizhu bamboo forests.
Further analysis of the dynamic changes in soil CO2 emission rates for the three heat-generating material treatments under varying rice husk thickness and irrigation levels is presented in Figure 4.
From Figure 4, it is evident that under thinner rice husk layers, soil CO2 emission rates with chicken manure as the heat-generating material were relatively low in the early phase but increased significantly later. In contrast, the emission rates with cake residue and wheat ash showed minor differences in their dynamic patterns (Figure 4A).
When the rice husk layer was of medium thickness (25 cm), the early emission rates and peak values of CO2 from all three heat-generating materials were similar. However, in the later phase, wheat ash yielded higher emission rates, while chicken manure had relatively lower rates (Figure 4B).
With a thicker rice husk layer, chicken manure led to a significant increase in CO2 emission rates early on, with peak emissions occurring sooner and a notable rise observed in the tenth week. The emission rates with cake residue and wheat ash showed minimal differences in their dynamic patterns (Figure 4C).
As the amount of pre-cover irrigation increased, the early CO2 emission rates for all three heat-generating materials declined, with a pronounced decrease noted for cake residue. Additionally, the peak emission times for both cake residue and chicken manure occurred earlier (Figure 4C–E).
These findings suggest that both rice husk thickness and pre-cover irrigation levels significantly influence the dynamic changes in soil CO2 emissions, highlighting the importance of tailored management practices to optimize emissions in bamboo forests.

3.3.2. Impact of Rice Husk Layer Thickness on Soil CO2 Emission Dynamics

As shown in Figure 5, the dynamic changes in soil CO2 emission rates were similar across rice husk layer thicknesses of 15 cm, 25 cm, and 35 cm. In all cases, emissions increased rapidly over the first four weeks, peaked in the fifth week, and then saw a significant decline in weeks six and seven. Following this, emissions decreased gradually, with a slight increase observed in the tenth week before declining again. The lowest emission rate was recorded in the fifteenth week (end of February), after which rates began to rise slowly again.
However, the average, peak, and minimum emission rates varied with different rice husk thicknesses. Thicker layers corresponded to higher average, peak, and minimum soil CO2 emission rates. This indicates that while the thickness of the rice husk layer primarily affects the overall amount of soil CO2 emissions, its impact on the dynamic changes in emissions is relatively minor.

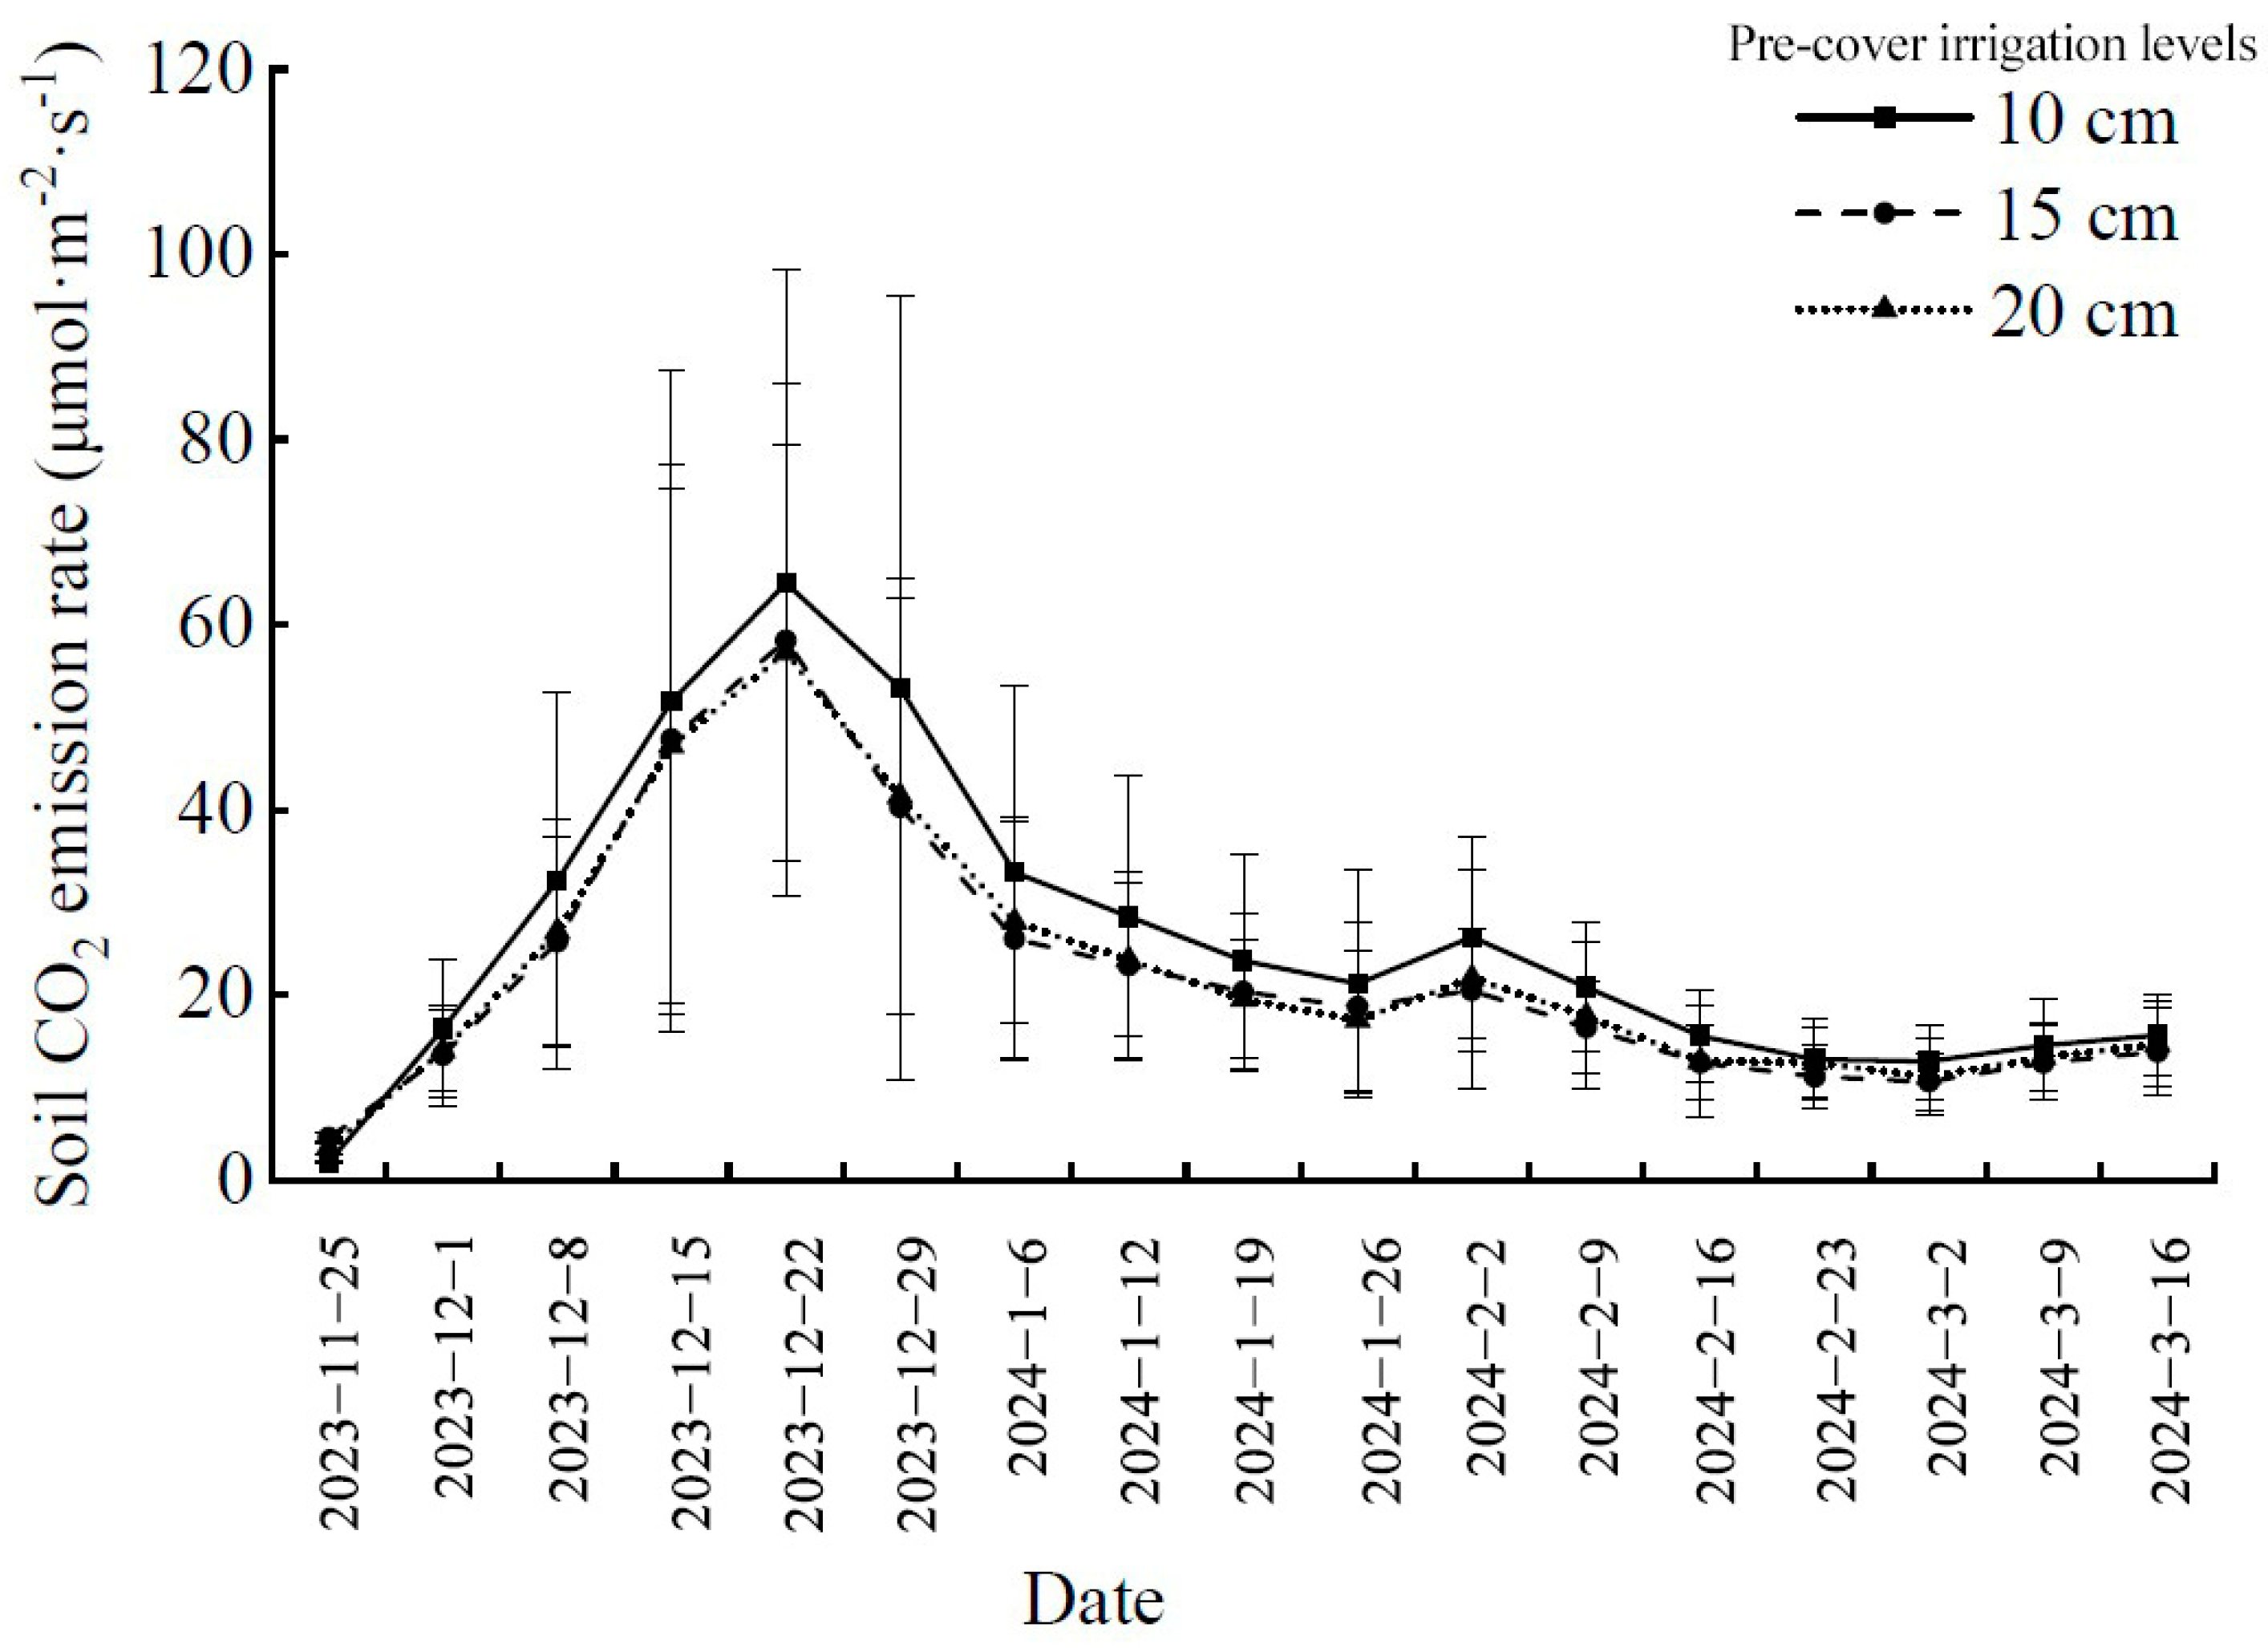
3.3.3. Impact of Pre-Cover Irrigation on Soil CO2 Emission Dynamics

As illustrated in Figure 6, the dynamic changes in soil CO2 emission rates under different pre-cover irrigation levels exhibited similar patterns. However, the specific values of average, peak, and minimum CO2 emissions varied based on the amount of irrigation applied.
When the soil was irrigated to a depth of 10 cm, the average, peak, and minimum soil CO2 emission rates were significantly higher compared to those with irrigation to depths of 15 cm and 20 cm. The differences in emission rates between the 15 cm and 20 cm irrigation treatments were minimal.
This suggests that the amount of pre-cover irrigation primarily influences the overall volume of soil CO2 emissions, while having a limited effect on the dynamic changes in emission rates.

4. Discussion

4.1. Significant Impact of Land Cover on Soil CO2 Emissions in Leizhu Bamboo Forests

The coverage of the Phyllostachys violascens forest involves applying heat-generating materials such as wheat husks and cake residue on the forest floor during winter, along with insulating materials and supplemental moisture, to increase soil temperature, break the dormancy of bamboo shoots, and promote their sprouting and growth. This practice aims to achieve early spring bamboo shoots, thereby enhancing the yield and economic benefits of the bamboo forest. The heat-generating materials are rich in easily utilized organic carbon and nutrients that can be directly decomposed by microorganisms, resulting in increased CO2 emission rates. Additionally, the decomposition of these materials releases significant amounts of heat, while the husk layer provides insulation, reducing heat loss from the soil to the atmosphere [24]. As the thickness of the husk layer increases, soil temperature rises significantly, which in turn increases the quantity and activity of microorganisms, accelerates the decomposition of heat-generating materials and soil organic matter, and promotes the growth and metabolism of bamboo roots and shoots, leading to further increases in soil CO2 emission rates [25].
Soil moisture content significantly affects microbial activity [26]. Due to the isolating effect of the husk layer, soil moisture cannot be replenished during the coverage period. Appropriate pre-cover moisture can alleviate the limitation of water on the decomposition of heat-generating materials and the growth of bamboo roots and shoots, promoting CO2 emissions. However, excessive moisture can hinder soil aeration, suppress microbial activity, and reduce CO2 emission rates [27]. Therefore, the three factors of heat-generating materials, husk layer thickness, and pre-cover moisture all influence soil CO2 emissions in bamboo forest coverage activities.
This study indicates that the coverage of Phyllostachys violascens forests significantly increases soil CO2 emission rates (p < 0.05) and alters the dynamic patterns of emissions. Throughout the coverage period, the average soil CO2 emission rate in the covered bamboo forest was 25.39 μmol·m−2·s−1, which is 5.1 times higher than that of the uncovered bamboo forest. The CO2 emission rate from the uncovered bamboo forest remained stable, while that from the covered bamboo forest exhibited a pronounced unimodal curve, with the peak value being 5.3 times higher than that of the uncovered forest.

4.2. The Thickness of the Husk Layer and Pre-Cover Soil Moisture Are Major Factors Influencing Soil CO2 Emission Rates

Soil temperature has a significant effect on soil CO2 emission rates [28]. Higher soil temperatures promote the proliferation of soil microbial populations and the metabolic activities of plant roots, accelerating the decomposition of heat-generating materials, which in turn increases soil respiration rates and CO2 emissions [26,29]. In bamboo forest covering measures, rice husk serves as an insulating material that effectively blocks heat exchange between the soil and the atmosphere, with its thickness being a major factor affecting soil temperature [5]. As the thickness of the rice husk layer increases, the insulation effect improves, reducing heat loss from the soil and significantly raising soil temperatures. This study found that the soil CO2 emission rate is significantly positively correlated with the soil temperatures at 0 cm, 10 cm, and 20 cm (p < 0.01), with correlation coefficients exceeding 0.818, indicating that the thickness of the rice husk layer is a critical factor influencing soil CO2 emission rates, with a highly significant level of influence (p < 0.01).
Furthermore, the decomposition of heat-generating materials, microbial activity, and the metabolic growth of bamboo roots and shoots all require adequate moisture. Research has shown that a soil moisture content of 40% to 60% and an oxygen content of 5% to 15% are beneficial for the microbial decomposition and fermentation of organic matter, such as livestock manure [30]. During the covering of bamboo forests, the rice husk layer prevents moisture infiltration while providing insulation, resulting in natural precipitation being unable to penetrate the soil. Therefore, adequate soil moisture supplementation before covering can promote the decomposition of heat-generating materials, microbial activity and reproduction, and the growth metabolism of bamboo roots and shoots, thereby increasing soil CO2 emission rates. However, excessive moisture can impair soil aeration, inhibit microbial activity, and reduce soil respiration intensity. This study shows that the soil CO2 emission rate is significantly negatively correlated with soil moisture content (p < 0.01), and the amount of moisture supplementation before covering has a significant effect on soil CO2 emission rates. When soil moisture is supplemented to a depth of 10 cm, the soil CO2 emission rate is significantly higher than when supplemented to depths of 15 cm and 20 cm [31].

4.3. The Type of Heat-Generating Material Mainly Affects the Dynamic Variation Pattern of Soil CO2 Emission Rates

Throughout the entire coverage period, the differences in soil CO2 emission rates among the three commonly used heat-generating materials and their application levels in bamboo shoot forests were not significant (p > 0.05). However, when analyzed by observation day, except for specific dates, the effects of heat-generating materials on soil CO2 emission rates generally showed significant or extremely significant differences (p < 0.05). This may be related to the fact that soil respiration includes three biological processes, plant root respiration, soil microbial respiration, and soil animal respiration, with the former two being the main components that are primarily influenced by temperature and moisture [32,33].
Differences in the composition and nutrient content of various heat-generating materials lead to variations in microbial species and numbers, which in turn affect decomposition rates and the rhythms of heat release, causing dynamic changes in soil CO2 emission rates and differences in the timing of peak emissions [20]. Cake residue, being rich in nutrients, supports a larger microbial population during decomposition, resulting in higher CO2 emissions and a rapid increase in emission rates in the early stages. In contrast, chicken manure, due to its complex composition, requires higher temperatures for decomposition. When soil temperatures are low in the early stages, the decomposition rate of chicken manure slows down, leading to lower CO2 emission rates. However, in later stages, the abundant undecomposed chicken manure provides a rich substrate for microbial activity, causing an increase in CO2 emission rates. When the husk layer is thick and soil moisture is relatively low, higher early-stage soil temperatures can promote the decomposition of chicken manure, leading to vigorous microbial activity and higher CO2 emissions.
Wheat bran, as a processing byproduct from flour mills, contains high carbohydrates and a high C/N ratio but has a relatively small microbial community. Although its CO2 emission peak occurs earlier, the emission rate is relatively low. The three heat-generating materials and their application levels selected for this experiment are based on long-term practical applications, resulting in minimal overall differences in heat output and consequently no significant differences in total soil CO2 emissions throughout the coverage period. However, the dynamic changes in CO2 emissions and the timing of peaks differ significantly among the various heat-generating materials.
Additionally, the soil CO2 emission rate in the covered bamboo forests showed a slight increase from late January to early February, likely coinciding with the peak period of bamboo shoot emergence, during which the respiration activities of bamboo shoots and roots significantly increased CO2 emission rates. However, the same heating material will produce different effects at different application levels, and the soil active carbon and nitrogen content in the experimental area will also affect soil respiration dynamics. Due to limitations in research conditions and time, this study did not set up the above content. Therefore, further research is needed to investigate the effects of application levels and soil active carbon and nitrogen content on soil CO2 emission rates and total emissions.

5. Conclusions

Winter covering of Phyllostachys violascens forests significantly increases soil CO2 emission rates and affects the dynamics of CO2 emissions. During the covering period, soil CO2 emissions exhibit a unimodal curve, peaking in the fifth week. The dynamics of soil CO2 emissions vary with different heat-generating materials. The thickness of the husk layer and the amount of pre-covering irrigation are the main factors influencing soil CO2 emission levels; the thicker the husk layer, the greater the CO2 emissions. When pre-covering irrigation reaches a soil moisture level of 10 cm, the CO2 emissions significantly increase. Using wheat husk or dry cake as heat-generating materials, with a husk layer thickness of 25 cm and pre-covering irrigation to a soil moisture level of approximately 15 cm, can effectively reduce both the peak and total soil CO2 emissions while ensuring suitable soil temperatures for winter bamboo shoots to emerge in spring. This study provides a scientific basis for bamboo forest environmental management, which helps optimize coverage measures and achieve low-carbon and sustainable bamboo forest management.

Author Contributions

Conceptualization, Z.S.; formal analysis, D.Z.; funding acquisition, D.Z.; investigation, X.Z.; methodology, D.Z. and J.S.; project administration, Z.L.; resources, X.Z. and Z.L.; software, Z.S.; writing—original draft, Z.S. and S.C.; writing—review and editing, Z.S. All authors have read and agreed to the published version of the manuscript.

Funding

The research was financially supported by the Research Project of Humanities and Social Sciences in Colleges and Universities of Jiangxi Province (JJ23223).

Data Availability Statement

Data is contained within the article.

Conflicts of Interest

The authors declare no conflicts of interest.

References

  1. Batjes, N.H. Total carbon and nitrogen in the soils of the world. Eur. J. Soil Sci. 2014, 65, 10–21. [Google Scholar] [CrossRef]
  2. Jenkinson, D.S.; Adams, D.E.; Wild, A. Model estimates of CO2 emissions from soil in response to global warming. Nature 1991, 351, 304–306. [Google Scholar] [CrossRef]
  3. Hansen, J.E.; Lacis, A.A. Sun and dust versus greenhouse gases: An assessment of their relative roles in global climate change. Nature 1990, 346, 713–719. [Google Scholar] [CrossRef]
  4. Raich, J.W.; Potter, C.S. Global patterns of carbon dioxide emissions from soils. Glob. Biogeochem. Cycles 1995, 9, 23–26. [Google Scholar] [CrossRef]
  5. Cheng, H.; Shen, Z.; Chen, Y.; Shen, X.G.; Hui, L.D.; Long, Z.R.; Li, Z.R. Mulching effect of oil cake, chaff and moisture on soil temperature of Phyllostachys edulis ‘Pachyloen’ forest. Non-Wood For. Res. 2020, 38, 169–176. [Google Scholar]
  6. Yang, B.; Shen, Z.; Shen, X.; Chen, Y.; Long, Z.; Li, Z. The heating law of different heating substances and its effect on soil temperature of cover Phyllostachys violascens forest. J. Cent. South Univ. For. Technol. 2021, 41, 89–96. [Google Scholar]
  7. Han, X.; Dang, P.; Liao, L.; Song, F.; Zhang, M.; Zhang, M.; Li, G.; Wen, S.; Yang, N.; Pan, X.; et al. Combining slow-release fertilizer and plastic film mulching reduced the carbon footprint and enhanced maize yield on the Loess Plateau. J. Environ. Sci. 2025, 147, 359–369. [Google Scholar] [CrossRef] [PubMed]
  8. Hu, J.; Miles, D.M.; Adeli, A.; Brooks, J.P.; Podrebarac, F.A.; Smith, R.; Lei, F.; Li, X.; Jenkins, J.N.; Moorhead, R.J. Effects of cover crops and soil amendments on soil CO2 Flux in a Mississippi Corn crop system on Upland soil. Environments 2023, 10, 19. [Google Scholar] [CrossRef]
  9. Wang, C.; Li, S.; Wu, M.; Wang, X.; Wang, S.; Guo, Z.; Gao, L. High efficiency and low greenhouse gas emissions intensity of maize in drip irrigation under mulch system. Agric. Ecosyst. Environ. 2023, 346, 108344. [Google Scholar] [CrossRef]
  10. Peng, Y.; Thomas, S.; Tian, D. Forest management and soil respiration: Implications for carbon sequestration. Environ. Rev. 2008, 16, 93–111. [Google Scholar] [CrossRef]
  11. Porter, G.S.; Bajita-Locke, J.B.; Hue, N.V.; Strand, D. Manganese solubility and phytotoxicity affected by soil moisture, oxygen levels, and green manure additions. Commun. Soil Sci. Plant Anal. 2004, 35, 99–116. [Google Scholar] [CrossRef]
  12. Gao, H.; Liu, Q.; Yan, C.; Wu, Q.; Gong, D.; He, W.; Liu, H.; Wang, J.; Mei, X. Mitigation of greenhouse gas emissions and improved yield by plastic mulching in rice production. Sci. Total Environ. 2023, 880, 162984. [Google Scholar] [CrossRef] [PubMed]
  13. Liu, F.; Gao, M.; Zhang, H.; Yuan, H.; Zong, R.; Liu, Z.; Wei, S.; Li, Q. Response of soil CO2 emissions and water-carbon use efficiency of winter wheat to different straw returning methods and irrigation scenarios. J. Sci. Food Agric. 2024, 104, 2449–2457. [Google Scholar] [CrossRef]
  14. Luo, X.; Li, C.; Lin, N.; Wang, N.; Chu, X.; Feng, H.; Chen, H. Plastic film-mulched ridges and straw-mulched furrows increase soil carbon sequestration and net ecosystem economic benefit in a wheat-maize rotation. Agric. Ecosyst. Environ. 2023, 344, 108311. [Google Scholar] [CrossRef]
  15. Fu, X.; Wang, J.; Xie, M.; Zhao, F.; Doughty, R. Increasing temperature can modify the effect of straw mulching on soil C fractions, soil respiration, and microbial community composition. PLoS ONE 2020, 15, e0237245. [Google Scholar] [CrossRef] [PubMed]
  16. Wang, H.; Zheng, J.; Fan, J.; Zhang, F.; Huang, C. Grain yield and greenhouse gas emissions from maize and wheat fields under plastic film and straw mulching: A meta-analysis. Field Crops Res. 2021, 270, 108210. [Google Scholar] [CrossRef]
  17. Xie, M.-Y.; Shang, Y.-Q.; Zhao, F.-Z.; Wang, J. Responses of soil respiration to temperature under different mulching modes in a dryland corn field. J. Appl. Ecol. 2020, 31, 467–473. [Google Scholar]
  18. Zhang, M.; You, G.; Wang, Y.; Yan, R.; Zou, C.; Chen, S. Impact of intensive management on the carbon flux variation characteristics of the Lei bamboo (Phyllostachys praecox) forest. Glob. Ecol. Conserv. 2024, 50, e02794. [Google Scholar] [CrossRef]
  19. Mbukwa, D.; Gui, R.; Deng, S. Effect of soil organic mulching combined with aeration treatment on soil quality, nutrients content, and lei bamboo shoot production. Agriculture 2023, 13, 536. [Google Scholar] [CrossRef]
  20. Chen, J.; Jiang, C.; Tu, T.; Ma, R.; Hao, Q. Changes in soil greenhouse gas concentrations induced by plastic film mulching in a hot pepper–radish rotation. Int. J. Environ. Sci. Technol. 2023, 20, 11523–11536. [Google Scholar] [CrossRef]
  21. Visconti, F.; Peiró, E.; Pesce, S.; Balugani, E.; Baixauli, C.; de Paz, J.M. Straw mulching increases soil health in the inter-row of citrus orchards from Mediterranean flat lands. Eur. J. Agron. 2024, 155, 127115. [Google Scholar] [CrossRef]
  22. Wang, Y.; Tian, Z.; Li, X.; Zhang, M.; Fang, Y.; Xiang, Y.; Liu, Y.; Liu, E.; Jia, Z.; Siddique, K.H.; et al. Straw-derived biochar regulates soil enzyme activities, reduces greenhouse gas emissions, and enhances carbon accumulation in farmland under mulching. Field Crops Res. 2024, 317, 109547. [Google Scholar] [CrossRef]
  23. Lee, J.G.; Chae, H.G.; Das, S.; Kim, G.W.; Kim, P.J. Cover crops offset recalcitrant soil organic carbon losses under plastic-film mulching by altering microbial functional genes. Biol. Fertil. Soils 2024, 60, 35–46. [Google Scholar] [CrossRef]
  24. Gao, J.; Zhuang, S.; Gui, R. Subsurface aeration mitigates organic material mulching-induced anaerobic stress via regulating hormone signaling in Phyllostachys praecox roots. Front. Plant Sci. 2023, 14, 1121604. [Google Scholar] [CrossRef] [PubMed]
  25. Huang, T.; Wen, S.; Zhang, M.; Pan, Y.; Chen, X.; Pu, X.; Zhang, M.; Dang, P.; Meng, M.; Wang, W.; et al. Effect on greenhouse gas emissions (CH4 and N2O) of straw mulching or its incorporation in farmland ecosystems in China. Sustain. Prod. Consum. 2024, 46, 223–232. [Google Scholar] [CrossRef]
  26. Zhang, L.; Xu, C.; Yan, W.; Tan, G.; Sun, N.; Zhao, H.; Li, F.; Yu, J.; Meng, X.; Bian, S. Effects of surface mulching on soil water temperature, physiological characteristics and yield of maize. Int. J. Plant Prod. 2023, 17, 283–296. [Google Scholar] [CrossRef]
  27. Liu, Z.; Huang, F.; Wang, B.; Li, Z.; Zhao, C.; Ding, R.; Yang, B.; Zhang, P.; Jia, Z. Soil respiration in response to biotic and abiotic factors under different mulching measures on rain-fed farmland. Soil Tillage Res. 2023, 232, 105749. [Google Scholar] [CrossRef]
  28. Akhtar, K.; Ain, N.U.; Wang, W.; Ren, G.; Feng, Y.; Djalovic, I.; Prasad, P.V.V.; Yang, G.; He, B.; Wen, R. Straw mulch decreased nitrogen fertilizer requirements via regulating soil moisture and temperature to improve physiology, nitrogen, and water use efficiency of wheat. Agron. J. 2023, 115, 3106–3118. [Google Scholar] [CrossRef]
  29. Quan, H.; Wang, B.; Wu, L.; Feng, H.; Wu, L.; Wu, L.; Liu, D.L.; Siddique, K.H. Impact of plastic mulching and residue return on maize yield and soil organic carbon storage in irrigated dryland areas under climate change. Agric. Ecosyst. Environ. 2024, 362, 108838. [Google Scholar] [CrossRef]
  30. Hao, D.-C.; Su, X.-Y.; Xie, H.-T.; Bao, X.-L.; Zhang, X.-D.; Wang, L.-F. Effects of tillage patterns and stover mulching on N2O production, nitrogen cycling genes and microbial dynamics in black soil. J. Environ. Manag. 2023, 345, 118458. [Google Scholar] [CrossRef]
  31. Guo, H.; Wang, X.; Wang, Y.; Li, S. Effect of mulched drip irrigation on crop biomass and carbon fluxes in maize field. Agric. Water Manag. 2024, 303, 109016. [Google Scholar] [CrossRef]
  32. Song, Q.; Yang, B.; Xu, M.; Zhang, F.; Liu, Q.; Li, S. A three-year record of CO2, CH4 and N2O emissions in maize fields influenced by mulching methods on the Loess Plateau, China. Agric. Ecosyst. Environ. 2024, 367, 108963. [Google Scholar] [CrossRef]
  33. Wei, H.; Zhang, K.; Chai, N.; Wang, Y.; Li, Y.; Yang, J.; Harrison, M.T.; Liu, K.; Wan, P.; Zhang, W.; et al. Exploring low-carbon mulching strategies for maize and wheat on-farm: Spatial responses, factors and mitigation potential. Sci. Total Environ. 2024, 906, 167441. [Google Scholar] [CrossRef]
Figure 1. The experimental area.
Forests 16 00106 g001
Figure 2. Dynamic changes in soil CO2 emission rate in Ph. violascens forest during the mulching period. The bars in the figure refer to the standard errors.
Forests 16 00106 g002
Figure 3. Dynamic changes in soil CO2 emission rate in Ph. violascens forest mulched by different heating substances. The bars in the figure refer to the standard errors.
Forests 16 00106 g003
Figure 4. Dynamic changes in soil CO2 emission rate by different heating substances under different conditions of chaff layer thickness and water supplement.
Forests 16 00106 g004
Figure 5. Dynamic changes in soil CO2 emission rate under different rice husk layer thicknesses. The bars in the figure refer to the standard errors.
Forests 16 00106 g005
Figure 6. Dynamic changes in soil CO2 emission rate under different pre-cover irrigation levels. The bars in the figure refer to the standard errors.
Forests 16 00106 g006
Table 1. Analysis of variance on soil CO2 emission during the mulching period.
FactorF Value
Heating substances (H)0.705
Chaff thickness (C)86.142 **
Water recharge (W)3.649 *
H × C7.232 **
H × W2.538 *
C × W5.013 **
H × C × W1.17
* Significant (p < 0.05); ** extremely significant (p < 0.01).
Table 2. Analysis of variance on soil CO2 emission rate during different mulching periods.
WeekDateHeating Substances (H)Chaff Thickness (C)Water Recharge (W)H × CH × WW × CH × C × W
11 December 20230.1517.577 **54.939 **0.5620.2649.298 **0.179
28 December 202315.870 **169.507 **9.432 **48.377 **22.251 **9.512 **11.360 **
315 December 202336.465 **673.090 **12.262 **247.179 **54.593 **18.738 **25.021 **
422 December 20237.437 **204.856 **3.09766.008 **17.942 **7.031 **8.226 **
529 December 202328.181 **626.723 **40.017 **64.537 **22.155 **67.207 **22.821 **
66 January 20234.079 *404.395 **24.107 **39.398 **3.171 *24.453 **3.603 **
712 January 202415.473 **673.026 **39.390 **48.196 **5.060 **38.291 **5.854 **
819 January 202421.627 **196.059 **12.881 **14.843 **2.48310.515 **3.210 **
926 January 2024146.975 **168.309 **13.935 **4.363 **4.732 **29.006 **20.489 **
102 February 202423.956 **333.503 **36.072 **37.771 **18.593 **15.817 **9.764 **
119 February 20240.800269.105 **27.268 **15.982 **10.466 **7.450 **4.626 **
1216 February 202417.860 **93.398 **12.963 **2.947 *2.951 *0.9573.645 **
1323 February 20240.05257.989 **5.155 **3.605 *1.7603.809 **2.964 **
142 March 20248.666 **47.066 **6.846 **3.167 *2.695 *2.2363.065 **
159 March 20243.11183.279 **4.466 *1.1442.0551.1131.869
1616 March 202422.006 **79.087 **4.658 *14.617 **1.5252.5243.146 **
* Significant (p < 0.05); ** extremely significant (p < 0.01).
Disclaimer/Publisher’s Note: The statements, opinions and data contained in all publications are solely those of the individual author(s) and contributor(s) and not of MDPI and/or the editor(s). MDPI and/or the editor(s) disclaim responsibility for any injury to people or property resulting from any ideas, methods, instructions or products referred to in the content.

