

Identifying Key Locations of the Ecological-Barrier System to Support Conservation Planning: A Study of the Sanjiangyuan National Park


Abstract
1. Background
2. Literature Review
2.1. Overview of the Studies on Planning for EBS
2.2. Studies on Identification of Key Areas of EBS for Conservation
3. Methodology
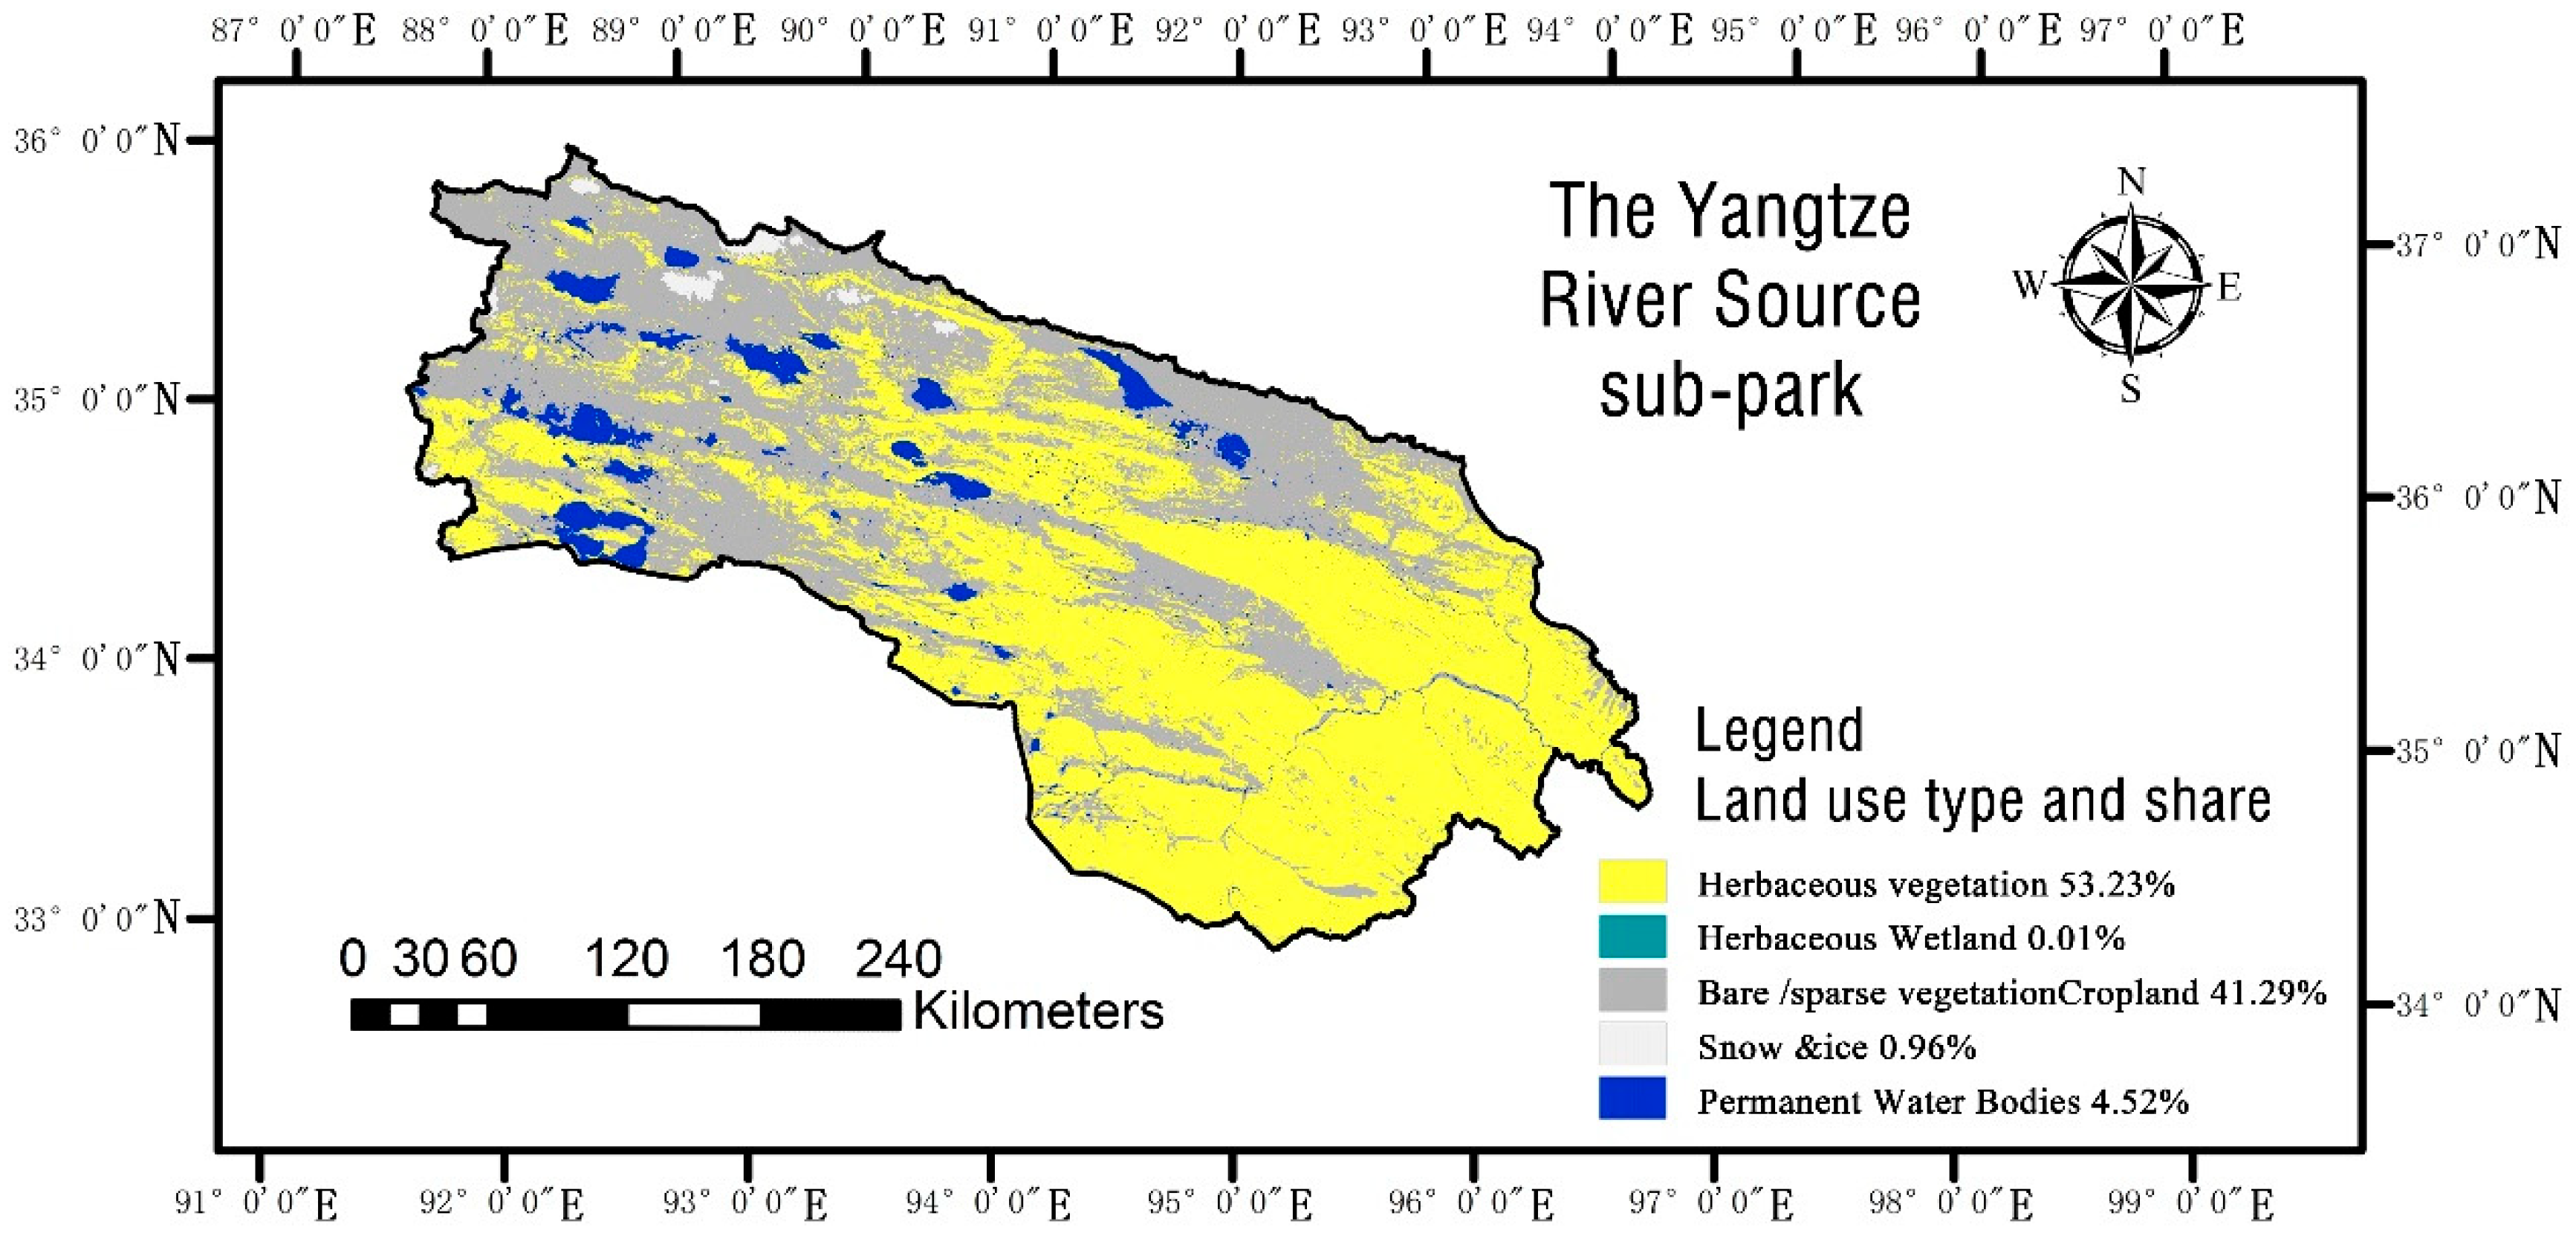
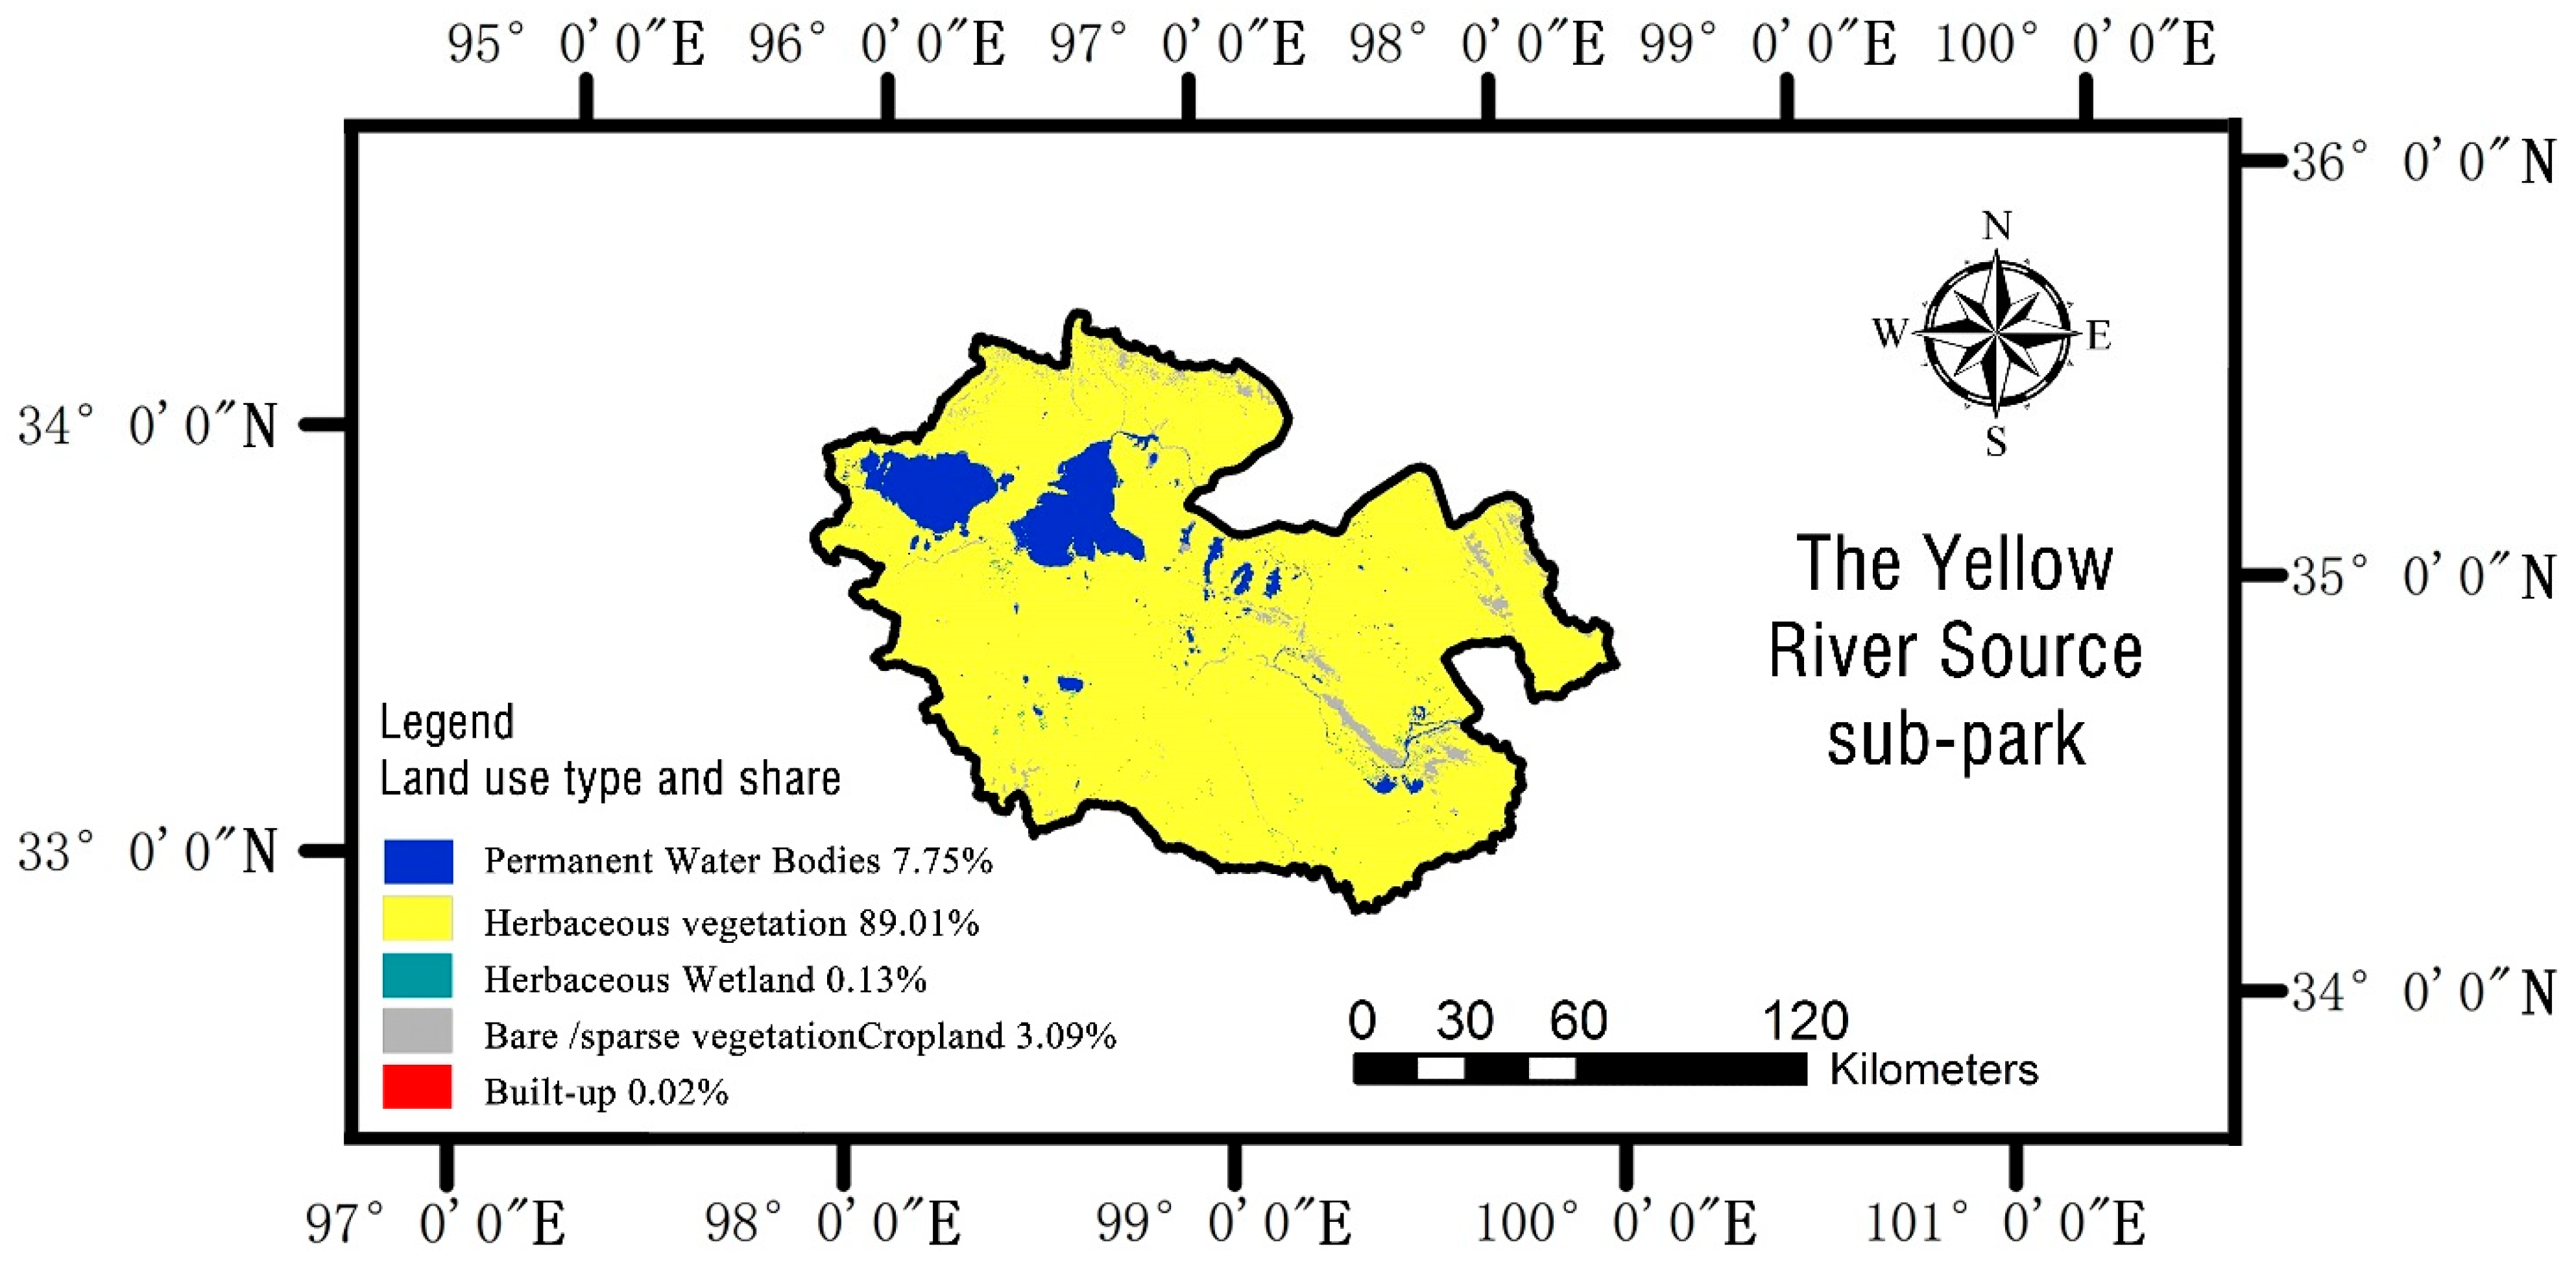
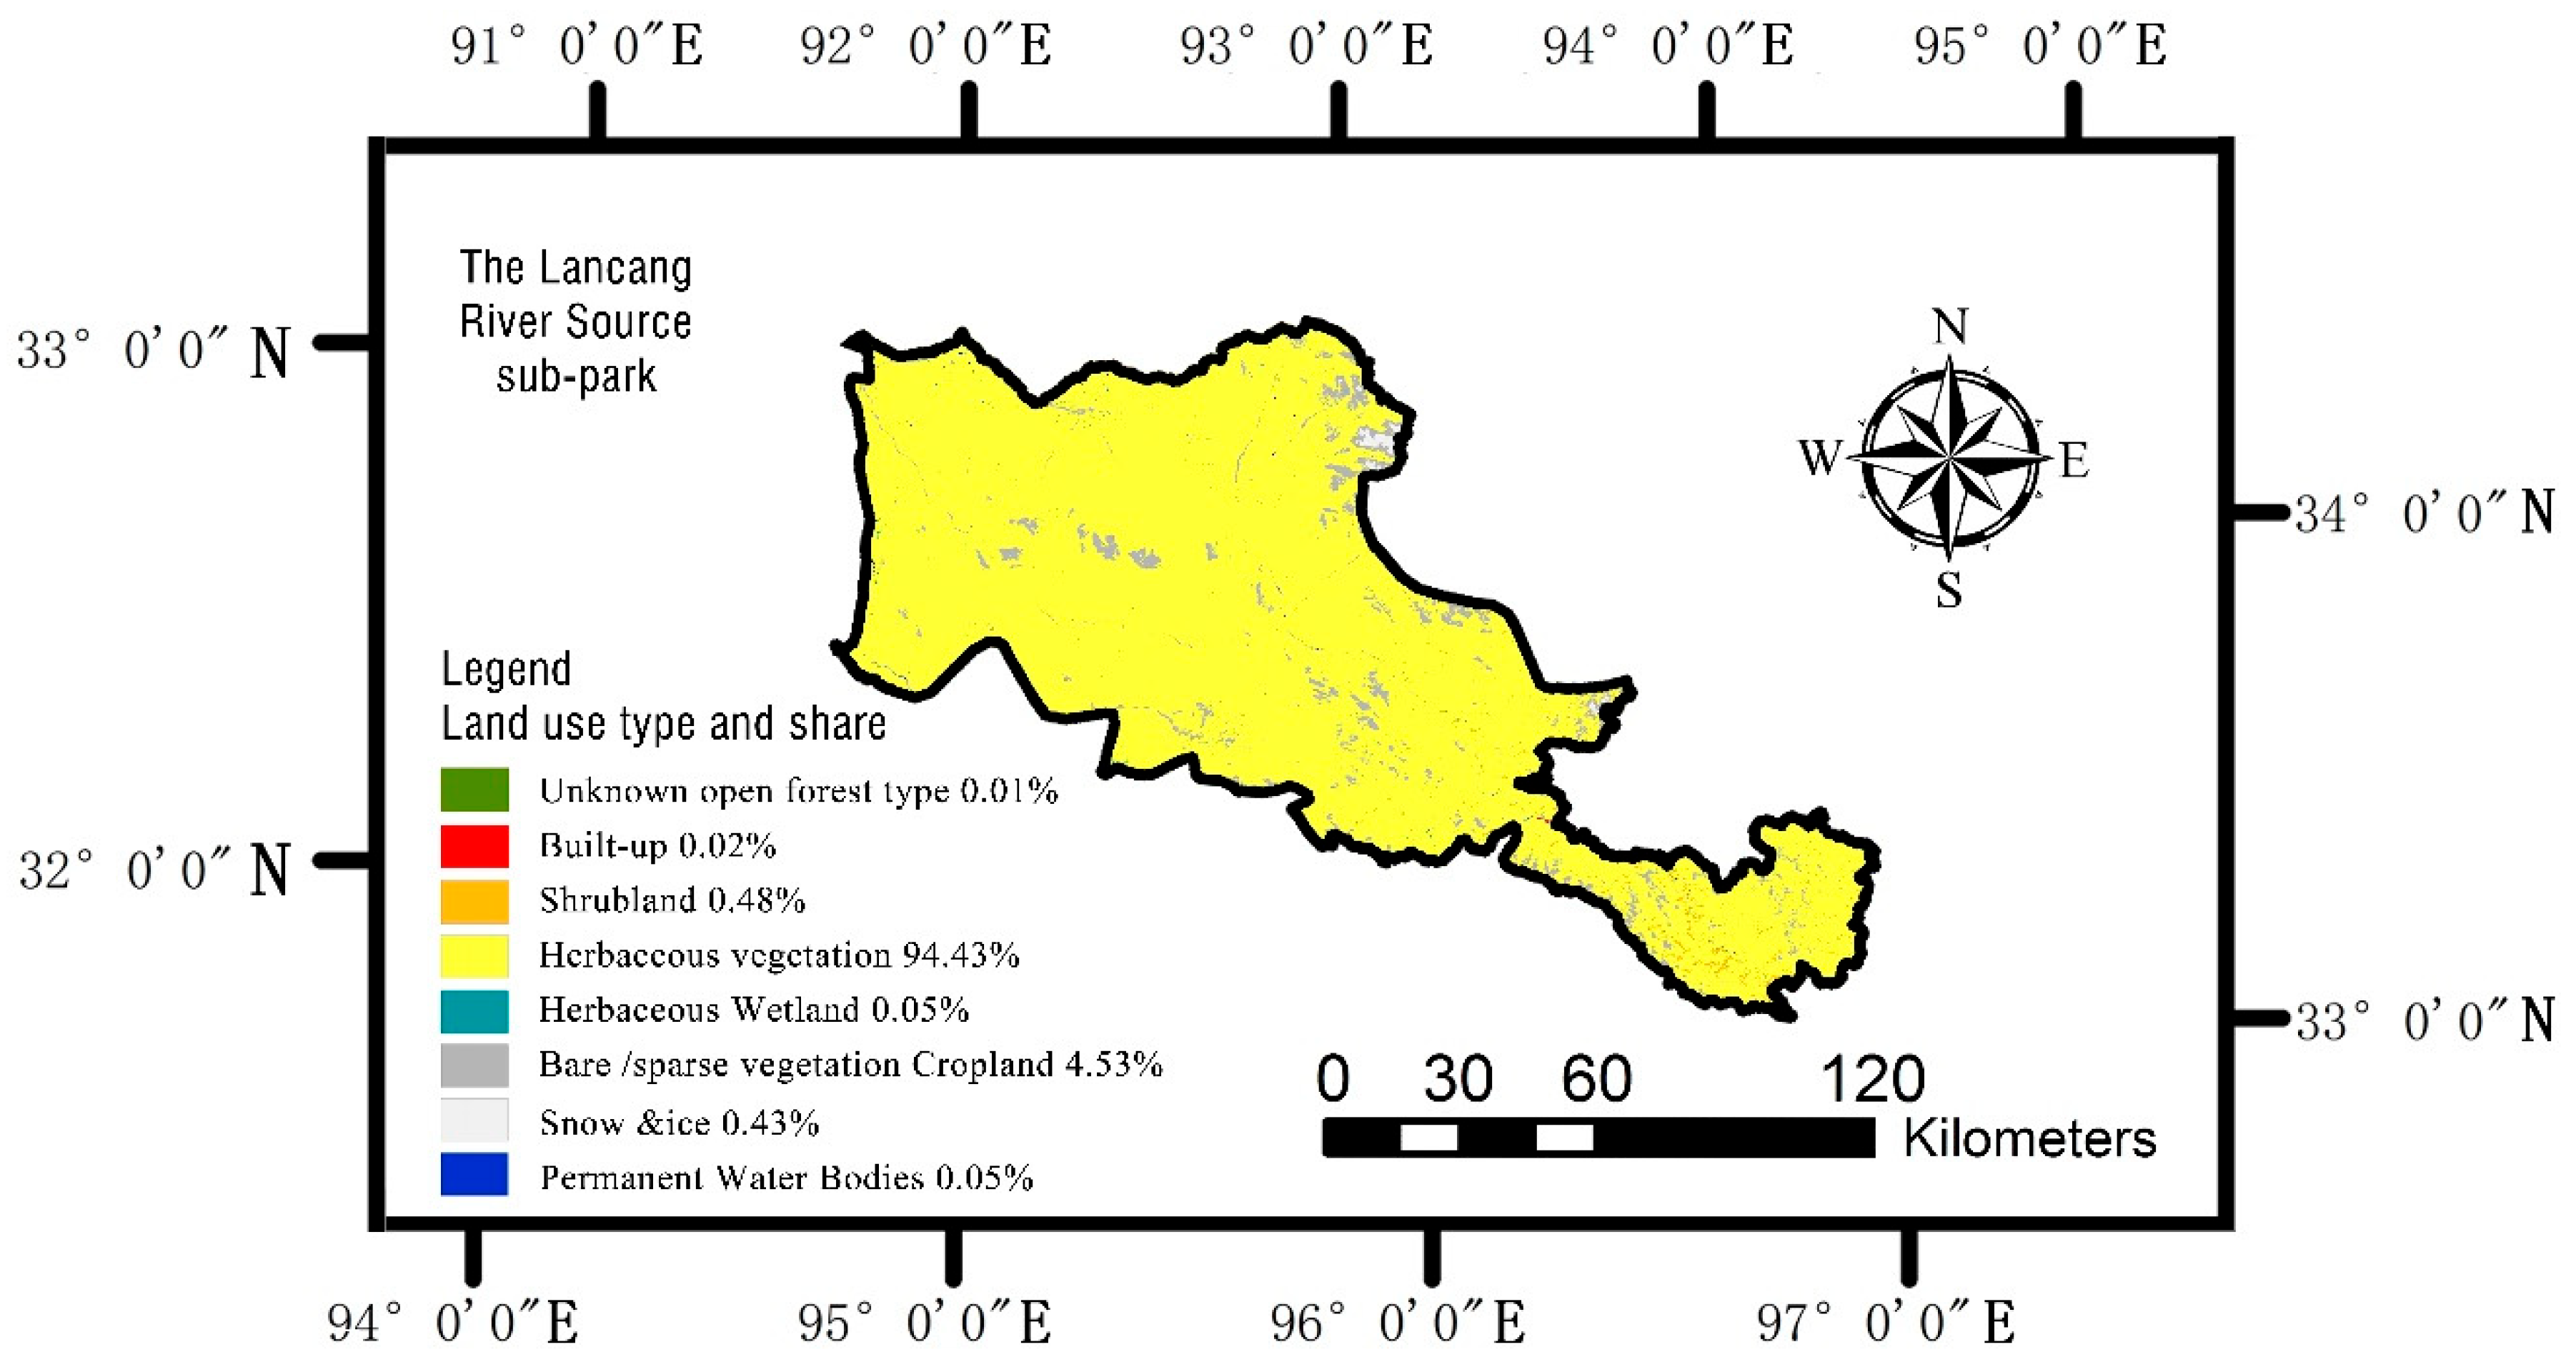
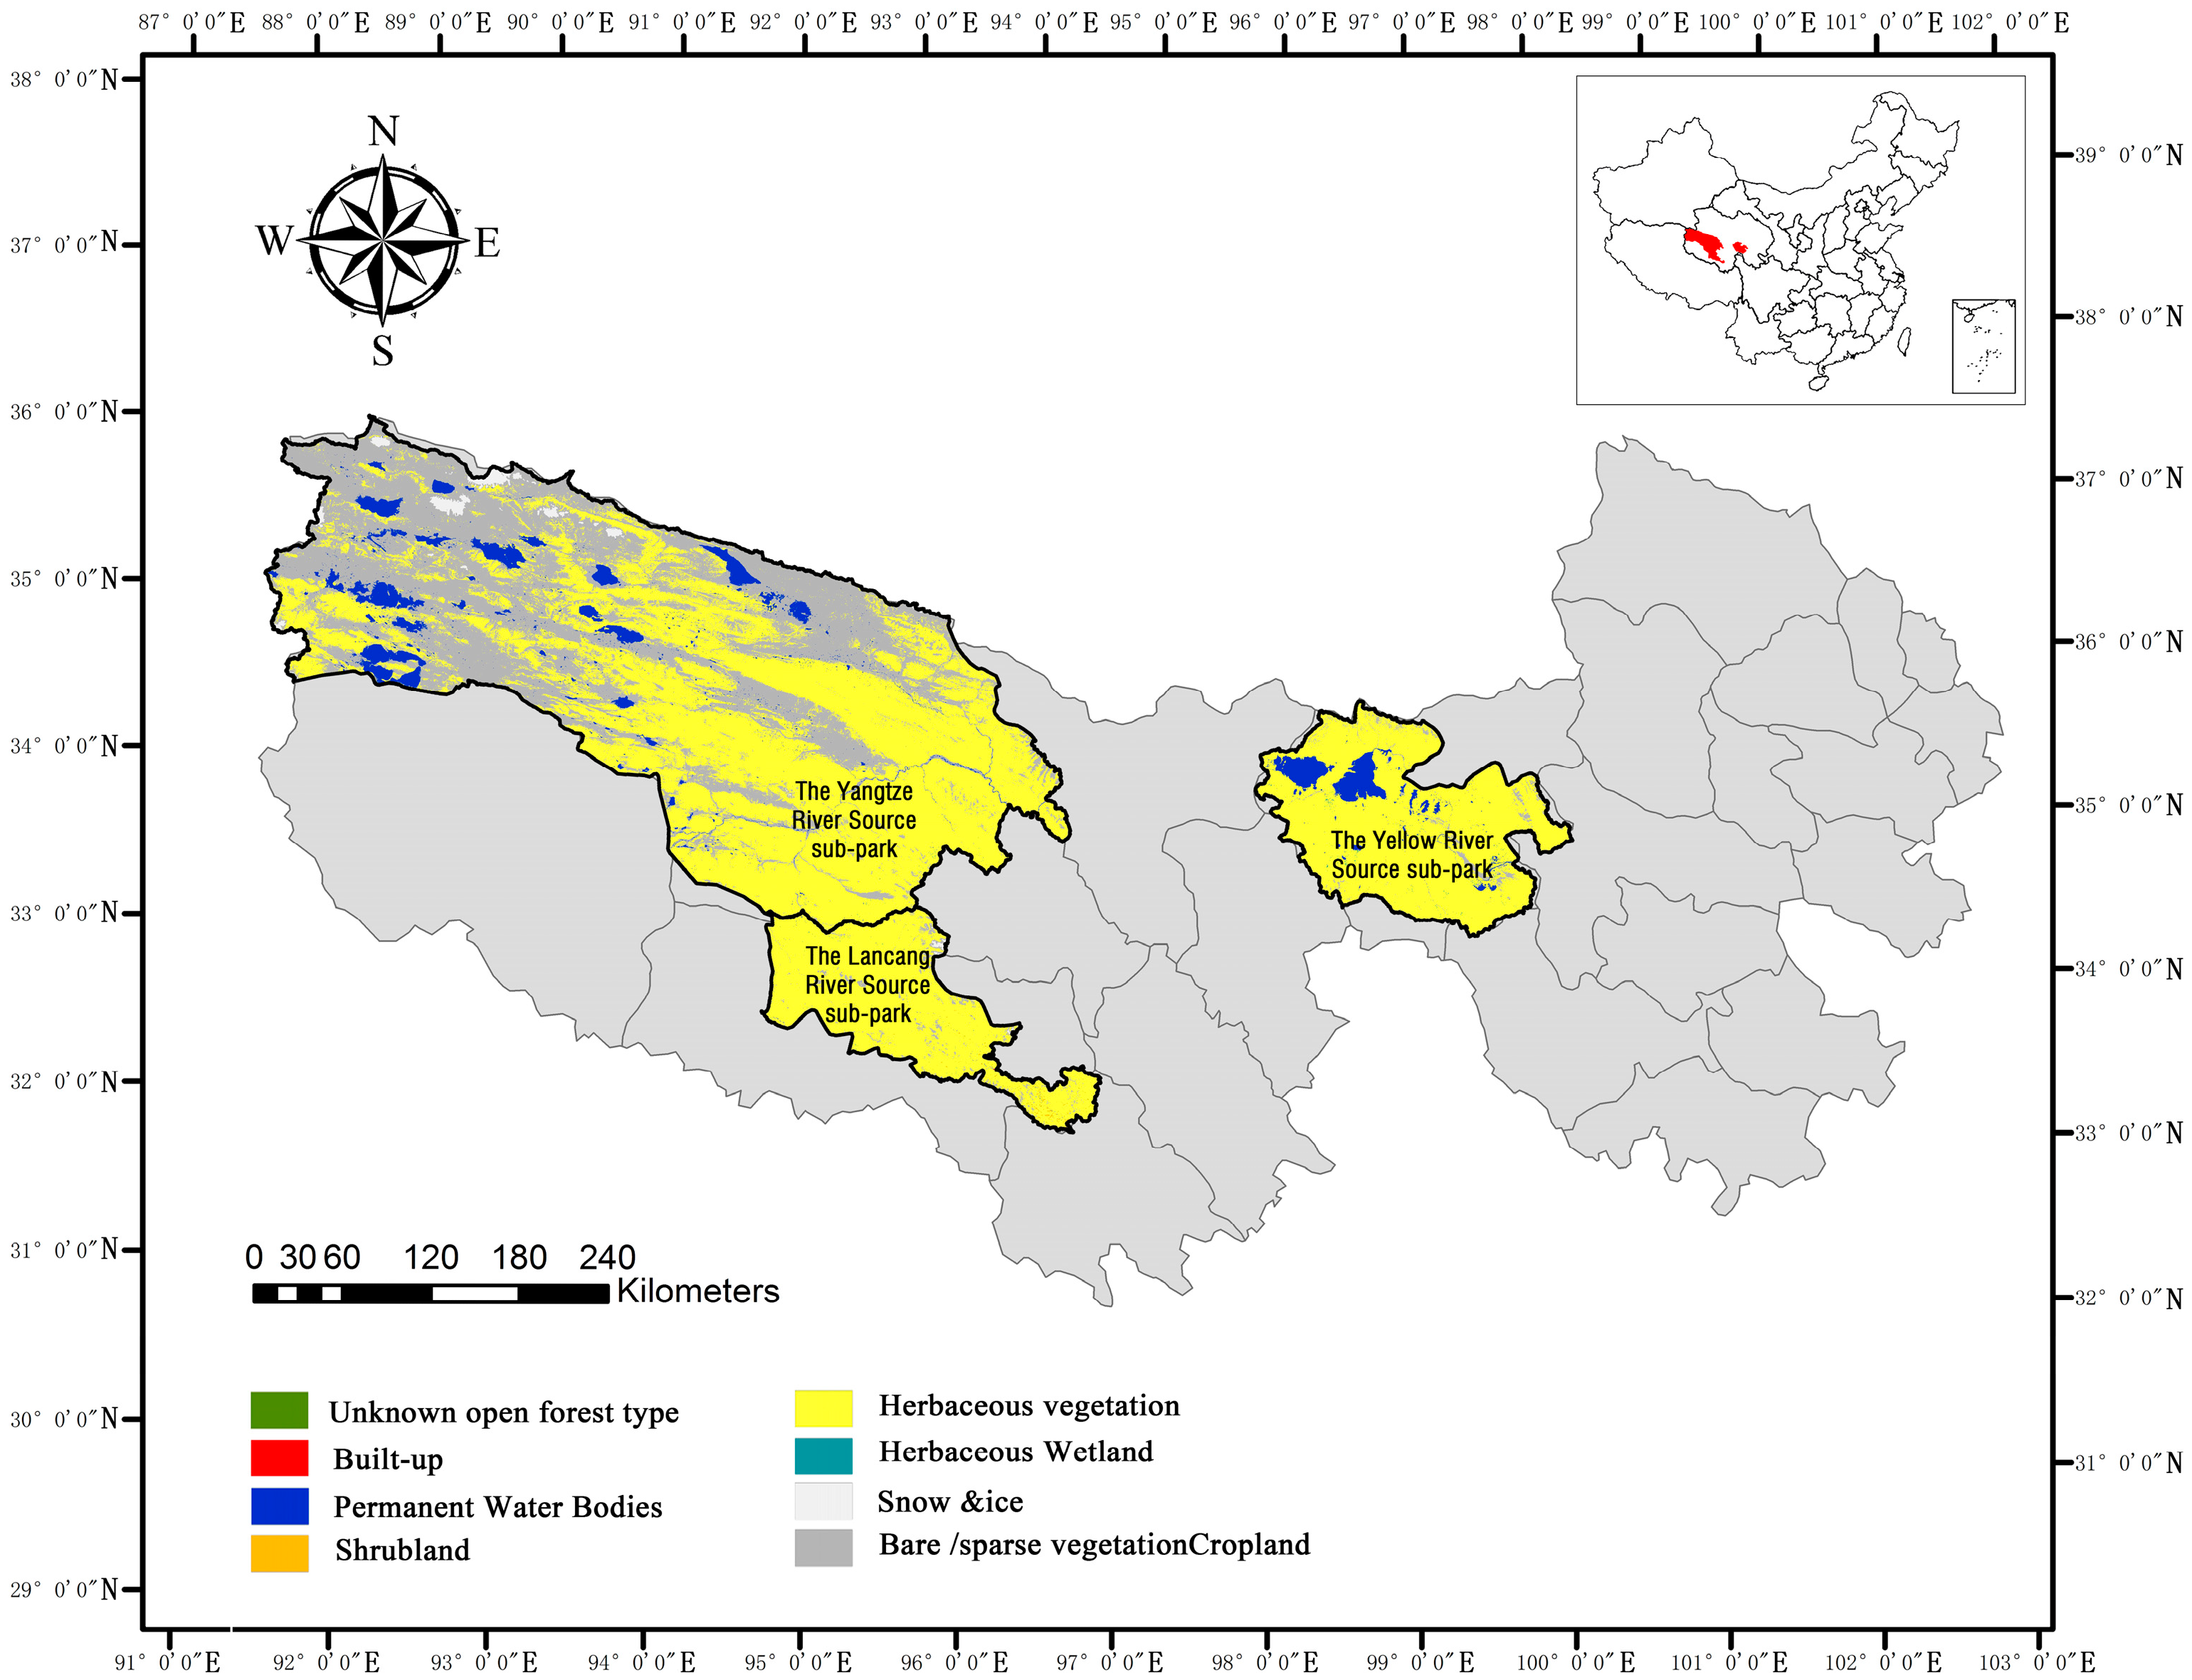
3.1. Study Area
3.2. Identification of Key Conservation Areas of the EBS
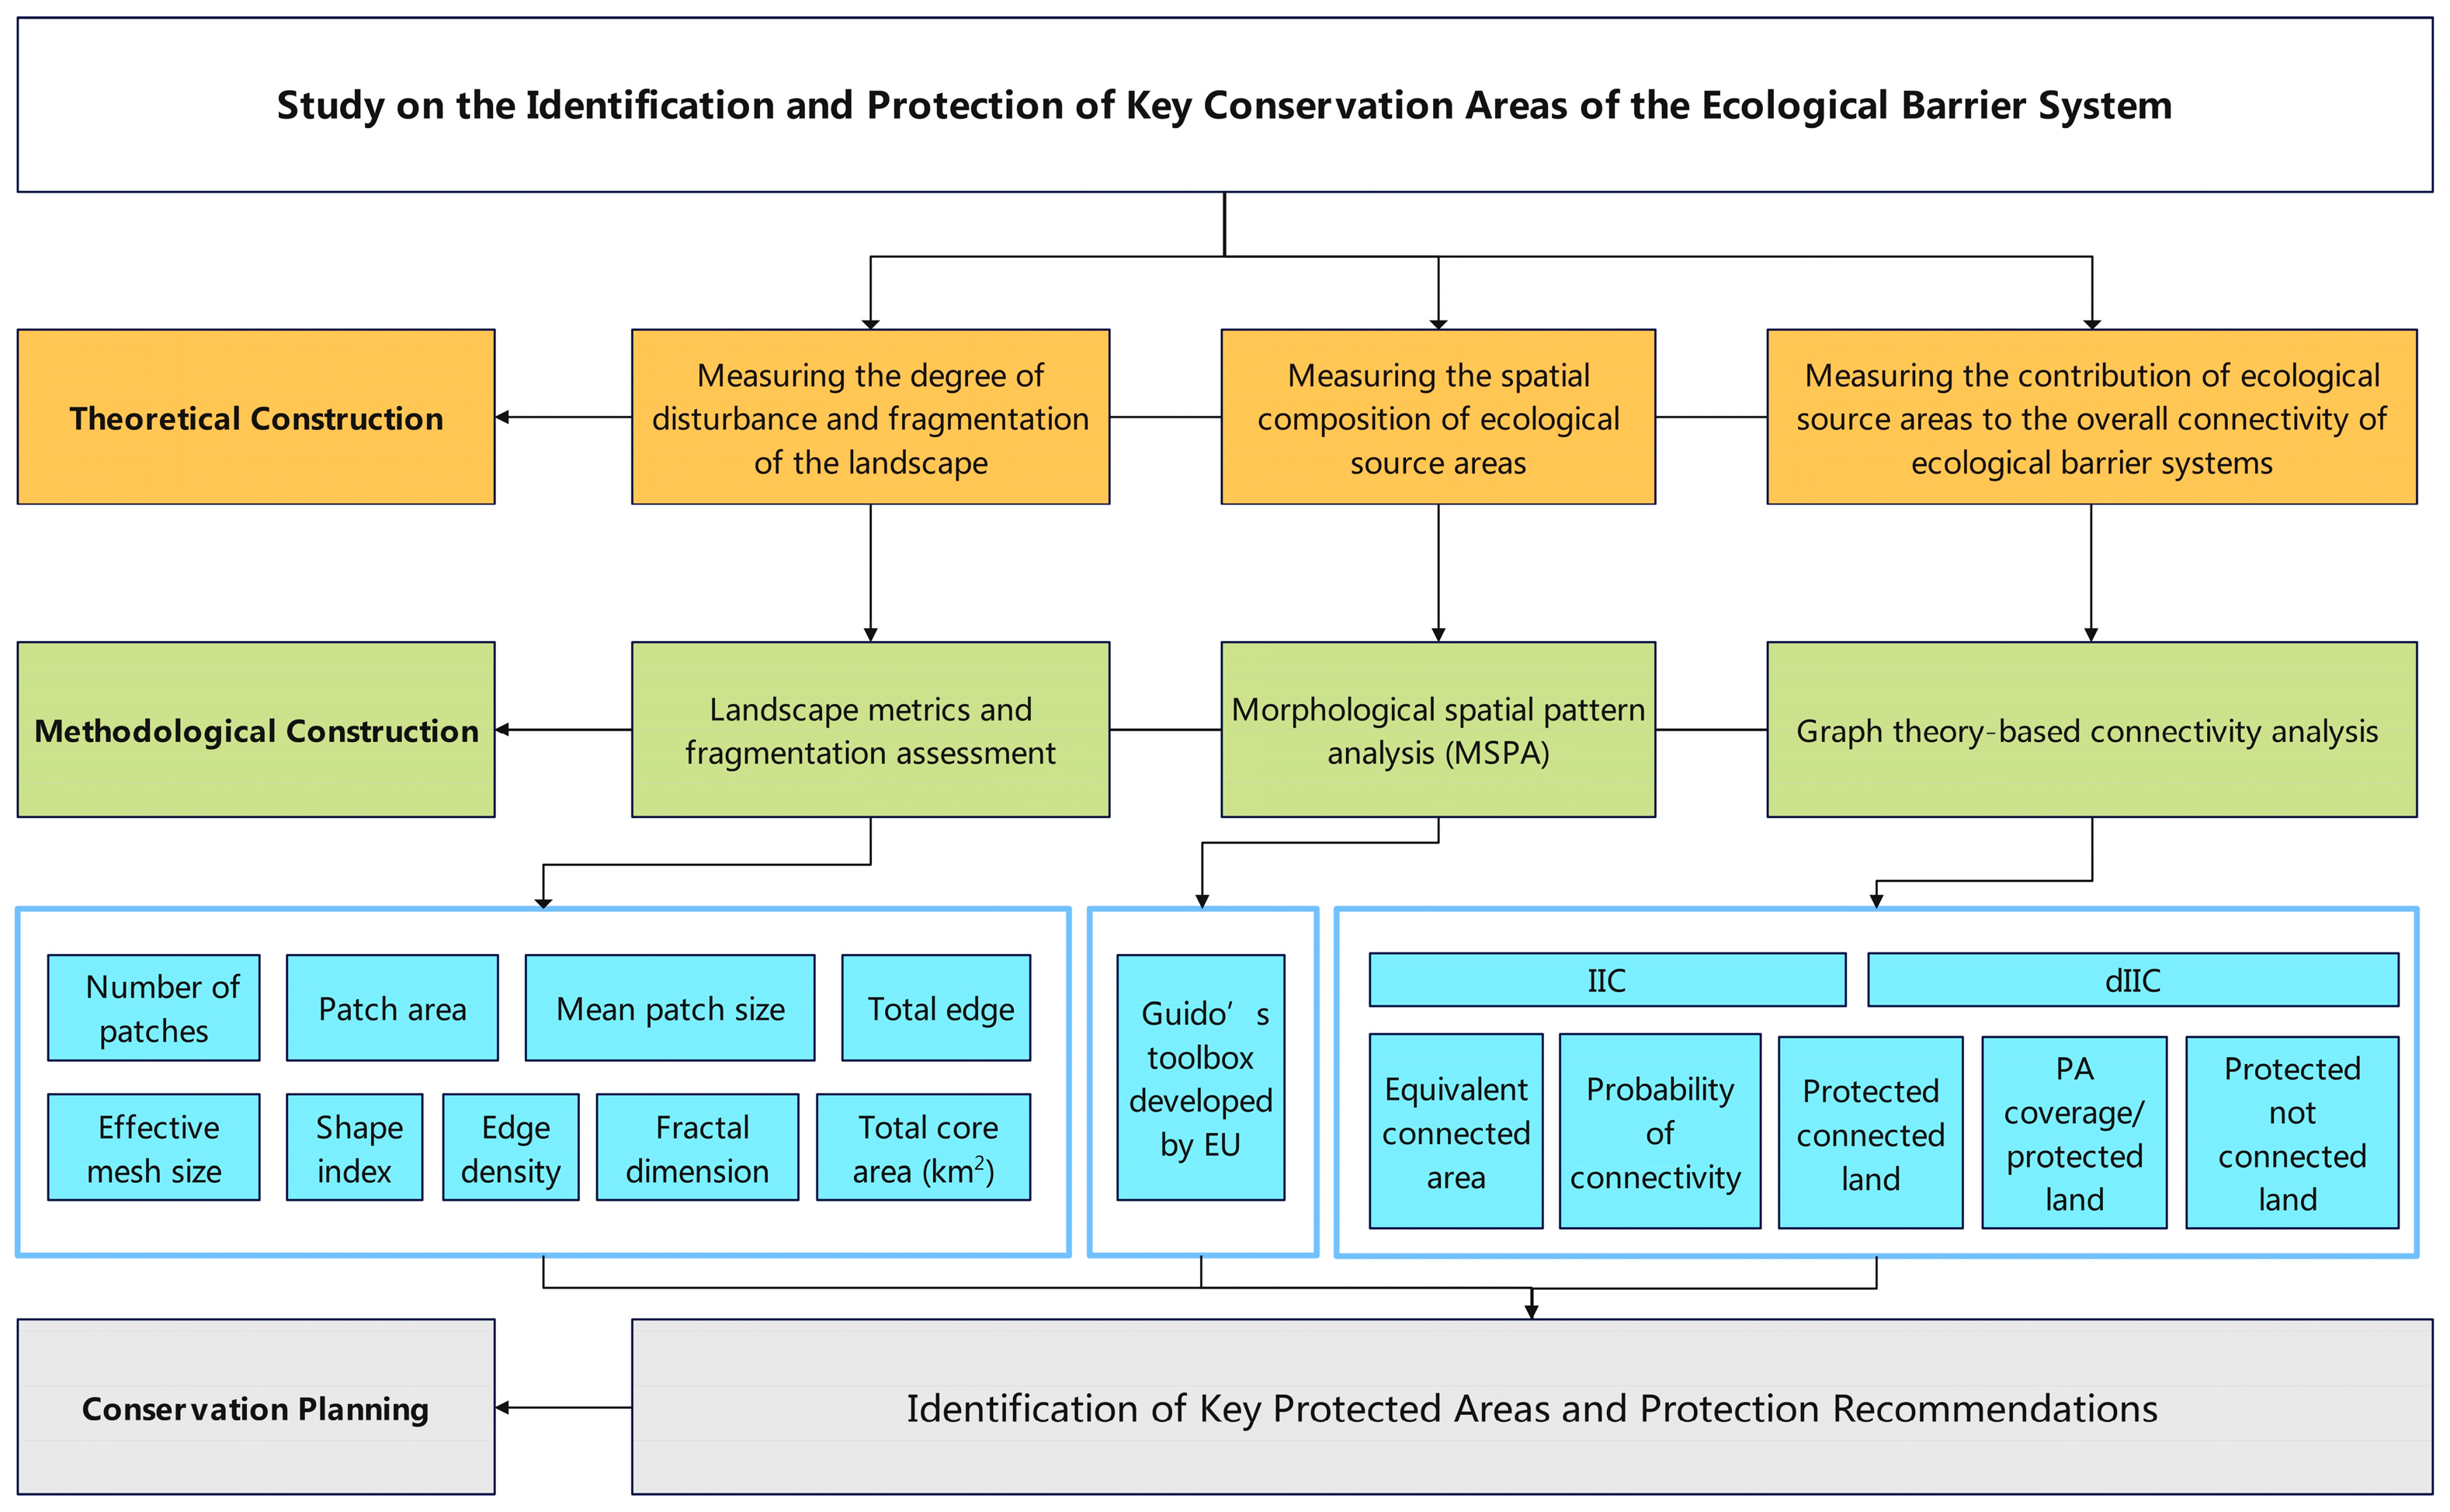
3.2.1. Overview of the Analytical Framework and Data Processing
3.2.2. Fragmentation Analysis of the EBS Source Patches
3.2.3. Morphological Spatial Pattern Analysis
3.2.4. Connectivity Analysis from the Perspective of Graph Theory
4. Results
4.1. Overview of Fragmentation Analysis of the EBS in the SNP
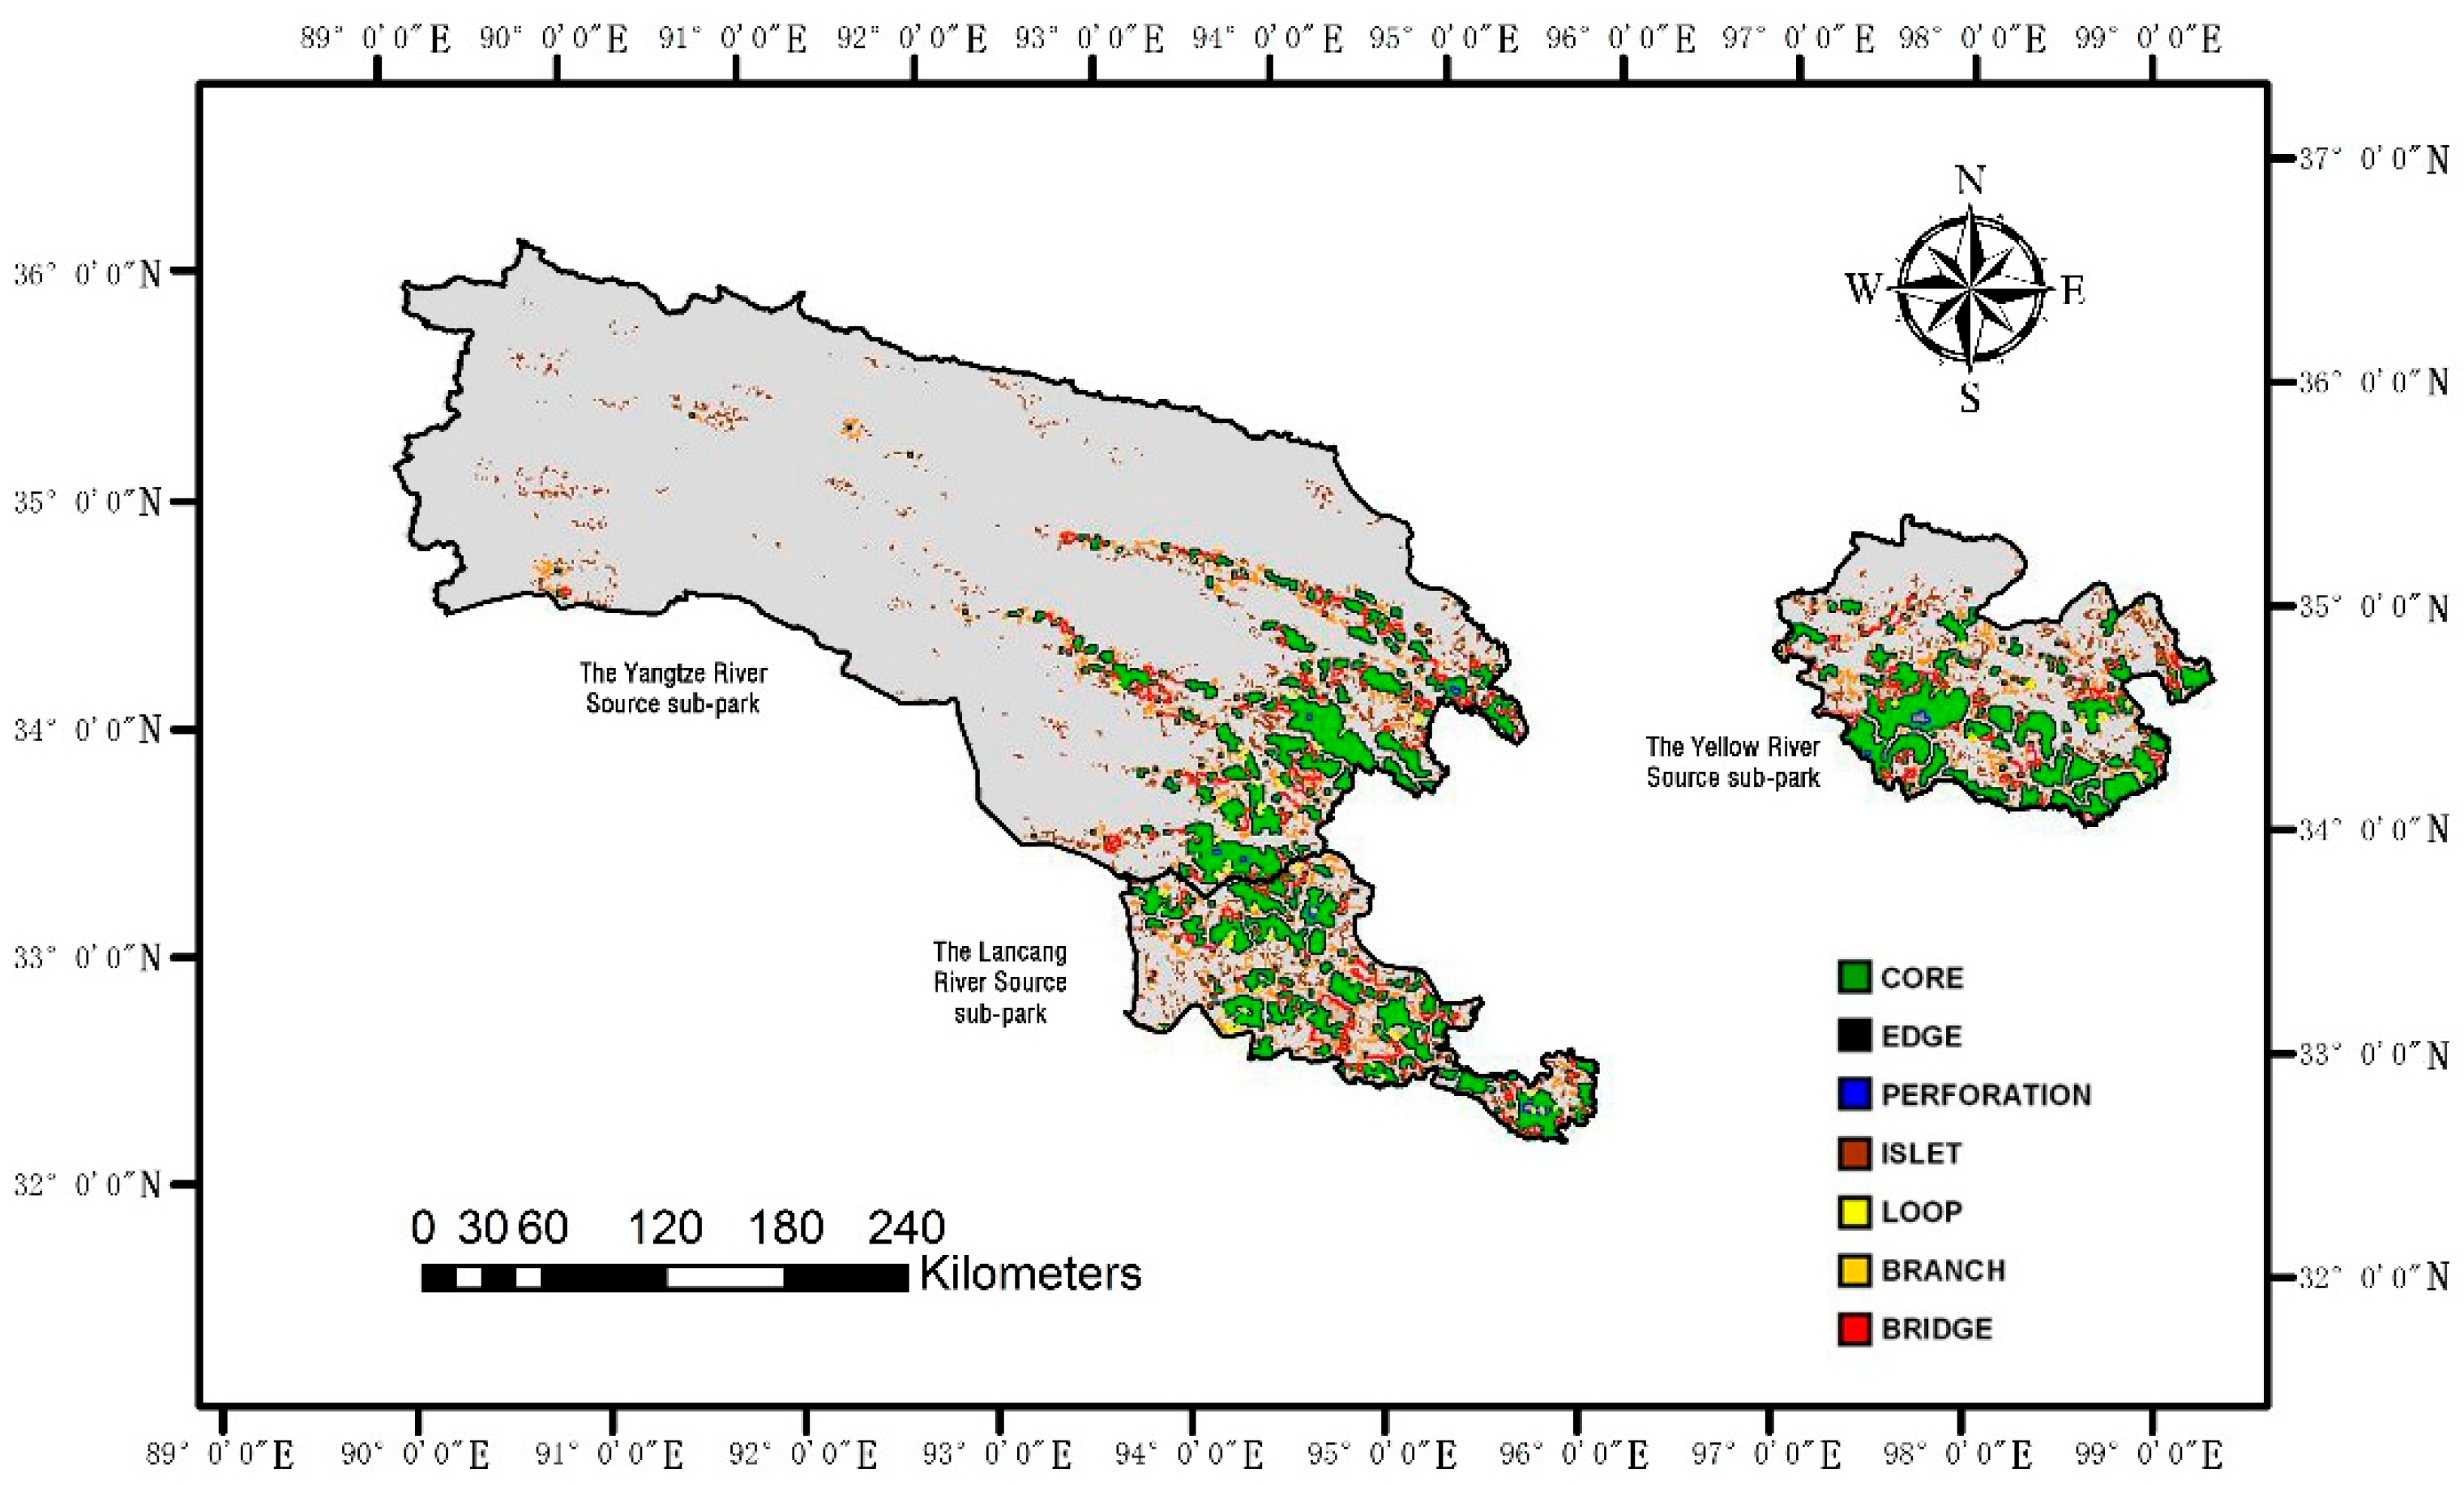
4.2. Morphological Spatial Patterns of Source Areas of the EBS
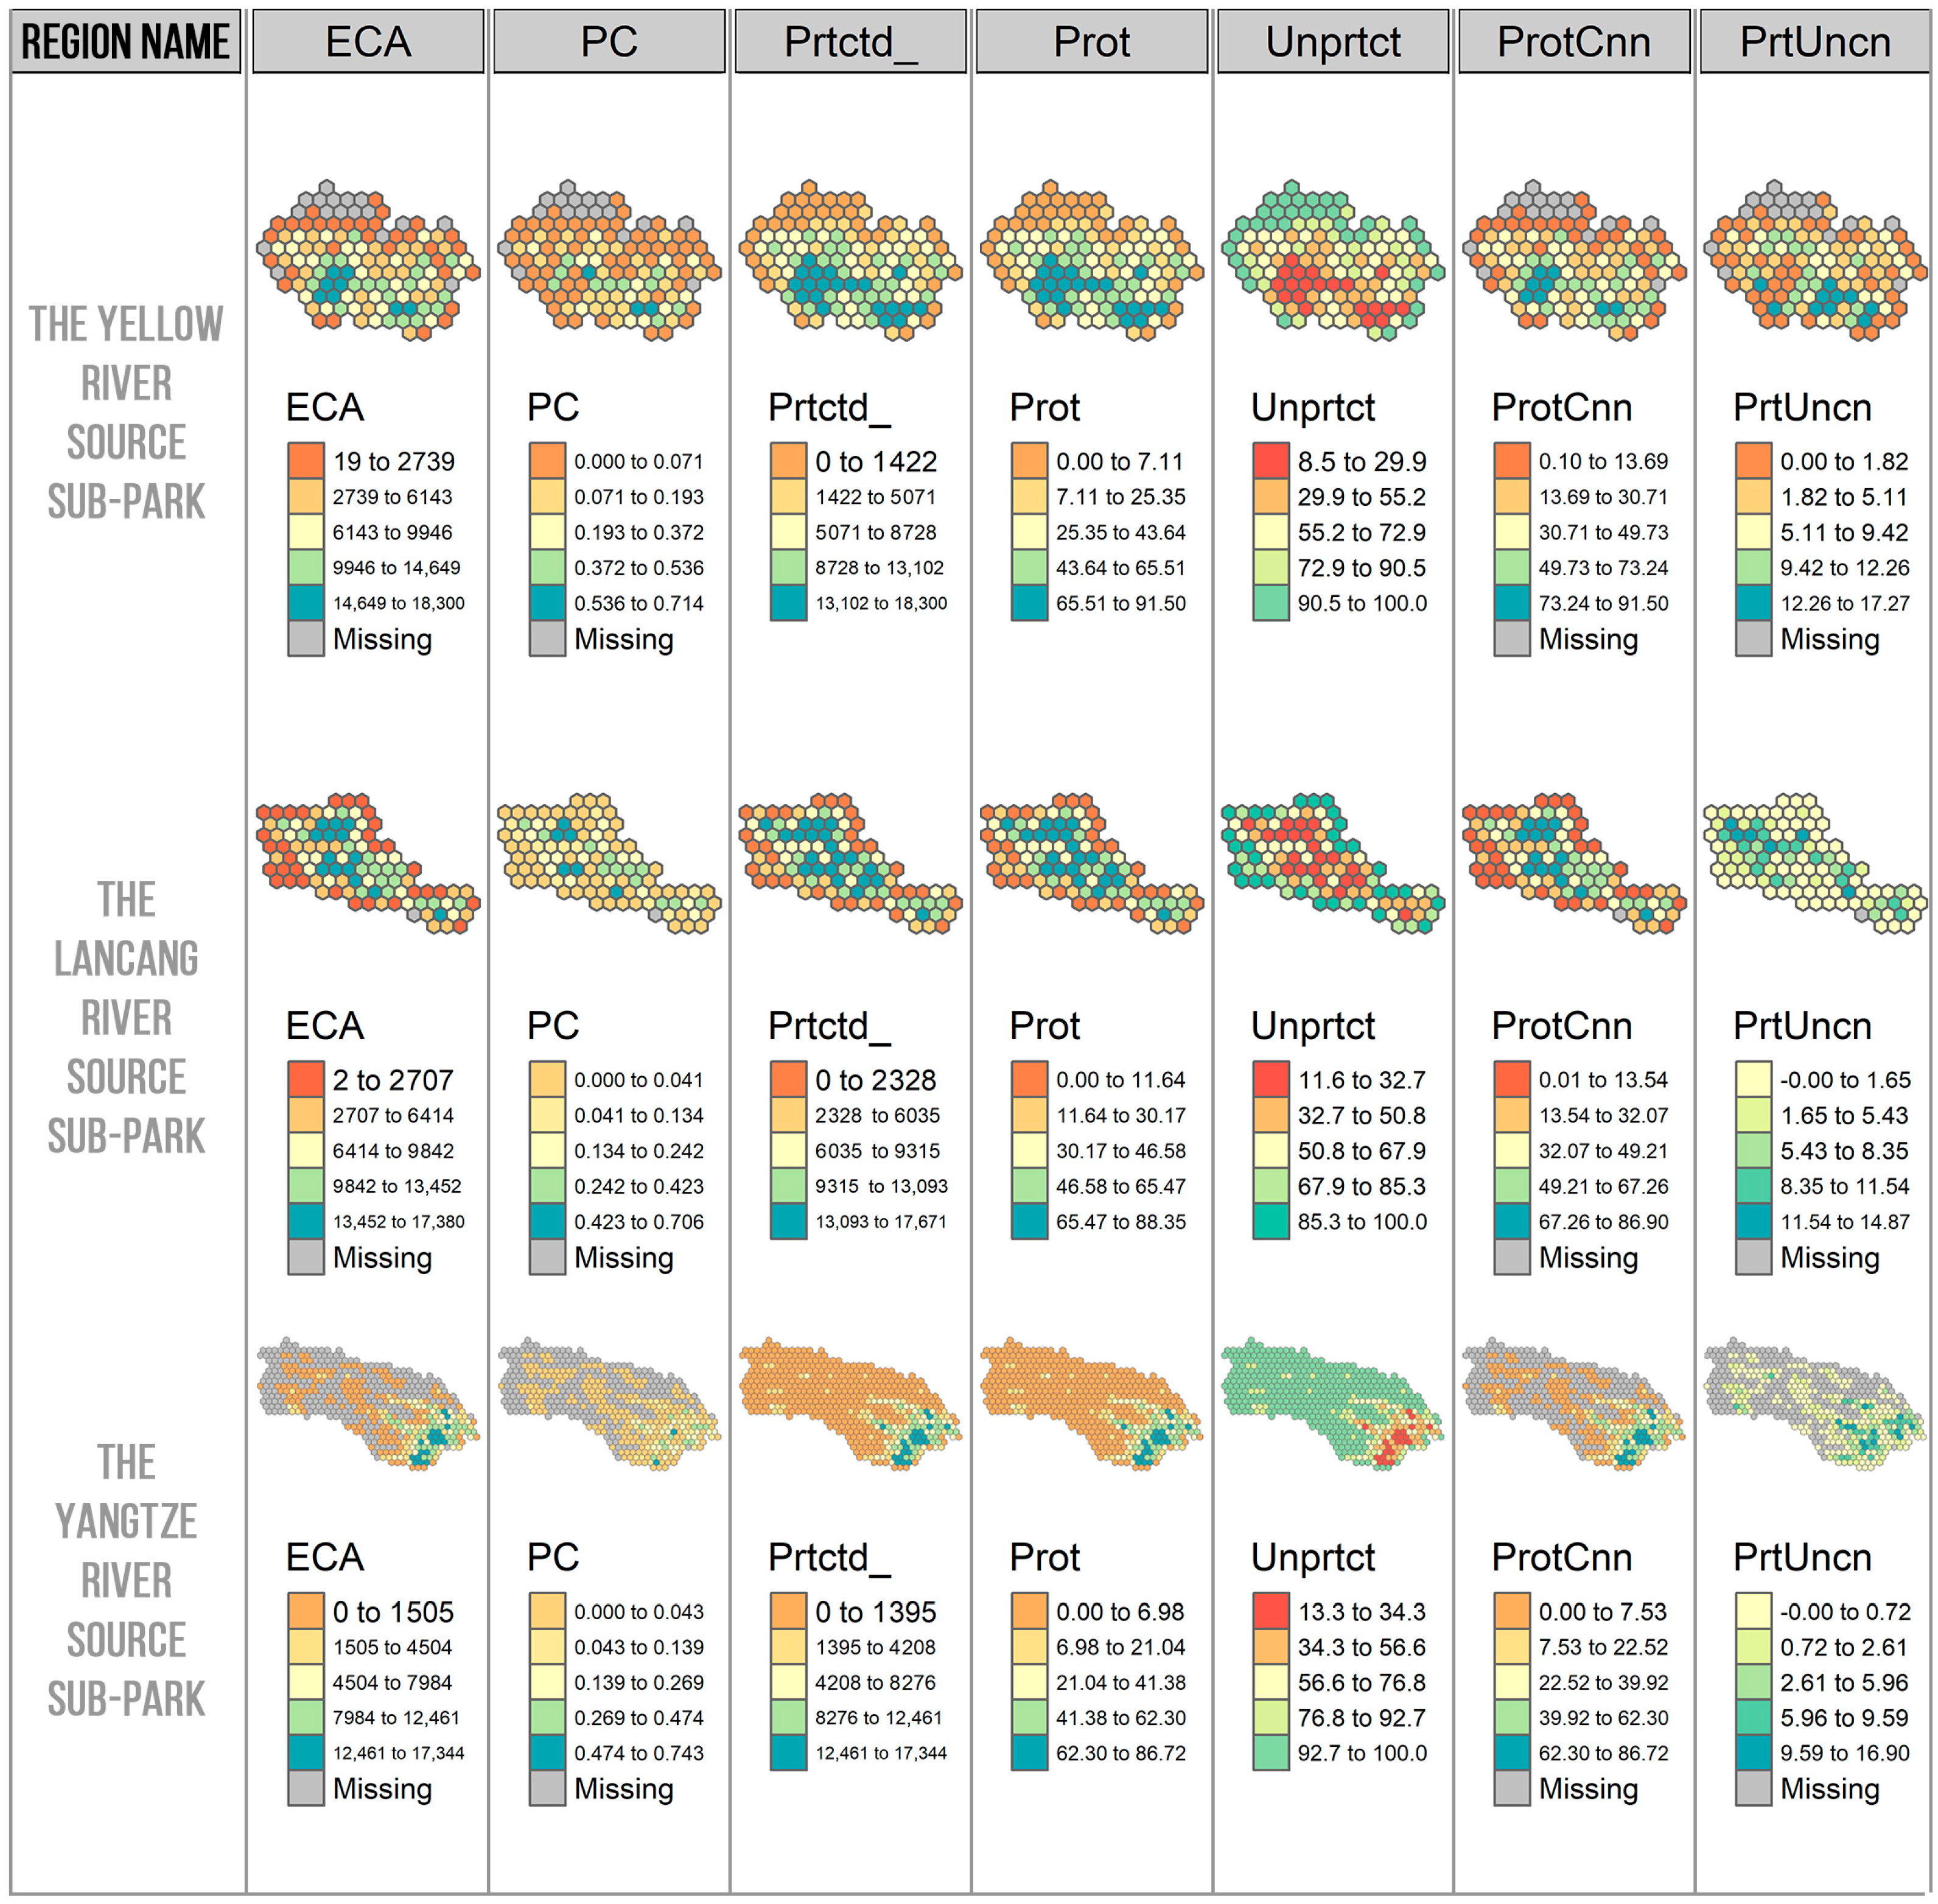
4.3. Graph-Based Network Analysis of the EBS
5. Discussion
5.1. Identification of Key Areas in the EBS based on Fragmentation, Spatial Composition, and Landscape Connectivity Analysis
5.2. Research Features and Technical Overview
5.3. Recommendations for the Conservation Planning of EBS
5.3.1. Refining the Zoning Plan for More Effective Management
- (1)
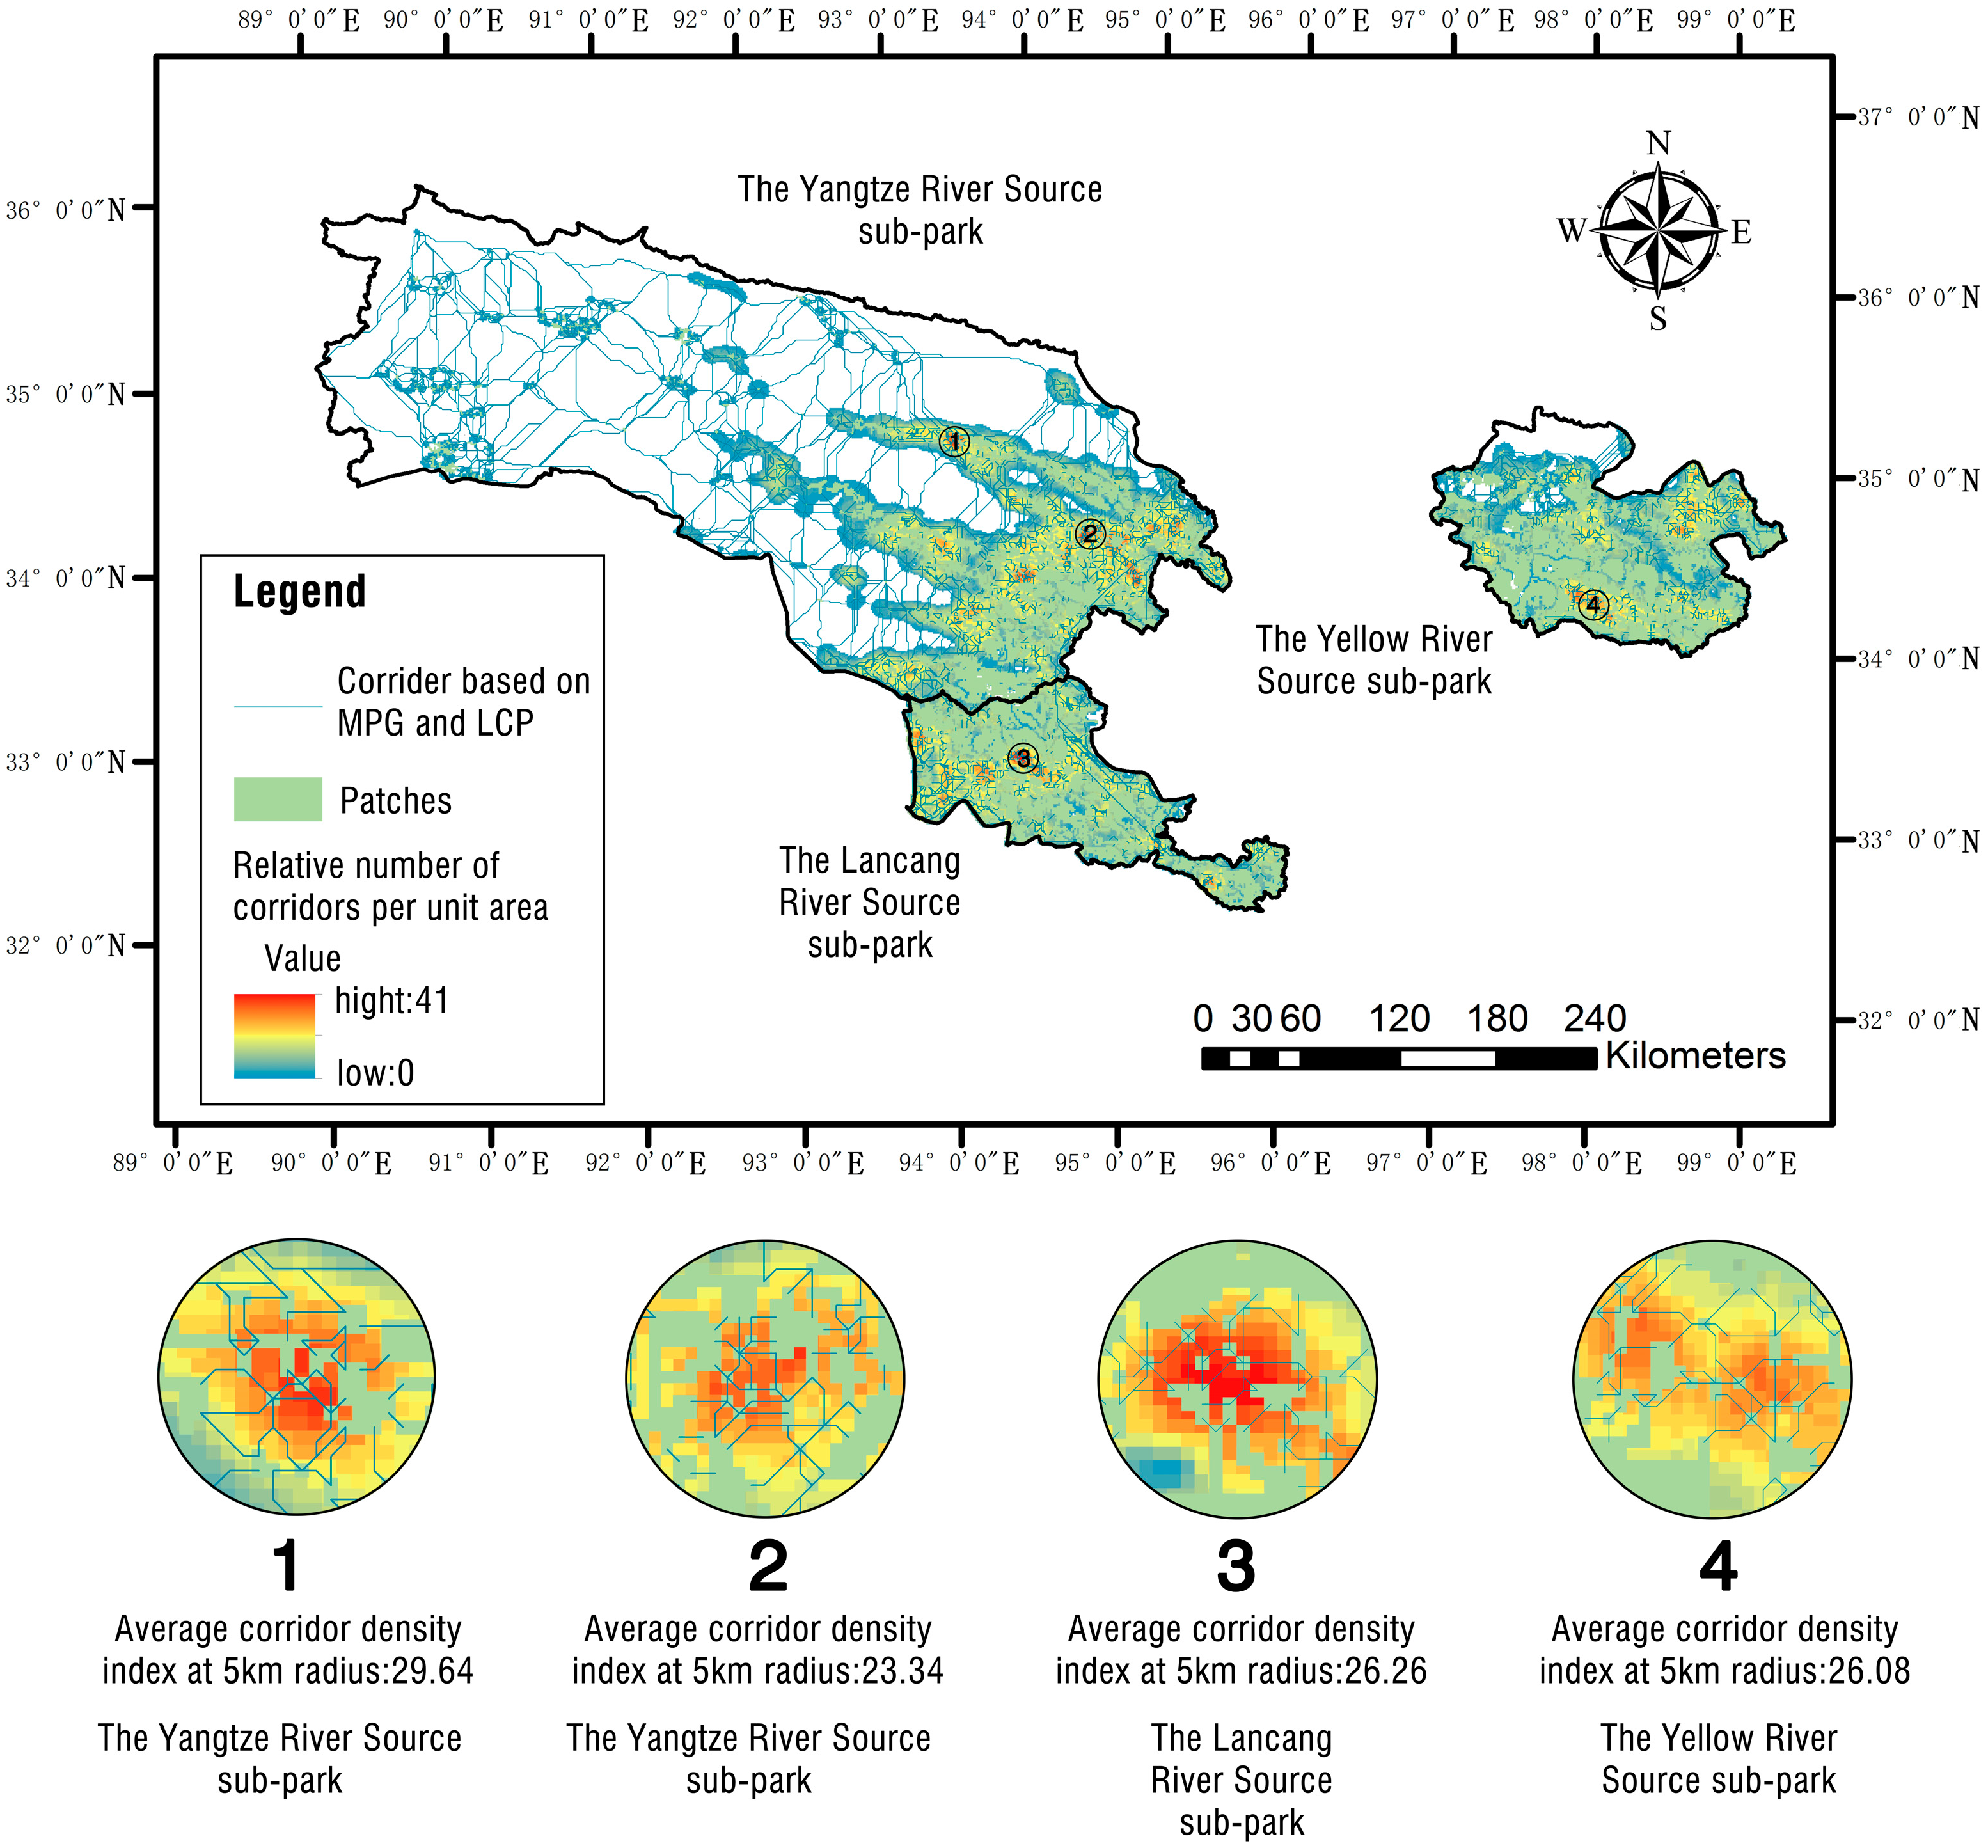
- This study highlights source areas that are vital to maintaining landscape connectivity at the regional level. Managers and practitioners should pay special attention to them. For example, in the Yangtze River Source sub-park, the east-west ecological corridors interconnect several large source areas in this region. It is important to protect those corridors from disturbance and fragmentation to maintain a larger ecological network.
- (2)
- This study also identifies small and fragmented areas scattered over the core source regions that are of great importance in preventing further landscape fragmentation and isolation, especially in the areas where native settlements live. It is vital to connect patches of these source areas.
5.3.2. Be Aware of Key Corridors and Nodes across Different Administrative Regions
5.4. Limitations of the Study
6. Conclusions
Author Contributions
Funding
Data Availability Statement
Acknowledgments
Conflicts of Interest
Appendix A
References
- Peng, Y.; Meng, M.; Huang, Z.; Wang, R.; Cui, G. Landscape Connectivity Analysis and Optimization of Qianjiangyuan National Park, Zhejiang Province, China. Sustainability 2021, 13, 5944. [Google Scholar] [CrossRef]
- Liu, S.; Deng, L.; Dong, S.; Zhao, Q.; Yang, J.; Wang, C. Landscape Connectivity Dynamics Based on Network Analysis in the Xishuangbanna Nature Reserve, China. Acta Oecologica 2014, 55, 66–77. [Google Scholar] [CrossRef]
- Li, C.; Wu, Y.; Gao, B.; Zheng, K.; Wu, Y.; Wang, M. Construction of Ecological Security Pattern of National Ecological Barriers for Ecosystem Health Maintenance. Ecol. Indic. 2023, 146, 109801. [Google Scholar] [CrossRef]
- Zhang, J.; Cao, Y.; Ding, F.; Wu, J.; Chang, I.-S. Regional Ecological Security Pattern Construction Based on Ecological Barriers: A Case Study of the Bohai Bay Terrestrial Ecosystem. Sustainability 2022, 14, 5384. [Google Scholar] [CrossRef]
- Peng, J.; Yang, Y.; Liu, Y.; Hu, Y.; Du, Y.; Meersmans, J.; Qiu, S. Linking Ecosystem Services and Circuit Theory to Identify Ecological Security Patterns. Sci. Total Environ. 2018, 644, 781–790. [Google Scholar] [CrossRef] [PubMed]
- Yuan, Z.; Li, W.; Wang, Y.; Zhu, D.; Wang, Q.; Liu, Y.; Zhou, L. Ecosystem Health Evaluation and Ecological Security Patterns Construction Based on VORSD and Circuit Theory: A Case Study in the Three Gorges Reservoir Region in Chongqing, China. Int. J. Environ. Res. Public Health 2023, 20, 320. [Google Scholar] [CrossRef] [PubMed]
- Yang, L.; Suo, M.; Gao, S.; Jiao, H. Construction of an Ecological Network Based on an Integrated Approach and Circuit Theory: A Case Study of Panzhou in Guizhou Province. Sustainability 2022, 14, 9136. [Google Scholar] [CrossRef]
- Sy, M.; Keenleyside, K.; Adare, K.; Reader, B.; Plante, M.; Deering, P. Protecting Native Biodiversity from High-Impact Invasive Species through the Protected Areas of Parks Canada. Biodiversity 2009, 10, 51–55. [Google Scholar] [CrossRef]
- Crumpacker, D.W. Prospects for Sustainability of Biodiversity Based on Conservation Biology and US Forest Service Approaches to Ecosystem Management. Landsc. Urban Plan. 1998, 40, 47–71. [Google Scholar] [CrossRef]
- Xu, H.; Plieninger, T.; Primdahl, J. A Systematic Comparison of Cultural and Ecological Landscape Corridors in Europe. Land 2019, 8, 41. [Google Scholar] [CrossRef]
- Jessup, K.L. The National Park Service—Professionalizing the Conservation of America’s Historic Landscapes. J. Archit. Conserv. 1999, 5, 24–42. [Google Scholar] [CrossRef]
- Di Minin, E.; Toivonen, T. Global Protected Area Expansion: Creating More than Paper Parks. BioScience 2015, 65, 637–638. [Google Scholar] [CrossRef] [PubMed]
- Hay-Edie, T.; Howard, P.; Martin, G.; McCandless, S. The Roles of Local, National and International Designations in Conserving Biocultural Diversity on a Landscape Scale. Int. J. Herit. Stud. 2011, 17, 527–536. [Google Scholar] [CrossRef]
- Liang, J.; He, X.; Zeng, G.; Zhong, M.; Gao, X.; Li, X.; Li, X.; Wu, H.; Feng, C.; Xing, W.; et al. Integrating Priority Areas and Ecological Corridors into National Network for Conservation Planning in China. Sci. Total Environ. 2018, 626, 22–29. [Google Scholar] [CrossRef] [PubMed]
- Tang, X. The Establishment of National Park System: A New Milestone for the Field of Nature Conservation in China. Int. J. Geoheritage Parks 2020, 8, 195–202. [Google Scholar] [CrossRef]
- Brotherton, D.I. Issues in National Park Administration. Environ. Plan A 1985, 17, 47–58. [Google Scholar] [CrossRef]
- Fedy, B.C.; Doherty, K.E.; Aldridge, C.L.; O’Donnell, M.; Beck, J.L.; Bedrosian, B.; Gummer, D.; Holloran, M.J.; Johnson, G.D.; Kaczor, N.W.; et al. Habitat Prioritization across Large Landscapes, Multiple Seasons, and Novel Areas: An Example Using Greater Sage-Grouse in Wyoming. Wildl. Monogr. 2014, 190, 1–39. [Google Scholar] [CrossRef]
- Liu, S.; Yin, Y.; Li, J.; Cheng, F.; Dong, S.; Zhang, Y. Using Cross-Scale Landscape Connectivity Indices to Identify Key Habitat Resource Patches for Asian Elephants in Xishuangbanna, China. Landsc. Urban Plan. 2018, 171, 80–87. [Google Scholar] [CrossRef]
- Saura, S.; de la Fuente, B. Connectivity as the Amount of Reachable Habitat: Conservation Priorities and the Roles of Habitat Patches in Landscape Networks. In Learning Landscape Ecology: A Practical Guide to Concepts and Techniques; Gergel, S.E., Turner, M.G., Eds.; Springer: New York, NY, USA, 2017; pp. 229–254. ISBN 978-1-4939-6374-4. [Google Scholar]
- Kosmas, C.; Karamesouti, M.; Kounalaki, K.; Detsis, V.; Vassiliou, P.; Salvati, L. Land Degradation and Long-Term Changes in Agro-Pastoral Systems: An Empirical Analysis of Ecological Resilience in Asteroussia—Crete (Greece). CATENA 2016, 147, 196–204. [Google Scholar] [CrossRef]
- Wu, D.; Sun, H.; Xu, H.; Zhang, T.; Xu, Z.; Wu, L. How Can Ecological Land Be Deployed to Cool the Surface Thermal Environment? A Case Study from the Perspectives of Patch and Network. Remote Sens. 2023, 15, 1061. [Google Scholar] [CrossRef]
- Belote, R.T.; Dietz, M.S.; McRae, B.H.; Theobald, D.M.; McClure, M.L.; Irwin, G.H.; McKinley, P.S.; Gage, J.A.; Aplet, G.H. Identifying Corridors among Large Protected Areas in the United States. PLoS ONE 2016, 11, e0154223. [Google Scholar] [CrossRef] [PubMed]
- Aziz, H.A.; Rasidi, M.H. The Role of Green Corridors for Wildlife Conservation in Urban Landscape: A Literature Review. IOP Conf. Ser. Earth Environ. Sci. 2014, 18, 012093. [Google Scholar] [CrossRef]
- Yang, J.; Gong, J.; Tang, W. Prioritizing Spatially Aggregated Cost-Effective Sites in Natural Reserves to Mitigate Human-Induced Threats: A Case Study of the Qinghai Plateau, China. Sustainability 2019, 11, 1346. [Google Scholar] [CrossRef]
- Niyogi, R.; Sarkar, M.S.; Niyogi, V.S.; Hazra, P.; John, R. Habitat Connectivity for Conserving Cervids in a Multifunctional Landscape. J. Nat. Conserv. 2022, 68, 126212. [Google Scholar] [CrossRef]
- Parrott, L.; Kyle, C.; Hayot-Sasson, V.; Bouchard, C.; Cardille, J.A. Planning for Ecological Connectivity across Scales of Governance in a Multifunctional Regional Landscape. Ecosyst. People 2019, 15, 204–213. [Google Scholar] [CrossRef]
- Duflot, R.; Avon, C.; Roche, P.; Bergès, L. Combining Habitat Suitability Models and Spatial Graphs for More Effective Landscape Conservation Planning: An Applied Methodological Framework and a Species Case Study. J. Nat. Conserv. 2018, 46, 38–47. [Google Scholar] [CrossRef]
- Trabucchi, M.; O’Farrell, P.J.; Notivol, E.; Comín, F.A. Mapping Ecological Processes and Ecosystem Services for Prioritizing Restoration Efforts in a Semi-Arid Mediterranean River Basin. Environ. Manag. 2014, 53, 1132–1145. [Google Scholar] [CrossRef] [PubMed]
- Jiao, W.; Liu, X.; He, S. Establishing an Ecological Monitoring System for National Parks in China: A Theoretical Framework. Ecol. Indic. 2022, 143, 109414. [Google Scholar] [CrossRef]
- Hou, W.; Zhai, L.; Walz, U. Identification of Spatial Conservation and Restoration Priorities for Ecological Networks Planning in a Highly Urbanized Region: A Case Study in Beijing-Tianjin-Hebei, China. Ecol. Eng. 2023, 187, 106859. [Google Scholar] [CrossRef]
- Avon, C.; Bergès, L. Prioritization of Habitat Patches for Landscape Connectivity Conservation Differs between Least-Cost and Resistance Distances. Landsc. Ecol 2016, 31, 1551–1565. [Google Scholar] [CrossRef]
- Liu, J.; Chen, J.; Yang, Y.; You, H.; Han, X. Construction and Optimization of an Ecological Network in the Yellow River Source Region Based on MSPA and MCR Modelling. Int J Environ. Res Public Health 2023, 20, 3724. [Google Scholar] [CrossRef] [PubMed]
- Xu, X.L. Spatial Distribution Dataset of China’s Annual Vegetation Index (NDVI). Available online: https://www.resdc.cn/DOI/doi.aspx?DOIid=49 (accessed on 1 May 2021).
- Godínez-Gómez, O.; Correa, A.; Camilo, A. Connectscape/Makurhini: Analyzing Landscape Connectivity (v1.0.0). 2020. Available online: https://connectscape.github.io/Makurhini/ (accessed on 1 May 2021).
- McGarigal, K. FRAGSTATS: Spatial Pattern Analysis Program for Quantifying Landscape Structure; US Department of Agriculture, Forest Service, Pacific Northwest Research Station: Portland, OR, USA, 1995; Volume 351. [Google Scholar]
- Jaeger, J.A.G. Landscape Division, Splitting Index, and Effective Mesh Size: New Measures of Landscape Fragmentation. Landsc. Ecol. 2000, 15, 115–130. [Google Scholar] [CrossRef]
- Southworth, J.; Nagendra, H.; Tucker, C. Fragmentation of a Landscape: Incorporating Landscape Metrics into Satellite Analyses of Land-Cover Change. Landsc. Res. 2002, 27, 253–269. [Google Scholar] [CrossRef]
- Zeng, H.; Wu, X.B. Utilities of Edge-Based Metrics for Studying Landscape Fragmentation. Comput. Environ. Urban Syst. 2005, 29, 159–178. [Google Scholar] [CrossRef]
- Hargis, C.D.; Bissonette, J.A.; David, J.L. The Behavior of Landscape Metrics Commonly Used in the Study of Habitat Fragmentation. Landsc. Ecol. 1998, 13, 167–186. [Google Scholar] [CrossRef]
- Saura, S.; Estreguil, C.; Mouton, C.; Rodríguez-Freire, M. Network Analysis to Assess Landscape Connectivity Trends: Application to European Forests (1990–2000). Ecol. Indic. 2011, 11, 407–416. [Google Scholar] [CrossRef]
- Saura, S.; Bastin, L.; Battistella, L.; Mandrici, A.; Dubois, G. Protected Areas in the World’s Ecoregions: How Well Connect-ed Are They? Ecol. Indic. 2017, 76, 144–158. [Google Scholar] [CrossRef] [PubMed]
- Urban, D.; Keitt, T. Landscape Connectivity: A Graph-Theoretic Perspective. Ecology 2001, 82, 1205–1218. [Google Scholar] [CrossRef]
- Minor, E.S.; Urban, D.L. A Graph-Theory Framework for Evaluating Landscape Connectivity and Conservation Planning. Conserv. Biol. 2008, 22, 297–307. [Google Scholar] [CrossRef]
- Zambrano, L.; Aronson, M.F.J.; Fernandez, T. The Consequences of Landscape Fragmentation on Socio-Ecological Patterns in a Rapidly Developing Urban Area: A Case Study of the National Autonomous University of Mexico. Front. Environ. Sci. 2019, 7, 152. [Google Scholar] [CrossRef]
- Cabarga-Varona, A. The Function of Plantation Forestry in Landscape Connectivity. Appl. Ecol. Environ. Res. 2016, 14, 527–542. [Google Scholar] [CrossRef]
- Grunewald, K.; Bastian, O.; Louda, J.; Arcidiacono, A.; Brzoska, P.; Bue, M.; Cetin, N.I.; Dworczyk, C.; Dubova, L.; Fitch, A.; et al. Lessons Learned from Implementing the Ecosystem Services Concept in Urban Planning. Ecosyst. Serv. 2021, 49, 101273. [Google Scholar] [CrossRef]

| Landscape Metrics | Formula | Description and Interpretation |
|---|---|---|
| Patch area (PA) | - | PA is the total area of the source patches of the EBS. |
| Mean patch size (MPS) | MPS is the average area of the source patches of the EBS. | |
| Number of patches (NP) | NP is the number of the source patches of the EBS. | |
| Edge density (ED) | ED equals the total length of all patch edges per unit area within the EBS source areas. | |
| Total edge (TE) | TE equals the sum of the lengths (m) of all edge segments within the EBS source areas. Together with the total patch area, TE can be used to compute edge density. | |
| Total core area (km2) (TCA) | TCA equals the sum of the core areas of each patch of the EBS source areas. | |
| Shape index (SI) | SI is an indicator describing the compactness or looseness of the shape of the source patch, ranging from 1 (extremely compact, e.g., round) to positive infinity (extremely loose). | |
| Fractal dimension (FD) | FD is a metric that describes the complexity of the morphology and the fragmentation; the larger the value, the rougher and more fragmented the morphology. | |
| Effective mesh size (EMS) | EMS is a metric that describes landscape fragmentation and is calculated based on the probability that two randomly placed points in space fall within the same patch. EMS represents the average size of an area when the study area is divided into S segments, each of which is the same size At (total area of the study regions/S). |
| Connectivity Metrics | Formula | Description |
|---|---|---|
| Equivalent Connected Area (ECA) | ECA is defined as the size of a single habitat patch that provides the same probability value of connectivity (maximum connectivity) as the actual habitat pattern in the landscape. | |
| Probability of Connectivity (PC) | PC is defined as the probability that two randomly placed points in the landscape will fall into an area of interconnected habitat given n habitat patches and direct connections between them. It is a network-based habitat availability index that quantifies functional connectivity. | |
| Protected Connected Land (ProtConn) | ProtConn is defined as the percentage of connected protected land in the study area. | |
| PA Coverage/Protected Land (Prot) | Prot is defined as the percentage of the study area covered by protected land. | |
| Protected Not Connected Land (ProtUnconn) | ProtUnconn is defined as the percentage of the study area covered by protected lands that are isolated. |
| Landscape Metrics | The SNP | The Lancang River Source Sub-Park | The Yangtze River Source Sub-Park | The Yellow River Source Sub-Park |
|---|---|---|---|---|
| Patch area (km2) | 27,784.5437 | 7749.8225 | 11,188.4614 | 8710.8436 |
| Number of patches | 1225 | 222 | 674 | 337 |
| Size (mean) | 22.6813 | 34.9091 | 16.6001 | 25.8482 |
| Patches < minimum patch area | 707 | 124 | 407 | 182 |
| Patches < minimum patch area (%) | 3.146 | 1.798 | 4.4704 | 2.5077 |
| Total edge | 26,323.784 | 6981.469 | 11,823.117 | 7482.382 |
| Edge density | 0.9474 | 0.9009 | 1.0567 | 0.859 |
| Total Core Area (km2) | 16,169.2662 | 4594.9692 | 6122.8223 | 5370.502 |
| Cority | 0.3347 | 0.3243 | 0.3101 | 0.3887 |
| Shape Index (mean) | 46.0948 | 77.399 | 32.0057 | 31.6949 |
| FRAC (mean) | 1.1668 | 1.1674 | 1.1648 | 1.1609 |
| MESH (km2) | 1830.817 | 1324.662 | 1615.1 | 788 |
| Landscape Morphology Type | Area (km2) | Percentage of the Area of Ecological Barrier (%) | Percentage of Study Area (%) |
|---|---|---|---|
| Core | 10,197.36 | 36.68 | 8.22 |
| Edge | 9366.19 | 33.68 | 7.55 |
| Perforation | 136.46 | 0.5 | 0.11 |
| Islet | 3275.06 | 11.8 | 2.64 |
| Loop | 186.08 | 0.67 | 0.15 |
| Branch | 3361.90 | 12.08 | 2.71 |
| Bridge | 1277.77 | 4.59 | 1.03 |
Disclaimer/Publisher’s Note: The statements, opinions and data contained in all publications are solely those of the individual author(s) and contributor(s) and not of MDPI and/or the editor(s). MDPI and/or the editor(s) disclaim responsibility for any injury to people or property resulting from any ideas, methods, instructions or products referred to in the content. |
© 2024 by the authors. Licensee MDPI, Basel, Switzerland. This article is an open access article distributed under the terms and conditions of the Creative Commons Attribution (CC BY) license (https://creativecommons.org/licenses/by/4.0/).
Share and Cite
Wen, C.; Qiu, Y.; Wang, L. Identifying Key Locations of the Ecological-Barrier System to Support Conservation Planning: A Study of the Sanjiangyuan National Park. Forests 2024, 15, 1202. https://doi.org/10.3390/f15071202
Wen C, Qiu Y, Wang L. Identifying Key Locations of the Ecological-Barrier System to Support Conservation Planning: A Study of the Sanjiangyuan National Park. Forests. 2024; 15(7):1202. https://doi.org/10.3390/f15071202
Chicago/Turabian StyleWen, Chen, Yue Qiu, and Luqi Wang. 2024. "Identifying Key Locations of the Ecological-Barrier System to Support Conservation Planning: A Study of the Sanjiangyuan National Park" Forests 15, no. 7: 1202. https://doi.org/10.3390/f15071202
APA StyleWen, C., Qiu, Y., & Wang, L. (2024). Identifying Key Locations of the Ecological-Barrier System to Support Conservation Planning: A Study of the Sanjiangyuan National Park. Forests, 15(7), 1202. https://doi.org/10.3390/f15071202