Article

Discrepancies and Evaluation of Needle-Leaf and Tracheid Traits of Qinhai Spruce in Qilian Mountains, Northwest China

1
College of Forestry, Gansu Agricultural University, Lanzhou 730070, China
2
Academy of Water Resource Conservation Forests of Qilian Mountains in Gansu Province, Zhangye 734000, China
*
Author to whom correspondence should be addressed.
Forests 2024, 15(6), 960; https://doi.org/10.3390/f15060960
Submission received: 27 April 2024 / Revised: 23 May 2024 / Accepted: 28 May 2024 / Published: 31 May 2024
(This article belongs to the Section Genetics and Molecular Biology)

Abstract

:
Phenotypic variation analysis and comprehensive evaluation are important tools for selecting provenances of forest trees, which, in turn, is crucial for genetic improvement of forest trees. The study analyzed eight needle-leaf and fourteen tracheid trait indexes of ten provenances of Qinghai spruce forest stands. Multiple comparisons, correlation analysis, cluster analysis, and principal component analysis were used to evaluate the differences in needle-leaf and tracheid traits among the different provenances. The study found significant differences in the needle-leaf and tracheid traits among the provenances. All traits included 50 pairs of positive and 26 pairs of negative correlations. The coefficient of variation for the tracheid trait (18.86%) was higher than that for the needle-leaf trait (17.20%). A comprehensive evaluation of needle-leaf and tracheid traits was conducted using principal component analysis. The study demonstrated that the degree of variation in needle-leaf and tracheid traits among the provenances of Qinghai spruce was extensive, with a multitude of sources of variation. Therefore, it is crucial to strengthen the selection of good provenances in the early seed selection process. The results of the comprehensive evaluation can be utilized as a foundation for the selection of good provenances for carbon sequestration and timber properties.

1. Introduction

When the environment for plant growth changed due to geographic distribution, plants developed adaptive responses to regulate their own structural and physiological properties. This could result in varying degrees of morphological variation in phenotypic traits among plant populations or individuals, which could in turn affect the plant growth process [1]. The morphological characteristics of tracheids had a significant impact on the properties and uses of timber [2]. Wood properties were determined by the type, morphology, number, and arrangement of cells in the xylem. In coniferous timber, tracheids made up more than 90% of the wood volume, making wood tracheid morphology a crucial indicator of the nature of coniferous timber. Studying the variation in wood tracheid morphology was essential for improving the quality and efficient use of wood fibers [3,4]. Leaves were vital organs for plants to acquire and utilize survival resources through photosynthesis, respiration, and transpiration. The phenotypic traits of leaves had a direct impact on the physiological and biochemical processes of plants. There was a responsive relationship between leaf phenotypic traits and the environment [5,6]. Studying the variation in plant leaf phenotypic traits in diverse geographic regions enhances comprehension of the environment’s impact on plant leaf functional traits and the mechanisms of ecological adaptation [7,8,9].
Qinghai spruce (Picea crassifolia Kom.) of China’s endemic tree species, but also China’s northeastern edge of the Tibetan Plateau endemic tree species, is mainly distributed in Qinghai, Gansu Qilian Mountains, Ningxia Helan Mountains, and Inner Mongolia Daqingshan with an elevation of 1750–3550 m of the zone, distribution of the total area of 1366.59 km2, and total volume of 136,231,150 cubic meters. The distribution area and storage area of Qilian Mountain accounted for 94.6% of the Helan Mountain area and a storage capacity of only 5.4% [10]; therefore, the distribution center of Qinghai spruce is Gansu, Qinghai, the two provinces that border Qilian Mountain (east–west span nearly 1000 km). In the Qilian Mountain forests, the main group of tree species is Qinghai spruce [11,12]. Qinghai spruce is a prominent tree species in the Qilian Mountain forest succession and a major component of the Qilian Mountain water conservation forest. It possesses excellent material properties, including cold resistance, drought resistance, pest and disease resistance, and resistance to barrenness. This makes it an excellent choice for afforestation in urban and rural areas of the northwest region of China [13,14,15]. Qinghai spruce from different provenances have varying requirements for their environment due to their long-term adaptation to different environmental conditions. This resulted in the formation of different types of Qinghai spruce geographic provenances [16,17,18]. The distribution area of Qinghai spruce in the Qilian Mountains spans a wide range of geographic differences [19]. After a long period of natural selection, there was a wealth of genetic variation between the provenances [20,21,22]. It was unclear whether there was significant variation in the needle-leaf and tracheid traits of different provenances of Qinghai spruce, as no relevant research reports have been found.
In 1984, a provenance experiment for Qinghai spruce was conducted in China. The experiment selected 11 representative forest areas from east to west in the Qilian Mountains to collect germplasm resources for Qinghai spruce. As a result, experimental forests for Qinghai spruce provenances were established. Research on the genetic determination and improvement of Qinghai spruce has been conducted over the past 40 years [23,24]. However, no studies have been conducted on the differences in needle-leaf and tracheid traits of Qinghai spruce.
The study focused on the 40-year-old Qinghai spruce seed source test forest and investigated different provenances of Qinghai spruce forest stands. Standard wood was selected for sampling, and eight needle-leaf and fourteen tracheid trait indexes were measured for each provenance. Multiple comparisons were used to analyze the data. Clustering analysis and principal component analysis were used to analyze the differences in needle-leaf and tracheid traits among different provenances of Qinghai spruce. The aim was to comprehensively evaluate and reveal the extent of the long-term influence of geographic provenances on the needle-leaf and tracheid traits of Qinghai spruce. This study provides a scientific basis for the selection of geographic seed sources for conifer silvicultural breeding and has guiding significance for the selection and breeding of new varieties of Qinghai spruce and the directed cultivation of plantation forests [25,26,27].

2. Materials and Methods

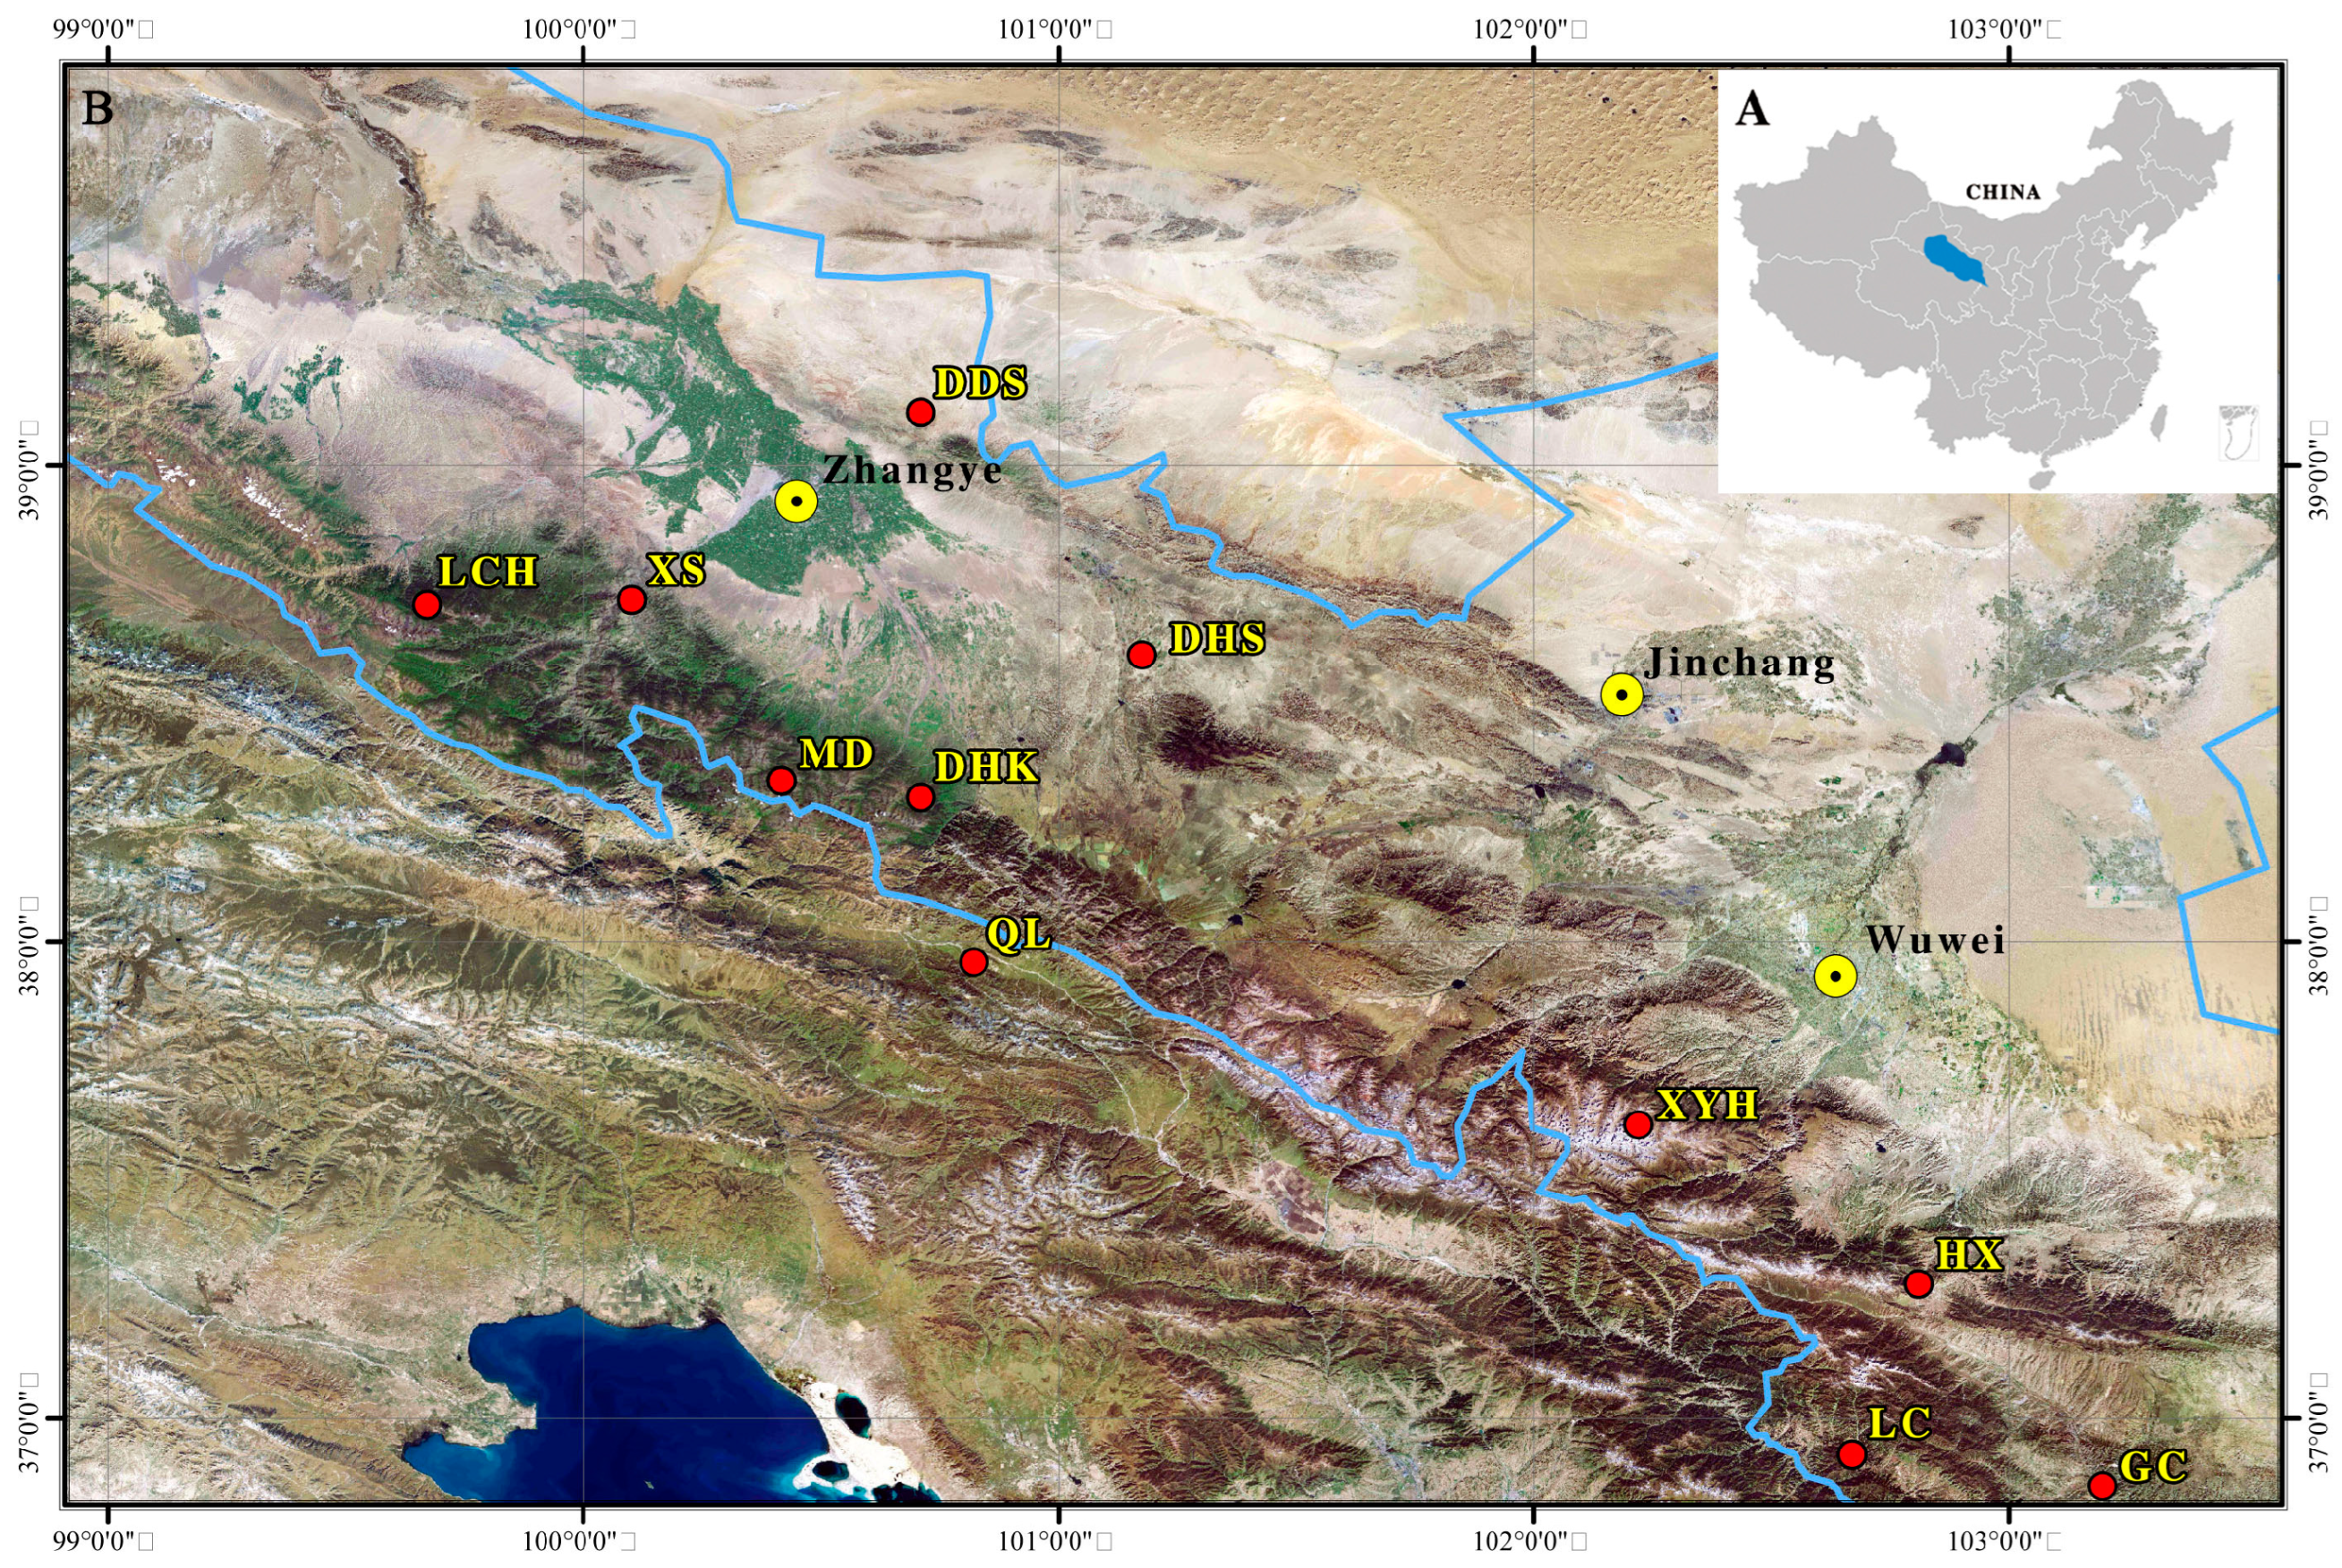
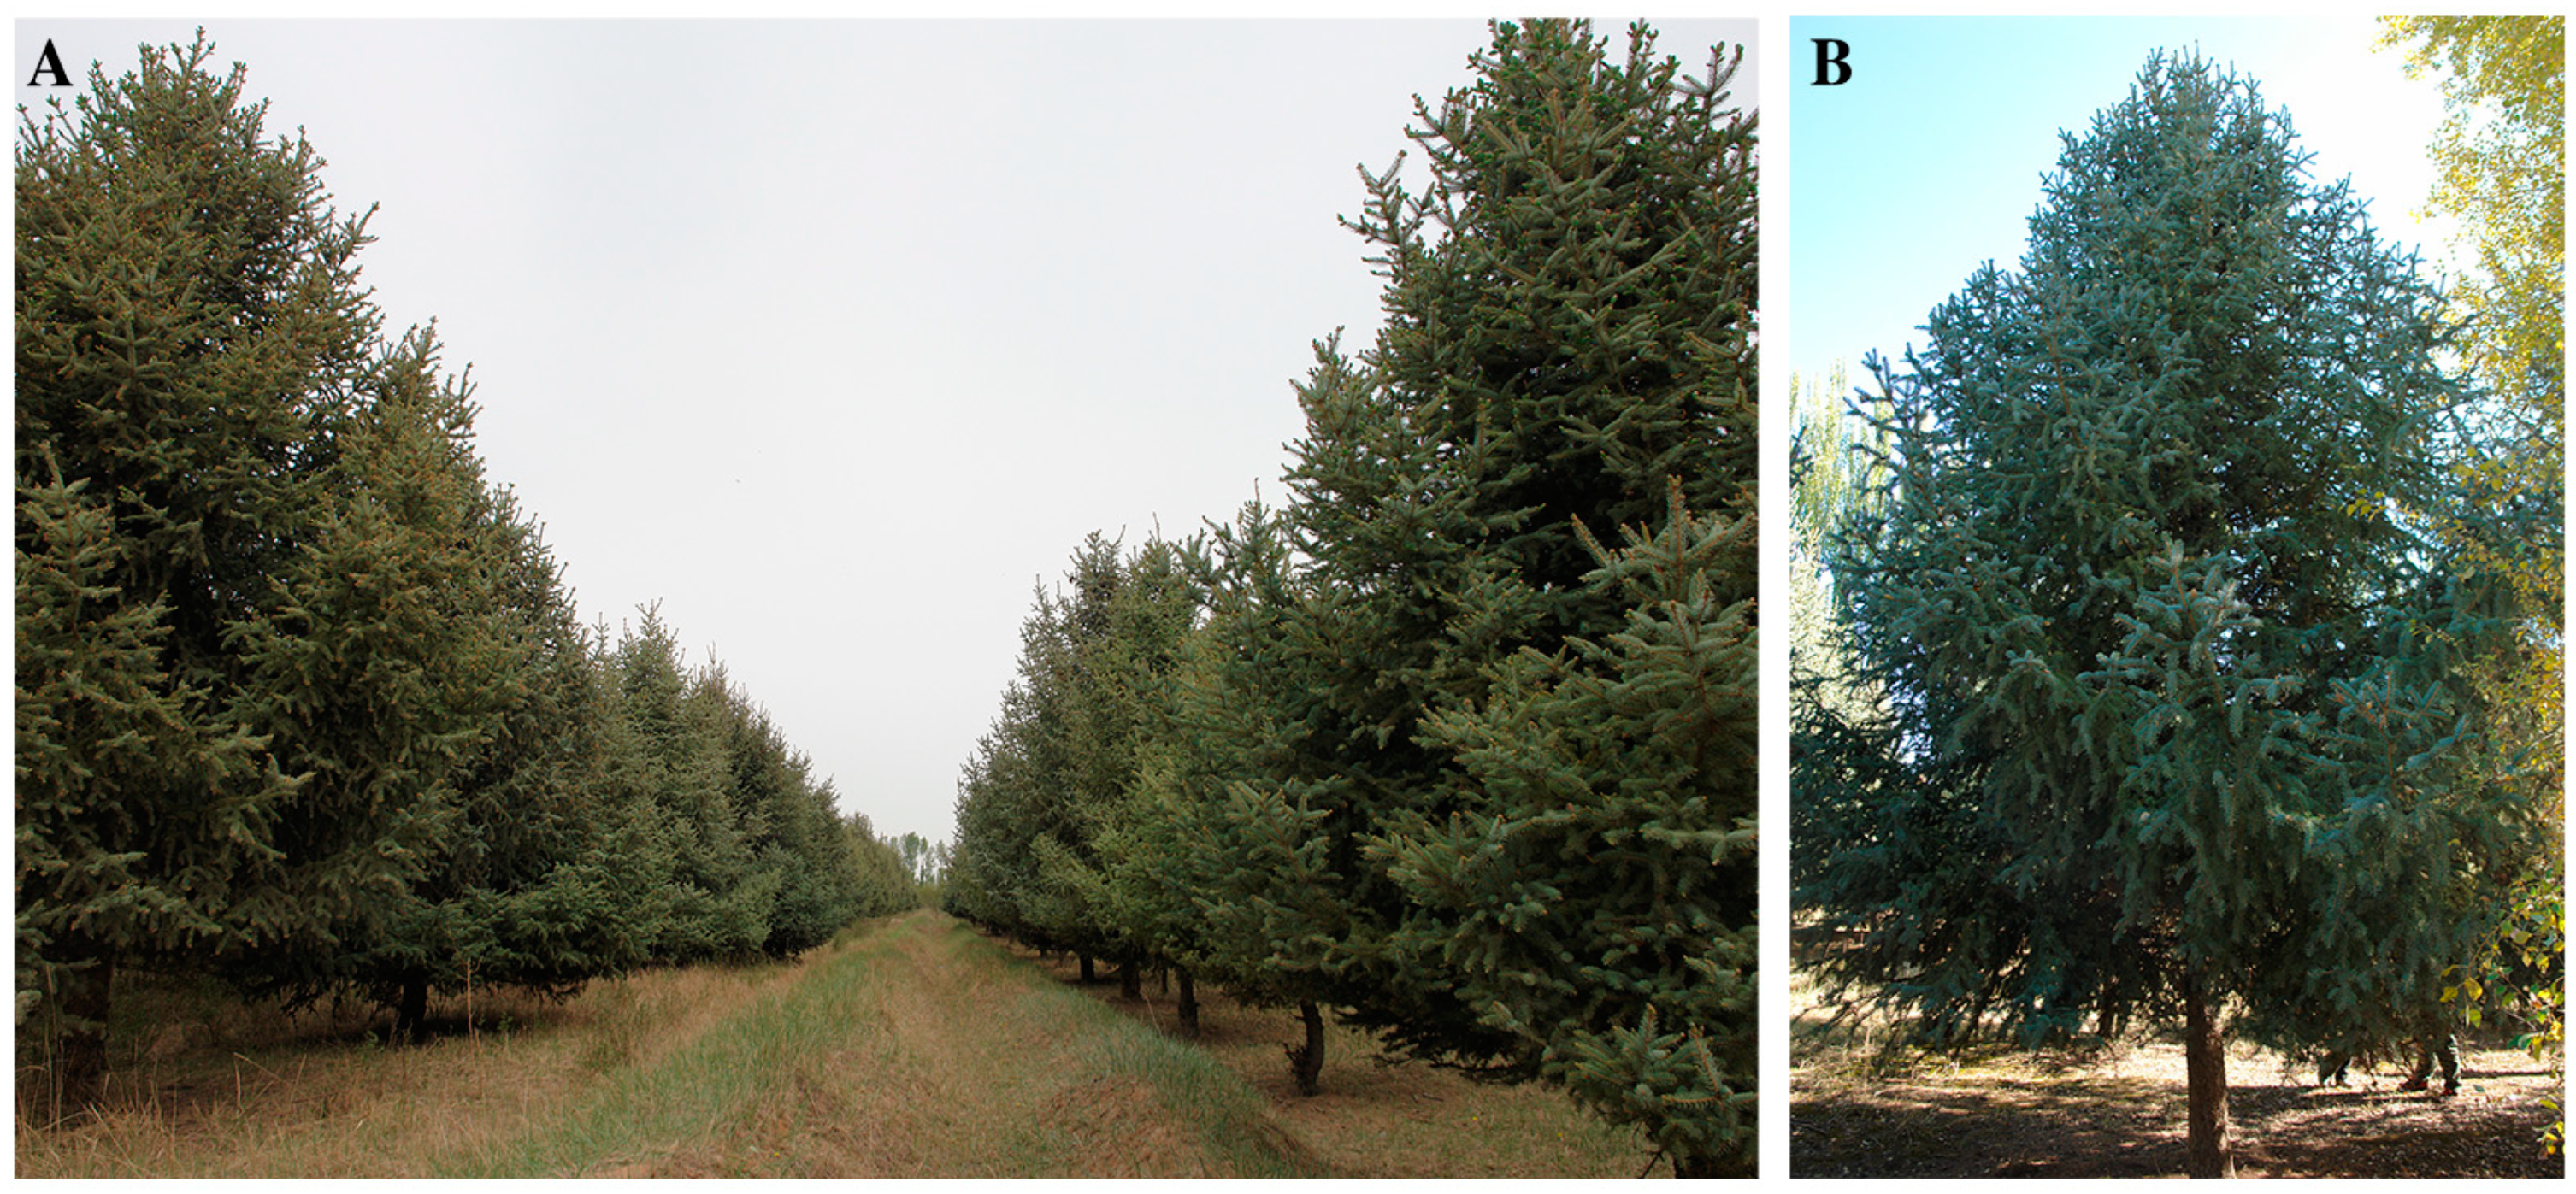
2.1. Study Area and Sampling

The experimental materials were supplied from the National Qinghai Spruce Forest Seedling Base in Longqu, Zhangye City, Gansu Province, China. The base is situated at the foot of the Qilian Mountains on the eastern side of the Black River, outside the mountain pass on the impact fan. Its geographical coordinates are N 38°48′41″, E 100°13′42″, at an altitude of 1700 m. The average annual temperature was 7.4 °C. The highest temperature recorded was 33.4 °C, while the lowest temperature was −26.5 °C. The annual precipitation was 193.0 mm, while the annual evaporation was 1653.0 mm. The relative humidity was 51%, and the frost-free period was 152 d. The number of hours of sunshine was 2435.6 h. The garden of superior trees was established using materials from 11 provenances in the mountainous areas of the Qilian Mountains. A total of 260 excellent asexual lines of the Qinghai spruce were collected from various locations, such as Xiyinghe (XYH), Xishui (XS), Liancheng (LC), Haxi (HX), Gucheng (GC), Dongdashan (DDS), Daihuangshan (DHS), Dahekou (DHK), Sidalong (SDL), Longchanghe (LCH), and Mati (MT) (Figure 1). It was grafted onto existing Qinghai spruce rootstocks at the base through the pith layer affixing method (Figure 2). It was then planted in a completely randomized field design, with each asexual line consisting of nine plants and repeated three times. For this study, 10 provenances of Qinghai spruce were used as research subjects. From each provenance, 5 standard trees were selected to determine their needle-leaf and tracheid traits (Table 1).

2.2. Laboratory Analysis

Thirty 1-year-old healthy needle-leaves were randomly selected from the middle of the tree canopy. The needle-leaf fresh weight (NFW) was weighed using an analytical balance, and the needle-leaf length (NL), width (NW), and thickness (NT) were measured with a vernier caliper. After measuring, the needle-leaves were placed in a paper bag and subjected to 100~105 °C for 10 min to eliminate the green color. They were then dried in an oven at 85 °C until a constant weight was achieved. The dry weight of the needle-leaves (NDW) was measured using an analytical balance after cooling to room temperature in a desiccator [28]. The length/width ratio of the needle-leaf (NLWR), width/thickness ratio of the needle-leaf (NWTR), and needle-leaf moisture content (NMC) were calculated.
Wood cores were extracted from the north-facing side of the trees and dissociated using the Franklin dissociation method [29]. The tracheids were dissociated and observed under a light microscope. Measurements were taken using Motic 2.0 software. Fifteen to twenty tracheids were randomly measured for each sample of early and late material. Tracheid length was measured under a 10× objective, while tracheid diameter and internal diameter index were measured under a 40× objective [30]. The double-wall thickness of tracheids, tracheid lumen-to-diameter ratio, tracheid wall-to-lumen ratio, and tracheid length-to-width ratio were then calculated [31] (see Table 2 for specific needle-leaf and tracheid traits and abbreviations).

2.3. Data Processing

Data organization was performed using Excel 2003, while statistical analysis was conducted using SPSS 27 software [32,33]. This included one-way ANOVA, multiple comparisons, correlation analysis, cluster analysis, principal component analysis, and composite score calculation [34,35,36]. Graphs were created using Origin 2021.

3. Results

3.1. Multiple Comparisons of Tracheid and Needle-Leaf Traits

Multiple comparisons were conducted on the morphological indicators of tracheids from ten provenances of Qinghai spruce. The results showed differences in the morphological indicators of tracheids among different provenances of Qinghai spruce, except for the double-wall thickness of the latewood and the length-to-width ratio of the latewood, which were all highly significant (Table 3 and Table 4). The earlywood and latewood tubule lengths of the Haxi provenance (3674.02 ± 60.06 μm and 3728.44 ± 77.22 μm, respectively) were significantly larger than those of the other provenances. Conversely, the earlywood and latewood tubule lengths of the Longchanghe provenance (2906.80 ± 85.47 μm and 3161.01 ± 93.30 μm, respectively) were significantly lower than those of the other provenances. The tracheid widths of the earlywood and latewood were smallest for the Dahekou provenance, while the earlywood tracheid width was largest for the Qilian provenance. The latewood tracheid width was largest for the Haxi provenance. Additionally, the lumen diameter of the earlywood tracheids of the Qilian forest provenance was significantly larger than that of the other provenance, and the lumen diameter of the Dahekou provenance was the smallest. However, the difference in the latewood tracheid lumen diameter among the provenances was not significant. The double-wall thickness of earlywood tracheids from the Haxi provenance was significantly greater than that of the other provenances. In contrast, the double-wall thickness of earlywood tracheids from the Longchanghe provenance was the smallest. The differences in the double-wall thickness of latewood tracheids among the provenances were not significant. Based on the International Association of Wood Anatomists (IAWA) classification, tracheids with a length of less than 3000 μm were considered short, those between 3000 μm and 5000 μm were medium, and those exceeding 5000 am were long. As a result, only the earlywood tracheids from the Longchanghe and Dahekou provenances were classified as short, while the earlywood and latewood tracheids from the other provenances were classified as medium.
The morphological indicators of Qinghai spruce needle-leaves from ten provenances were compared multiple times, revealing highly significant differences between the indicators of needle-leaves from different provenances (Table 5). The study found that needles from the Gucheng provenance had greater length, thickness, fresh weight, dry weight, aspect ratio, and water content compared to other provenances. Additionally, Xishui had the widest needle-leaves, while Dahekou had the largest aspect ratio. These results suggested that geographic provenance was the primary factor influencing the variation in needle-leaf morphology of Qinghai spruce.

3.2. Analysis of Variation in Tracheid and Needle-Leaf Traits

The analysis focused on the variation in needle-leaf and tracheid traits of different provenances of Qinghai spruce (Table 6). The results indicated that the coefficients of variation for the 22 phenotypic traits ranged from 4.18% to 35.28%, with an average coefficient of variation of 18.26%. The largest coefficient of variation was observed for the tracheid wall/lumen ratio of latewood (35.28%), while the smallest coefficient of variation was observed for the tracheid lumen/diameter ratio of earlywood (4.18%). The coefficients of variation for the traits ranged from 4.18% to 35.28%, with an average coefficient of variation of 18.86%. For the needle-leaf property, the coefficients of variation ranged from 7.39% to 26.74%, with an average of 17.20%. The trait of tracheids had a relatively large mean coefficient of variation, indicating that it was more affected by the environment. The coefficients of variation for most of the phenotypic traits were above 10%. The average coefficients of variation for the ten provenances ranged from 14.01% to 19.37%. The Liancheng provenance had the highest average phenotypic trait variation at 19.37%, followed by Longchanghe at 18.53%, while Daihuangshan had the lowest at 14.01%. These results indicated a significant phenotypic variation among Qinghai spruce provenances.

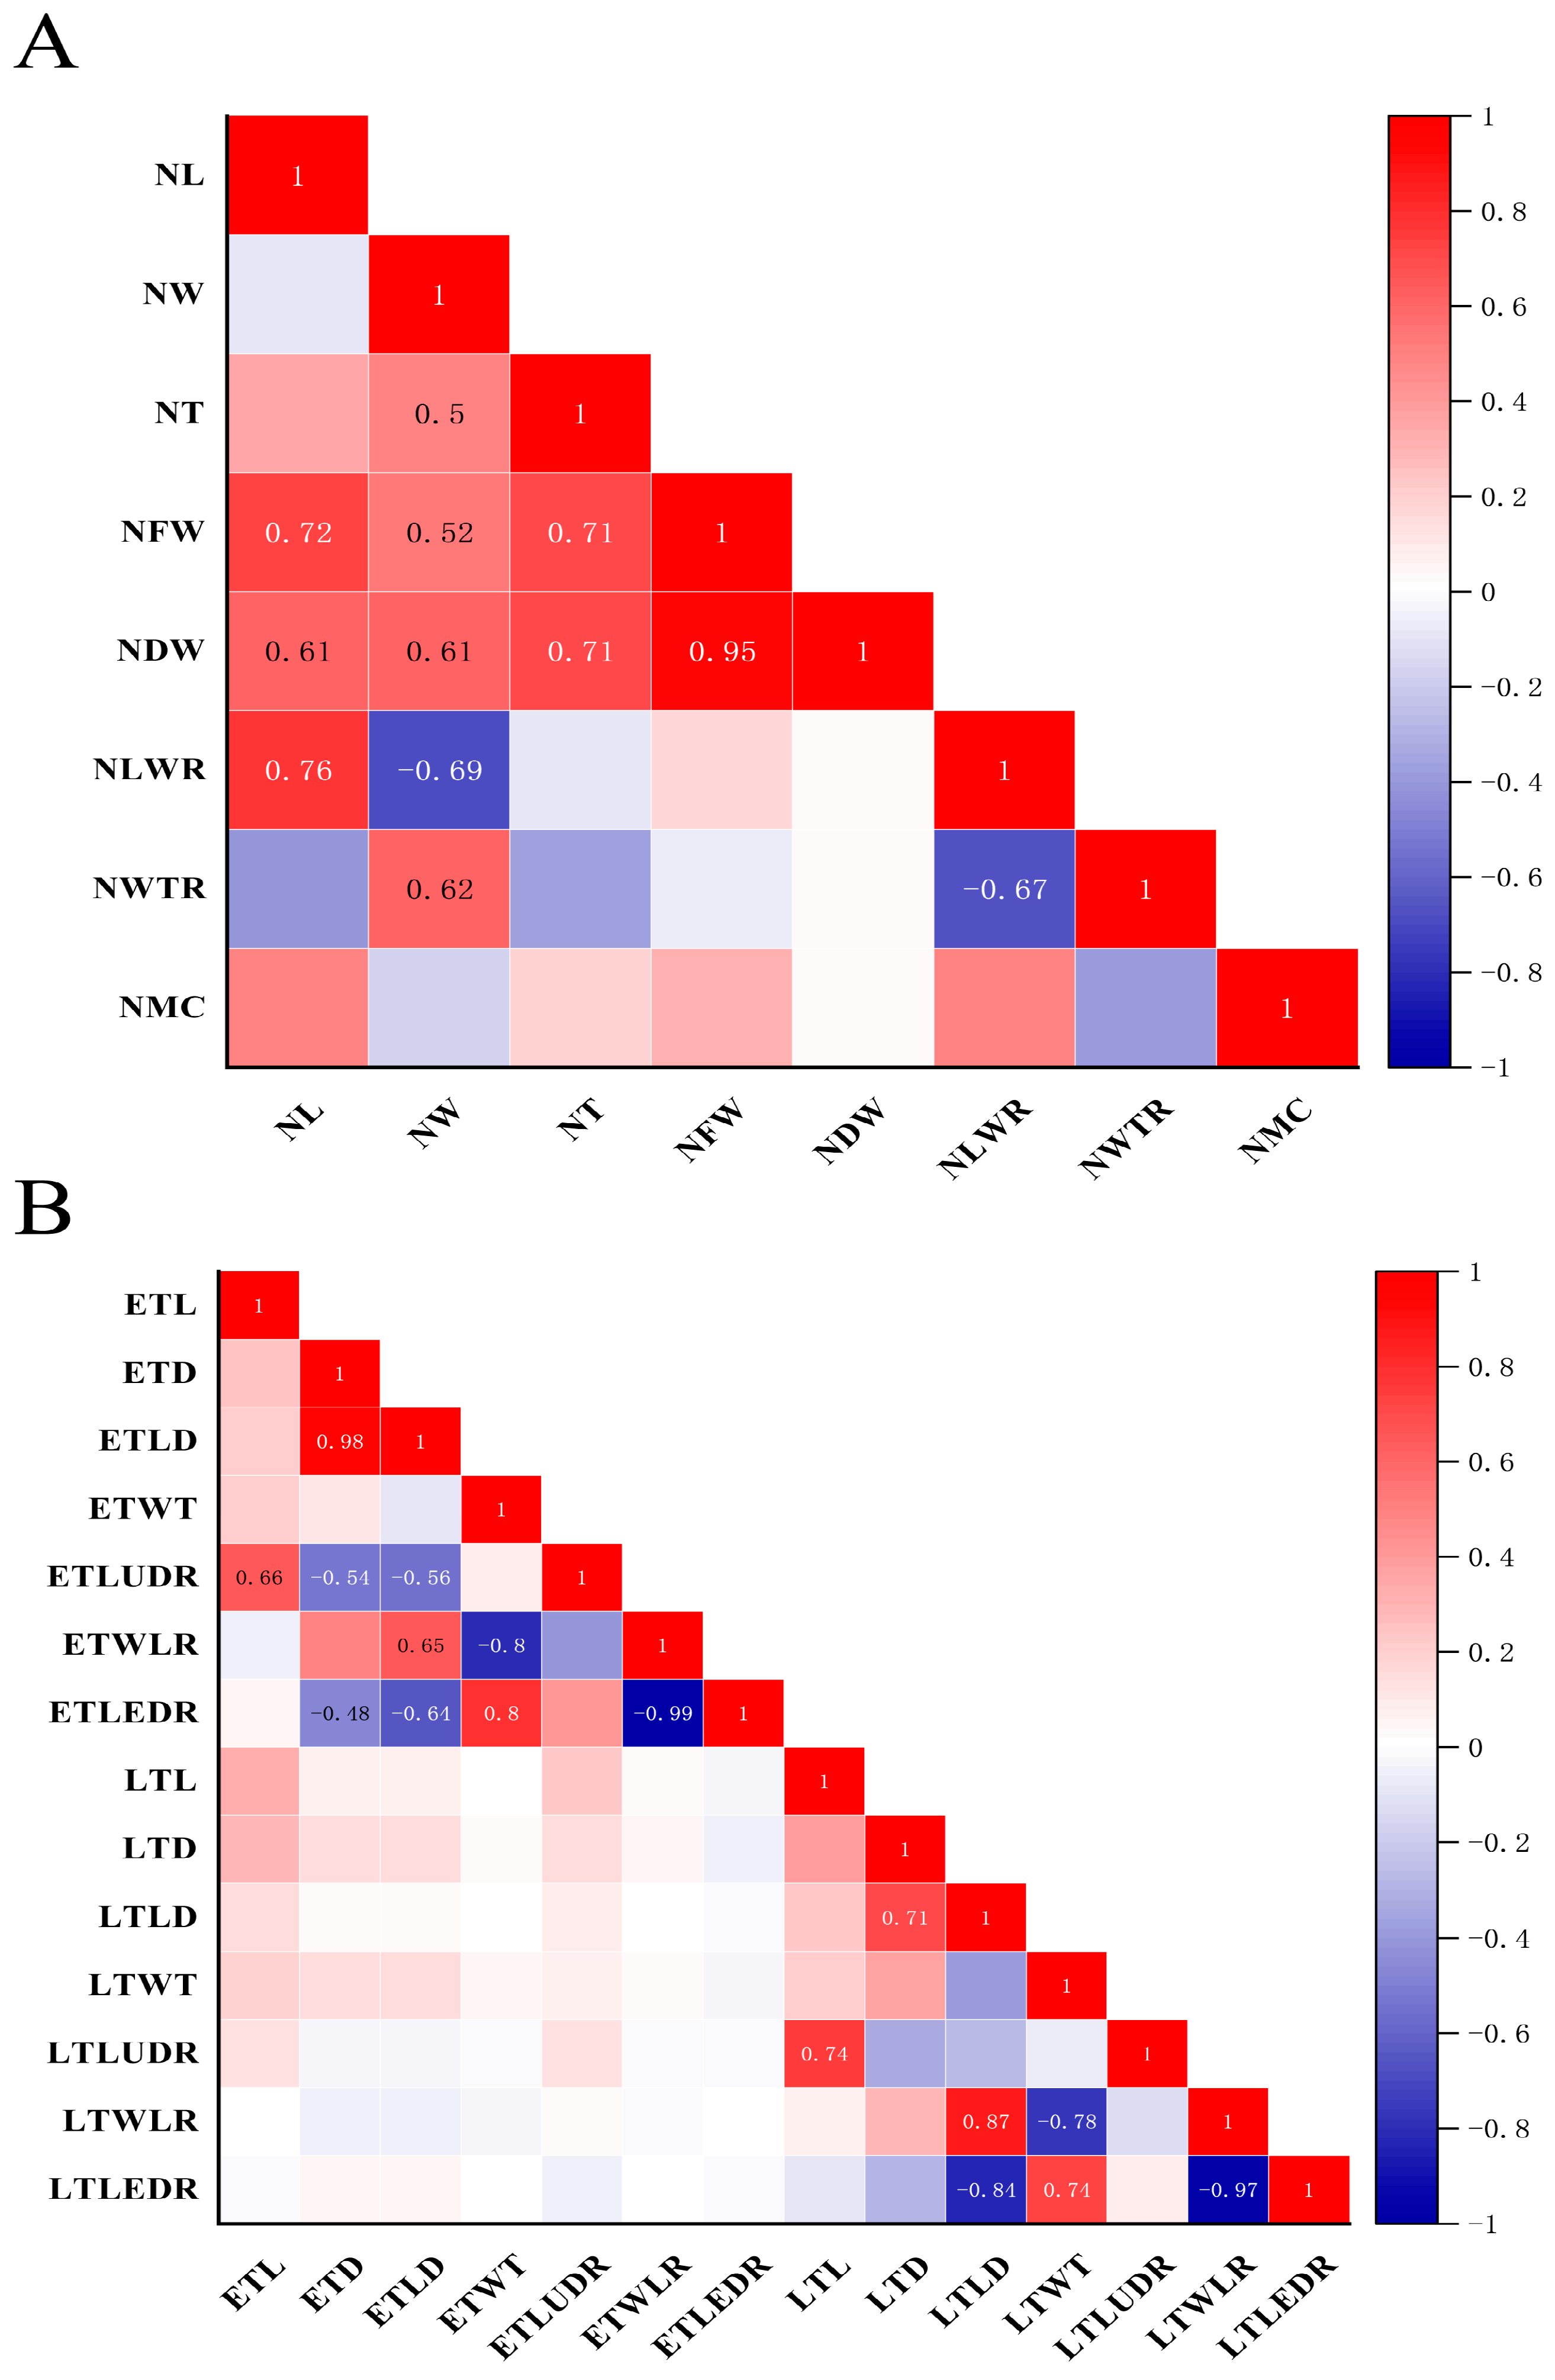
3.3. Correlation Analysis of Tracheid and Needle-Leaf Traits

The correlation analysis of eight needle-leaf traits (Figure 3A) revealed that 25 pairs were significantly correlated. Of these, 16 pairs showed positive correlation, while 9 pairs showed negative correlation. Most needle-leaf traits displayed significant and highly significant correlation levels, with correlation coefficients ranging from −0.69 to 0.95. A significant correlation was found between needle-leaf length and needle-leaf thickness, fresh weight, dry weight, aspect ratio, and water content. Similarly, needle-leaf width showed a significant correlation with needle-leaf thickness, fresh weight, dry weight, and aspect ratio. Needle-leaf thickness was also found to have a significant correlation with needle-leaf fresh weight, dry weight, and water content. Additionally, needle-leaf fresh weight showed a significant correlation with dry weight, aspect ratio, and water content. A highly significant positive correlation was found between needle-leaf thickness and fresh weight, dry weight, and moisture content of needle-leaves. Additionally, a positive correlation was observed between the aspect ratio of needle-leaves and moisture content of needles. There was a negative correlation at a highly significant level between the length and width of the needle-leaf, as well as the width-to-thickness ratio. Additionally, there was a negative correlation between the width of the needle-leaf and both the aspect ratio and water content. Similarly, there was a negative correlation between the thickness of the needle-leaf and the aspect ratio. Finally, there was a negative correlation between the aspect ratio of the needle-leaf and both the width-to-thickness ratio and water content.
Correlation analysis of the 14 tracheid traits (Figure 3B) revealed that 51 pairs were significantly correlated. Of these, 34 pairs showed positive correlation and 17 pairs showed negative correlation. Most of the 14 tracheid traits exhibited significant or highly significant correlation levels, with correlation coefficients ranging from −0.99 to 0.98. The study found significant or highly significant positive correlations between various tubule measurements. Specifically, there were correlations between tubule length and tubule width, lumen diameter, double-wall thickness, and length-to-width ratio. Additionally, there were correlations between tubule width and tubule lumen diameter, double-wall thickness, and lumen/diameter ratio, as well as between tubule double-wall thickness and tubule lumen/diameter ratio. The correlations between tubule lumen diameter and tubule wall/lumen ratio, as well as between tubule lumen/diameter ratio and tubule double-wall thickness and tubule lumen/diameter ratio, were highly significant and negatively correlated with tubule lumen diameter, tube lumen thickness, and tube wall/lumen ratio. There was a significant or highly significant positive correlation between the length of earlywood tracheids and the length of latewood tracheids for the seven traits corresponding to early- and latewood. Additionally, there was a highly significant positive correlation between the length, diameter, and inner diameter of earlywood tracheids and the three traits corresponding to latewood. Furthermore, a highly significant positive correlation was found between the lengths and length-to-width ratios of earlywood and latewood tracheids.

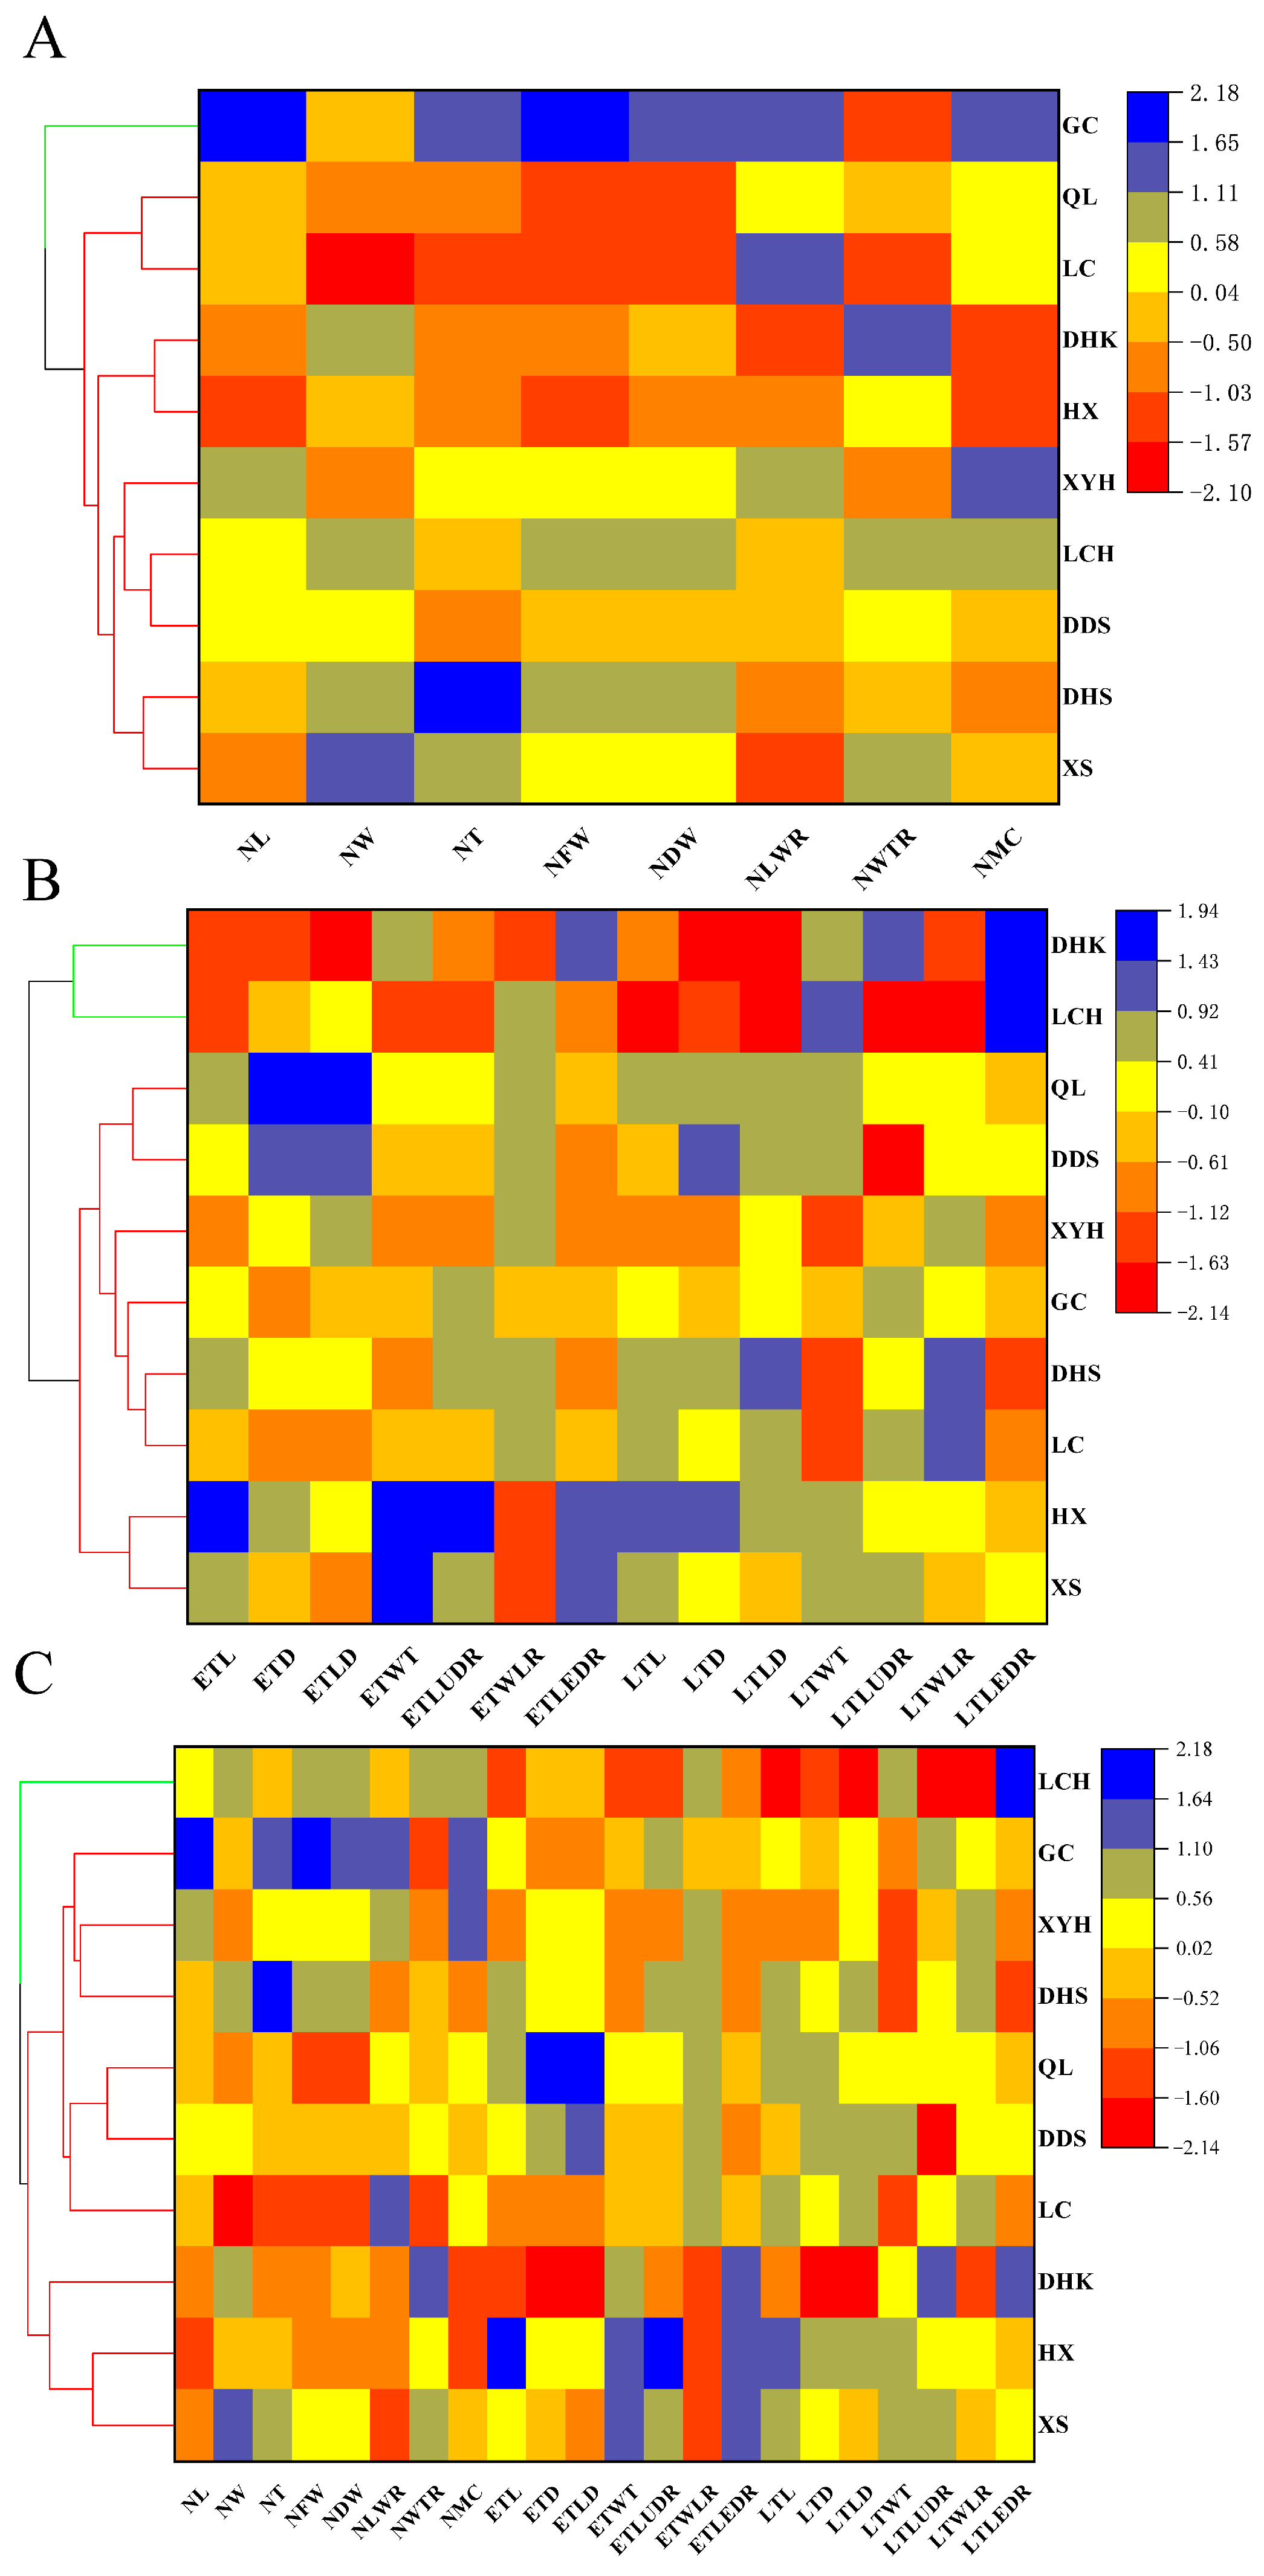
3.4. Cluster Analysis of Tracheid and Needle-Leaf Traits

Cluster analysis was performed on eight needle-leaf morphological indicators of ten provenances of Qinghai spruce (Figure 4A). The provenances were divided into two categories. Gucheng provenance was classified into one category and all the others were classified into the second category. Using cluster analysis of 14 morphology indicators of the tubule (Figure 4B), the ten provenances were divided into two categories. The first category included Daihuangshan, Qilian, Xishui, Gucheng, Dongdashan, Liancheng, Haxi, and Xiyinghe provenances. The second category included Dahekou and Longchanghe provenances. Liancheng, Haxi, and Xiyinghe provenances were classified together, while Dahekou and Longchanghe provenances were also classified together. The cluster analysis of eight needle-leaves morphology indexes and fourteen morphology indexes of tracheids is shown in Figure 4C. The indexes were classified into two categories. Longchanghe provenance was classified into one category, while the remaining nine provenances were classified into one category as well.

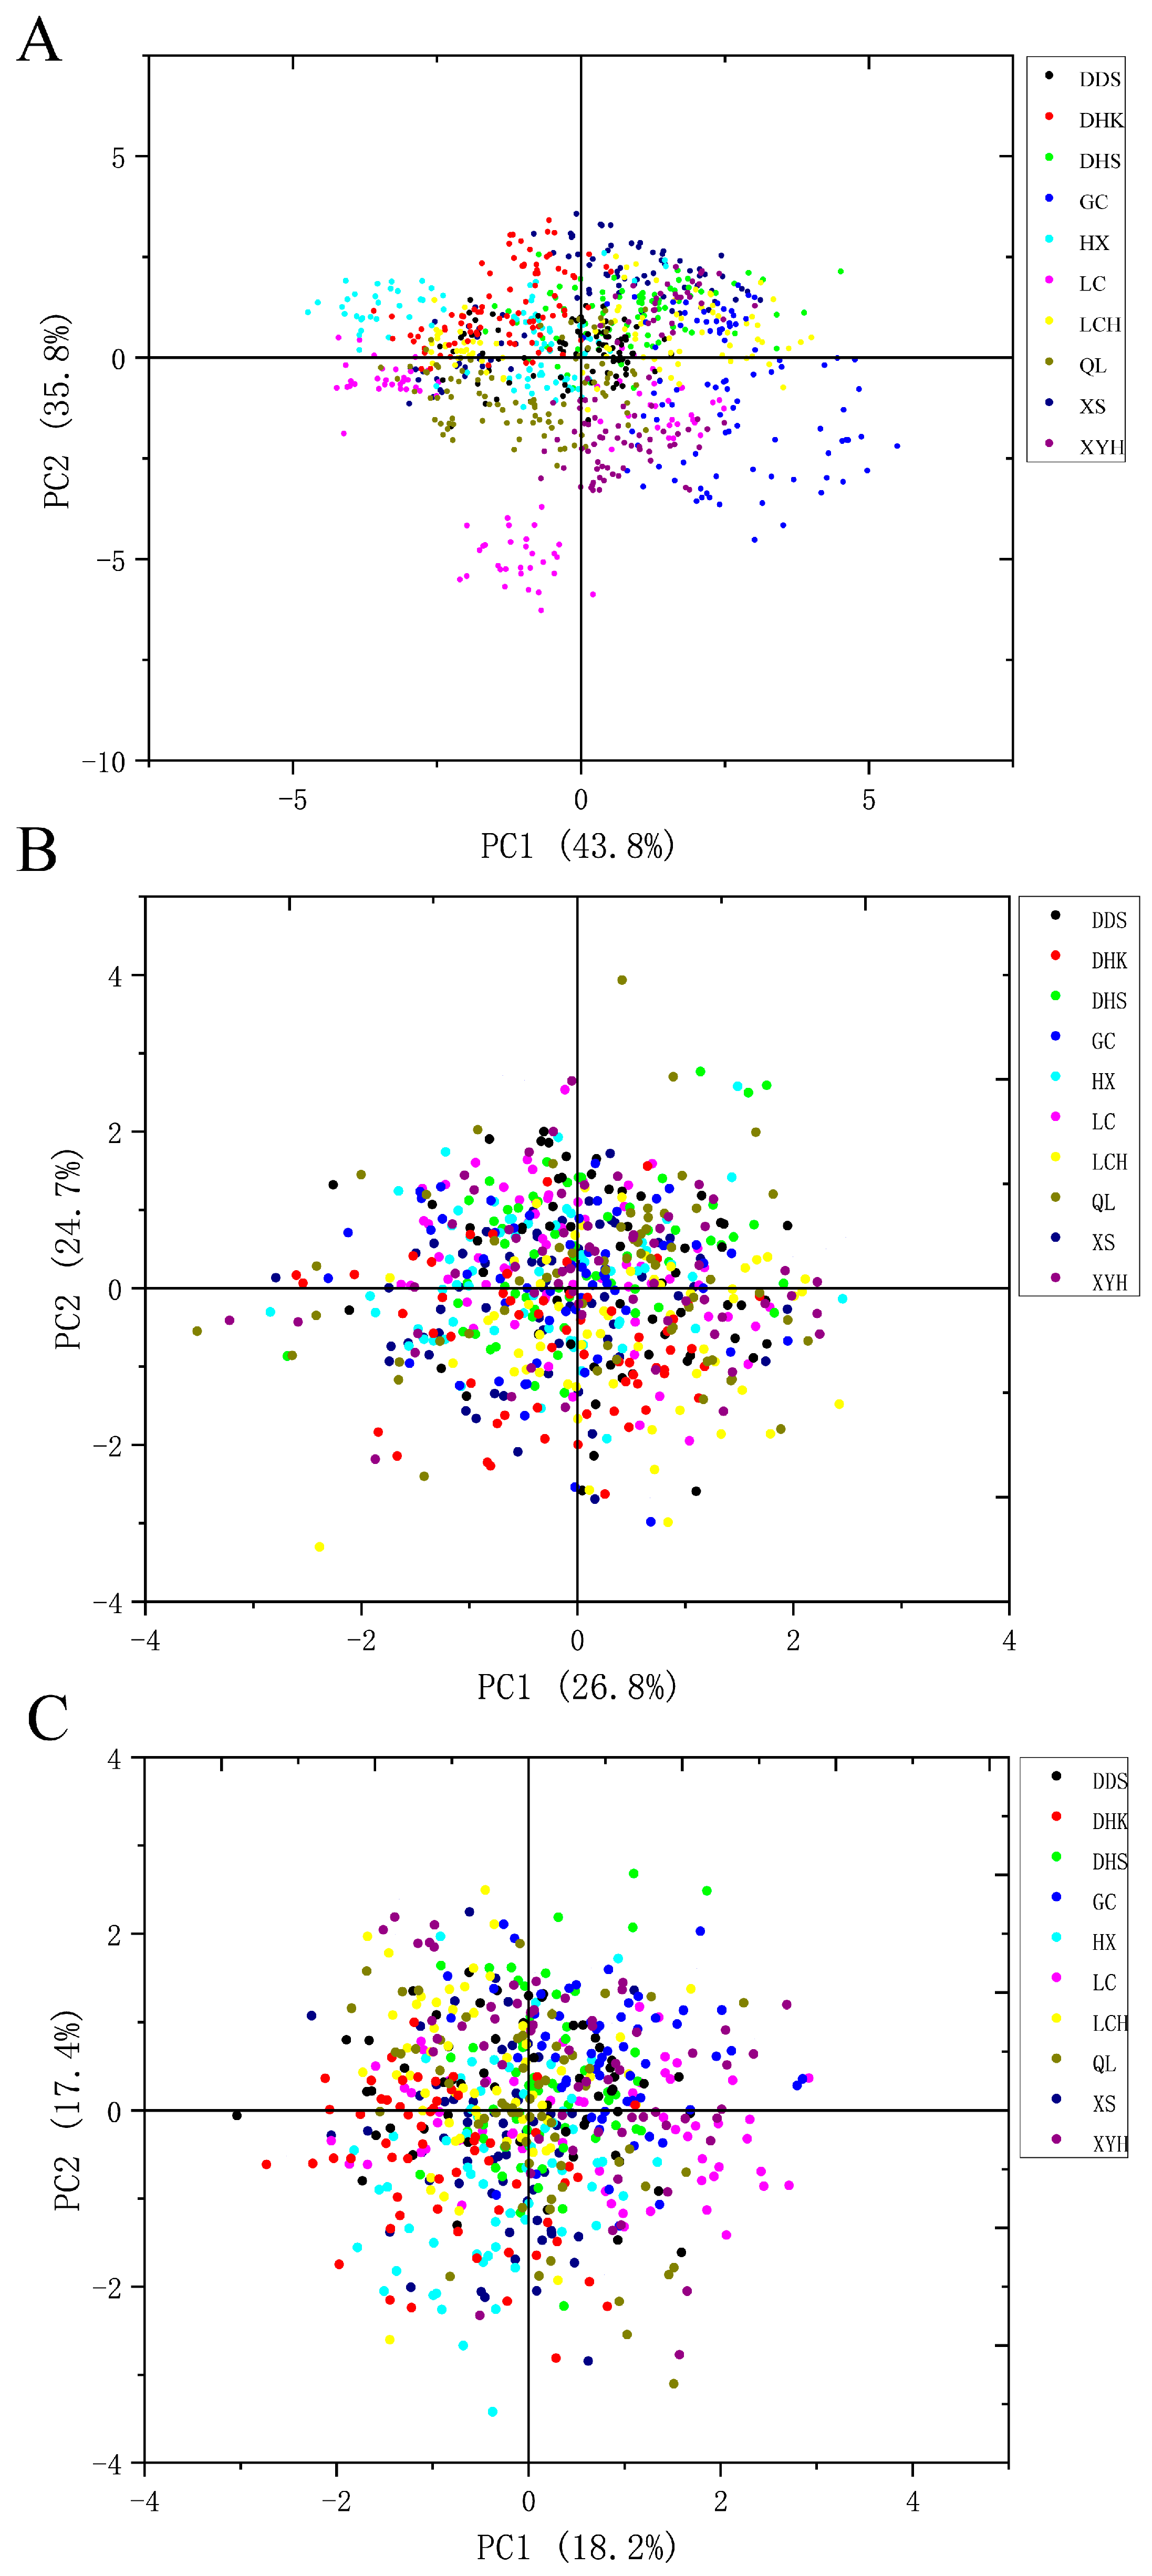
3.5. Principal Component Analysis and Comprehensive Evaluation of Tracheid and Needle-Leaf Traits

Principal component analysis was performed on eight morphology indexes of Qinghai spruce needle-leaves, resulting in two principal components (Figure 5A). PC1 had a cumulative contribution value of 43.8%, while PC2 had a cumulative contribution value of 35.8%. A comprehensive evaluation formula was derived as follows: Y = 0.43764 × x1 + 0.35835 × x2. The factor scores of the two principal components, the comprehensive evaluation scores, and the rankings were calculated and are presented (Table 7). The evaluation rankings for the different provenances were as follows: Gucheng ranked the highest, followed by Dahuangshan, Xishui, Longchanghe, Xiyinghe, Dongdashan, Dahekou, Haxi, Qilian, and Liancheng. Overall, the needle-leaf traits of Qinghai spruce from Gucheng and Daihuangshan provenances were superior.
The analysis of 14 Qinghai spruce tracheid morphology indexes resulted in six principal components (Figure 5B). PC1 and PC2 had cumulative contribution values of 26.8% and 24.7%, respectively. A comprehensive evaluation was then performed using the formula: Y = 0.26848 × x1 + 0.24762 × x2 + 0.16930 × x3 + 0.12741 × x4 + 0.10675 × x5 + 0.07242 × x6. The six principal component factor scores, comprehensive evaluation scores, and rankings are presented below (Table 8). According to the comprehensive evaluation results, the ranking of the characteristics of Qinghai spruce tracheids from different provenances was as follows: Liancheng, Dongdashan, Longchanghe, Daihuangshan, Xiyinghe, Haxi, Xishui, Gucheng, Liancheng, and Dahekou provenances. Generally, the provenances of Liancheng and Dongdashan performed better in terms of spruce tracheid traits.
Principal component analysis (PCA) was conducted on fourteen tracheid traits and eight needle-leaf traits (Figure 5C), resulting in eight principal components. The cumulative contribution values for PC1, PC2, and PC3 were 18.2%, 17.4%, and 15.4%, respectively. A comprehensive evaluation was then performed using the following formula: Y = 0.18215 × x1 + 0.17436 × x2 + 0.15387 × x3 + 0.132 × x4 + 0.9898 × x5 + 0.7479 × x6 + 0.6734 × x7 + 0.4614 × x8. The eight principal component factor scores, overall evaluation scores, and rankings are calculated below (Table 9). The comprehensive evaluation rankings were, in order, as follows: Gucheng, Xiyinghe, Liancheng, Qilian, Dongdashan, Haxi, Daihuangshan, Xishui, Longchanghe, and Dahekou. Comprehensive data analysis of needle-leaf traits and tracheid traits showed that Gucheng and Xiyinghe provenances ranked high and could be used as a basis for good provenance selection.

4. Discussion

The phenotypic diversity of plants is the result of the long-term joint action of genetic adaptation and environmental heterogeneity. The study of phenotypic variation richness and variation pattern of natural populations in different geographic environments can reflect the level of genetic variation to a certain extent and also reveal their adaptive capacity to different environments [37]. The study of different provenances of Qinghai spruce needle-leaf traits can provide a scientific basis for the selection of geographic provenances for conifer afforestation and breeding. The variation in needle-leaf traits among the ten provenances of Qinghai spruce was considerable, with coefficients of variation ranging from 7.39% to 26.74%. With the exception of the coefficient of variation for needle-leaf water content, which was 7.39%, the coefficients of variation for the remaining phenotypes of the needle-leaf traits were all greater than 10%, with an average coefficient of variation of 17.20%. The coefficient of variation for needle-leaf water content was 7.39%, while the coefficients of variation for the remaining phenotypes of needle-leaf traits were all greater than 10%, with an average coefficient of variation of 17.20%. In a separate study, multiple comparisons of needles from ten different provenances of Qinghai spruce revealed that there were highly significant differences in needle-leaf traits among provenances of Qinghai spruce, which was consistent with the findings of Luo Jianxun et al. The aforementioned studies concluded that there were significant differences in needle phenotypic traits of rough spruce between and within populations [38,39,40], as well as the results of studies on needle phenotypic variability of red-barked spruce and the phenotypic variability of the natural populations of Qinghai spruce in the Qilian Mountains [10]. The needle-leaf traits of Qinghai spruce exhibited significant differences among the provenances, indicating that the variation in needle-leaf traits of Qinghai spruce was considerable [41]. Furthermore, the correlation analysis results of eight needle-leaf traits of Qinghai spruce from ten provenances indicated that there were two significant correlations. A total of five pairs of significant correlations were identified, with sixteen pairs of positively correlated traits and nine pairs of negatively correlated traits. The majority of the needle-leaf traits exhibited significant and highly significant correlation levels with one another, with correlation coefficients ranging from −0.69 to 0.95. The considerable disparity in conifer traits observed among the ten provenances of Qinghai spruce, along with the notable and highly significant correlation between the majority of these traits, may be attributed to the fact that the ten provenances of Qinghai spruce in this study spanned a large geographic distribution area, and the environmental heterogeneity within the distribution area resulted in a high degree of variation among the provenances [42,43,44]. This variation is not solely a consequence of genetic diversity but is also influenced by the combined effects of long-term geographic isolation, restricted gene exchange, and changes in geographic and environmental factors [45,46]. The phenotypic differentiation of Qinghai spruce is an adaptive evolution resulting from long-term selection. Consequently, the different provenances of Qinghai spruce have retained a greater genetic and phenotypic diversity [47,48].
The study of the variation in the morphological indexes of the tracheid traits of Qinghai spruce from different provenances is of guiding significance for the selection and breeding of new species of Qinghai spruce and the directional cultivation of plantation forests. In this study, we selected ten provenances of Qinghai spruce that represented the full range of the species’ geographical distributions in the Qilian Mountains. The morphological indexes of the tracheids of the ten different provenances of Qinghai spruce differed. The coefficient of variation in the wall-to-cavity ratio of the latewood was the largest (35.28%), while that of the lumen-to-diameter ratio of the earlywood was the smallest (4.18%). In this study, the morphological indicators of the traits of Qinghai spruce tracheids from ten provenances were found to be highly significant, with the exception of the significant differences in the double-wall thickness of latewood and the length-to-width ratio of latewood. This result is also consistent with the findings of Li Qingfan et al.’s study on the genetic variation in wood traits in asexual lines of Qinghai spruce [26]. Correlation analysis of the 14 tracheid traits revealed a total of 51 significant correlations, of which 34 were positively correlated and 17 were negatively correlated. The majority of the 14 tracheid traits exhibited significant and highly significant correlation levels, with correlation coefficients ranging from −0.99 to 0.98. The correlation between needle-leaf traits and tracheid traits was not statistically significant, which is consistent with the results of Yali Chen’s study on the selection of excellent half-sibling family lines and genome-wide association analysis of important traits in Qinghai spruce [49]. The response of plant phenotypic traits is the result of the integrated response under the interaction of various environmental factors. At the same time, the variation in morphological indexes of needle-leaf and tracheid traits in conifers will also be affected by factors such as soil, CO2, light intensity, etc., and the effects of these environmental factors need to be further considered in future studies.
The ten provenances of Qinghai spruce can be classified into two types. Daihuangshan, Qilian, Xishui, Gucheng, Dongdashan, Liancheng, Haxi, Xiyinghe, and Dahakou provenances belonged to one type, while Longchanghe provenance belonged to another type. Barzdajn argued that phenotype resulted from the interaction between genotype and environment [50]. Phenotypic traits can be used to identify European spruce populations. Therefore, clustering and classifying the needle-leaf and tracheid traits of ten provenances of Qinghai spruce were both effective and feasible.
The analysis of the eight Qinghai spruce needle traits using principal component analysis resulted in a cumulative contribution of 43.8% for PC1 and 35.8% for PC2. Overall, the needle traits of the Gucheng and Dahuangshan provenances were superior. The results of the principal component analysis of the 14 Qinghai spruce tracheid traits showed that PC1 and PC2 contributed 26.8% and 24.7%, respectively. Overall, the tracheid traits of the Liancheng and Dongdashan provenances were superior. The provenances were ranked based on the analysis of fourteen tracheid traits and eight needle-leaf traits. The comprehensive evaluation resulted in the following order: Gucheng, Xiyinghe, Liancheng, Qilian, Dongdashan, Haxi, Daihuangshan, Xishui, Longchanghe, and Dahekou. The study results were comparable to those of the Chinese fir growth and lumber variability study, as well as the multi-trait index selection study [10] and evaluation of different geographic provenances of silver fir [51].

5. Conclusions

In conclusion, there was a considerable degree of interspecific variation in the needle-leaf and tracheid traits of Qinghai spruce from ten provenances, which indicates a high level of genetic and phenotypic diversity. Consequently, it is of paramount importance to collect as many populations as possible for the purpose of germplasm conservation. Furthermore, it is essential to ensure that the number of samples within each population increases. The Qinghai spruce needle-leaves and tracheid traits exhibit varying degrees of variation, which to some extent mediates the adaptation of transpiration and respiration to the environment in Qinghai spruce. This study provides a significant theoretical foundation for further analysis of the adaptive differentiation of needle-leaf and tracheid traits. Additionally, it serves as a reference for the selection of geographic seed sources for the introduction and breeding of conifers, as well as an important guide for the preservation of germplasm resources and the breeding of good seeds of coniferous species.

Author Contributions

Conceptualization, H.Z. and X.L.; methodology, E.X.; software, Z.Z.; validation, D.L.; formal analysis, Y.W.; investigation, H.Z. and X.M.; data curation, X.Z. and N.W.; writing—original draft preparation, H.Z.; writing—review and editing, H.Z. and X.L.; visualization, H.Y.; supervision, E.X.; project administration, X.W. All authors have read and agreed to the published version of the manuscript.

Funding

This research was supported by the ‘Young Scholars in the West’ program, a joint initiative of the Chinese Academy of Sciences (CAS) and the Gansu Provincial Department of Science and Technology (GDST) (23JR6KG035), the Provincial Talent (Youth Team) Program of Gansu Province (Gan Zu Tong Zi (2024)4), the Natural Science Foundation of Gansu Province (23JRRG0022 and 22JR5RG1030), and the Science and Technology Plan Program in Zhangye City, Gansu Province of China (ZY2023KY02 and ZY2022BJ1).

Data Availability Statement

The data presented in this study are available on request from the corresponding author.

Conflicts of Interest

The authors declare no conflicts of interest.

References

  1. Gao, F.; Wen, S.; Wei, S.; Ou, H.B.; Wang, Z.H. Variation Analysis of Seed and Leaf Phenotypic Traits of Albizia Odoratissima from Different Provenances. J. Cent. South Univ. For. Technol. 2023, 2, 1–10. [Google Scholar] [CrossRef]
  2. Varghese, M.; Harwood, C.E.; Bush, D.J.; Baltunis, B.; Kamalakannan, R.; Suraj, P.G.; Hegde, D.; Meder, R. Growth and wood properties of natural provenances, local seed sources and clones of Eucalyptus camaldulensis in southern India: Implications for breeding and deployment. New For. 2017, 48, 67–82. [Google Scholar] [CrossRef]
  3. Perek, M.; Hodge, G.; Tambarussi, E.V.; Biernaski, F.A.; Acosta, J. Predicted genetic gains for growth traits and wood resistance in Pinus maximinoi and Pinus tecunumanii. Crop Breed. Appl. Biotechnol. 2022, 22, e391022213. [Google Scholar] [CrossRef]
  4. Gao, J.; Yang, B.; Peng, X.; Rossi, S. Tracheid development under a drought event producing intra-annual density fluctuations in the semi-arid China. Agric. For. Meteorol. 2021, 308, 108572. [Google Scholar] [CrossRef]
  5. Chin, A.R.; Sillett, S.C. Phenotypic plasticity of leaves enhances water-stress tolerance and promotes hydraulic conductivity in a tall conifer. Am. J. Bot. 2016, 103, 796–807. [Google Scholar] [CrossRef] [PubMed]
  6. Xia, H.; Zhao, G.H.; Zhang, L.S.; Sun, X.Y.; Yin, S.P.; De, Y.L.; Li, Y.; Mi, Z.; Zhao, X. Genetic and variation analyses of growth traits of half-sib Larix olgensis families in northeastern China. Euphytica 2016, 212, 387–397. [Google Scholar] [CrossRef]
  7. Yang, Z.; Xia, H.; Tan, J.; Feng, Y.; Huang, Y. Selection of superior families of Pinus massoniana in southern China for large-diameter construction timber. J. For. Res. 2020, 31, 475–484. [Google Scholar] [CrossRef]
  8. Benavides, R.; Carvalho, B.; Bastias, C.C.; López-Quiroga, D.; Mas, A.; Cavers, S.; Gray, A.; Albet, A.; Alía, R.; Ambrosio, O.; et al. The GenTree Leaf Collection: Inter-and intraspecific leaf variation in seven forest tree species in Europe. Glob. Ecol. Biogeogr. 2021, 30, 590–597. [Google Scholar] [CrossRef]
  9. Zhao, R.; Chu, X.; He, Q.; Liu, W.; Zhu, Z. Leaf phenotypic variation in natural populations of Carpinus tschonoskii in China. J. For. Res. 2023, 34, 1591–1602. [Google Scholar] [CrossRef]
  10. Wang, Y.; Li, Y.; Chen, X.Y. Phenotypic diversity of natural populations in Picea crassifolia in Qilian mountains. Sci. Silvae Sin. 2008, 44, 70–77. [Google Scholar]
  11. Zhou, C.; Guo, Y.; Chen, Y.; Zhang, H.; El-Kassaby, Y.A.; Li, W. Genome Wide Association Study Identifies Candidate Genes Related to the Earlywood Tracheid Properties in Picea crassifolia Kom. Forests 2022, 13, 332. [Google Scholar] [CrossRef]
  12. Qin, H.; Jiao, L.; Zhou, Y.; Wu, J.; Che, X. Elevation affects the ecological stoichiometry of Qinghai spruce in the Qilian Mountains of northwest China. Front. Plant Sci. 2022, 13, 917755. [Google Scholar] [CrossRef] [PubMed]
  13. Fan, B.; Yang, B.; Li, G. Assessing the influence of local environment, regional climate and tree species on radial growth in the Hexi area of arid northwest China. Front. Plant Sci. 2022, 13, 1046462. [Google Scholar] [CrossRef] [PubMed]
  14. Liu, J.; Wang, J.; Han, Y.; Yuan, S.; Gao, Y.; Rong, Z.; Zhao, C. Simulating the canopy photosynthesis of Qinghai spruce (Picea crassifolia Kom.) in the Qilian Mountains, Northwestern China. New For. 2022, 53, 511–531. [Google Scholar] [CrossRef]
  15. Pang, Y.; Zhang, B.P.; Zhao, F.; Yao, Y.H.; Zhang, S.; Qi, W.W. Omni-directional distribution patterns of montane coniferous forest in the Helan Mountains of China. J. Mt. Sci. 2013, 10, 724–733. [Google Scholar] [CrossRef]
  16. Bakeer, S.M.; Makpoul, K.R.; Abou-Ellail, M. Evaluation of ten jojoba clones (Simmondsia chinensis) grown under Middle Sinai conditions. Ind. Crops Prod. 2017, 107, 30–37. [Google Scholar] [CrossRef]
  17. Ji, M.; Deng, J.; Yao, B.; Chen, R.; Fan, Z.; Guan, J.; Li, X.; Wu, F.; Niklas, K.J. Ecogeographical variation of 12 morphological traits within Pinus tabulaeformis: The effects of environmental factors and demographic histories. J. Plant Ecol. 2017, 10, 386–396. [Google Scholar] [CrossRef]
  18. Cardoso, G.C.; Cortesao, M.; Garcia, C. Ecological marginalization facilitated diversification in conifers. Evol. Biol. 2015, 42, 146–155. [Google Scholar] [CrossRef]
  19. Weng, Y.H.; Liu, K.J.; Chen, Y.B.; Li, Y.; Wang, J.; Meng, Q.F. Variation in cone and seed traits in a clonal seed orchard of red pine (Pinus koraiensis Sieb. et Zucc.). Scand. J. For. Res. 2020, 35, 1–9. [Google Scholar] [CrossRef]
  20. Deng, J.; Zhang, H.; Zhang, L.; Guan, C. Genetic variation of 17-year-old hybrid larch and its superior family selection. J. Northeast For. Univ. 2010, 38, 8–11. [Google Scholar] [CrossRef]
  21. Dong, X.S.; Chen, X.X.; Gai, Z.S.; Zhai, J.T.; Guo, X.F.; Han, X.L.; Zhang, S.H.; Wu, Z.H.; Li, Z.J. Phenotypic Diversity and Variation in Natural Populus euphratica Populations Shaped by Environmental Factors. Contemp. Probl. Ecol. 2023, 16, 230–252. [Google Scholar] [CrossRef]
  22. Garcia, R.; Siepielski, A.M.; Benkman, C.W. Cone and seed trait variation in whitebark pine (Pinus albicaulis; Pinaceae) and the potential for phenotypic selection. Am. J. Bot. 2009, 96, 1050–1054. [Google Scholar] [CrossRef] [PubMed]
  23. Zhang, H.B.; Lv, D.; Zhao, M.; Zhao, X.P.; Zhao, H.; Li, W. Genetic structure analysis of Picea crassifolia based on genome-wide SNP molecular markers. Bull. Bot. Res. 2022, 42, 373–382. [Google Scholar]
  24. Chen, Y.L.; Lv, D.; Zhao, M.; Zhao, H.; Zhao, X.P.; Li, W. Half-sib progeny test and evaluation of parents of Picea crassifolia. J. Beijing For. Univ. 2021, 43, 17–24. [Google Scholar] [CrossRef]
  25. Yücedağ, C.; Gezer, A.; Orhan, H. The genetic variation in Crimean juniper populations from the Lakes District of Turkey. Rom. Biotechnol. Lett. 2010, 15, 5487–5492. [Google Scholar]
  26. Li, Q.; Wang, J.; Li, D.; Hu, C.; Qi, S. Genetic variation of wood traits in asexual lines of Qinghai spruce. J. Northeast For. Univ. 2015, 43, 12–16+35. [Google Scholar] [CrossRef]
  27. Bodare, S. Conservation Genetics and Speciation in Asian Forest Trees. Doctoral Dissertation, Acta Universitatis Upsaliensis, Uppsala, Sweden, 2013. [Google Scholar]
  28. Zhang, S.; Zhang, H.; Ding, L.; Xia, Y.; Dai, W.; Han, X.; Siqin, T.; You, X. Evaluation and Selection of Excellent Provenances of Eleutherococcus senticosus. Forests 2023, 14, 1359. [Google Scholar] [CrossRef]
  29. Donaldson, L.A. Within-and between-tree variation in microfibril angle in Pinus radiata. N. Z. J. For. Sci. 1992, 22, 77–86. [Google Scholar]
  30. Pan, Y.; Li, S.; Wang, C.; Ma, W.; Xu, G.; Shao, L.; Li, K.; Zhao, X.; Jiang, T. Early evaluation of growth traits of Larix kaempferi clones. J. For. Res. 2018, 29, 1031–1039. [Google Scholar] [CrossRef]
  31. Li, C.; Wang, Z.; Liu, R.J.; Yao, L.H.; Guo, Y. Compative ative study on the tracheid moprphology and basic density of clonal chinese fir. J. Inn. Mong. Agric. Univ. (Nat. Sci. Ed.) 2020, 41, 54–60. [Google Scholar] [CrossRef]
  32. Gao, X.X.; Chen, J.; Xu, R.; Yu, J.; Yang, C.M.; Peng, F.; Zhang, Y.Q.; Peng, Y.L. Variation and correlation analysis on phenotypic traits of Scutellaria baicalensis from different strains. China J. Chin. Mater. Medica 2016, 41, 205–210. [Google Scholar] [CrossRef] [PubMed]
  33. Li, G.; Wang, Y.F.; Tang, L.; Yang, C.Y.; Li, R.Y.; Ma, X.J. Phenotypic Trait Variation, Principal Component, Correlation and Path Analysis of Paris polyphylla var. Yunnanensis. J. Chin. Med. Mater. 2015, 38, 1339–1342. [Google Scholar] [CrossRef]
  34. Du, Q.; Xu, B.; Gong, C.; Yang, X.; Pan, W.; Tian, J.; Li, B.; Zhang, D. Variation in growth, leaf, and wood property traits of Chinese white poplar (Populus tomentosa), a major industrial tree species in Northern China. Can. J. For. Res. 2014, 44, 326–339. [Google Scholar] [CrossRef]
  35. Li, Y.; Liu, X.; Ma, J.; Zhang, X.; Xu, L.A. Phenotypic variation in Phoebe bournei populations preserved in the primary distribution area. J. For. Res. 2018, 29, 35–44. [Google Scholar] [CrossRef]
  36. Popović, V.; Nikolić, B.; Lučić, A.; Rakonjac, L.; Šešlija Jovanović, D.; Miljković, D. Morpho-anatomical trait variability of the Norway spruce (Picea abies (L.) Karst.) needles in natural populations along elevational diversity gradient. Trees 2022, 36, 1131–1147. [Google Scholar] [CrossRef]
  37. Li, W.; Zhang, Z.; Xin, Y.; Wang, F.; Xin, P.; Gao, J. Needle phenotype variation among natural populations of Pinus yunnanensis, P. kesiya var. langbianensis and P. kesiya. Chin. J. Plant Ecol. 2023, 47, 833–846. [Google Scholar] [CrossRef]
  38. Luo, J.; Li, X.Q.; Sun, P.; Huang, X.J.; Li, S.Q.; Huang, C.L. Phenotypic variation in natural population of Picea asperata. J. Northeast For. Univ. 2003, 31, 9–11. [Google Scholar]
  39. Luo, J.; Gu, W.C. Cone and seed variation of natural population in Picea asperata. J. Northwest Sci-Tech Univ. Agri. For. 2004, 32, 60–66. [Google Scholar]
  40. Luo, J.; Gu, W.C. Study on phenotypic diversity of natural population in Picea asperata. Sci. Silvae Sin. 2005, 41, 66–73. [Google Scholar]
  41. Meng, J.; Chen, X.; Huang, Y.; Wang, L.; Xing, F.; Li, Y. Environmental contribution to needle variation among natural populations of Pinus tabuliformis. J. For. Res. 2019, 30, 1311–1322. [Google Scholar] [CrossRef]
  42. Lewandowska, A.; Boratynska, K.; Marcysiak, K.; Gómez, D.; Romo, A.; Malicki, M.; Iszkulo, G.; Boratynski, A. Phenotypic differentiation of Rhododendron ferrugineum populations in European mountains. Dendrobiology 2022, 87, 1–12. [Google Scholar] [CrossRef]
  43. Gülcü, S.; Üçler, A.Ö. Genetic variation of Anatolian black pine (Pinus nigra Arnold. subsp. pallasiana (Lamb.) Holmboe) in the lakes district of Turkey. Silvae Genet. 2008, 57, 1–5. [Google Scholar] [CrossRef]
  44. Guo, Q.; Sun, Y.; Zhang, J.; Li, Y. Variation of phenotypic and physiological traits of Robinia pseudoacacia L. from 20 provenances. PLoS ONE 2022, 17, e0262278. [Google Scholar] [CrossRef] [PubMed]
  45. MacLachlan, I.R.; Wang, T.; Hamann, A.; Smets, P.; Aitken, S.N. Selective breeding of lodgepole pine increases growth and maintains climatic adaptation. For. Ecol. Manag. 2017, 391, 404–416. [Google Scholar] [CrossRef]
  46. Liu, K.; Han, Y.; Wang, X.; Li, L.; Shen, Q.; Zheng, Y.; Rong, J.; Chen, L. Difference and evaluation of grow traits of Fokienia hodginsii caused by different provenances. J. Cent. South Univ. For. Technol. 2023, 43, 62–72. [Google Scholar] [CrossRef]
  47. He, Q.; Yang, S.; Li, Y.; Shen, X.; Liu, X. Phenotypic variations in seed and fruit traits of Liquidambar formosana populations. Chin. J. Plant Ecol. 2018, 42, 752–763. [Google Scholar] [CrossRef]
  48. Metougui, M.L.; Mokhtari, M.; Maughan, P.J.; Jellen, E.N.; Benlhabib, O. Morphological variability, heritability and correlation studies within an argan tree population (Argania spinosa (L.) Skeels) preserved in situ. Int. J. Agric. For. 2017, 7, 42–51. [Google Scholar]
  49. Chen, Y. Selection of Superior Half-Sib Families and Genome-Wide Association Study of Important Traits in Picea crassifolia. Master’s Thesis, Beijing Forestry University, Beijing, China, 2021. [Google Scholar] [CrossRef]
  50. Kaviriri, D.K.; Li, Y.; Zhang, D.; Li, H.; Fan, Z.; Wang, J.; Wang, L.; Wang, Q.; Wang, D.; Chiang, V.L.; et al. Clonal variations in cone, seed and nut traits in a Pinus koraiensis seed orchard in Northeast China. J. For. Res. 2021, 32, 171–179. [Google Scholar] [CrossRef]
  51. Barzdajn, W. An assessment of diagnostic value of morphological traits of Norway spruce (Picea abies (L.) Karst.) cones for discrimination of spruce provenances. Sylwan 1996, 140, 61–75. [Google Scholar]
Figure 1. Qinghai spruce provenance distribution map. (A) Location of Qilian Mountains in China; (B) location of 11 Qinghai spruce provenances from the Qilian Mountains.
Forests 15 00960 g001
Figure 2. Qinghai spruce provenance test forest. (A) A corner of Qinghai spruce provenance test forest; (B) excellent single plants of Qinghai spruce.
Forests 15 00960 g002
Figure 3. Correlation analysis of phenotypic traits in Qinghai spruce. (A) Correlation of needle-leaf traits in Qinghai spruce; (B) correlation of tracheid traits in Qinghai spruce.
Forests 15 00960 g003
Figure 4. Cluster analysis of needle-leaf and tracheid traits in Qinghai spruce. (A) Cluster analysis of needle-leaf traits in Qinghai spruce; (B) cluster analysis of tracheid traits in Qinghai spruce; and (C) cluster analysis of needle-leaf and tracheid traits in Qinghai spruce.
Forests 15 00960 g004
Figure 5. Principal component analysis of phenotypic traits in Qinghai spruce. (A) Principal component analysis of needle-leaf traits in Qinghai spruce; (B) principal component analysis of tracheid traits in Qinghai spruce; and (C) principal component analysis of needle-leaf and tracheid traits in Qinghai spruce.
Forests 15 00960 g005
Table 1. Site information on Qinghai spruce trees sampled from different provenances.
Material SourcesLongitudeLatitudeElevation (m)Quantity
XS100°03′~100°23′38°23′~38°48′27355
LC102°26′~102°55′36°33′~36°48′27905
DHS101°00′~101°30′38°20′~38°30′27525
HX102°01′~102°51′37°16′~37°45′26135
DDS100°45′~100°51′39°00′~39°04′27125
LCH99°32′~100°01′38°39′~38°56′25895
GC102°26′~102°51′36°45′~37°07′25955
DHK100°31′~100°56′37°54′~38°31′24685
QL102°06′~102°25′37°31′~37°51′24855
XYH102°24′~102°66′36°57′~37°25′26055
Note: Xishui (XS), Liancheng (LC), Daihuangshan (DHS), Haxi (HX), Dongdashan (DDS), Longchanghe (LCH), Gucheng (GC), Dahekou (DHK), Qilian (QL), and Xiyinghe (XYH).
Table 2. Abbreviated list of needle-leaf and tracheid traits in Qinghai spruce (Picea abies).
Needle-LeafAbridgeEarlywoodAbridgeLatewoodAbridge
Fresh weightNFWLengthETLLengthLTL
LengthNLDiameterETDDiameterLTD
WidthNWLumen diameterETLDLumen diameterLTLD
ThicknessNTWall thicknessETWTWall thicknessLTWT
Dry weightNDWLength/diameter ratioETLEDRLength/diameter ratioLTLEDR
Length/width ratioNLWRLumen/diameter ratioETLUDRLumen/diameter ratioLTLUDR
Width/thickness ratioNWTRWall/lumen ratioETWLRWall/lumen ratioLTWLR
Moisture contentNMC
Table 3. Multiple comparisons of morphological indicators of earlywood tracheids in different provenances of Qinghai spruce.
ProvenanceEarlywood Tracheid (μm)
ETLETDETLDETWTETLEDRETLUDRETWLR
XS3370.68 ± 63.38 b 52.18 ± 0.86 bcd44.33 ± 0.85 cd7.85 ± 0.22 ab65.48 ± 1.54 ab0.85 ± 0.04 c0.18 ± 0.01 a
LC3101.49 ± 70.41 c51.13 ± 0.90 cd44.31 ± 0.86 cd 6.83 ± 0.19 cde61.64 ± 1.62 bcd0.87 ± 0.01 a0.16 ± 0.01 c
DHS3402.97 ± 65.54 b 52.82 ± 1.01 bc 46.16 ± 1.01 abc 6.66 ± 0.18 de 65.87 ± 1.81 ab 0.87 ± 0.01 a 0.15 ± 0.01 c
HX3674.02 ± 60.06 a 53.51 ± 0.88 abc 45.59 ± 0.92 bc7.91 ± 0.22 a 69.51 ± 1.44 a 0.85 ± 0.01 bc 0.18 ± 0.01 ab
DDS3303.31 ± 73.26 b 54.54 ± 1.14 ab 47.64 ± 1.11 ab6.90 ± 0.19 cde 61.39 ± 1.50 bcd 0.87 ± 0.01 a 0.15 ± 0.01 c
LCH2906.80 ± 85.47 c 51.81 ± 1.14 bcd 45.40 ± 1.34 bc6.40 ± 0.19 e56.76 ± 1.66 d 0.87 ± 0.01 a0.15 ± 0.01 c
GC3304.39 ± 56.70 b51.39 ± 0.89 bcd 44.39 ± 0.89 cd 7.01 ± 0.18 cde65.32 ± 1.53 ab 0.86 ± 0.01 ab 0.16 ± 0.01 c
DHK2924.40 ± 55.41 c 49.58 ± 0.85 d42.21 ± 0.82 d7.37 ± 0.24 abc59.66 ± 1.28 cd 0.85 ± 0.01 bc 0.18 ± 0.01 ab
QL3396.29 ± 50.89 b 56.20 ± 1.32 a 48.94 ± 1.33 a 7.26 ± 0.17 bcd62.82 ± 2.07 bc 0.87 ± 0.01 a 0.16 ± 0.01 c
XYH3056.54 ± 63.75 c 52.99 ± 1.20 bc 46.31 ± 1.21 abc 6.68 ± 0.23 de58.75 ± 1.44 cd 0.87 ± 0.01 a 0.15 ± 0.01 c
F-value13.805 **3.292 **3.418 **6.196 **5.809 **4.805 **4.595 **
Note: ** indicates highly significant difference (p < 0.01). Letters a–e: differences are considered not significant if there is one letter with the same label, and significant if there are different letters with different labels.
Table 4. Multiple comparisons of morphological indicators of latewood tracheids in different provenances of Qinghai spruce.
ProvenanceLatewood Tracheid (μm)
LTLLTDLTLDLTWTLTLEDRLTLUDRLTWLR
XS3637.78 ± 64.19 ab 40.67 ± 0.61 abc20.53 ± 0.51 b 20.14 ± 0.41 a 90.47 ± 1.94 a0.50 ± 0.01 b1.03 ± 0.04 b
LC3635.91 ± 64.17 ab 40.84 ± 0.61 abc 22.20 ± 0.61 ab 18.64 ± 0.42 bc 89.59 ± 1.59 a 0.54 ± 0.01 a 0.89 ± 0.04 bc
DHS3645.44 ± 68.45 ab 40.99 ± 0.51 ab 22.36 ± 0.50 a 18.63 ± 0.40 bc 89.34 ± 1.70 a 0.54 ± 0.01 a 0.87 ± 0.03 c
HX3728.44 ± 77.22 a 41.96 ± 0.49 a 21.98 ± 0.49 ab 19.98 ± 0.42 ab 89.03 ± 1.70 a 0.52 ± 0.01 ab 0.95 ± 0.03 bc
DDS3456.91 ± 79.43 bc 41.91 ± 0.48 a21.74 ± 0.66 ab 20.17 ± 0.49 a 82.87 ± 1.92 b0.52 ± 0.01 ab 1.01 ± 0.05 b
LCH3161.01 ± 93.30 d 38.05 ± 0.56 de 17.74 ± 0.53 c 20.31 ± 0.35 a 82.82 ± 1.94 b0.46 ± 0.01 c 1.22 ± 0.05 a
GC3598.50 ± 58.38 abc 40.00 ± 0.65 bc20.93 ± 0.61 ab 19.07 ± 0.34 abc90.88 ± 1.70 a0.52 ± 0.01 ab 0.98 ± 0.04 bc
DHK3404.44 ± 50.38 c 37.47 ± 0.54 e 17.58 ± 0.47 c 19.89 ± 0.50 ab91.84 ± 1.79 a 0.47 ± 0.01 c1.19 ± 0.05 a
QL3665.32 ± 76.60 ab 41.57 ± 0.63 ab 21.65 ± 0.66 ab 19.92 ± 0.61 ab88.70 ± 1.86 a 0.52 ± 0.01 ab 0.99 ± 0.05 bc
XYH3389.00 ± 66.38 c 39.19 ± 0.53 cd 20.86 ± 0.54 ab 18.34 ± 0.43 d86.90 ± 1.68 ab0.53 ± 0.01 ab 0.93 ± 0.04 bc
F-value6.110 **7.779 **9.620 **2.888 *3.091 *7.077 **7.320 **
Note: * indicates significant difference (p < 0.05), and ** indicates highly significant difference (p < 0.01). Letters a–e: differences are considered not significant if there is one letter with the same label, and significant if there are different letters with different labels.
Table 5. Multiple comparisons were conducted on the morphological indexes of Qinghai spruce needles from different provenances.
ProvenanceNL (mm)NW (mm)NT (mm)NFW (mg)NDW (mg)NLWRNWTRNMC%
XS15.10 ± 0.22 e1.76 ± 0.02 a1.26 ± 0.01 b21.22 ± 0.58 c9.75 ± 0.25 c8.61 ± 0.10 f1.39 ± 0.01 bc53.78 ± 0.30 bc
LC15.92 ± 0.27 d1.26 ± 0.02 g1.09 ± 0.02 f15.49 ± 0.55 f7.01 ± 0.26 g13.06 ± 0.36 b1.16 ± 0.02 f54.69 ± 0.55 b
DHS15.56 ± 0.19 de1.69 ± 0.01 b1.35 ± 0.01 a22.58 ± 0.38 b10.63 ± 0.19 b9.26 ± 0.14 e1.25 ± 0.01 d52.90 ± 0.17 c
HX13.7 ± 0.19 g1.56 ± 0.01 cd1.16 ± 0.01 d16.40 ± 0.38 f7.96 ± 0.17 f8.81 ± 0.13 ef1.36 ± 0.02 c51.16 ± 0.32 d
DDS16.58 ± 0.10 c1.58 ± 0.01 c1.16 ± 0.01 d19.97 ± 0.29 d9.14 ± 0.08 de10.59 ± 0.12 d1.36 ± 0.01 c53.59 ± 0.60 bc
LCH16.95 ± 0.30 c1.65 ± 0.01 b1.17 ± 0.01 d23.03 ± 0.75 b10.03 ± 0.29 c10.28 ± 0.17 d1.42 ± 0.01 b55.99 ± 0.25 a
GC20.16 ± 0.26 a1.52 ± 0.02 de1.32 ± 0.01 a26.36 ± 0.35 a11.40 ± 0.16 a13.61 ± 0.32 a1.15 ± 0.01 f56.72 ± 0.24 a
DHK14.40 ± 0.07 f1.67 ± 0.01 b1.13 ± 0.01 e17.88 ± 0.25 e8.65 ± 0.15 e8.66 ± 0.08 f1.49 ± 0.01 a51.64 ± 0.33 d
QL15.52 ± 0.20 de1.45 ± 0.01 f1.16 ± 0.01 de16.33 ± 0.33 f7.35 ± 0.13 g10.76 ± 0.15 d1.26 ± 0.13 d54.61 ± 0.38 b
XYH17.80 ± 0.11 b1.48 ± 0.02 ef1.22 ± 0.01 c21.98 ± 0.35 bc9.59 ± 0.23 cd12.28 ± 0.20 c1.21 ± 0.01 e56.80 ± 0.37 a
F-value80.108 **73.481 **52.260 **63.212 **50.398 **87.787 **71.004 **27.501 **
Note: ** indicates highly significant difference (p < 0.01). Letters a–g: differences are considered not significant if there is one letter with the same label, and significant if there are different letters with different labels.
Table 6. Analysis of the variation in needle-leaf and tracheid traits in Qinghai spruce.
TraitMeanMaximumMinimumSDCV (%)
NL/mm16.1726.4310.662.6116.17
NW/mm1.562.090.920.2113.54
NT/mm1.201.520.830.1411.33
NFW/mg20.1236.39.305.3826.74
NDW/mg9.1516.64.002.3225.32
NLWR10.5920.496.462.5624.18
NWTR1.311.560.860.1712.92
NMC%54.1969.5836.574.007.39
ETL/μm3244.094753.31664.4551.3417.00
ETD/μm52.6178.827.68.1015.39
ETLD/μm45.5370.321.78.0917.77
ETWT/μm7.0913.42.81.6323.03
ETLEDR62.72110.7534.6012.8420.48
ETLUDR0.860.950.720.044.18
ETWLR0.160.380.050.0431.16
LTL/μm3532.274838.12060.0569.0516.11
LTD/μm40.2655.425.74.5911.40
LTLD/μm20.7643.38.04.6222.25
LTWT/μm19.5133.49.73.4817.84
LTLEDR88.24132.5450.9214.0515.93
LTLUDR0.510.780.280.0816.24
LTWLR1.012.550.280.3535.28
Table 7. Main factors and comprehensive evaluation of the tracheid traits of Qinghai spruce from different provenances.
ProvenanceY1Y2Y3Y4Y5Y6Aggregate Score (Y)Ranking
XS−0.6312−0.09320.40730.16120.20870.0537−0.07687
LC−0.1007−0.1333−0.1822−0.3000−0.03370.3033−0.11129
DHS0.1165−0.05920.2785−0.3703−0.1027−0.2443−0.01184
HX−0.6723−0.13020.99870.23050.1187−0.2993−0.02406
DDS0.49380.11580.21830.4022−0.3590−0.03220.20852
LCH0.74300.3057−0.98780.1535−0.40600.04030.08703
GC−0.2305−0.06030.0663−0.32020.0173−0.0960−0.11078
DHK−0.41970.0190−0.7743−0.12570.26320.3205−0.203810
QL0.35780.06230.61000.22530.1815−0.03330.26051
XYH0.3433−0.0237−0.6342−0.05470.1083−0.0123−0.01705
Table 8. Main factors and comprehensive evaluation of needle-leaf traits of Qinghai spruce from different provenances.
ProvenanceY1Y2Aggregate Score (Y)Ranking
XS0.0609 1.4362 0.5414 3
LC−1.0277 −2.2020 −1.2386 10
DHS0.8066 1.0488 0.7289 2
HX−1.5218 0.5850 −0.4563 8
DDS−0.1550 0.1337 −0.0203 6
LCH0.5074 0.5300 0.4120 4
GC2.6336 −0.9829 0.8001 1
DHK−1.3141 1.2407 −0.1299 7
QL−0.9471 −0.8134 −0.7054 9
XYH0.9574 −0.9754 0.0690 5
Table 9. Main factors and comprehensive evaluation of the tracheid traits and needle-leaf traits of Qinghai spruce from different provenances.
ProvenanceY1Y2Y3Y4Y5Y6Y7Y8Aggregate Score (Y)Ranking
XS−0.7318 −0.6743 0.6520 1.1422 −0.2018 −0.2838 0.1687 0.0660 −0.2673 8
LC1.2015 −0.3890 −1.6312 −1.3222 0.5777 0.3677 −0.0532 0.2500 0.6518 3
DHS0.3607 0.5868 0.5065 1.2618 −0.0417 −0.6615 0.0085 −0.2113 −0.2148 7
HX−0.6992 −1.3117 −1.1083 1.1628 0.2830 0.0447 −0.0193 −0.2967 −0.2087 6
DDS−0.1943 0.4730 −0.2350 0.2970 −0.1237 0.3465 −0.4102 −0.0283 −0.1022 5
LCH−0.9135 0.7135 0.8720 −0.8945 −0.8605 −0.0573 −0.4532 0.0428 −1.2065 9
GC1.6305 1.0318 1.8897 −0.4747 0.9290 0.2473 0.3768 −0.0528 2.0397 1
DHK−1.7358 −1.1343 0.0355 −0.2713 −1.0073 −0.6677 0.0123 0.3643 −1.8655 10
QL0.1535 0.2693 −1.5728 0.2105 0.0940 0.2718 0.4845 −0.2550 0.3658 4
XYH0.7334 0.3933 0.0501 −0.7806 0.2875 0.3629 0.0345 0.0275 0.6984 2
Disclaimer/Publisher’s Note: The statements, opinions and data contained in all publications are solely those of the individual author(s) and contributor(s) and not of MDPI and/or the editor(s). MDPI and/or the editor(s) disclaim responsibility for any injury to people or property resulting from any ideas, methods, instructions or products referred to in the content.

