Article

Biochar Addition Increased Soil Carbon Storage but Did Not Exacerbate Soil Carbon Emission in Young Subtropical Plantation Forest

1
Department of Geography & Spatial Information Technology, Ningbo University, Ningbo 315211, China
2
Future Industries Institute, University of South Australia, Mawson Lakes, SA 5095, Australia
3
School of Geography and Planning, Longdong University, Hengshui 053010, China
4
Key Laboratory of Applied Microbiology, Ecology Institute, Qilu University of Technology (Shandong Academy of Sciences), Jinan 250103, China
*
Author to whom correspondence should be addressed.
Forests 2024, 15(6), 917; https://doi.org/10.3390/f15060917
Submission received: 2 April 2024 / Revised: 21 May 2024 / Accepted: 21 May 2024 / Published: 24 May 2024

Abstract

:
Forests play a crucial role in mitigating global warming, contributing approximately 46% of the global terrestrial carbon sink. However, it remains uncertain whether the addition of biochar to forests enhances the ecosystem’s carbon sink capacity. This study aims to address this scientific question by investigating whether biochar application increases carbon storage, potentially leading to an overall rise in carbon emissions by influencing soil respiration and identifying the underlying mechanisms. A controlled experiment was conducted in a young plantation forest that had grown for three years, where soil CO2 efflux rate and physicochemical properties, photosynthesis, and plant growth traits were measured across varying biochar addition rates (0, 5, and 10 t/ha) over five seasons. Then, statistical methods including one-way ANOVA, regression analysis, and structural equation modeling (SEM) were employed to assess differences in biological and abiotic factors among biochar addition gradients and understand the influencing mechanisms of soil CO2 efflux change. The findings revealed that biochar addition significantly increased the contents of soil organic carbon (SOC) and microbial biomass carbon (MBC), consequently promoting photosynthesis and plant growth (p < 0.05). Biochar addition accounted for 73.8% of the variation in soil CO2 efflux by affecting soil physicochemical properties, photosynthesis, and plant basal diameter growth. However, the net effect of biochar addition on soil CO2 efflux was found to be low. The positive effects of biochar addition on soil CO2 efflux via factors such as soil bulk density, total nitrogen (TN), MBC, and photosynthesis were counteracted by its negative impact through soil total phosphorus (TP), water content, pH, SOC, and plant basal diameter growth. Overall, our findings indicate that there was no significant increase in soil CO2 efflux in the short term (totaling 16 months) over the biochar addition gradient. However, we observed a substantial increase in soil carbon storage and an enhancement in the soil’s capacity to act as a carbon sink. Therefore, adding biochar to forests may be a feasible strategy to increase carbon sinks and mitigate global climate change.

1. Introduction

The escalating rise in global carbon emissions and its corresponding impact on climate change pose an increasingly severe threat to ecosystems worldwide [1,2]. The urgent focus of global attention in the current decade is on reducing atmospheric CO2 levels and effectively capturing and sequestering free CO2 [3,4]. Carbon sequestration can be achieved through two main methods: artificial and natural. Afforestation, reduced impact logging (RIL), reduced or no-tillage farming practices, and cultivation of perennial crops fall under artificial carbon sequestration methods [5,6]. In contrast, natural methods involve the deposition of plant apoptotic remnants, accumulation of soil microbial biomass, and accrual of plant root exudates and debris [7,8]. Biological carbon sequestration, among current artificial carbon sequestration techniques, is increasingly valued due to its remarkable characteristics of economic efficiency and minimal side effects. It involves utilizing photosynthesis to convert atmospheric CO2 into biomass through planting and cultivating plants and other organisms (e.g., algae) [1]. Photosynthetically sequestered carbon, especially passive soil organic carbon derived from the secondary conversion of aboveground biomass and litter, has a turnover time of more than a century [9,10]. Increasing its share in the total carbon pool can enhance the overall terrestrial carbon sink’s stability and longevity.
Adding biochar to soil has emerged as a noteworthy avenue of biological carbon sequestration in recent years due to its inherent chemical stability, robust resistance to decomposition, and ability to promote plant growth (i.e., photosynthetic carbon sequestration) [11]. Numerous studies have demonstrated that biochar can mitigate soil CO2 efflux by enhancing soil’s inert carbon content [1,12,13]. Upon entering the soil, biochar increases the proportion of inert carbon in the subterranean carbon pool as it is itself a stable carbon compound [14]. Additionally, biochar adsorbs a large amount of soil organic substances upon entry into the soil [15]. The labile organic compounds attached to the biochar surface can migrate inside the pores and interact with biochar’s mineral constituents, thereby protecting organic molecules from microbial decomposition [16,17]. Moreover, biochar can improve soil structure, augment soil fertility, and foster plant growth, indirectly increasing aboveground carbon storage [18,19,20]. It is noteworthy that biochar has the potential to significantly augment the levels of organic and microbial biomass carbon in soil, thereby playing a pivotal role in promoting plant growth and facilitating photosynthesis. Soil organic carbon holds an indispensable position as a primary energy source and a crucial catalyst for nutrient availability, essential for sustaining plant growth and optimizing photosynthetic productivity [21]. An increase in microbial biomass in the soil (especially plant growth promoting microorganisms) improves nutrient uptake and promotes plant growth and photosynthetic production [22].
However, the addition of biochar to soil could potentially stimulate CO2 emissions via a positive priming effect [15]. The effect of biochar addition to soil on CO2 emissions, especially in forest soil, is currently highly controversial. For instance, in Douglas-fir forest soil, biochar addition led to an increase in CO2 fluxes due to enhanced soil moisture availability and soil organic carbon decomposition [23]. Experimental evidence in temperate forest ecosystems confirmed that biochar addition significantly increased CO2 efflux by improving soil water holding capacity and water content, thereby ameliorating soil microbial activities [24]. A control experiment in plantation forests in northern China found that biochar increased CO2 efflux by enhancing the amount of easily oxidizable carbon in the soil [25]. Conversely, other studies reported a different conclusion. For example, in coniferous forests in northern Sweden, biochar did not significantly affect CO2 efflux over 15 months due to offsetting effects on different soil carbon metabolism processes [26]. Similar results were found in an Austrian spruce forest and a temperate coniferous forest in the western United States [27,28]. These studies reported that CO2 efflux increased only slightly at the beginning of the experiment and did not change significantly thereafter [27,28]. Some studies found that biochar indeed reduced CO2 efflux by limiting the availability of carbon sources [29,30], and by slowing down the rate of floor litter decomposition [31,32]. Biochar was also found to regulate the activity of microorganisms associated with carbon mineralization, thereby reducing soil carbon emissions [33]. At present, no definitive conclusion exists regarding the impact of biochar on soil CO2 efflux in the forest ecosystem, and more experiments are needed to unravel the control mechanisms.
Biochar addition can influence soil CO2 efflux by altering physiological metabolism, such as photosynthetic productivity and root exudates of surface plants, thereby increasing plant root respiration and promoting microbial decomposition. For instance, biochar can directly supply nutrients by enhancing biochar-N retention, while indirectly increasing inter-root and bulk soil N retention, thus favoring soil nutrient supply for plant root growth [34]. Increased root biomass leads to higher exudation of carbon-containing compounds from the soil, resulting in elevated carbon mineralization rates, a significant increase in the soil variable and active carbon pools, and subsequently, an increase in carbon emissions [35]. However, the results of a field experiment conducted in a plantation forest of Pinus sylvestris in northern Sweden revealed that the application of biochar effectively enhanced the growth of Pinus sylvestris, while not inducing significant alterations in soil carbon emissions [26]. Overall, current research outcomes on the impact of biochar addition on soil CO2 efflux through above-ground productivity show inconsistency across different plantation species, forest types, climates, and soil types [24]. There is limited relevant research available on the effect of biochar on entire forest ecosystems, with a scarcity in distinguishing between above- and underground carbon dynamics. It remains unclear whether biochar addition affects soil CO2 efflux through plant physiological carbon sequestration, plant growth, and soil priming effect. This study explores the carbon sequestration mechanism of biochar from the perspective of carbon balance of the whole forest ecosystem, which is helpful to fill the gap in the literature on the carbon sequestration effect of biochar in forests.
Forests account for approximately 57% of the carbon storage in the terrestrial ecosystem and play a significant role in absorbing CO2 from the atmosphere [36]. Therefore, the pursuit of methods to increase forest carbon storage is considered a pivotal strategy for mitigating global climate change [37]. Enhanced carbon storage in forest ecosystems may be achievable through both above and below-ground carbon sequestration [38]. To investigate whether biochar addition to forest soil affects changes in forest soil CO2 efflux, the current study examined the relationships between biochar addition rates, soil CO2 efflux, plant growth, and soil physicochemical properties in a young, subtropical, evergreen, broad-leaved plantation forest located in eastern China over five seasons through replicated field experiments. The study aims to address the following scientific questions: whether biochar addition affects forest soil carbon sinks and CO2 efflux, and what mechanisms determine this process. We propose the following hypothesis: (1) biochar has the potential to significantly augment soil carbon content; (2) biochar can enhance surface plant growth and elevate their photosynthetic productivity through improvements in soil physical structure and chemical properties; and (3) biochar addition will not cause substantial carbon emissions within plantation forest ecosystems in the short term. Integrating the validation of these hypotheses could offer a comprehensive perspective and methodological framework for harnessing biochar in forest ecosystems as an effective strategy for mitigating global climate change.

2. Materials and Methods

2.1. Study Area

The study site is located at the Panshan state-owned forest farm (29°46′ N, 121°48′ E) in the Yinzhou District, Ningbo City, Zhejiang Province, Republic of China. The site encompasses elevations ranging from 310 to 510 m and falls under the influence of a warm and humid subtropical monsoon climate [39]. The average annual sunshine duration is about 1515 h, whereas the average annual temperature is 16.2 °C, and a frost-free span ranges from 230 to 240 days. The average annual precipitation is approximately 1480 mm, mostly concentrated in the summer (June–August). The annual relative humidity reaches 84%, while the average annual evaporation ranges from 1300 to 1500 mm. As suggested by Yan et al. [39], the local soils are mainly red and yellow earths, and the soil-forming materials are Mesozoic sediments and acidic intrusive rocks, and the soil texture is mainly medium-heavy loam. The zonal vegetation consists of subtropical broad-leaved evergreen forests. The most common constructive species of the forest community are Schima superba, Castanopsis fargesii, Cyclobalanopsis myrsinifolia, Lithocarpus glaber, Liquidambar formosana, Cunninghamia lanceolata, and Pinus massoniana.

2.2. Experimental Design

In a mixed young subtropical evergreen plantation comprising three local dominant species (Cinnamoebe subkiangium, Phoebe chekiangensis, and Pseudolarix amabilis), an area of approximately 2400 m2 was selected as the object of current study, with nine 2 × 5 m2 quadrats designated for each species, totaling 27 quadrats. The whole area is approximately strip-shaped, with a length and width of about 120 m and 20 m, respectively, and the terrain is a gentle slope of about 30 degrees, with little undulation. The single-species sample quadrats were designed to mitigate the influence of mixed-species complementation effects on the experimental results. Each quadrat accommodated five individuals of a single tree species, planted manually at equidistant intervals. This young plantation was historically a Pinus massoniana forest, but it has been severely infested by the pinewood nematode disease, and the entire stand have been destroyed. After that, the Pinus massoniana forest was completely cut and cleared, and a plantation was constructed. At the time of our biochar addition experiment, the plantation had only been planted for three years.
To prevent the movement of biochar between the quadrats due to precipitation and surface wind, each quadrat was encircled by PVC panels, approximately 80 cm in horizontal depth, with approximately 40 cm buried underground. The nine quadrats of each tree species were randomly divided into three groups, each with three replications, treated with biochar addition rates of 0 t/ha (control), 5 t/ha, and 10 t/ha, respectively. The addition rates of biochar were chosen based on recent studies conducted in the subtropical forest [40]. Before biochar addition, a soil sample from the 0 to 20 cm depth was collected from a randomly selected point in each quadrat using a soil sampler (JC-802D, Juchuang Technology Co., Ltd., Yiwu, China). The soil samples collected from all sampling points within each group were mixed to create composite samples, which were then transported to the laboratory for analysis of selected physicochemical properties, as shown in Table 1.
The biochar used in this study was produced by pyrolyzing a mixed feedstock of three dominant tree species (Quercus myrsinifolia, Pinus massoniana, and Lithocarpus glaber) from the local forest. The feedstock primarily consisted of trunks and branches of mature individuals (DBH ≥ 20 cm) that had succumbed to typhoons and landslides in the local natural forests. Specifically, the trunks and branches of these deceased individuals were manually cut into cylinders approximately 30 cm in length, then transported out of the forest and processed into small pieces (length < 1.5 cm) using a wood slicer. The biochar was produced at 600 °C temperature for 24 h under the environment of inert gas atmosphere (N2). As Sun et al. [41] suggest, this preparation allows biochar to reach a high level of fixed carbon content while minimizing the proportion of unstable components, making it suitable for enhancing soil carbon storage in forests. The obtained biochar was ground and sieved through a 2 mm sieve before being uniformly spread onto the soil surface by hand and lightly tilled to ensure homogeneous mixing with the surface soil. The soil was mixed with the apoplastic layer during tilling and the depth of the topsoil was 15–20 cm. In addition, to prevent the damage of tilling on the root system of the experimental plants, the under-crown region of the plant was actively avoided. Since our experimental subjects were small individuals, this avoidance can effectively prevent root damage. The floor plants outside the under-crown region, mainly herbaceous plants, were tilled directly and left in place to rot naturally. The surface disturbance of the control group was similar to that of the biochar addition group. Furthermore, it should be noted that the addition of biochar was a singular occurrence without any subsequent supplementary inputs. The entire experiment lasted for 5 seasons and nearly 16 months. The physicochemical characteristics of the biochar are shown in Table 1. The reason we screen these four soil properties is that soil pH has a large impact on soil chemical processes, especially the availability of nutrients in the soil [42]. Additionally wood biochar has a high lime potential, which is more effective in optimizing soil nutrient availability and indirectly enhancing soil fertility by adjusting pH [42]. Moreover, since biochar is a high-quality inert carbon, the application of it into the soil increase the total carbon content [11], which is one of the most important components of soil fertility [43]. Secondly, soil nitrogen and phosphorus are considered to be the main limiting nutrient factors in subtropical forests [44]. The application of biochar not only enhances soil nitrogen and phosphorus availability through adsorption, but also affects the activities of soil microorganisms due to the fact that biochar contains nitrogen and phosphorus [34]. Based on these scientific theories, the four soil properties have been used in many previous studies as the key indicators of the effects of biochar on soil nutrients.
Table 1. The physicochemical properties of the initial soils and the characteristics of biochar. Measurements of soil properties involved all quadrats with a total of 27 soil samples (n = 27), while that of biochar characteristics were repeated 5 times (n = 5). Mean ± SD.
Bulk Density (g/cm3)Water Content
(%)
pHTotal C
(g/kg)
Total N
(mg/g)
Total P
(mg/g)
Soil1.16 ± 0.0539.30 ± 0.714.40 ± 0.0223.53 ± 0.561.20 ± 0.120.27 ± 0.02
Biochar//8.13 ± 0.06684.21 ± 0.114.28 ± 0.160.18 ± 0.04

2.3. Experimental Measurements

2.3.1. Soil CO2 Efflux

Biochar addition took place in early June, during the summer season. Subsequently, soil CO2 efflux rates (soil respiration rates) were measured in the middle of the 1st, 4th, 8th, 12th, and 16th month, representing the four seasons: summer, autumn, winter, spring, and summer again. Measurements were conducted using a soil carbon flux measurement system equipped with a survey chamber with a diameter of 20 cm (Li-8100, LI-COR Biosciences, Lincoln, NE, USA). In each quadrat of the study field, three PVC rings with an inner diameter of 20 cm and a height of 20 cm were randomly placed, protruding 4 cm above the ground surface. During each selected sampling month, three consecutive days with clear weather were chosen. Initially, the measurement time was divided into three phases: 8:00–11:00, 11:00–14:00, and 14:00–17:00, based on the daily variation of local solar radiation. However, after considering the results of Wang et al. [45] regarding the optimal sampling time, the period from 8:00 to 11:00 was deemed more representative for soil CO2 efflux measurements. Consequently, measurements were conducted during this time period. The duration of the measurements was 90 s and the equilibration phase prior to the measurements was 30 s. The measurements were repeated three times for a randomly selected PVC ring from which the average value was obtained. Due to the time-consuming measurements, all 27 quadrats of the 3 species could not be measured in each period. Instead, only one species (9 quadrats) was measured per day.

2.3.2. Measurement of Net Photosynthetic Rate and Plant Growth Traits

At the same time as soil CO2 efflux measurement, three plants were randomly selected with each quadrat, and three intact leaves from each plant were randomly selected to assess the net photosynthetic rate using a portable photosynthesis measurement system equipped with a red/blue LED light source (LI6400-02B) (Li-6400, LI-COR Biosciences, Lincoln, NE, USA). To minimize the influence of micro-environmental variations on the net photosynthetic rate, as recommended by Niu et al. [46], the leaf chamber’s temperature, relative humidity, CO2 concentration, and light intensity were set at 35 °C, 70%, 400 μmol·m−2·s−1, and 1600 μmol·m−2·s−1, respectively. The net photosynthetic rate was recorded from 8:30 am to 11:00 am local time. Each leaf underwent a light induction period lasting approximately 10–20 min before measurement to stabilize the photosynthetic rate [47]. Subsequently, the values were manually recorded 10 times once stabilized. The average of these recorded values was used to represent the net photosynthetic rate of the quadrat. Plant growth traits, including tree height, crown area, and basal diameter, were measured manually using tape measures and vernier calipers.

2.3.3. Measurement of Soil Carbon and Other Physiochemical Properties

After measuring plant growth traits during each sampling event, soil samples were collected from each quadrat using a five-point sampling method at a depth of 0–20 cm employing a soil sampler. Three soil samples were taken from each quadrat, i.e., replicated three times for a total of 81 soil samples to be tested. Soil bulk density was measured using the ring knife method [48]. Subsequently, all soil samples from each quadrat were combined to create composite samples, which were then placed in plastic bags and transported back to the laboratory. Prior to experimental analysis, soil samples were pretreated to meet the requirements outlined by Li et al. [49]. Specifically, plant roots, debris, and visible soil fauna (including biochar fragments) were immediately removed from the soil samples. A 2 mm sieve was then used to quickly shift the soil. After that, the soil was divided into two equal portions. One was stored in a refrigerator at 4 °C for the determination of MBC content. The remaining was air-dried in a cool, ventilated room free from direct sunlight, for the determination of other indicators. MBC was determined using the chloroform fumigation extraction method, and the conversion coefficient of the calculated values was 0.45 [50]. Soil total organic carbon (SOC) and soil dissolved organic carbon (DOC) were determined by potassium dichromate oxidation [45,46]. These carbon compounds were selected as indicators to reflect the effect of biochar addition on soil carbon sink because they have been proved to be sensitive to exogenous carbon input in many studies [51,52,53,54,55]. More specifically, MBC is directly related to the microbial activity because it is the available carbon resource [52]. The change in SOC content depends largely on the balance between decomposition and conservation of new input carbon by soil microorganisms [53]. DOC is the most active fraction of organic carbon, and the changes in its content will directly affect the stability of the soil carbon pool [54]. Meanwhile, DOC is also a high-quality carbon source for soil microorganisms, and its changes will also lead to changes in MBC [55].
Total nitrogen (TN) and total phosphorus (TP) was determined by a discrete auto analyzer (SmartChem 200; AMS Alliance, Villeneuve-la-Garenne, France) and a HF-HCLO4 digestion followed by molybdenum blue calorimetry, respectively [56]. Soil moisture content was measured using the oven-drying method, and soil pH was measured directly using a pH meter (pH-3C, Leici, Shanghai, China).

2.4. Calculation and Statistical Analyses

The annual cumulative soil CO2 effluxes were calculated using the daily CO2 efflux rate (Equation (1)) [57]:
R = 12 × 10 6 × 86,400 × R i D i
where R is the annual cumulative CO2 efflux (g C·m−2), and Ri is the average soil CO2 efflux rate in the ith season (μmol CO2·m−2∙s−1). Di indicates the number of days in the ith season. As suggested by Lei et al. [58], Ri is equal to the average of the measured values over different time periods for each quadrat.
The change in annual plant growth was calculated as the difference between the first (1st month) and last (16th month) measurements after biochar addition. One-way ANOVA was used to analyze the difference in soil carbon contents, annual cumulative CO2 emissions, and annual plant growth across the biochar addition rates. Before analysis, a variance homogeneity test was performed on the data. The least significant difference method was applied for post-comparison in cases of homogeneity, while the Welch method was used for non-homogeneity testing. Multivariate repeated measures ANOVA was utilized to analyze the changes in CO2 efflux rate, net photosynthetic rate and plant growth traits among three biochar addition levels across different seasons. The significances of the multivariate repeated measures ANOVA results was assessed using Mauchly’s test of sphericity. If the test indicated an influence of measurement time and species had an influence on the above indicators, one-way ANOVA was subsequently used to analyze the effects of these factors on the indicators.
Structural equation model (SEM) was employed to investigate the mechanistic factors through which biochar addition affected soil CO2 efflux in young plantations. Following the recommendation of Zhang et al. [59], stepwise multivariate regression and bivariate linear regression were used to screen the mediating variables before conducting the SEM analysis. The independent variable was the rate of biochar addition, while mediating variables were those identified in the final result of stepwise multivariate regression and had a significant relationship with biochar addition rate or soil CO2 efflux according to bivariate linear regression analysis. Evaluation and optimization of the SEM fitting effect were performed using the chi-square degrees of freedom ratio (χ2/df), standardized root mean square residual (SRMR), root mean square error of approximation (RMSEA), comparative fit index (CFI), canonical fit index (NFI), and the Tucker–Lewis index (TLI). The optimal SEM was defined by χ2/df < 3, SRMR < 0.05, RMSEA < 0.05, CFI > 0.90, NFI > 0.90, and TLI > 0.90. Subsequently, the direct, indirect, and total effects of each variable on soil CO2 efflux change were calculated using the coefficients of each path. Statistical analyses were performed using SPSS 24.0 and AMOS 26.0 software packages.

3. Results

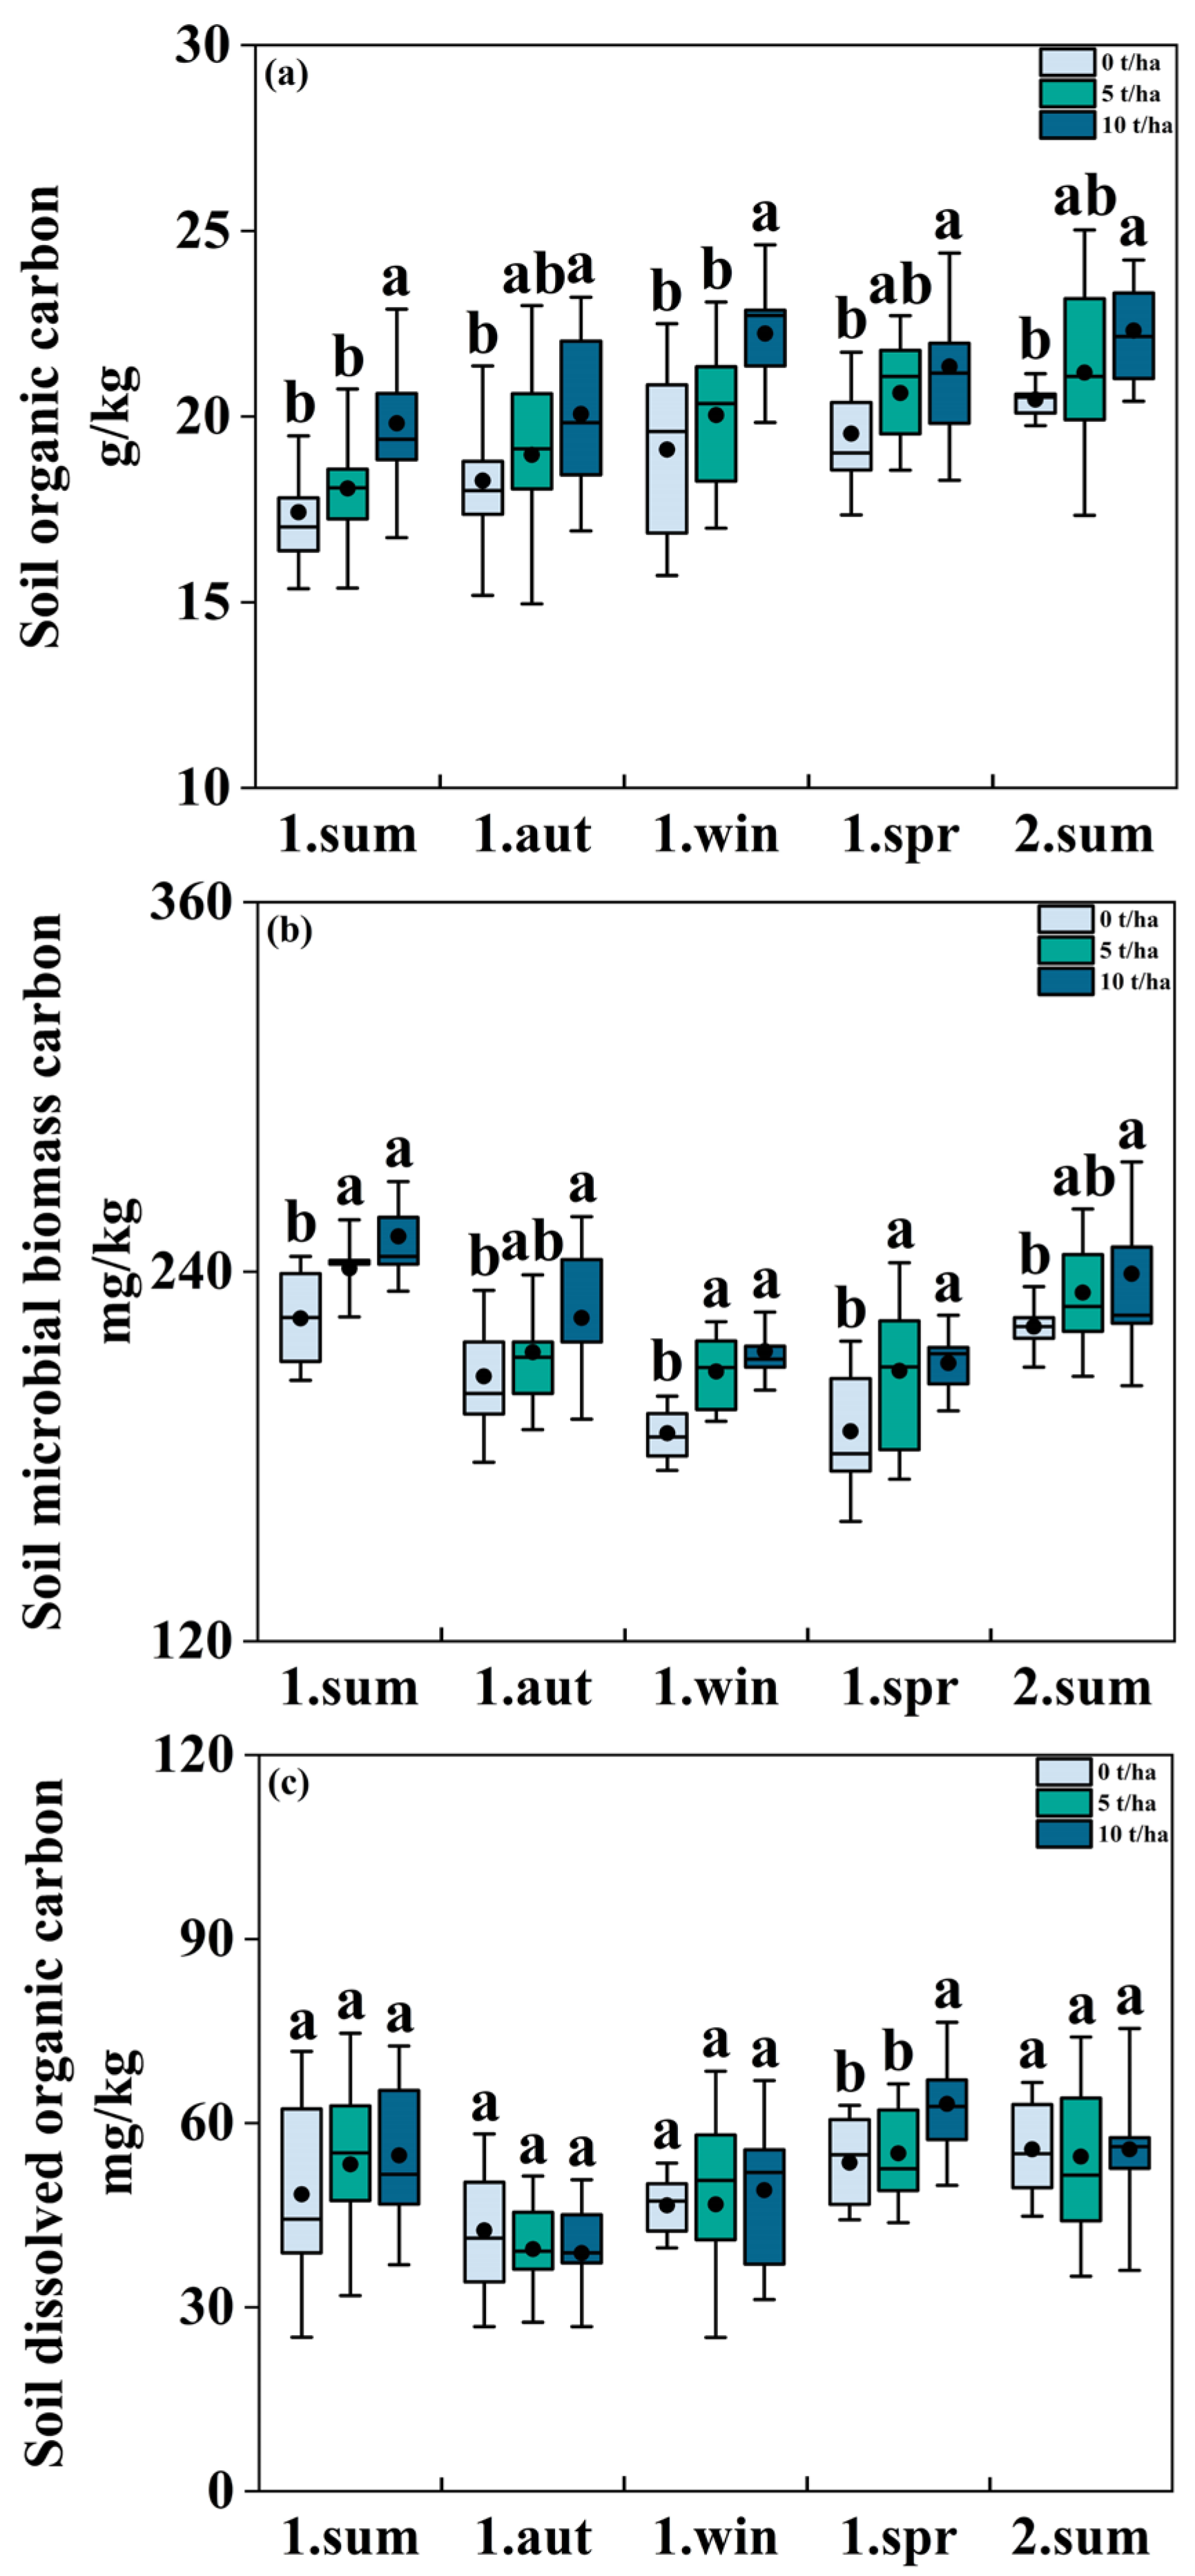
3.1. Effect of Biochar Addition on SOC, DOC and MBC

The results of one-way ANOVA indicated a significant increase in SOC and MBC contents with the increment of biochar addition (p < 0.05), while DOC contents did not exhibit notable changes (p > 0.05) in the final sampling. This suggested that biochar addition significantly enhanced SOC and MBC, whereas it had no significant impact on DOC during the experimental period (Table S1).
MBC and DOC contents displayed considerable fluctuations across different seasons, with the highest values observed in summer, followed by autumn, spring, and winter. Conversely, SOC content exhibited a gradual increase over time. Within each season, SOC and MBC exhibited significant differences (p < 0.05) among the three biochar addition levels, while DOC showed no significant variations (p > 0.05) (Figure 1).

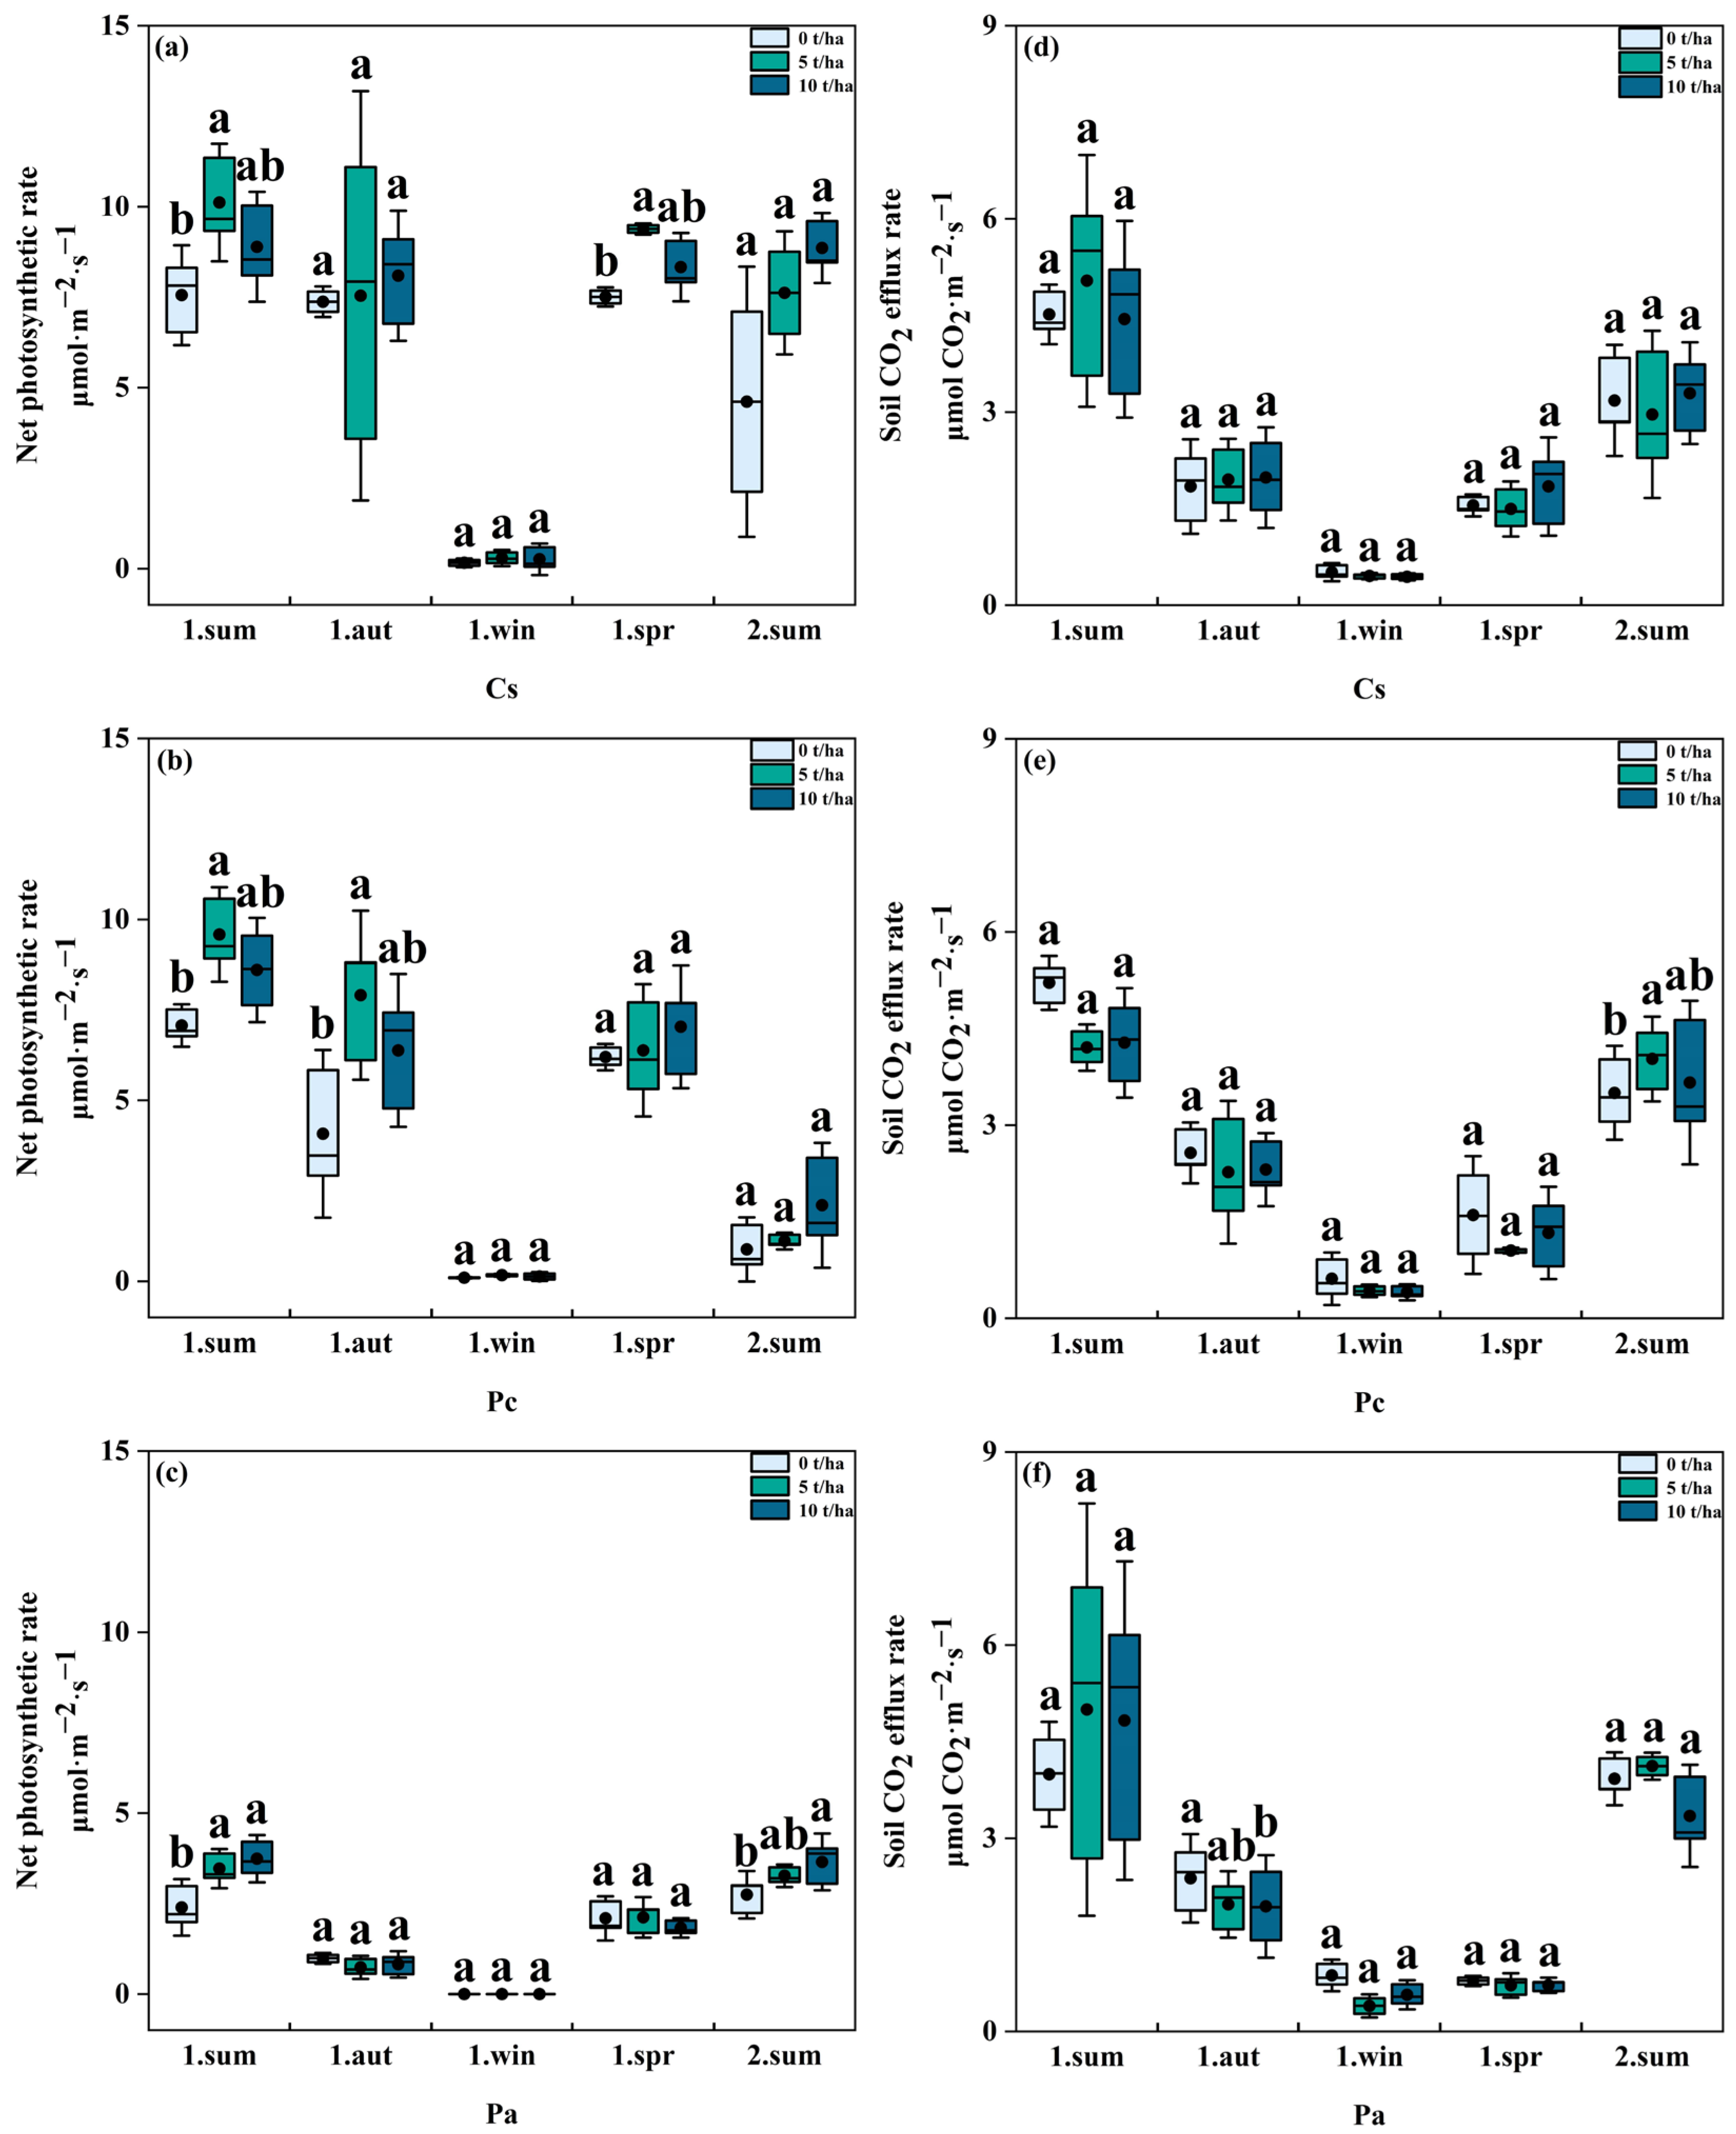
3.2. Effects of Biochar Addition on Soil CO2 Efflux Rate and Annual Cumulative Soil CO2 Efflux

Our findings indicated that the annual cumulative soil CO2 efflux of three young, pure plantation forests ranged from 755.44 ± 52.55 g C·m−2·year−1 to 949.67 ± 57.56 g C·m−2·year−1. One-way ANOVA results demonstrated that the annual cumulative soil CO2 efflux had not significant changed with the increase in the biochar addition (p > 0.05). Similarly, the annual cumulative soil CO2 efflux displayed no significant differences among the three young plantations under the identical biochar additions (p > 0.05) (Table 2).
The results of multivariate repeated measures ANOVA showed that soil CO2 efflux rate was significantly affected by season (p < 0.05), but it was not sensitive to the separate effects of biochar addition and species differences (p > 0.05). On the contrary, the effects of species, season, and biochar addition on CO2 efflux were mutually offset (p > 0.05). However, there was a positive superposition effect between seasons and species, and the differences in soil CO2 efflux rate between species can be amplified by seasons (p < 0.05). Soil CO2 efflux rate was more affected by season but less affected by biochar addition (Table 3). Soil CO2 efflux rate fluctuated greatly among different seasons, and the order was: summer > autumn > spring > winter season (Figure 2). Soil CO2 efflux rate did not show significant differences among the three biochar additions of each pure plantations in most of the season scenarios (p > 0.05) (Figure 2).
Figure 2. Changes in soil CO2 efflux rate and net photosynthesis rate of three young plantations among three biochar additions. (a) Changes in net photosynthesis rate of C. subkiangensis among three biochar additions; (b) Changes in net photosynthesis rate of P. chekiangensis among three biochar additions; (c) Changes in net photosynthesis rate of P. amabilis among three biochar additions; (d) Changes in soil CO2 efflux rate of C. subkiangensis among three biochar additions; (e) Changes in soil CO2 efflux rate of P. chekiangensis among three biochar additions; (f) Changes in soil CO2 efflux rate of P. amabilis among three biochar additions. Differential comparisons were made only within seasons and did not involve inter-seasonal comparisons. Introductions of letters and box plot are shown in Figure 1. Cs, Pc, and Pa are abbreviations of C. subkiangensis, P. chekiangensis, and P. amabilis plantations, respectively (p < 0.05).
Forests 15 00917 g002
Table 2. Differences in the annual cumulative soil CO2 efflux and annual growth of basal diameter, tree height, and crown area of young plantations among three biochar additions. Mean ± SD.
PlantationsAnnual Cumulative Soil CO2 Efflux (g C·m−2·year−1)Annual Growth of Basal Diameter (mm)Annual Growth of Tree Height (cm)Annual Crown Area Growth (cm2)
0 t/ha5 t/ha10 t/ha0 t/ha5 t/ha10 t/ha0 t/ha5 t/ha10 t/ha0 t/ha5 t/ha10 t/ha
C. subavenium800.48 ± 41.59 Aa849.34 ± 99.15 Aa827.70 ± 70.80 Aa10.36 ± 0.79 Bb14.73 ± 0.36 ABa14.92 ± 2.07 Aab35.83 ± 0.48 Ab36.37 ± 0.02 Ab38.33 ± 4.48 Ab4051 ± 936 Ab3105 ± 311 Ab5074 ± 1342 Ab
P. chekiangensis949.67 ± 57.56 Aa755.44 ± 52.55 Aa790.02 ± 79.13 Aa10.40 ± 0.69 Bb15.79 ± 1.23 Aa12.81 ± 0.98 ABb28.83 ± 3.77 Ab24.50 ± 6.17 Ab25.72 ± 7.38 Ab4030 ± 263 Ab4787 ± 354 Ab4732 ± 1376 Ab
P. amabilis761.44 ± 61.66 Aa768.12 ± 144.45 Aa765.12 ± 127.40 Aa15.01 ± 0.28 Ba15.94 ± 0.82 ABa17.94 ± 0.75 Aa58.30 ± 8.17 Aa52.67 ± 0.87 Aa60.27 ± 5.29 Aa9003 ± 673 Aa9495 ± 1111 Aa9684 ± 889 Aa
All quadrats837.20 ± 39.49 A790.97 ± 54.81 A794.28 ± 48.73 A11.92 ± 0.83 B15.48 ± 0.48 A15.22 ± 1.02 A40.99 ± 5.15 A37.84 ± 4.46 A41.44 ± 5.83 A5695 ± 895 A5796 ± 1018 A6497 ± 1006 A
Note: Different capital letters indicate the significant differences in the corresponding factors of the same plantations among three biochar additions, while the same letters indicate non-significant; Different lowercase letters indicate the significant differences in the corresponding factors of the same biochar addition among three plantations, while the same letters indicate non-significant. p < 0.05.
Table 3. The synthetic effects of biochar additions, season, and species on soil CO2 efflux rate.
Association of VariableSoil CO2 Efflux Rate (μmol CO2·m−2·s−1)Basal Diameter (mm)Tree Height (cm)Crown Area (cm2)Net Photosynthetic Rate (μmol CO2·m−2·s−1)
pFpFpFpFpF
Biochar0.830.180.073.160.073.15<0.053.92<0.00111.94
Season<0.001265.96<0.001169.02<0.00130.35<0.00160.97<0.001212.84
Species0.720.33<0.00122.37<0.00124.290.102.69<0.001177.88
Season × Biochar0.730.490.062.530.430.980.550.69<0.052.76
Season × Species0.042.92<0.013.85<0.015.46<0.00116.95<0.00141.70
Biochar × Species0.880.180.421.030.530.830.530.820.241.51
Biochar × Species × Season0.371.14<0.052.080.650.740.680.640.061.99

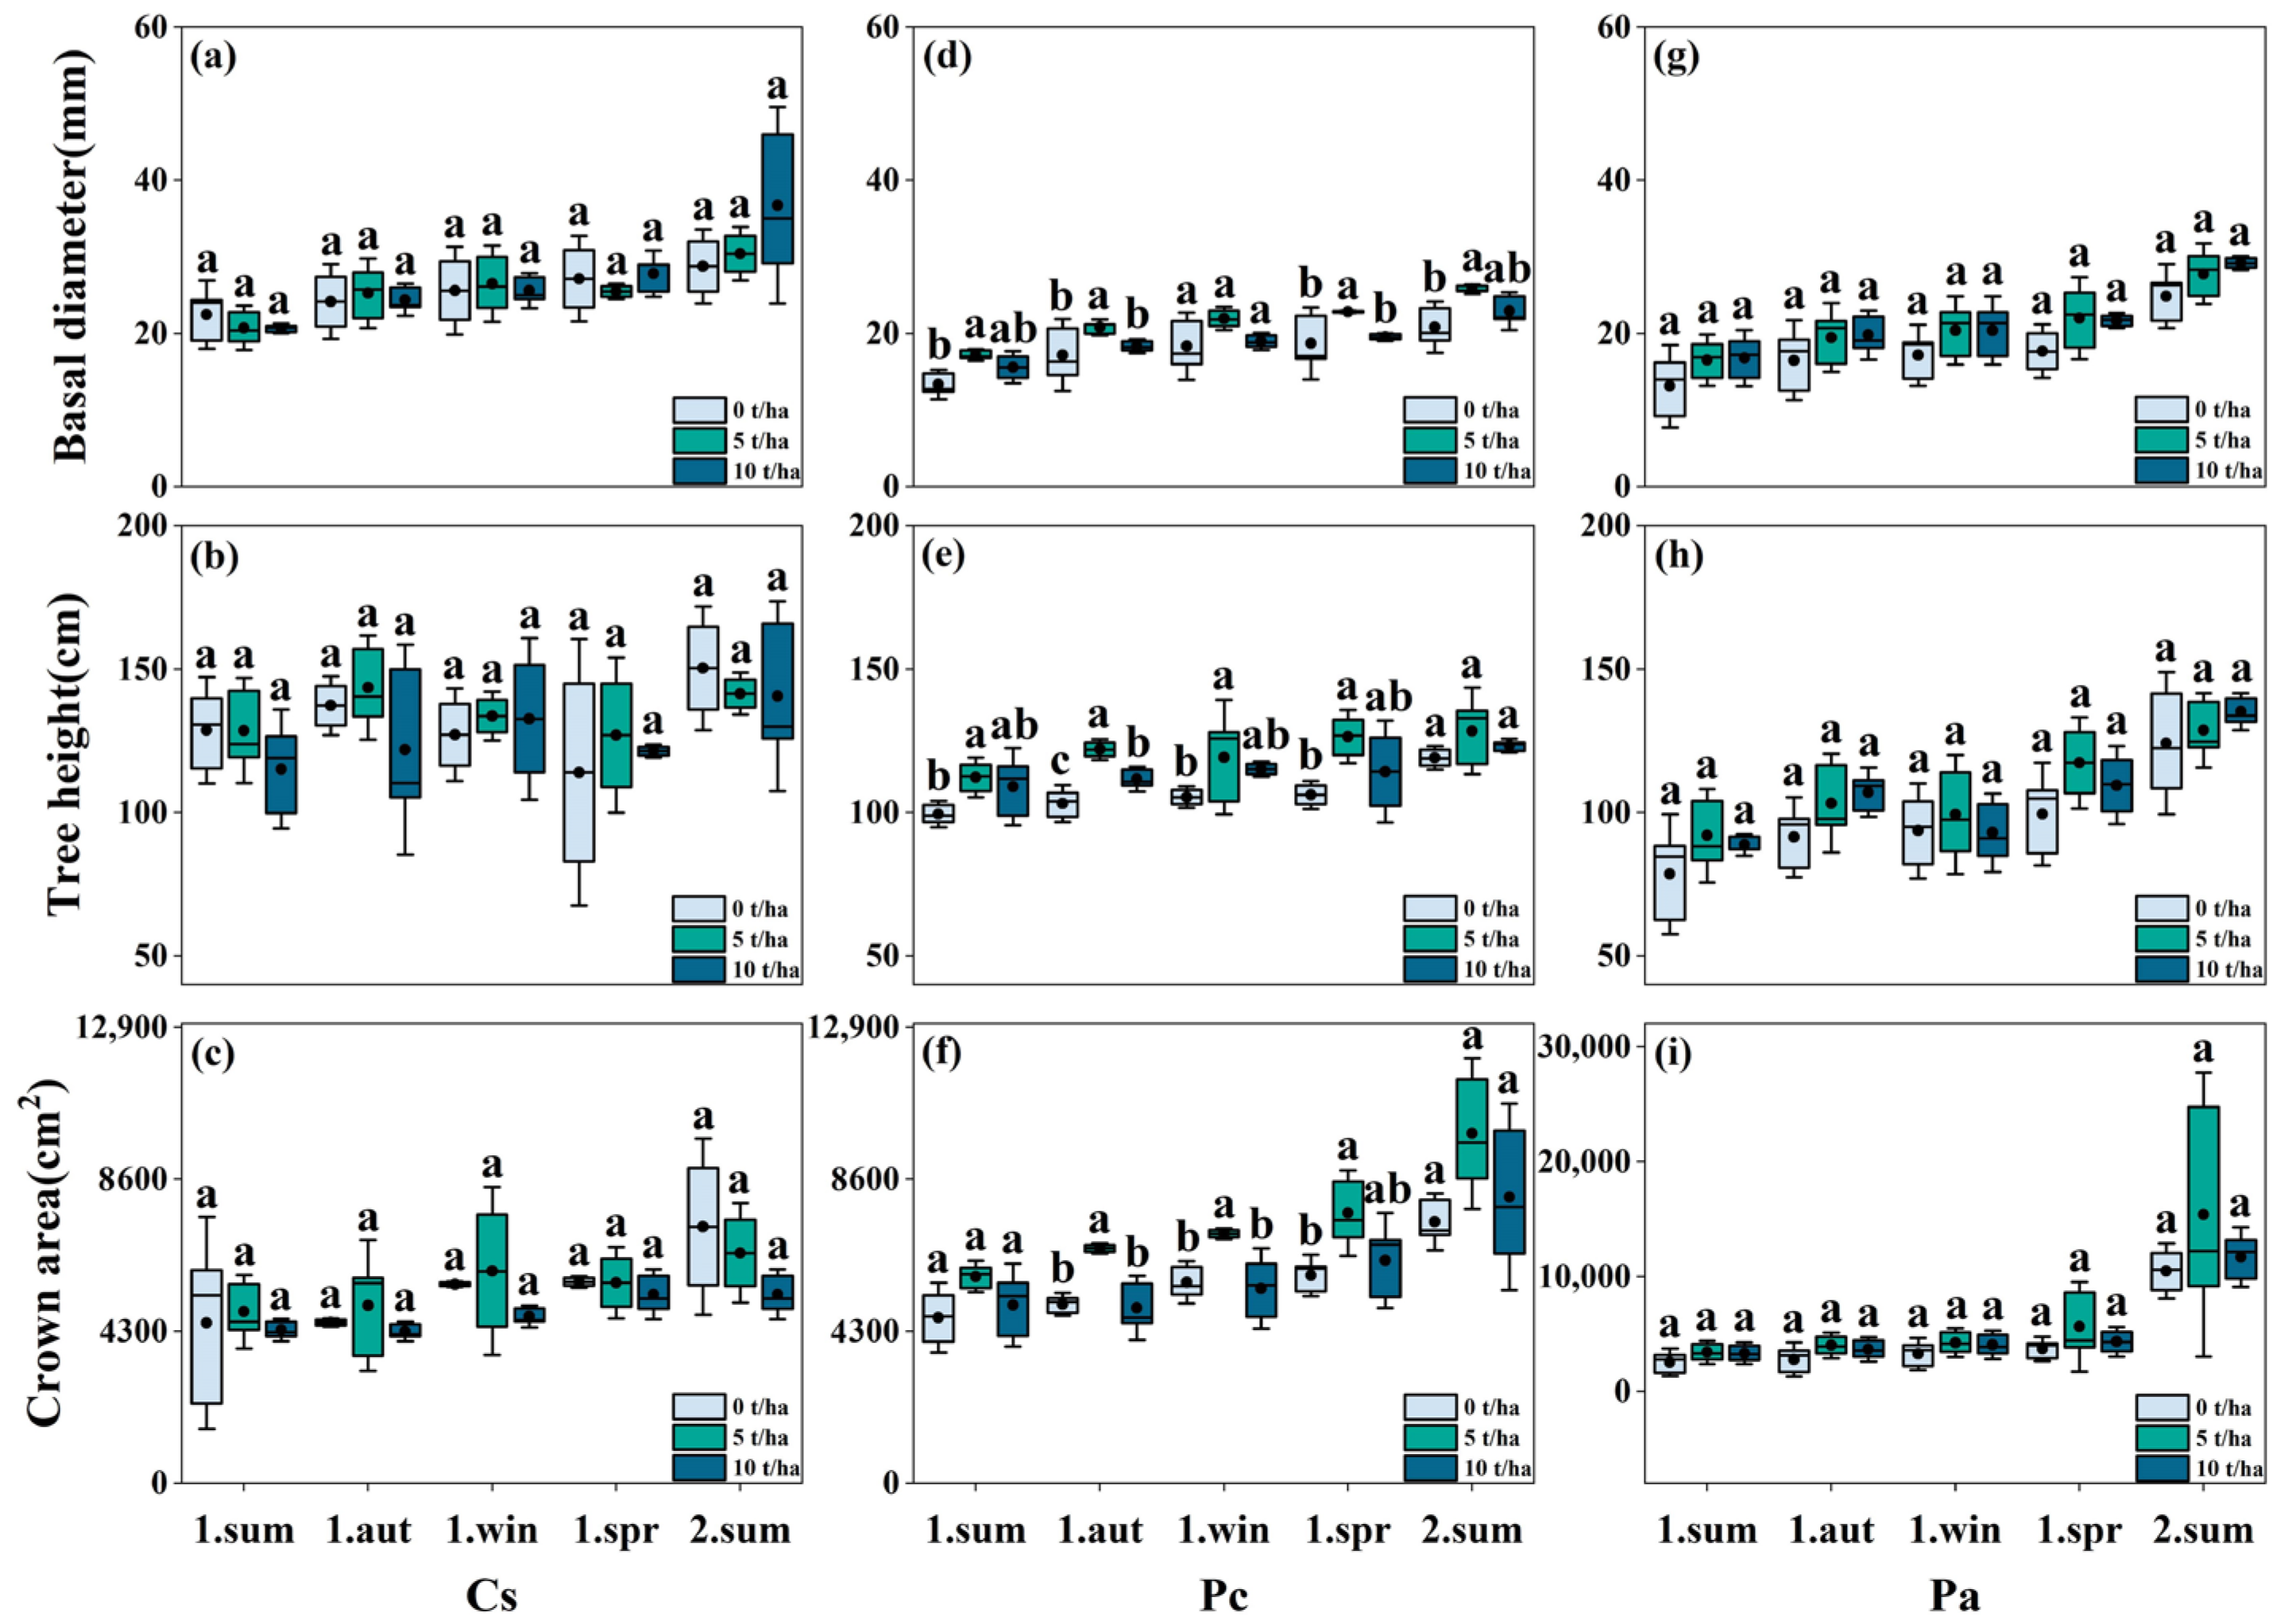
3.3. Effects of Biochar Addition on Plant Growth and Net Photosynthetic Rate

One-way ANOVA results revealed a significant increase (p < 0.05) in the annual growth of basal diameter with the increase in biochar additions, whereas the growth of tree height and crown area did not exhibit significant changes (p > 0.05). Additionally, the growth of basal diameter, tree height, and crown area of P. amabilis plantations was notably higher than that of C. subkiangensis and P. chekiangensis plantations across all biochar addition treatments (p < 0.05) (Table 2).
The results of multivariate repeated measures ANOVA indicated significant effects of season and species on the growth of plant basal diameter and tree height (p < 0.05), while they were not significantly influenced by biochar additions (p > 0.05). In contrast, crown area growth was significantly impacted by both biochar addition and season (p < 0.05). After a comprehensive analysis, our findings revealed that biochar addition, species, and season have offsetting effects on the plant growth traits (Table 3). Specifically, season and species demonstrated positive superposition-promoting effects on plant growth traits. On the contrary, the influence of biochar on the growth traits depended on the amount of addition. Moderate biochar addition promoted the enhancement of growth traits, particularly crown area and tree height. However, with increasing concentration, the promoting effects were diminished, and, in some cases, counteracted the positive influences from species and season (Table 3). This was corroborated by further analysis, which demonstrated that tree height, basal diameter, and crown area of P. chekiangensis plantations at a concentration of 5 t/ha were higher than those at 10 t/ha and 0 t/ha in each season, indicating that moderate biochar addition enhanced plant growth, while excessive addition restrained it (Figure 3).
Seasons and species exhibited a positive synergistic effect on net photosynthetic rate, with seasonal differences amplifying the disparities between species (Table 3). However, the net photosynthetic rate did not show significant changes across the gradient of biochar addition in most scenarios (Figure 2). Conducting the multivariate repeated measures ANOVAs revealed that net photosynthetic rate was influenced by biochar addition, season, and species (p < 0.05). The positive effects of season and species on net photosynthetic rate were counteracted by biochar addition (p > 0.05) (Table 3).
Figure 3. Changes in basal diameter, tree height, and crown area of three young plantations among three biochar additions. (a) Changes in basal diameter of C. subkiangensis among three biochar additions; (b) Changes in tree height of C. subkiangensis among three biochar additions; (c) Changes in crown area of C. subkiangensis among three biochar additions; (d) Changes in basal diameter of P. chekiangensis among three biochar additions; (e) Changes in tree height of P. chekiangensis among three biochar additions; (f) Changes in crown area of P. chekiangensis among three biochar additions; (g) Changes in basal diameter of P. amabilis among three biochar additions; (h) Changes in tree height of P. amabilis among three biochar additions; (i) Changes in crown area of P. amabilis among three biochar additions. Differential comparisons were made only within seasons and did not involve inter-seasonal comparisons. Introduction of letters and box plot are shown in Figure 1 p < 0.05.
Forests 15 00917 g003

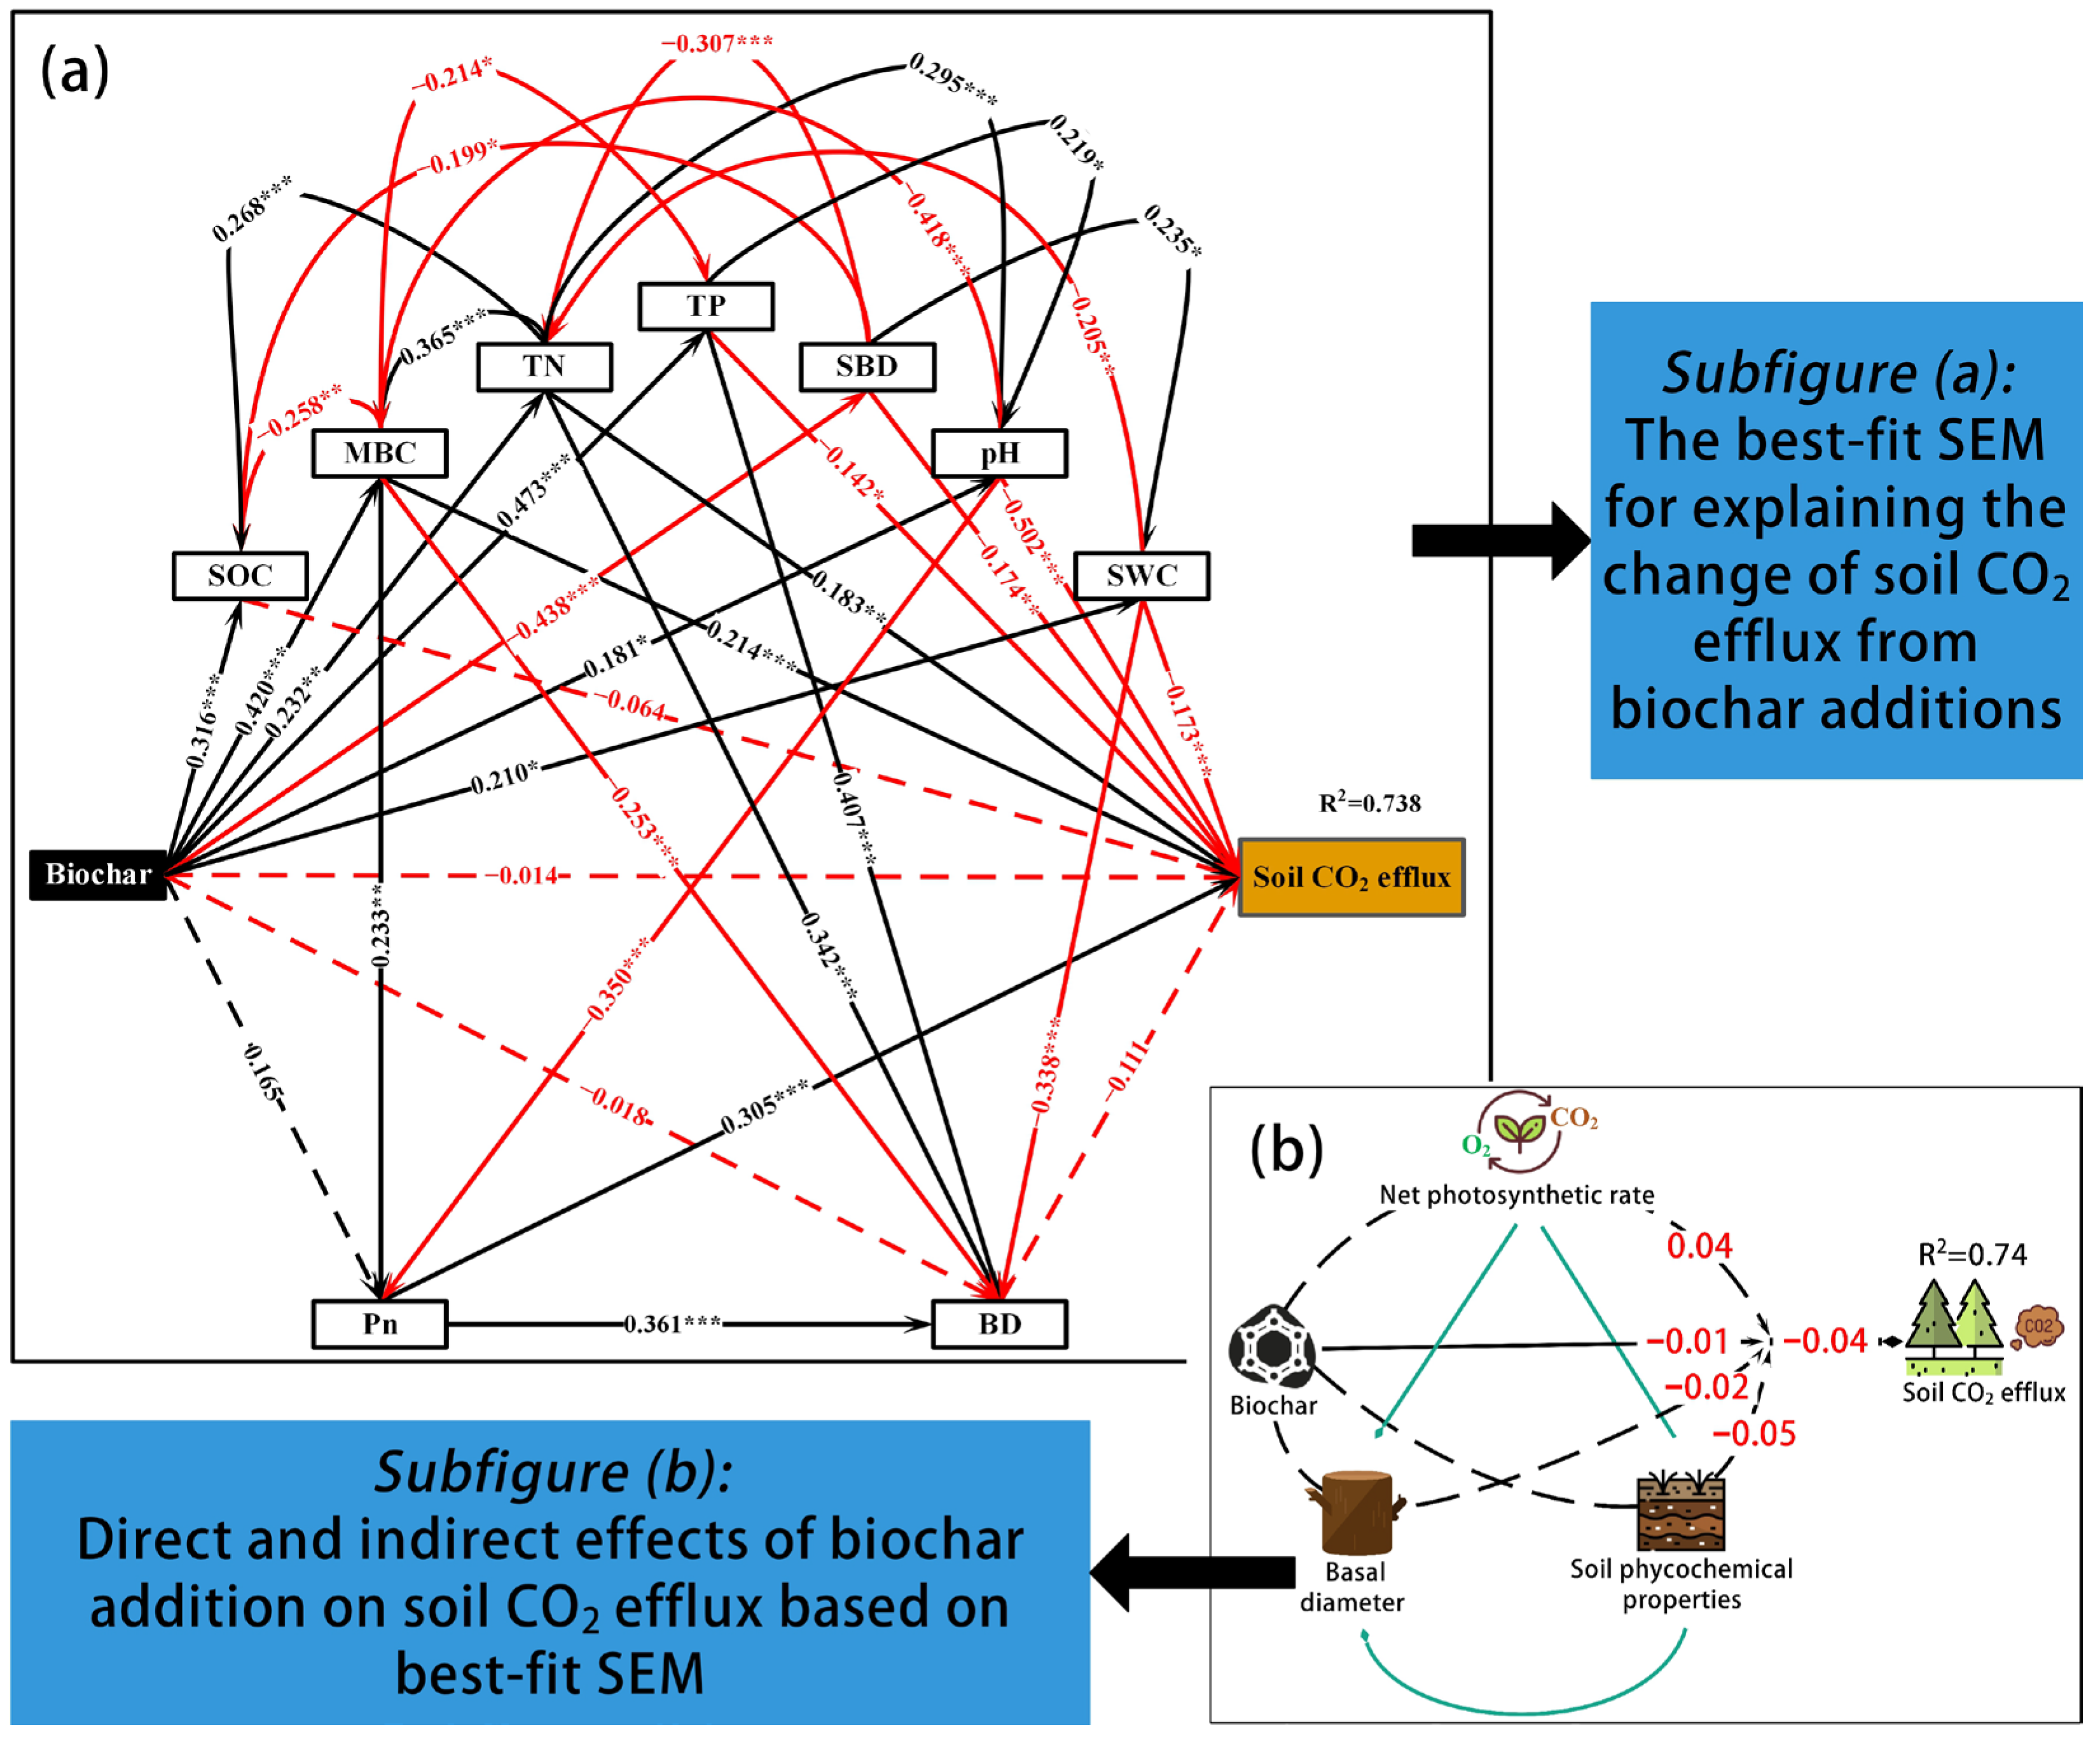
3.4. Direct and Indirect Effects of Biochar Addition on Soil CO2 Efflux

The results of stepwise multivariate regression showed that model interpretation reached the highest level after excluding plant height and crown area (R2 = 0.75; p < 0.001) (Table S2). Subsequently, the logical relationship among variables in the SEM was adjusted based on the results of the bivariate linear regression (Table S3). As DOC showed no significant relationship with soil CO2 efflux rate and biochar additions, it was subsequently excluded (R2 < 0.01, p > 0.05). Finally, biochar addition amount and soil CO2 efflux rate were assigned as the exogenous variable and dependent variable, respectively, while soil water content, soil bulk density, MBC, SOC, pH, TP, TN, net photosynthesis rate, and basal diameter were considered the mediating variables (Figure 4a). Following the recommendations of Li et al. [60], the optimal or best-fit model was constructed (χ2/df = 1.58, RMSEA = 0.07, NFI = 0.95, TLI = 0.94, CFI = 0.98, SRMR = 0.05) (Figure 4a), explaining 73.8% of the variation in soil CO2 efflux rate.
The SEM results indicated that the biochar addition had no significant direct effect on soil CO2 efflux (p > 0.05). However, it had significant direct positive effects on soil water content, SOC, MBC, soil total nitrogen, total phosphorus, and pH (p < 0.05), while significantly negatively affecting soil bulk density (p < 0.05) (Figure 4a). Soil total nitrogen, MBC, and net photosynthetic rate had significant direct positive effects on soil CO2 efflux (p < 0.05), while soil bulk density, total phosphorus, water content, and pH showed an opposite pattern (p < 0.001) (Figure 4a).
The direct contribution of biochar addition to soil CO2 efflux was low (−0.01), but it indirectly and positively affected soil CO2 efflux via soil total nitrogen (0.06), MBC (0.08), soil bulk density (0.08) and net photosynthetic rate (0.04), while indirectly negatively affected via SOC (−0.03), soil total phosphorus (−0.06), pH (−0.18) and basal diameter growth (−0.02). Among the positive and indirect pathways, MBC (0.08) and soil bulk density (0.08) had stronger effects than other pathways. Compared with other negative and indirect pathways, pH (−0.18) and soil total phosphorus (−0.06) had greater effects. Overall, the contributions of biochar addition to soil CO2 efflux via soil physicochemical properties, plant photosynthesis and growth traits were −0.05, 0.04 and −0.02, respectively (Figure 4b). The positive and negative effects of these factors cancelled each other, resulting in minimal impact, and even a reduction, with regard to soil CO2 efflux (−0.04) (Figure 4b).
Figure 4. Structural equation modeling with corresponding effect structure diagram. (a) The best-fit SEM for explaining the change in soil CO2 efflux from biochar additions. Regression coefficients are denoted by values near one-sided arrows. Positive and negative path coefficients are depicted with black and red lines, respectively. Solid and dashed lines indicate the significant and non-significant paths, respectively. SWC, SBD, MBC, SOC, TN, TP, Pn, and BD are abbreviations of soil water content, soil bulk density, microbial biomass carbon, soil organic carbon, total nitrogen, total phosphorus, photosynthetic rate, and basal diameter, respectively. * p < 0.05; ** p < 0.01; *** p < 0.001; (b) Direct and indirect effects of biochar addition on soil CO2 efflux based on best-fit SEM. The effect sizes for each component have been labeled on the black lines. Red numbers indicate specific effect sizes. Solid and dashed lines indicate direct and indirect effects, respectively. Blue lines indicate interactions between net photosynthetic rate, basal diameter, and soil physicochemical properties.
Forests 15 00917 g004

4. Discussion

4.1. Differential Responses of SOC, MBC, and DOC to Biochar Addition

It is well known that the application of biochar to soil alters soil properties. Our results suggest that the biochar addition increased the SOC content. This effect primarily arises from the characteristics of biochar itself, which is thought to be an inert and carbon-rich aromatic organic substance with high stability and resistance to biochemical degradation [61]. Upon introduction into the soil, biochar rapidly elevates the soil’s organic carbon content. Moreover, its porous structure facilitates the adsorption of soil organic carbon, forming stable complexes [62]. It also accelerates the formation of micro-agglomerates in the soil through organic–mineral interactions, resulting in a stable accumulation of SOC in the soil [63,64]. This adsorption and protective effect of biochar hinder and weaken the microbial decomposition of organic carbon, thereby facilitating the accumulation of organic carbon in the soil [29]. The overall increase in SOC may be attributed to the growth and development of artificial forests. Since the accumulation of soil organic carbon depends on the balance between the input of exogenous organic carbon from litter and root exudates and the consumption of organic carbon by soil microorganisms [53], the quantity of litter and root exudates provided by artificial forests increases with the growth of these forests, leading to an increase in SOC. Additionally, the increase in soil organic carbon content contributes to the enhancement of soil structure maintenance and the promotion of soil aggregate stability, thereby effectively improving soil hydraulics and nutrient conditions. Consequently, a favourable soil environment facilitates more efficient plant growth and photosynthetic capacity [65].
Our results suggest that the addition of biochar increased the MBC content. This is because the abundant pore space of biochar aids microorganisms in resisting desiccation and predation stress, and meets their carbon, mineral nutrient, and energy requirements [66]. More specifically, biochar’s pore structure and surface area provide potential habitats for various microorganisms, enhancing moisture availability and microbial resistance to environmental stress [67,68]. As biochar enhances the availability of mineral elements and nutrients in soil, it promotes microbial proliferation [69]. Soil microorganisms can promote plant growth and productivity through modulation of phytohormone signalling, competitive exclusion of pathogenic microbial strains, and augmentation of soil nutrient bioavailability [70]. The improvement in microbial habitat and nutrient utilization capacity led to the increase in MBC content. However, despite the fact that the MBC content in the plantation soil after biochar addition in our experiment was generally low, it was still within a reasonable range. A recent study also showed similar results that MBC content ranges from 161.66 to 1500 mg/kg in the subtropical monsoon climate zone [71]. The low apomictic volume of the young plantation forests may be the reason for the low MBC content [72]. Our results also found that MBC content fluctuated seasonally. This may be related to temperature changes, as inter-seasonal temperature fluctuations significantly affect the quantity of vegetation biomass and litter, thus affecting microbial energy sources [73]. Another potential reason is that soil temperature is an important limiting factor for the growth and development of soil microorganisms [74]. Relatively abundant litter and higher temperatures in summer and autumn promote soil microbial development, resulting in higher MBC content. Similar results were also found in the study by Babur et al. [50]. They found that MBC content was highest in the autumn season because of the optimal conditions for soil moisture, temperature, and organic carbon sources at this time. Conversely, the reduction in these environmental factors leads to the lowest content in the winter.
In contrast, DOC content showed no significant response to the addition of biochar. This is because biochar itself is thought to be an inert carbon with strong degradation resistance, limiting its contribution to soil-dissolved organic carbon content [75]. Additionally, soil DOC belongs to the active carbon pool with a higher turnover rate, and biochar has limited adsorption capacity for it. Considering that adsorption and desorption processes may reach equilibrium in a short period, biochar’s impact on soil-dissolved organic carbon is negligible [76]. Our results also showed that DOC exhibits distinct seasonal dynamics, inversely correlated with soil microbial carbon, as it serves as a direct food source for microorganisms, whose activities require DOC consumption [55].

4.2. Plant Growth and Photosynthetic Productivity Is Influenced by Biochar Additions Species Type and Season

Our results showed that biochar addition did not influence the annual growth of tree height and crown area but did enhance basal diameter. These results align with experiments conducted by Palviainen et al. [77] in young Scots pine forests in southern Finland, suggesting that biochar may have a greater impact on basal diameter than on tree height growth. It has been suggested that ethylene emissions from biochar without ethylene removed, once introduced into the soil, may stimulate this differential growth pattern in plants [78]. Additionally, George et al. [79] observed that plants fertilized with pyrochar (biochar from high-temperature pyrolysis) tended to allocate more biomass to structural organs such as trunks and thick roots, possibly as a morphological adaptation to nutrient and water scarcity. This differential growth pattern could also be attributed to differences in biomass allocation strategies among young plantations, as well as the ameliorative effects of biochar on the growth environment, which are species-dependent [80]. Zhang et al. [81] found that young forests allocate more biomass to the trunk than to roots and branches, because woody plants in young forests prioritize stem biomass increment as a response to allometric growth constraints and environmental risks [82]. In this situation, the biomass of young plantations is preferentially allocated to the trunk, leading to faster growth in plant basal diameter relative to crown width and tree height. Furthermore, the growth-promoting effect of biochar addition on plant growth was more pronounced in P. amabilis compared to the other two species in pure plantations. This is because the former are species that adopt a more aggressive growth strategy, whereas C. subkiangensis and P. chekiangensis are shade-tolerant and slow-growing species that employ a conservative growth strategy. This observation is consistent with the findings of Konopka et al. [83], who reported that biomass allocation patterns and growth efficiency differ between broadleaf species and conifers. As a conifer species, P. amabilis exhibits markedly superior growth rates compared to the other two broadleaf species, thereby amplifying the growth-promoting impact of biochar.
Biochar addition promoted the net photosynthetic rate, suggesting that incorporating biochar into soil is an effective strategy for increasing carbon sequestration through photosynthesis in forests. This enhancement may be attributed to several factors, including improvements in soil nutrient status and enhancement of leaf stomatal conductance, leaf area mass, and leaf nutrients [84]. Additionally, biochar may promote photosynthetic physiology; for instance, studies have demonstrated that biochar can enhance the effective photochemical quantum yield of the PS-II system and reduce thermal fluorescence yield, leading to an increase in the photosynthetic rate [85].
However, the effects of biochar on plant growth and photosynthetic productivity in young plantations are influenced by factors such as concentration, species type, and seasons. Seasonal changes, such as variations in light, temperature, and moisture, can significantly impact photosynthetic rates [86]. Furthermore, fluctuations in temperature and moisture due to seasonal shifts can lead to considerable variations in productivity within plantation forest ecosystems, affecting the growth and development rates of forests [78]. Consequently, significant changes in the growth and productivity of young plantation forests are observed between seasons. Moreover, the effects of biochar on plant growth and productivity vary considerably among young forests due to species differences. Different species exhibit distinct strategies for photosynthetic production [87], as species-specific differences play a crucial role in determining plant growth and photosynthetic productivity. Varied photosynthetic strategies and distinct photosynthetic structures among different species contribute to the significant disparities in plant growth traits and photosynthetic productivity [88]. Our results found that biochar promotes plant growth under moderate addition but may limit growth under excessive addition. It has been suggested that biochar leachate carries inherent phytotoxicity [89], which is more pronounced at high concentrations [90]. For instance, our results demonstrate that the basal diameter, tree height, and crown area of P. chekiangensis were significantly higher at a 5 t/ha biochar addition concentration than at 10 t/ha (Figure 3). However, the influence of biochar addition concentration on plant growth and photosynthetic productivity is relatively small compared to other factors. This is because biochar, as a soil amendment, has a limited impact on certain plant life activities, such as water and nutrient absorption by the root system, and does not play a decisive role in the overall process of natural plant growth and development. Conversely, key ecological factors related to plant life activities, such as light, temperature and humidity changed with the seasons, while genetic differences between species primarily determine differences in growth and nutrient utilization strategies. Therefore, these factors have a greater impact on plant growth and photosynthetic productivity than the amount of biochar added.
Further analysis indicates that the effects of biochar addition on plant growth and photosynthetic productivity may be counterbalanced by seasonal and species-related effects. Biochar addition reduces seasonal and inter-species variation in plant growth and productivity by improving limiting environmental factors for plant growth. For example, the main limiting environmental factors that slow plant growth in subtropical regions during winter are temperature and moisture. However, when biochar is added to soil, it can enhance soil water holding capacity and increase water content available to plant absorption [91]. Additionally, the soil’s heat storage capacity improves, thereby reducing damage to plants at low temperatures [92]. That is, biochar addition mitigates differences in plant growth and photosynthetic productivity between seasons by improving limiting environmental factors. Depending on resource utilization and growth rate (fast or slow), plants can be classified as conservative species (slow-growing) or aggressive species (fast-growing). In young forests, affected by infertile soil, conservative species exhibit slower growth and lower photosynthetic productivity due to their conservative resource use. However, the improvement in soil conditions through biochar addition can partially improve the growth rate and photosynthetic productivity of conservative species [93]. Consequently, the disparities in plant growth traits and photosynthetic productivity resulting from genetic differences among species have been reduced.

4.3. Biochar Addition Did Not Promote Soil CO2 Efflux while Increased Whole System Carbon Storage in Young Sub-Tropical Plantations

Our measured annual cumulative soil CO2 efflux (755.44 ± 52.55 g C·m−2·year−1~949.67 ± 57.56 g C·m−2·year−1) was consistent with previous studies about subtropical young forests. For example, Wang et al. [94] used artificial control experiments to indicate the annual cumulative soil CO2 efflux of subtropical young forest was about 655 g C·m−2·year−1. Song et al. [95] also concluded that the annual cumulative soil CO2 efflux in subtropical artificial Chinese fir forest was 760 g C·m−2·year−1. Similar observations suggest that our determination is reasonable.
The SEM results showed that biochar addition did not directly affect soil CO2 efflux, but it could indirectly affect it via plant growth, photosynthetic productivity, and soil physicochemical properties. Numerous studies have shown that biochar can improve soil conditions, such as aeration and water content, through its adsorption and high porosity advantages, thereby enhancing plant root respiration [96]. However, our SEM results showed that biochar had a weak negative effect on soil CO2 efflux via plant growth, especially basal diameter (−0.02) (Figure 4). This may be because biochar greatly enhances the water holding capacity of the soil. It is known that most of the CO2 produced by plant root respiration will dissolve in soil water to form relatively stable carbonic acid, and then combine with other mineral elements to form more stable compounds [97]. In other words, most of the CO2 produced by root respiration has been immobilized in the soil and has no significant impact on soil CO2 efflux.
The indirect effect of biochar on soil CO2 efflux via photosynthetic productivity may be due to the high sensitivity of plant roots to biochar addition. The soil environmental conditions for root growth were improved by biochar addition, resulting in enhanced water and nutrient transport capacity from soil to plants, thus increasing photosynthetic productivity [98]. After that, more photosynthetic products were allocated to the root system [99], resulting in increased soil CO2 efflux due to increased respiratory metabolism and root biomass. In addition, the increase in root exudates and litter caused by the increase in photosynthetic productivity also has a “stimulating effect” on the decomposition of soil organic carbon, resulting in an increase in soil CO2 efflux [100,101]. Our SEM results can verify that the net photosynthetic rate had a higher path coefficient on soil CO2 efflux (R2 = 0.22, p < 0.01) and showed a positive effect (0.04) (Figure 4).
The indirect effects of biochar addition on soil CO2 efflux via photosynthetic productivity and plant growth can be attributed to its effects on soil water and nutrients. Owing to its abundant pores and large specific surface area, biochar can greatly improve soil bulk density and enhance soil aeration. The improvement in soil total porosity will enhance the decomposition of soil organic macroaggregates [102]. Our SEM results also confirmed that biochar had a positive indirect effect on soil CO2 efflux via soil bulk density. The negative indirect effect of biochar on soil CO2 efflux via soil water content may be the result of the response of soil gas diffusion capacity and soil microbial activity to soil water content change. An increase in soil water content reduced the soil oxygen concentration, which in turn indirectly inhibited soil CO2 efflux by inhibiting the activity of aerobic microorganisms [103]. The alkaline biochar causes the H+ in the soil to be gradually replaced by salt ions, while the aromatic functional groups on its surface adsorb some of the H+ in the soil solution, ultimately leading to a decrease in the H+ concentration and an increase in pH. The results of the study also showed that although there was not much difference in soil pH between the control group (4.3) and 10 t/ha biochar-treated group (4.46); the soil H+ concentration of the latter group was reduced by almost 30% compared to that of the former group after conversion to ionic concentration. Therefore, it is reasonable to assume that the increase in bicarbonate due to the increase in soil pH may be a reason for the decrease in soil carbon emissions [96].
As an important part of soil CO2 efflux, soil microbial respiration is also affected by biochar addition. This is because the optimization of the habitat environment of soil microorganisms by the biochar addition improves their quantity and activity, which leads to enhanced soil CO2 efflux [66]. This can be confirmed by our SEM results which showed that biochar contributes indirectly to a positive increase in soil CO2 efflux through MBC. However, our results indicate that soil carbon emissions did not show a significant increase, which may be due to the fact that biochar improves the soil environment and triggers changes in the microbial community structure, which ultimately leads to an increase in the efficiency of soil microbes in utilizing the carbon source, i.e., more carbon is used for the microorganisms’ own growth instead of being emitted to the atmosphere in the form of respiration [104]. In addition, the increase in soil water content due to biochar enhances the ability of soil pore water to absorb CO2, allowing more CO2 to dissolve in water to form carbonic acid and ultimately more stable carbonates [105]. At the same time, the entry of biochar inevitably increases the content of soil organic carbon, promotes the formation of soil aggregates, and makes the organic carbon in it more difficult to decompose by oxidation. This ecological process will cause freer CO2 to be captured and fixed in the form of relatively stable organic carbon, which will weaken soil CO2 efflux [30].
Nitrogen and phosphorus are considered to be the most important limiting ecological factors in subtropical forest systems. Our results show that biochar addition has a weak negative indirect effect on soil CO2 efflux via soil total phosphorus. This may be related to the sharp decline in phosphorus availability in acidic environments [106]. Although biochar can enrich soil phosphorus through electrostatic attraction, ion exchange, and complex and chemical precipitation [107], phosphorus leaching is intensified due to increased soil permeability. These two processes cancel each other out, which may lead to a weak negative effect of total phosphorus on soil CO2 efflux. In addition, we found that biochar has a positive indirect effect on soil CO2 efflux via soil total nitrogen. This may be because the increase in nitrogen content improves the carboxylation efficiency and photosynthesis, allowing more carbon to be allocated to the underground parts of the plants and stimulating root respiration. At the same time, the rise in nitrogen content increases soil CO2 efflux due to inducing microbial decomposition by changing the proportion of C:N in litter [108].
Our results show that biochar addition increases carbon storage in plantation ecosystems. This improvement is mainly carried out in three aspects. The first is that the biochar addition is conducive to tree trunk growth (basal diameter) (Figure 3 and Table 2), thereby increasing the aboveground carbon storage [18,98]. The second is that biochar addition increases soil carbon storage, mainly because it promotes photosynthetic productivity, which then leads to more carbon input by plants into the soil through the increased metabolic turnover (such as litter and root secretions) caused by the increase in biomass [109]. This can be confirmed by the data in this study. The differences in soil carbon among three biochar addition concentrations were investigated and it was found that SOC and MBC all increased significantly with the addition gradient (Table S1). The photosynthetic rate was positively correlated with MBC and DOC; additionally, basal diameter was positively correlated with SOC and DOC (Figure S3). Notably, SOC was significantly negatively correlated with net photosynthetic rate. This may be due to the priming effect of photosynthesis on the plant root system leading to increased decomposition of SOC [110]. The third aspect is that biochar itself is a stable and inert carbon, and its introduction into the soil increases carbon storage [14]. These results suggest that the application of biochar to soil is an effective way to enhance aboveground carbon storage and soil carbon storage in young subtropical plantations.

5. Conclusions

Our results show that the addition of biochar to young plantations had not significantly altered the soil CO2 efflux of the entire ecosystem. This was attributed to the varied influence of biochar on plant growth traits, photosynthetic productivity, and various soil physicochemical factors, resulting in mutual offsetting effects that led to no significant change in soil CO2 efflux. However, as an exogenous source of carbon, biochar addition increased soil inert carbon storage. It also enhanced aboveground carbon storage, and indirectly introduced more carbons, such as SOC and MBC, into the soil by increasing photosynthetically sequestered carbon and metabolic turnover. Consequently, biochar application ultimately increased carbon storage in the entire forest ecosystem.
Our results suggested that adding biochar to soils can be a feasible approach to increase subtropical forest carbon sink and mitigate global climate change. But, as a byproduct of biomass pyrolysis, biochar properties are greatly affected by pyrolysis conditions. The shift in properties may lead to different impacts on ecosystem carbon dynamics. In our experiment, some basic properties of biochar, such as volatile matter, non-volatile matter, ash %, bulk density, and water content, were not determined, which may, to some extent, limit our in-depth exploration of the potential mechanism of biochar affecting carbon dynamics in forest ecosystems. Meanwhile, biochar from different biomass sources has different impacts on soil CO2 efflux due to different physicochemical properties. In addition, the effect of biochar on soil CO2 efflux is influenced by the concentration of addition and species composition in the forest. We only set up three biochar additive amounts, and we have reason to believe that setting up more biochar additive amounts, as well as appropriately increasing the amount of biochar added, will be more adequate and comprehensive to explore the effects of biochar on the carbon cycle in forest ecosystems. In order to accurately reveal the role of biochar in mitigating soil CO2 efflux, we recommend setting richer biochar additive levels and providing more detailed data on biochar traits in future experiments, as well as conducting related studies in different forest ecosystems.

Supplementary Materials

The following supporting information can be downloaded at: https://www.mdpi.com/article/10.3390/f15060917/s1, Figure S1: Location of the study area; Figure S2: Schematic distribution of experimental quadrats; Figure S3: Effects of plant basal diameter and net photosynthetic rate on soil organic carbon (SOC), microbial biomass carbon (MBC) and dissolved organic carbon (DOC) contents; Table S1: Differences in soil physicochemical properties among three biochar additions in young plantations. Different capital letters indicate significant differences in soil physicochemical properties at different biochar additions, while same letters indicate non-significant. Introduction of abbreviations are shown in Table S1. Differences in soil physicochemical properties among three biochar additions in young plantations. Different capital letters indicate significant differences in soil physicochemical properties at different biochar additions, while same letters indicate non-significant. Introduction of abbreviations are shown in Table S1. Mean ± SE; Table S2: Stepwise multivariate regression of soil respiration rate (μmol CO2·m−2·s−1) with the various predictor variables. Predictor variables includes soil water content (volumetric moisture content; SWC %), soil pH, bulk density (SBD; g/cm3), microbial biomass carbon (MBC; mg/kg), soil organic carbon (SOC; g/kg), dissolved organic carbon (DOC; mg/kg), total nitrogen (TN; mg/kg), total phosphorus (TP; mg/kg), photosynthetic rate (Pn; μmol·m−2·s−1), basal diameter (mm), tree height (cm), and crown area (cm2). The final predictor variables are used as the mediator variable in the structural equation model (SEM), while biochar addition and soil respiration rate are exogenous and response variables, respectively; Table S3: Bivariate linear regression of response variables with exogenous and mediating variables. Introduction of abbreviations are shown in Table S2.

Author Contributions

Conceptualization, X.Y.; methodology, N.S. and S.L.; software, N.S. and Y.T.; validation, S.L. and B.S.; formal analysis, N.S., S.L. and B.S.; investigation, X.L., L.S. and S.L.; resources, X.Y.; data curation, N.S., S.L. and Y.G.; writing—original draft preparation, N.S.; writing—review and editing, B.S., Y.T., L.S., Y.G. and X.L.; visualization, Y.T., L.S. and N.S.; supervision, X.Y.; project administration, X.Y.; funding acquisition, X.Y. All authors have read and agreed to the published version of the manuscript.

Funding

This work was supported by the National Natural Science Foundation of China (Grant Nos. 42371027), and the Ningbo Natural Science Foundation (Grant No. 2022Z189).

Data Availability Statement

The datasets used or analyzed during the current study are available from the corresponding author upon reasonable request.

Acknowledgments

The authors sincerely thank Binoy Sarkar for his constructive suggestions.

Conflicts of Interest

The authors declare that they have no conflicts of interest.

References

  1. Lehmann, J.; Cowie, A.; Masiello, C.A.; Kammann, C.; Woolf, D.; Amonette, J.E.; Cayuela, M.L.; Camps-Arbestain, M.; Whitman, T. Biochar in climate change mitigation. Nat. Geosci. 2021, 14, 883–892. [Google Scholar] [CrossRef]
  2. Ali, J.; Faridi, S.; Sardar, M. Carbonic anhydrase as a tool to mitigate global warming. Environ. Sci. Pollut. Res. 2023, 30, 83093–83112. [Google Scholar] [CrossRef] [PubMed]
  3. Wang, Q.; Yuan, J.; Yang, X.; Han, X.; Lan, Y.; Cao, D.; Sun, Q.; Cui, X.; Meng, J.; Chen, W. Responses of soil respiration and C sequestration efficiency to biochar amendment in maize field of Northeast China. Soil Tillage Res. 2022, 223, 105442. [Google Scholar] [CrossRef]
  4. Al-qaness, M.A.A.; Ewees, A.A.; Thanh, H.V.; AlRassas, A.M.; Dahou, A.; Elaziz, M.A. Predicting CO2 trapping in deep saline aquifers using optimized long short-term memory. Environ. Sci. Pollut. Res. 2023, 30, 33780–33794. [Google Scholar] [CrossRef] [PubMed]
  5. Ellis, E.A.; Montero, S.A.; Hernández Gómez, I.U.; Romero Montero, J.A.; Ellis, P.W.; Rodríguez-Ward, D.; Blanco Reyes, P.; Putz, F.E. Reduced-impact logging practices reduce forest disturbance and carbon emissions in community managed forests on the Yucatán Peninsula, Mexico. For. Ecol. Manag. 2019, 437, 396–410. [Google Scholar] [CrossRef]
  6. Tao, F.; Huang, Y.; Hungate, B.A.; Manzoni, S.; Frey, S.D.; Schmidt, M.W.I.; Reichstein, M.; Carvalhais, N.; Ciais, P.; Jiang, L.; et al. Microbial carbon use efficiency promotes global soil carbon storage. Nature 2023, 618, 981–985. [Google Scholar] [CrossRef] [PubMed]
  7. Biffi, S.; Chapman, P.J.; Grayson, R.P.; Ziv, G. Planting hedgerows: Biomass carbon sequestration and contribution towards net-zero targets. Sci. Total Environ. 2023, 892, 164482. [Google Scholar] [CrossRef] [PubMed]
  8. Boyero, L.; Pearson, R.G.; Gessner, M.O.; Barmuta, L.A.; Ferreira, V.; Graça, M.A.S.; Dudgeon, D.; Boulton, A.J.; Callisto, M.; Chauvet, E.; et al. A global experiment suggests climate warming will not accelerate litter decomposition in streams but might reduce carbon sequestration. Ecol. Lett. 2011, 14, 289–294. [Google Scholar] [CrossRef] [PubMed]
  9. Mills, M.B.; Malhi, Y.; Ewers, R.M.; Kho, L.K.; Teh, Y.A.; Both, S.; Burslem, D.F.R.P.; Majalap, N.; Nilus, R.; Huaraca Huasco, W.; et al. Tropical forests post-logging are a persistent net carbon source to the atmosphere. Proc. Natl. Acad. Sci. USA 2023, 120, e2214462120. [Google Scholar] [CrossRef] [PubMed]
  10. Xiang, D.; Wang, G.; Tian, J.; Li, W. Global patterns and edaphic-climatic controls of soil carbon decomposition kinetics predicted from incubation experiments. Nat. Commun. 2023, 14, 2171. [Google Scholar] [CrossRef] [PubMed]
  11. Chagas, J.K.M.; Figueiredo, C.C.d.; Ramos, M.L.G. Biochar increases soil carbon pools: Evidence from a global meta-analysis. J. Environ. Manag. 2022, 305, 114403. [Google Scholar] [CrossRef] [PubMed]
  12. Simmons, A.T.; Cowie, A.L.; Waters, C.M. Pyrolysis of invasive woody vegetation for energy and biochar has climate change mitigation potential. Sci. Total Environ. 2021, 770, 145278. [Google Scholar] [CrossRef] [PubMed]
  13. Woolf, D.; Amonette, J.E.; Street-Perrott, F.A.; Lehmann, J.; Joseph, S. Sustainable biochar to mitigate global climate change. Nat. Commun. 2010, 1, 56. [Google Scholar] [CrossRef] [PubMed]
  14. Lehmann, J.; Joseph, S. Biochar for Environmental Management: Science, Technology and Implementation; Routledge: London, UK, 2015; pp. 89–110. [Google Scholar]
  15. Chen, G.; Ma, Y.; Xu, W.; Chen, Z.; Li, Z.; Zhou, J.; Yu, W. Remediation of cadmium-contaminated soil by micro-nano nitrogen-doped biochar and its mechanisms. Environ. Sci. Pollut. Res. 2023, 30, 48078–48087. [Google Scholar] [CrossRef]
  16. Dissanayake, D.K.R.P.L.; Dissanayaka, D.M.N.S.; Udumann, S.S.; Nuwarapaksha, T.D.; Atapattu, A.J.; Dissanayake, D.K.R.P.L.; Dissanayaka, D.M.N.S.; Udumann, S.S.; Nuwarapaksha, T.D.; Atapattu, A.J. Is biochar a promising soil amendment to enhance perennial crop yield and soil quality in the tropics? Technol. Agron. 2023, 3, 4. [Google Scholar] [CrossRef]
  17. Mandal, S.; Sarkar, B.; Bolan, N.; Novak, J.; Ok, Y.S.; Van Zwieten, L.; Singh, B.P.; Kirkham, M.B.; Choppala, G.; Spokas, K.; et al. Designing advanced biochar products for maximizing greenhouse gas mitigation potential. Crit. Rev. Environ. Sci. Technol. 2016, 46, 1367–1401. [Google Scholar] [CrossRef]
  18. Wei, B.; Peng, Y.; Lin, L.; Zhang, D.; Ma, L.; Jiang, L.; Li, Y.; He, T.; Wang, Z. Drivers of biochar-mediated improvement of soil water retention capacity based on soil texture: A meta-analysis. Geoderma 2023, 437, 116591. [Google Scholar] [CrossRef]
  19. Zhao, P.; Yu, J.; Zhang, X.; Ren, Z.; Li, M.; Han, S. Trifolium repens and biochar addition affecting soil nutrients and bacteria community. Environ. Sci. Pollut. Res. 2023, 30, 33927–33941. [Google Scholar] [CrossRef] [PubMed]
  20. Ali, S.; Rizwan, M.; Qayyum, M.F.; Ok, Y.S.; Ibrahim, M.; Riaz, M.; Arif, M.S.; Hafeez, F.; Al-Wabel, M.I.; Shahzad, A.N. Biochar soil amendment on alleviation of drought and salt stress in plants: A critical review. Environ. Sci. Pollut. Res. 2017, 24, 12700–12712. [Google Scholar] [CrossRef] [PubMed]
  21. Diacono, M.; Montemurro, F. Long-Term Effects of Organic Amendments on Soil Fertility. In Sustainable Agriculture Volume 2; Springer: Dordrecht, The Netherlands, 2011; pp. 761–786. [Google Scholar]
  22. Bakhshandeh, E.; Gholamhosseini, M.; Yaghoubian, Y.; Pirdashti, H. Plant growth promoting microorganisms can improve germination, seedling growth and potassium uptake of soybean under drought and salt stress. Plant Growth Regul. 2020, 90, 123–136. [Google Scholar] [CrossRef]
  23. Johnson, M.S.; Webster, C.; Jassal, R.S.; Hawthorne, I.; Black, T.A. Biochar influences on soil CO2 and CH4 fluxes in response to wetting and drying cycles for a forest soil. Sci. Rep. 2017, 7, 6780. [Google Scholar] [CrossRef] [PubMed]
  24. Zhou, G.; Zhou, X.; Zhang, T.; Du, Z.; He, Y.; Wang, X.; Shao, J.; Cao, Y.; Xue, S.; Wang, H.; et al. Biochar increased soil respiration in temperate forests but had no effects in subtropical forests. For. Ecol. Manag. 2017, 405, 339–349. [Google Scholar] [CrossRef]
  25. Tao, B.; Chen, Q.; Jiang, Y.; Zhang, B.; Yuan, H.; Wang, Y. Effect of particle sizes of biochar on CO2 emissions in a poplar plantation of ancient Yellow River channel, China. J. Environ. Manag. 2023, 345, 118721. [Google Scholar] [CrossRef] [PubMed]
  26. Grau-Andrés, R.; Pingree, M.R.A.; Öquist, M.G.; Wardle, D.A.; Nilsson, M.-C.; Gundale, M.J. Biochar increases tree biomass in a managed boreal forest, but does not alter N2O, CH4, and CO2 emissions. GCB Bioenergy 2021, 13, 1329–1342. [Google Scholar] [CrossRef]
  27. Cui, J.; Glatzel, S.; Bruckman, V.J.; Wang, B.; Lai, D.Y.F. Long-term effects of biochar application on greenhouse gas production and microbial community in temperate forest soils under increasing temperature. Sci. Total Environ. 2021, 767, 145021. [Google Scholar] [CrossRef] [PubMed]
  28. Sarauer, J.L.; Page-Dumroese, D.S.; Coleman, M.D. Soil greenhouse gas, carbon content, and tree growth response to biochar amendment in western United States forests. GCB Bioenergy 2019, 11, 660–671. [Google Scholar] [CrossRef]
  29. Gogoi, L.; Narzari, R.; Gogoi, N.; Borkotoki, B.; Kataki, R. Effect of Biochar on Soil Respiration from a Semi-evergreen, Moist Deciduous Forest Soil. Int. J. Geosynth. Ground Eng. 2020, 6, 26. [Google Scholar] [CrossRef]
  30. Zhang, R.; Qu, Z.; Liu, L.; Yang, W.; Wang, L.; Li, J.; Zhang, D. Soil Respiration and Organic Carbon Response to Biochar and Their Influencing Factors. Atmosphere 2022, 13, 2038. [Google Scholar] [CrossRef]
  31. Vannini, A.; Carbognani, M.; Chiari, G.; Forte, T.a.G.W.; Rodolfi, M.; Ganino, T.; Petraglia, A. Biochar effects on early decomposition of standard litter in a European beech forest (northern Italy). Sci. Total Environ. 2023, 903, 166224. [Google Scholar] [CrossRef] [PubMed]
  32. Wu, Q.; Lian, R.; Bai, M.; Bao, J.; Liu, Y.; Li, S.; Liang, C.; Qin, H.; Chen, J.; Xu, Q. Biochar co-application mitigated the stimulation of organic amendments on soil respiration by decreasing microbial activities in an infertile soil. Biol. Fertil. Soils 2021, 57, 793–807. [Google Scholar] [CrossRef]
  33. Li, Y.; Li, Y.; Chang, S.X.; Yang, Y.; Fu, S.; Jiang, P.; Luo, Y.; Yang, M.; Chen, Z.; Hu, S.; et al. Biochar reduces soil heterotrophic respiration in a subtropical plantation through increasing soil organic carbon recalcitrancy and decreasing carbon-degrading microbial activity. Soil Biol. Biochem. 2018, 122, 173–185. [Google Scholar] [CrossRef]
  34. Prendergast-Miller, M.T.; Duvall, M.; Sohi, S.P. Biochar–root interactions are mediated by biochar nutrient content and impacts on soil nutrient availability. Eur. J. Soil Sci. 2014, 65, 173–185. [Google Scholar] [CrossRef]
  35. Bhattacharyya, P.; Roy, K.S.; Neogi, S.; Manna, M.C.; Adhya, T.K.; Rao, K.S.; Nayak, A.K. Influence of elevated carbon dioxide and temperature on belowground carbon allocation and enzyme activities in tropical flooded soil planted with rice. Environ. Monit. Assess. 2013, 185, 8659–8671. [Google Scholar] [CrossRef] [PubMed]
  36. Chen, K.; Cai, Q.; Zheng, N.; Li, Y.; Lin, C.; Li, Y. Forest Carbon Sink Evaluation—An Important Contribution for Carbon Neutrality. IOP Conf. Ser. Earth Environ. Sci. 2021, 811, 012009. [Google Scholar] [CrossRef]
  37. Li, Y.; Hu, S.; Chen, J.; Müller, K.; Li, Y.; Fu, W.; Lin, Z.; Wang, H. Effects of biochar application in forest ecosystems on soil properties and greenhouse gas emissions: A review. J. Soils Sediments 2018, 18, 546–563. [Google Scholar] [CrossRef]
  38. Satdichanh, M.; Dossa, G.G.O.; Yan, K.; Tomlinson, K.W.; Barton, K.E.; Crow, S.E.; Winowiecki, L.; Vågen, T.-G.; Xu, J.; Harrison, R.D. Drivers of soil organic carbon stock during tropical forest succession. J. Ecol. 2023, 111, 1722–1734. [Google Scholar] [CrossRef]
  39. Yan, E.-R.; Wang, X.-H.; Huang, J.-J. Shifts in plant nutrient use strategies under secondary forest succession. Plant Soil 2006, 289, 187–197. [Google Scholar] [CrossRef]
  40. Lu, X.; Li, Y.; Wang, H.; Singh, B.P.; Hu, S.; Luo, Y.; Li, J.; Xiao, Y.; Cai, X.; Li, Y. Responses of soil greenhouse gas emissions to different application rates of biochar in a subtropical Chinese chestnut plantation. Agric. For. Meteorol. 2019, 271, 168–179. [Google Scholar] [CrossRef]
  41. Sun, J.; He, F.; Pan, Y.; Zhang, Z. Effects of pyrolysis temperature and residence time on physicochemical properties of different biochar types. Acta Agric. Scand. Sect. B Soil Plant Sci. 2017, 67, 12–22. [Google Scholar] [CrossRef]
  42. Wang, Y.; Zhang, Q.; Li, J.; Lin, S.; Jia, X.; Zhang, Q.; Ye, J.; Wang, H.; Wu, Z. Study on the Effect of pH on Rhizosphere Soil Fertility and the Aroma Quality of Tea Trees and Their Interactions. Agriculture 2023, 13, 1739. [Google Scholar] [CrossRef]
  43. Wang, Y.; Zhang, Q.; Li, J.; Lin, S.; Jia, X.; Zhang, Q.; Ye, J.; Wang, H.; Wu, Z. Carbon Sources Application Increase Wheat Yield and Soil Fertility. Commun. Soil Sci. Plant Anal. 2021, 52, 695–703. [Google Scholar]
  44. Li, W.; Ali, I.; Han, X.; Ullah, S.; Yang, M. Soil C, N, P, K and Enzymes Stoichiometry of an Endangered Tree Species, Parashorea chinensis of Different Stand Ages Unveiled Soil Nutrient Limitation Factors. Forests 2023, 14, 624. [Google Scholar] [CrossRef]
  45. Wang, Y.; Wang, H.; Wang, Z.-L.; Zhang, W.; Guo, C.; Wen, X.; Liu, Y. Optimizing manual sampling schedule for estimating annual soil CO2 efflux in a young exotic pine plantation in subtropical China. Eur. J. Soil Biol. 2012, 52, 41–47. [Google Scholar] [CrossRef]
  46. Niu, J.; Feng, Z.; Zhang, W.; Zhao, P.; Wang, X. Non-Stomatal Limitation to Photosynthesis in Cinnamomum camphora Seedings Exposed to Elevated O3. PLoS ONE 2014, 9, e98572. [Google Scholar] [CrossRef] [PubMed]
  47. Schulte, M.; Offer, C.; Hansen, U. Induction of CO2-gas exchange and electron transport: Comparison of dynamic and steady-state responses in Fagus sylvatica leaves. Trees 2003, 17, 153–163. [Google Scholar] [CrossRef]
  48. Pan, J.; Bai, Z.; Cao, Y.; Zhou, W.; Wang, J. Influence of soil physical properties and vegetation coverage at different slope aspects in a reclaimed dump. Environ. Sci. Pollut. Res. 2017, 24, 23953–23965. [Google Scholar] [CrossRef] [PubMed]
  49. Li, G.; Zhang, Z.; Shi, L.; Zhou, Y.; Yang, M.; Cao, J.; Wu, S.; Lei, G. Effects of Different Grazing Intensities on Soil C, N, and P in an Alpine Meadow on the Qinghai—Tibetan Plateau, China. Int. J. Environ. Res. Public Health 2018, 15, 2584. [Google Scholar] [CrossRef] [PubMed]
  50. Babur, E.; Dindaroğlu, T.; Solaiman, Z.M.; Battaglia, M.L. Microbial respiration, microbial biomass and activity are highly sensitive to forest tree species and seasonal patterns in the Eastern Mediterranean Karst Ecosystems. Sci. Total Environ. 2021, 775, 145868. [Google Scholar] [CrossRef]
  51. Wander, M. Soil Organic Matter Fractions and Their Relevance to Soil Function. Soil Organic Matter in Sustainable Agriculture; CRC Press: Boca Raton, FL, USA, 2004; pp. 67–102. [Google Scholar]
  52. Kravchenko, A.N.; Guber, A.K.; Razavi, B.S.; Koestel, J.; Quigley, M.Y.; Robertson, G.P.; Kuzyakov, Y. Microbial spatial footprint as a driver of soil carbon stabilization. Nat. Commun. 2019, 10, 3121. [Google Scholar] [CrossRef] [PubMed]
  53. Xing, G.; Wang, X.; Jiang, Y.; Yang, H.; Mai, S.; Xu, W.; Hou, E.; Huang, X.; Yang, Q.; Liu, W.; et al. Variations and influencing factors of soil organic carbon during the tropical forest succession from plantation to secondary and old–growth forest. Front. Ecol. Evol. 2023, 10, 2022. [Google Scholar] [CrossRef]
  54. Du, W.; Wang, D.; Wu, X.; Zhao, L.; Zang, S. Effects of Forest Types on SOC and DOC in the Permafrost Region of the Daxing’anling Mountains. Processes 2022, 10, 1293. [Google Scholar] [CrossRef]
  55. Yu, M.; Liang, S.; Dai, Z.; Li, Y.; Luo, Y.; Tang, C.; Xu, J. Plant material and its biochar differ in their effects on nitrogen mineralization and nitrification in a subtropical forest soil. Sci. Total Environ. 2021, 763, 143048. [Google Scholar] [CrossRef]
  56. Zhang, Q.; Song, Y.; Wu, Z.; Yan, X.; Gunina, A.; Kuzyakov, Y.; Xiong, Z. Effects of six-year biochar amendment on soil aggregation, crop growth, and nitrogen and phosphorus use efficiencies in a rice-wheat rotation. J. Clean. Prod. 2020, 242, 118435. [Google Scholar] [CrossRef]
  57. Gao, Q.; Hasselquist, N.J.; Palmroth, S.; Zheng, Z.; You, W. Short-term response of soil respiration to nitrogen fertilization in a subtropical evergreen forest. Soil Biol. Biochem. 2014, 76, 297–300. [Google Scholar] [CrossRef]
  58. Lei, L.; Xiao, W.; Zeng, L.; Liu, C.; Zhu, J.; Li, M.-H. Phenological season-dependent temperature effects on soil respiration in a subtropical Pinus massoniana forest. Agric. For. Meteorol. 2022, 323, 109086. [Google Scholar] [CrossRef]
  59. Zhang, Y.; Xiao, L.; Guan, D.; Chen, Y.; Motelica-Heino, M.; Peng, Y.; Lee, S.Y. The role of mangrove fine root production and decomposition on soil organic carbon component ratios. Ecol. Indic. 2021, 125, 107525. [Google Scholar] [CrossRef]
  60. Li, L.; Wilson, C.B.; He, H.; Zhang, X.; Zhou, F.; Schaeffer, S.M. Physical, biochemical, and microbial controls on amino sugar accumulation in soils under long-term cover cropping and no-tillage farming. Soil Biol. Biochem. 2019, 135, 369–378. [Google Scholar] [CrossRef]
  61. Lehmann, J.; Rillig, M.C.; Thies, J.; Masiello, C.A.; Hockaday, W.C.; Crowley, D. Biochar effects on soil biota—A review. Soil Biol. Biochem. 2011, 43, 1812–1836. [Google Scholar] [CrossRef]
  62. Zhang, L.; Hu, J.; Li, C.; Chen, Y.; Zheng, L.; Ding, D.; Shan, S. Synergistic mechanism of iron manganese supported biochar for arsenic remediation and enzyme activity in contaminated soil. J. Environ. Manag. 2023, 347, 119127. [Google Scholar] [CrossRef] [PubMed]
  63. Weng, Z.; Van Zwieten, L.; Singh, B.P.; Tavakkoli, E.; Joseph, S.; Macdonald, L.M.; Rose, T.J.; Rose, M.T.; Kimber, S.W.L.; Morris, S.; et al. Biochar built soil carbon over a decade by stabilizing rhizodeposits. Nat. Clim. Change 2017, 7, 371–376. [Google Scholar] [CrossRef]
  64. Zhang, Q.; Du, Z.; Lou, Y.; He, X. A one-year short-term biochar application improved carbon accumulation in large macroaggregate fractions. CATENA 2015, 127, 26–31. [Google Scholar] [CrossRef]
  65. Page, K.L.; Dang, Y.P.; Dalal, R.C. The Ability of Conservation Agriculture to Conserve Soil Organic Carbon and the Subsequent Impact on Soil Physical, Chemical, and Biological Properties and Yield. Front. Sustain. Food Syst. 2020, 4, 26–31. [Google Scholar] [CrossRef]
  66. Das, S.K.; Ghosh, G.K.; Avasthe, R.; Choudhury, B.U.; Mishra, V.K.; Kundu, M.C.; Roy, A.; Mondal, T.; Lama, A.; Dhakre, D.S. Organic nutrient sources and biochar technology on microbial biomass carbon and soil enzyme activity in maize-black gram cropping system. Biomass Convers. Biorefinery 2023, 13, 9277–9287. [Google Scholar] [CrossRef]
  67. de Sousa, R.N.; Soares, M.B.; dos Santos, F.H.; Leite, C.N.; Mendes, K.F. Interaction Mechanisms between Biochar and Herbicides. In Interactions of Biochar and Herbicides in the Environment; CRC Press: Boca Raton, FL, USA, 2022; pp. 1–52. [Google Scholar]
  68. Palansooriya, K.N.; Wong, J.T.F.; Hashimoto, Y.; Huang, L.; Rinklebe, J.; Chang, S.X.; Bolan, N.; Wang, H.; Ok, Y.S. Response of microbial communities to biochar-amended soils: A critical review. Biochar 2019, 1, 3–22. [Google Scholar] [CrossRef]
  69. Gorovtsov, A.V.; Minkina, T.M.; Mandzhieva, S.S.; Perelomov, L.V.; Soja, G.; Zamulina, I.V.; Rajput, V.D.; Sushkova, S.N.; Mohan, D.; Yao, J. The mechanisms of biochar interactions with microorganisms in soil. Environ. Geochem. Health 2020, 42, 2495–2518. [Google Scholar] [CrossRef] [PubMed]
  70. Jacoby, R.; Peukert, M.; Succurro, A.; Koprivova, A.; Kopriva, S. The Role of Soil Microorganisms in Plant Mineral Nutrition—Current Knowledge and Future Directions. Front. Plant Sci. 2017, 8, 1617. [Google Scholar] [CrossRef] [PubMed]
  71. Das, S.; Deb, S.; Sahoo, S.S.; Sahoo, U.K. Soil microbial biomass carbon stock and its relation with climatic and other environmental factors in forest ecosystems: A review. Acta Ecol. Sin. 2023, 43, 933–945. [Google Scholar] [CrossRef]
  72. Lin, S.; Xu, Y.; Fu, X.; Zhang, Y. Soil carbon stocks in plantations and natural forests of the sub-tropics. Acta Ecol. Sin. 2019, 39, 478–486. [Google Scholar]
  73. Xu, H.; Huang, L.; Chen, J.; Zhou, H.; Wan, Y.; Qu, Q.; Wang, M.; Xue, S. Changes in soil microbial activity and their linkages with soil carbon under global warming. CATENA 2023, 232, 107419. [Google Scholar] [CrossRef]
  74. Meena, M.; Yadav, G.; Sonigra, P.; Nagda, A.; Mehta, T.; Swapnil, P.; Harish; Marwal, A.; Kumar, S. Multifarious Responses of Forest Soil Microbial Community Toward Climate Change. Microb. Ecol. 2023, 86, 49–74. [Google Scholar] [CrossRef] [PubMed]
  75. Zhao, C.; Zhang, Y.; Liu, X.; Ma, X.; Meng, Y.; Li, X.; Quan, X.; Shan, J.; Zhao, W.; Wang, H. Comparing the Effects of Biochar and Straw Amendment on Soil Carbon Pools and Bacterial Community Structure in Degraded Soil. J. Soil Sci. Plant Nutr. 2020, 20, 751–760. [Google Scholar] [CrossRef]
  76. Dong, X.; Singh, B.P.; Li, G.; Lin, Q.; Zhao, X. Biochar has little effect on soil dissolved organic carbon pool 5 years after biochar application under field condition. Soil Use Manag. 2019, 35, 466–477. [Google Scholar] [CrossRef]
  77. Palviainen, M.; Aaltonen, H.; Laurén, A.; Köster, K.; Berninger, F.; Ojala, A.; Pumpanen, J. Biochar amendment increases tree growth in nutrient-poor, young Scots pine stands in Finland. For. Ecol. Manag. 2020, 474, 118362. [Google Scholar] [CrossRef]
  78. Thomas, S.C.; Halim, M.A.; Gale, N.V.; Sujeeun, L. Biochar enhancement of facilitation effects in agroforestry: Early growth and physiological responses in a maize-leucaena model system. Agrofor. Syst. 2019, 93, 2213–2225. [Google Scholar] [CrossRef]
  79. George, E.; Ventura, M.; Panzacchi, P.; Scandellari, F.; Tonon, G. Can hydrochar and pyrochar affect nitrogen uptake and biomass allocation in poplars? J. Plant Nutr. Soil Sci. 2017, 180, 178–186. [Google Scholar] [CrossRef]
  80. Hu, M.; Lehtonen, A.; Minunno, F.; Mäkelä, A. Age effect on tree structure and biomass allocation in Scots pine (Pinus sylvestris L.) and Norway spruce (Picea abies [L.] Karst.). Ann. For. Sci. 2020, 77, 90. [Google Scholar] [CrossRef]
  81. Zhang, H.; Wang, K.; Xu, X.; Song, T.; Xu, Y.; Zeng, F. Biogeographical patterns of biomass allocation in leaves, stems and roots in China’s forests. Sci. Rep. 2015, 5, 15997. [Google Scholar] [CrossRef] [PubMed]
  82. Poorter, H.; Niklas, K.J.; Reich, P.B.; Oleksyn, J.; Poot, P.; Mommer, L. Biomass allocation to leaves, stems and roots: Meta-analyses of interspecific variation and environmental control. New Phytol. 2012, 193, 30–50. [Google Scholar] [CrossRef] [PubMed]
  83. Konôpka, B.; Pajtík, J.; Moravčík, M.; Lukac, M. Biomass partitioning and growth efficiency in four naturally regenerated forest tree species. Basic Appl. Ecol. 2010, 11, 234–243. [Google Scholar] [CrossRef]
  84. Tanazawa, Y.; Tomotsune, M.; Suzuki, T.; Koizumi, H.; Yoshitake, S. Photosynthetic response of young oaks to biochar amendment in field conditions over 3 years. J. For. Res. 2021, 26, 116–126. [Google Scholar] [CrossRef]
  85. Abideen, Z.; Koyro, H.-W.; Huchzermeyer, B.; Gul, B.; Khan, M.A. Impact of a biochar or a biochar-compost mixture on water relation, nutrient uptake and photosynthesis of Phragmites karka. Pedosphere 2020, 30, 466–477. [Google Scholar] [CrossRef]
  86. Fracheboud, Y.; Luquez, V.; Björkén, L.; Sjödin, A.; Tuominen, H.; Jansson, S. The Control of Autumn Senescence in European Aspen. Plant Physiol. 2009, 149, 1982–1991. [Google Scholar] [CrossRef] [PubMed]
  87. Cui, E.; Xia, J.; Luo, Y. Nitrogen use strategy drives interspecific differences in plant photosynthetic CO2 acclimation. Glob. Change Biol. 2023, 29, 3667–3677. [Google Scholar] [CrossRef] [PubMed]
  88. Herrel, A.; Speck, T.; Rowe, N.P. Ecology and Biomechanics: A Mechanical Approach to the Ecology of Animals and Plants; CRC Press: Boca Raton, FL, USA, 2006; pp. 85–100. [Google Scholar]
  89. Buss, W.; Graham, M.C.; Shepherd, J.G.; Mašek, O. Risks and benefits of marginal biomass-derived biochars for plant growth. Sci. Total Environ. 2016, 569–570, 496–506. [Google Scholar] [CrossRef] [PubMed]
  90. Jaiswal, A. Rhizoctonia solani suppression and plant growth promotion in cucumber as affected by biochar pyrolysis temperature, feedstock and concentration. Soil Biol. Biochem. 2014, 69, 110–118. [Google Scholar] [CrossRef]
  91. Haider, G.; Steffens, D.; Moser, G.; Müller, C.; Kammann, C.I. Biochar reduced nitrate leaching and improved soil moisture content without yield improvements in a four-year field study. Agric. Ecosyst. Environ. 2017, 237, 80–94. [Google Scholar] [CrossRef]
  92. Liqun, X.; Weiming, Z.; Di, W.; Yanyan, S.; Honggui, Z.; Wenqi, G.; Jun, M.; Chen, W. Heat Storage Capacity and Temporal-spatial Response in the Soil Temperature of Albic Soil Amended with Maize-derived Biochar for 2 Years. Soil Tillage Res. 2021, 205, 104762. [Google Scholar] [CrossRef]
  93. Gross, N.; Suding, K.N.; Lavorel, S.; Roumet, C. Complementarity as a mechanism of coexistence between functional groups of grasses. J. Ecol. 2007, 95, 1296–1305. [Google Scholar] [CrossRef]
  94. Wang, X.; Zhu, B.; Li, C.; Gao, M.; Wang, Y.; Zhou, Z.; Yuan, H. Dissecting soil CO2 fluxes from a subtropical forest in China by integrating field measurements with a modeling approach. Geoderma 2011, 161, 88–94. [Google Scholar] [CrossRef]
  95. Song, X.; Yuan, H.; Kimberley, M.O.; Jiang, H.; Zhou, G.; Wang, H. Soil CO2 flux dynamics in the two main plantation forest types in subtropical China. Sci. Total Environ. 2013, 444, 363–368. [Google Scholar] [CrossRef] [PubMed]
  96. Raich, J.W.; Tufekciogul, A. Vegetation and soil respiration: Correlations and controls. Biogeochemistry 2000, 48, 71–90. [Google Scholar] [CrossRef]
  97. Hamada, Y.; Tanaka, T. Dynamics of carbon dioxide in soil profiles based on long-term field observation. Hydrol. Process. 2001, 15, 1829–1845. [Google Scholar] [CrossRef]
  98. Ding, Y.; Liu, Y.; Liu, S.; Li, Z.; Tan, X.; Huang, X.; Zeng, G.; Zhou, L.; Zheng, B. Biochar to improve soil fertility. A review. Agron. Sustain. Dev. 2016, 36, 36. [Google Scholar] [CrossRef]
  99. Högberg, P.; Read, D.J. Towards a more plant physiological perspective on soil ecology. Trends Ecol. Evol. 2006, 21, 548–554. [Google Scholar] [CrossRef] [PubMed]
  100. Kuzyakov, Y.; Cheng, W. Photosynthesis controls of CO2 efflux from maize rhizosphere. Plant Soil 2004, 263, 85–99. [Google Scholar] [CrossRef]
  101. Shi, P.; Qin, Y.; Liu, Q.; Zhu, T.; Li, Z.; Li, P.; Ren, Z.; Liu, Y.; Wang, F. Soil respiration and response of carbon source changes to vegetation restoration in the Loess Plateau, China. Sci. Total Environ. 2020, 707, 135507. [Google Scholar] [CrossRef] [PubMed]
  102. Singh, H.; Northup, B.K.; Rice, C.W.; Prasad, P.V.V. Biochar applications influence soil physical and chemical properties, microbial diversity, and crop productivity: A meta-analysis. Biochar 2022, 4, 8. [Google Scholar] [CrossRef]
  103. Adachi, M.; Bekku, Y.S.; Rashidah, W.; Okuda, T.; Koizumi, H. Differences in soil respiration between different tropical ecosystems. Appl. Soil Ecol. 2006, 34, 258–265. [Google Scholar] [CrossRef]
  104. Sun, D.; Meng, J.; Xu, E.G.; Chen, W. Microbial community structure and predicted bacterial metabolic functions in biochar pellets aged in soil after 34 months. Appl. Soil Ecol. 2016, 100, 135–143. [Google Scholar] [CrossRef]
  105. Fa, K.-Y.; Zhang, Y.-Q.; Wu, B.; Qin, S.-G.; Liu, Z.; She, W.-W. Patterns and possible mechanisms of soil CO2 uptake in sandy soil. Sci. Total Environ. 2016, 544, 587–594. [Google Scholar] [CrossRef] [PubMed]
  106. Li, H.; Li, Y.; Xu, Y.; Lu, X. Biochar phosphorus fertilizer effects on soil phosphorus availability. Chemosphere 2020, 244, 125471. [Google Scholar] [CrossRef] [PubMed]
  107. Luo, D.; Wang, L.; Nan, H.; Cao, Y.; Wang, H.; Kumar, T.V.; Wang, C. Phosphorus adsorption by functionalized biochar: A review. Environ. Chem. Lett. 2023, 21, 497–524. [Google Scholar] [CrossRef]
  108. Li, Q.; Song, X.; Chang, S.X.; Peng, C.; Xiao, W.; Zhang, J.; Xiang, W.; Li, Y.; Wang, W. Nitrogen depositions increase soil respiration and decrease temperature sensitivity in a Moso bamboo forest. Agric. For. Meteorol. 2019, 268, 48–54. [Google Scholar] [CrossRef]
  109. Green, J.K.; Berry, J.; Ciais, P.; Zhang, Y.; Gentine, P. Amazon rainforest photosynthesis increases in response to atmospheric dryness. Sci. Adv. 2020, 6, eabb7232. [Google Scholar] [CrossRef] [PubMed]
  110. Kuzyakov, Y.; Cheng, W. Photosynthesis controls of rhizosphere respiration and organic matter decomposition. Soil Biol. Biochem. 2001, 33, 1915–1925. [Google Scholar] [CrossRef]
Figure 1. Changes in SOC, MBC, and DOC contents among three biochar additions. (a) Changes in SOC contents among three biochar additions; (b) Changes in MBC contents among three biochar additions; (c) Changes in DOC contents among three biochar additions. The box plot illustrates a 25%–75% percentile. Whiskers indicates the range of standard deviation. The horizontal line and the black dot in the box represent the median and the mean, respectively. Differential comparisons were made only within seasons and did not involve inter-seasonal comparisons. Different lowercase letters indicate significant differences among three additions, while the same lowercase letters suggest non-significant p < 0.05.
Forests 15 00917 g001
Disclaimer/Publisher’s Note: The statements, opinions and data contained in all publications are solely those of the individual author(s) and contributor(s) and not of MDPI and/or the editor(s). MDPI and/or the editor(s) disclaim responsibility for any injury to people or property resulting from any ideas, methods, instructions or products referred to in the content.

