Abstract
Background: The hydrological effects of invasive plant control in forestland have not been well studied in the past, and numerous scientific mysteries remain unsolved. The long-term suspension of the unsolved issues will unavoidably influence the sound growth and sustainable management of forest ecosystems. This study investigates the hydrological effects of controlling invasive weeds in forestland. The research aims to understand the impact of invasive weed control on soil and water loss. Methods: Conducted in Eucalyptus benthamii Maiden & Cambage plantations in Central Yunnan, SW China, which are invaded by alien weed Ageratina adenophora (Spreng.) R. M. King & H. Rob., four surface cover treatments were applied to study runoff and sediment yielding properties. The four surface cover treatments were weed harvesting and litter elimination (WH&LE), weed harvesting and litter retention (WH&LR), litter burning and weed renewal (LB&WR), and weed retention and litter retention (WR&LR). Essentially, WH&LE and LB&WR served as integrated management approaches for invasive weeds and litter, WH&LR was an independent weed control measure, and WR&LR served as a research control. Results: Runoff was significantly higher in the LB&WR plots (3.03 mm) compared to the WR&LR plots (1.48 mm) (p < 0.05). The WH&LE plots had higher runoff (2.39 mm) than the WR&LR plots (not statistically significant), while the WH&LR plots had less runoff (1.08 mm) than the WR&LR plots (not significant). Sediment yield was lower in the WH&LR plots (0.50 t/km2) than in the WR&LR plots (0.52 t/km2) (not significant), but significantly higher in the WH&LE plots (2.10 t/km2) and LB&WR plots (1.57 t/km2) than in the WR&LR plots (p < 0.05). Conclusions: Managing invasive weeds independently reduces the risk of soil and water loss, but combined management with litter can exacerbate the issue. Invasive weed control and litter management should be performed separately in slope plantations. This study provides a scientific basis for soil and water conservation, restoration and rehabilitation of plantation ecosystems.
1. Introduction
Yunnan, China, has long held a crucial strategic role in the preservation of global biodiversity and regional ecological security. It is situated in Southwest China, a global biodiversity hotspot, and features three distinct and complex climate types: tropical rainforest, plateau monsoon, and subtropical monsoon. Yunnan has traditionally maintained a high proportion of forest coverage (65.04%) [1] to support its strategic position. In the 1980s, in an effort to boost the local economy, Yunnan established rapidly expanding economic plantations, including plantations of eucalyptus and other tree species, in forest regions, including Kunming, Qujing, Chuxiong, and Honghe. The current area covered by plantations in Yunnan Province is approximately 4.14 million ha [2]. Fast-growing forests have yielded good ecological, economic, and social benefits [3,4] in addition to generating significant amounts of wood. However, in the later stages of fast-growing forest management, eucalyptus plantations in Yunnan have also experienced widespread ecological degradation issues, including a decline in productivity, a decrease in understory plants, the invasion of alien plants [5], and soil and water loss [6].
Because of their strong diffusivity, alien invasive plants in forests are usually regarded as important targets for prevention and control. In practice, exotic plant prevention and control in forestlands has been implemented either separately or in combination with other weed management practices or conventional litter management practices. The invasion of alien plants can change plant cover and litter accumulation in forestlands, which may affect hydrological processes by altering the local water balance [7]. It has been reported that invasive plants have changed the hydrological and meteorological systems of the canopy, affecting rainfall redistribution [8]. Compared with native plants, exotic plants have a lower canopy water storage capacity, resulting in a decrease in freshwater resources in invaded ecosystems [9]. Conversely, invasive plant prevention and control can also alter the surface coverage of forestlands. But what further impact does this have on the hydrological process of the forestland surface? In recent decades, research has been carried out to test such a question. It was found that in the Western Cape, after clearing of the riparian invasive vegetation, there was a marked increase in streamflow during the dry summer months [10]. Similarly, in the Northern Cape, the clearing of invasive Prosopis would conserve groundwater, and groundwater savings of up to 70 m3/month could be achieved in spring for each ha of Prosopis cleared [11]. A removal experiment in a Hawaiian wet forest indicated that native trees show conservative water use relative to invasive trees, providing a strong rationale for the control of invasive species [12]. Research conducted in oceanic islands has suggested that the mortality of non-native trees from forest ecosystems increased the water content of surface soils, primarily due to a slower rate of decrease in the soil water content during dry periods [13]. A model study pointed out that the benefits of clearing alien trees from naturally tree-less ecosystems can include an increase in available surface water resources by 15.1% to 29.5%; clearing riparian invasions is predicted to have a 1.7 times greater impact compared to terrestrial (non-riparian) invasions [14]. These published works do help us to understand the hydrological impacts of invasive plant prevention and control. However, current research on the hydrological impacts of invasive plant control has focused mainly on hydrological changes at the watershed scale caused by woody invasive plants; studies on hydrological changes in invasive weed control have not been reported. Because of these limitations, the academic community is unaware of the true hydrological effects of invasive weed control. Breaking through this research bottleneck will provide a scientific foundation for weed management and utilization based on the preventive and control impact of invasive weeds and for the restoration, reconstruction, and sustainable management of invaded plantation ecosystems.
In forestlands, soil and water loss are highly correlated with rainfall features, understory plant coverage, weed control methods and intensities, and litter management practices [15,16]. In mainland China, in pursuit of rapid logging and short-term rotation of eucalyptus plantations, understory weeds are usually harvested to lessen the competition between weeds and trees for soil water and nutrients, and the harvested biomass is either left in place or removed from the forest. Moreover, due to the implementation of the whole tree utilization model in the development of eucalyptus plantations, for example, in forestry production in the past, eucalyptus leaves were usually picked in advance and used to extract essential oil, and understory litter was often picked up as a processing material for humus fertilizers, which caused a loss of soil and water resources. Additionally, in forest-fire-prone areas, to reduce the accumulation of combustibles and inflammables in forests and prevent the occurrence of forest fires, the prescribed burning of understory litter has been carried out for several years [17]. The prescribed burning of understory litter has also prevented and controlled the spread of invasive weeds to some degree. In the past, hydrological issues like soil and water loss in forestlands, in particular in fast-growing forests, were studied widely. However, for eucalyptus plantations, current research works are mainly focused on the hydrological impacts of afforestation/reforestation [18,19,20], logging (clearing or thinning) [21], rotation [22,23], degradation [24], restoration [25], and replacement [26], while hydrological impacts of some managing practices like weed control and litter management are not comprehensively investigated. At this point, one doubt naturally arises: how do weed control and litter management affect soil and water loss in eucalyptus plantations? Examining this scientific issue will also help to determine the hydrological impacts of invasive weed control and guide the restoration and reconstruction of degraded ecosystems. Unfortunately, there have been few research reports on this scientific issue thus far, and it has become urgent to initiate such research as soon as possible.
In this study, Eucalyptus benthamii Maiden & Cambage slope plantations in Central Yunnan, SW China, which are overrun by the alien weed Ageratina adenophora (Spreng.) R. M. King & H. Rob., were chosen as the experimental observation objects based on the potential surface hydrological impacts following the prevention and control of invasive weeds and litter management in forestland. One-year (May 2021 to April 2022) follow-up observations were conducted on the features of runoff and sediment yield on woodland slopes under the conditions of the independent management of invasive weeds and the joint management of invasive weeds and litter by building systems for collecting and monitoring runoff and sediment in the chosen plantations. The scientific hypothesis that needed to be proven in this study was that some linkage management practices for invasive weeds and litter in forestlands, such as harvesting invasive weeds and removing them with litter or burning invasive weeds and litter together in a planned fire, may exacerbate soil and water loss on slopes, while independent management practices, such as returning invasive weeds to forest litter after harvesting (without removal), might prevent this risk. This study aims to understand the impact of invasive weed control on soil and water loss. The research findings should reveal the true hydrological consequences of managing invasive weeds and litter combined in slope plantations, as well as for managing the former individually. This work provides a scientific basis for the prevention and control of soil and water loss, as well as for the ecological restoration and reconstruction of degraded plantations.
2. Materials and Methods
2.1. General Characteristics of the Research Area Investigated in This Study
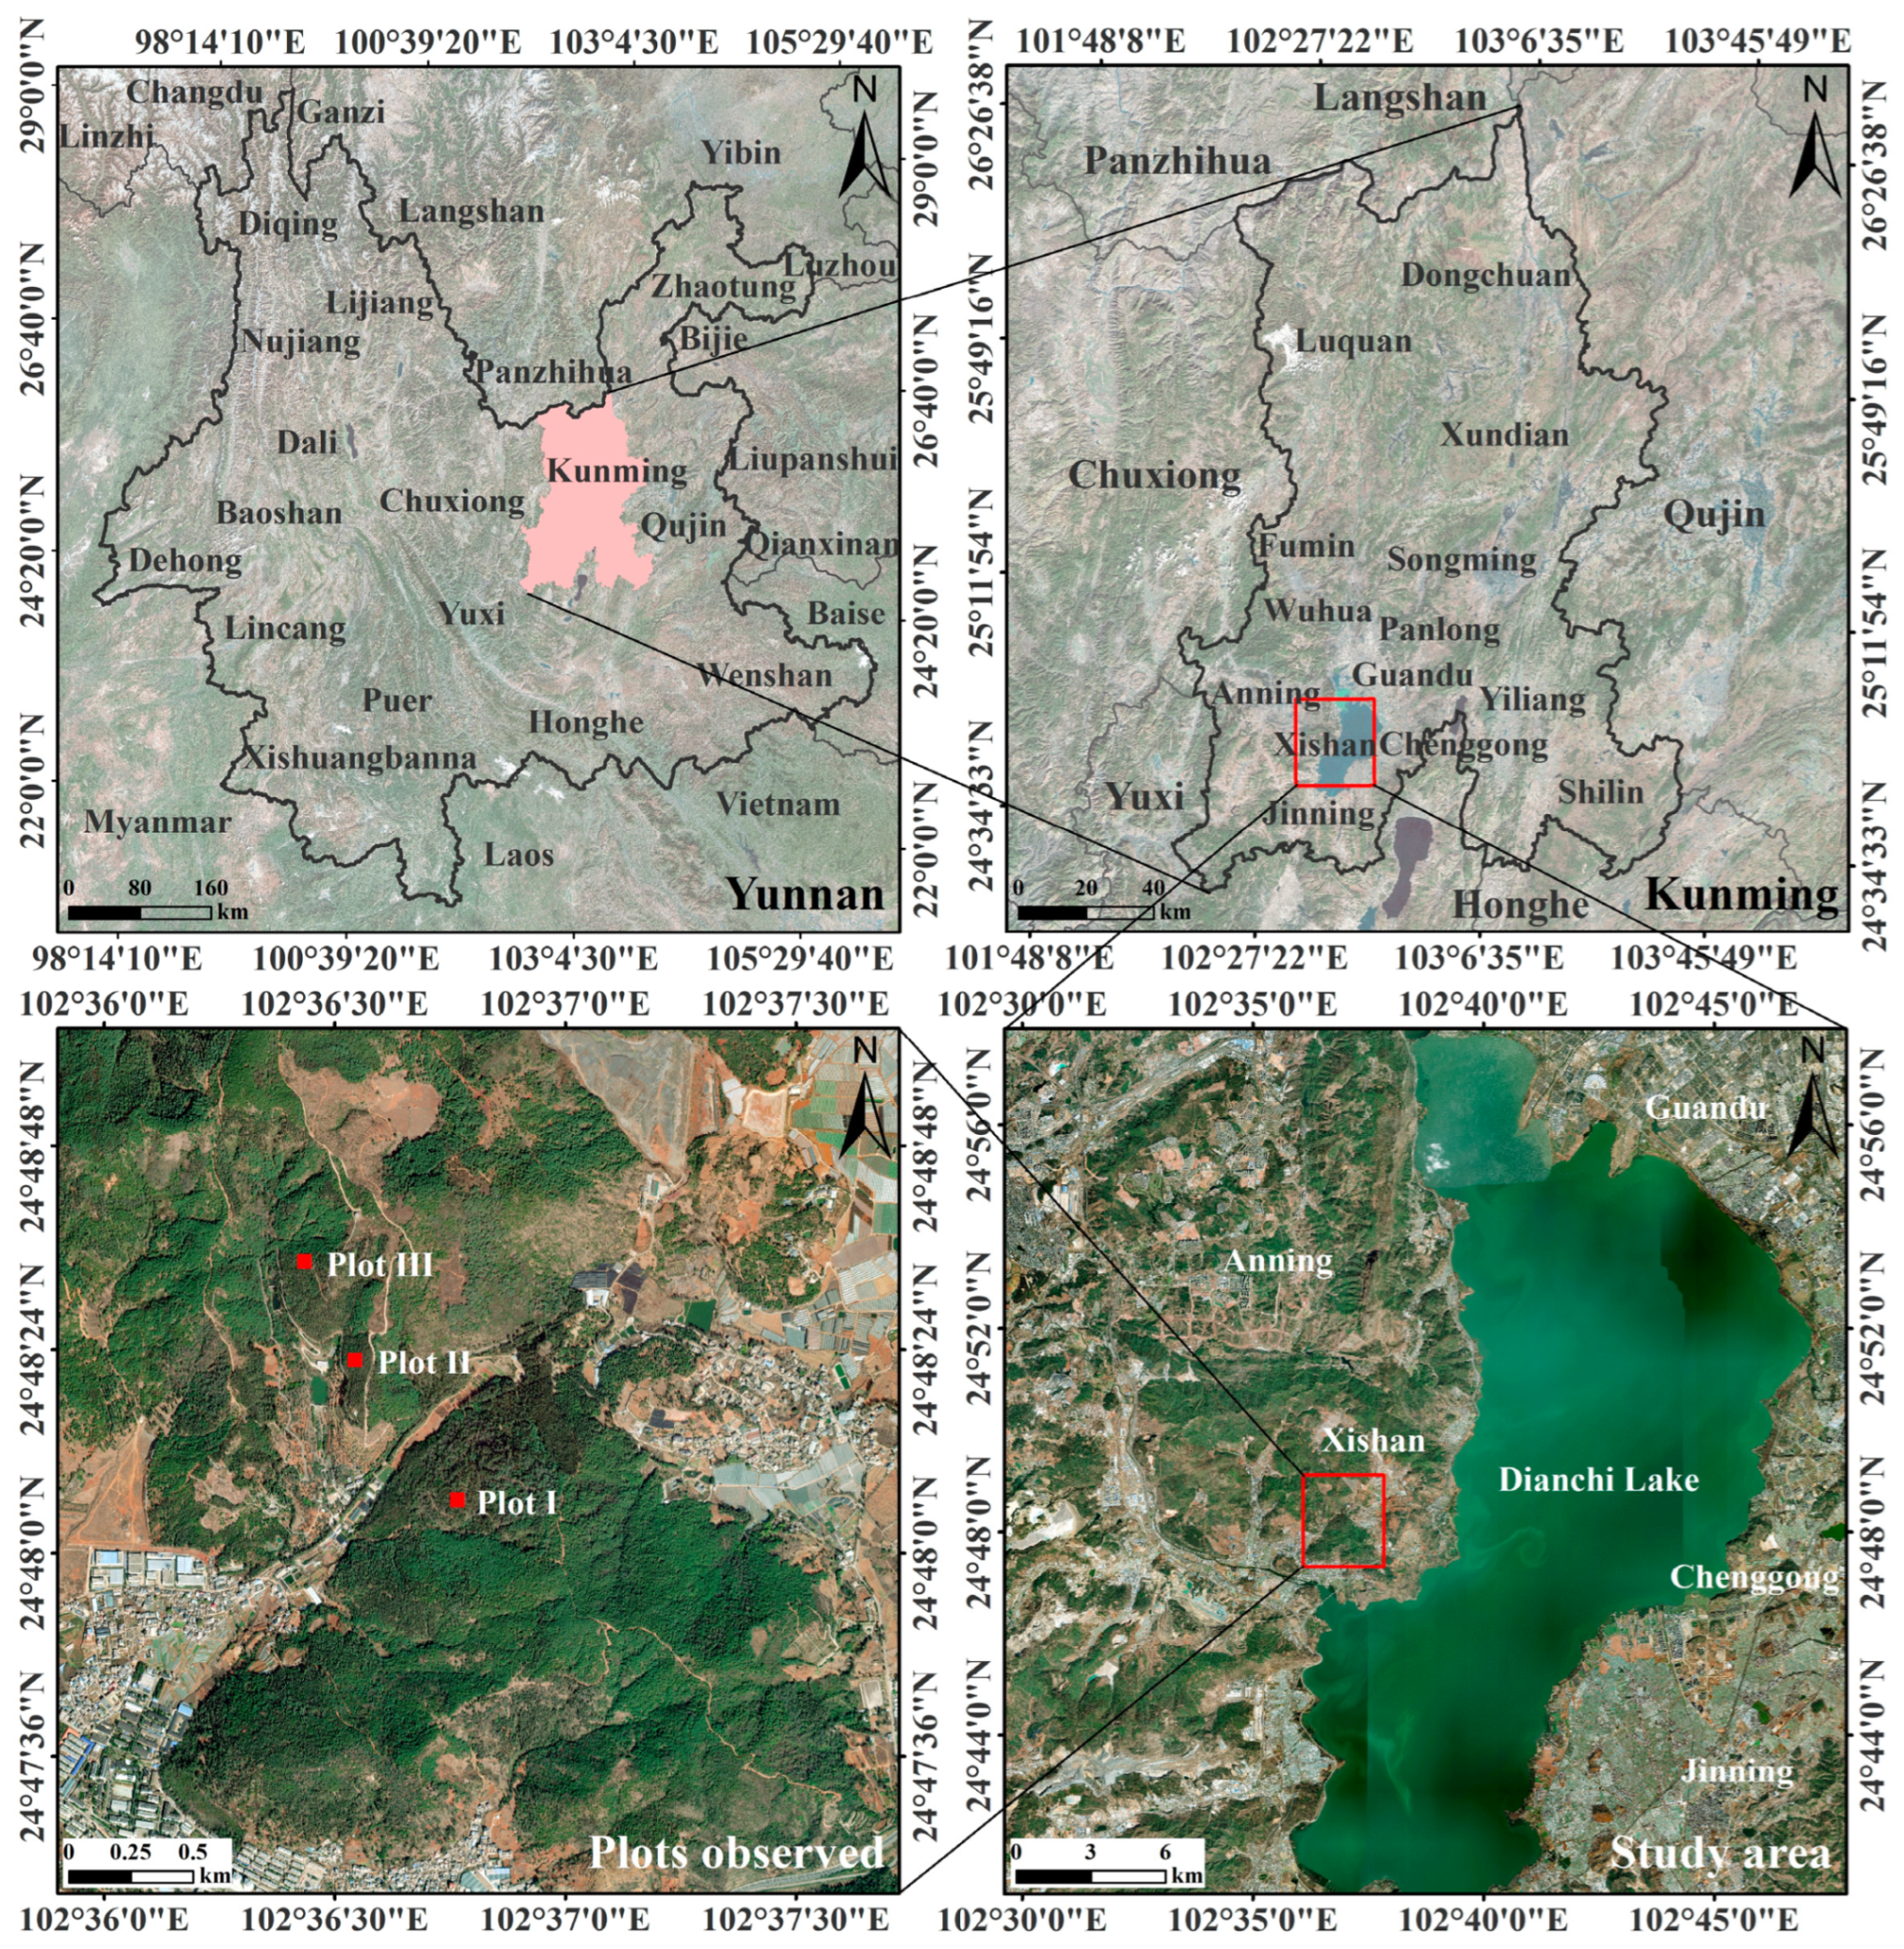
Based on the scale and current population of artificial forests, as well as the invasion status of invasive plants, Kunming Haikou State Forest Farm, Yunnan, China, was selected as the research area for this study. The forest farm is located in the Xishan District of Kunming City, Yunnan Province, China, between 102°28′ and 102°38′ E and 24°43′ and 24°56′ N (Figure 1), with an altitude of 1800–2400 m and an area of 7563 ha (of which the forest area is 6683.8 ha). It is upstream of the Jinsha River system and has a subtropical monsoon climate and a subtropical semi-humid climate. The average annual temperature is 15.4 °C, and the average annual rainfall is 1000.5 mm. The rainfall distribution is uneven, with obvious rainy and dry seasons. The rainy season is from May to October, and the dry season is from November to April of the next year. The main vegetation types are E. benthamii, Pinus armandii Franch., Pinus yunnanensis Franch., Acacia mearnsii De Wild., and Cupressus funebris Endl. plantations. The understory vegetation mainly includes A. adenophora, Myrsine africana L., Pyrus pashia Buch.-Ham. ex D. Don, Pistacia weinmanniifolia J. Poiss. ex Franch., and Rosa murielae Rehder & E. H. Wilson [27].
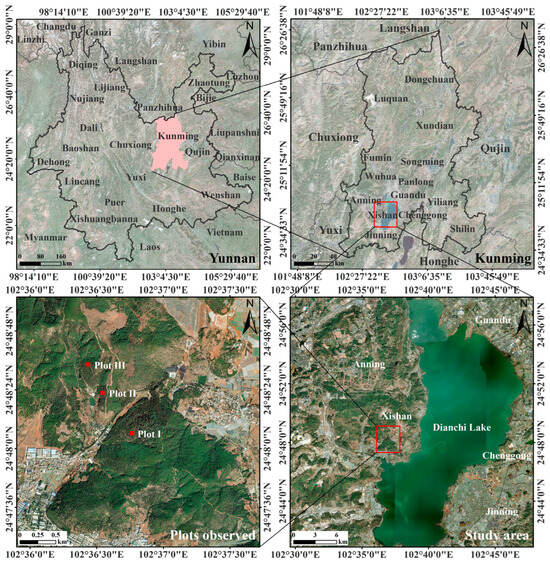
Figure 1.
Location of the study area and distribution of the plots observed. Notes: the pink area in the map of Yunnan (the upper left) represents location of Kunming in Yunnan, the red box in the map of Kunming (the upper right) represents location of the study area in Kunming; the red box in the map of study area (the lower right) represents the area in which experimental observation plots selected (see Section 2.2).
2.2. Selection of Experimental Observation Plantations
After field investigation, three E. benthamii plantations with similar slopes, the same stand ages, and similar stand structures were selected as experimental observation plots (named as sites, too) (Figure 1) in the typical distribution area of E. benthamii plantations in the Kuandiba forest area in Haikou State Forest Farm, and were recorded as Plot I, Plot II, and Plot III, respectively. The size of the experimental observation plots was 50 m × 50 m. The plantations were 36 years old and belonged to an overripe forest. The site conditions and vegetation characteristics of the experimental observation plots were investigated, and the results are listed in Table 1.

Table 1.
The site conditions and vegetation status of the selected experimental observation plots.
2.3. Observation and Calculation of the Rainfall Indices of the Selected Plantations
Four automatic rain gauges (6465 M, Davis Instruments, Hayward, CA, USA) were installed in open areas outside the plantations, and the total precipitation (P) and duration of precipitation (PD) were recorded at a frequency of 5 min/time. Four tipping-bucket rain gauges (DJ-CT, Onset, Bourne, MA, USA) were set uniformly in the plots to record the throughfall (TF) and throughfall duration (TFD), with a recording frequency of 5 min/time. The rainfall events monitored during the study period were classified according to Grade of Precipitation (GB/T 28592-2012) [28] (Table 2), a national standard of the People’s Republic of China (proposed by the China Meteorological Administration, issued jointly by the General Administration of Quality Supervision, Inspection and Quarantine of the People’s Republic of China and the Standardization Administration of the People’s Republic of China). In this study, an individual rainfall event refers to consecutive rainfall or two or more intermittent periods of rainfall with an interval of less than 6 h.
Table 2.
Standards for grade of precipitation of individual rainfall events.
RainRecord (version No. 1.06 2013.6, Beijing Normal University, Beijing, China, etc.), rainfall erosivity calculation software, was used to calculate the maximum precipitation intensity for 30 consecutive minutes (PI30), the maximum throughfall intensity for 30 consecutive minutes (TFI30), and the rainfall erosivity (Re). Rainfall erosivity refers to the potential capacity for soil erosion caused by rainfall. It is usually expressed as the product of rainfall kinetic energy E and precipitation intensity PI30, which can be calculated using Equation (1) [29], Equation (2) [30], and Equation (3) [31].
where er is the rainfall kinetic energy per unit (mm) in the rth period, MJ/(ha·mm), and ir is the precipitation intensity in the rth period, mm/h.
where E is the total kinetic energy of rainfall, MJ/ha; r = 1, 2, …, n, which means that a rainfall process is divided into n periods according to precipitation intensity; er is the rainfall kinetic energy per unit of each period, MJ/(ha·mm); and Pr is the precipitation of the rth period, mm.
where Re is the rainfall erosivity, MJ·mm/(ha·h); E is the kinetic energy of rainfall, MJ/ha; and PI30 is the maximum precipitation intensity for 30 consecutive minutes, mm/h.
er = 0.29[1 − 0.72exp(−0.082ir)]
Re = E · PI30
2.4. Runoff Plot Layout, Supporting Equipment Installation and Runoff and Sediment Observation
2.4.1. Runoff Plot Layout and Surface Cover Treatment
Four runoff plots were constructed in each of the three experimental observation sites (with gentle slopes). The runoff plot was approximately 10.0 m in length and approximately 2.5 m in width. At the end of each runoff plot, there was an inverted trapezoidal catchment area (upper bottom 2.5 m wide, lower bottom 0.3 m wide, 0.7–0.8 m high). The sidewall was built with a weathering-resistant cement board.
According to the actual measures of invasive plant control, litter management and forest fire prevention in the forest areas of Central Yunnan, four different surface cover treatments were, respectively, carried out for the four runoff plots at each experimental observation site (seriously invaded by A. adenophora and with an accumulated thickness of surface litter ranging from 3 to 5 cm) mentioned above. The four different surface cover treatments were weed harvesting and litter elimination (WH&LE), weed harvesting and litter retention in situ (with the harvested weed) (WH&LR), litter burning in the dry season and weed renewal in the rainy season (LB&WR), and weed retention and litter retention (WR&LR). In essence, WH&LE and LB&WR were integrated management measures for invasive weeds and litter, WH&LR was an independent weed control measure, and WR&LR was a scenario in which invasive weeds and litter were neglected (control). The above four surface cover treatments were conducted, respectively, in the four runoff plots at each site, representing experimental treatments in this study. Therefore, this study had four treatments, each treatment repeated three times, and each replicate occupied a runoff plot.
Some additional explanations for the experimental layout are as follows: (a) the runoff plots were built in April 2021 and put into use in May 2021; (b) the LB&WR treatment was carried out in advance in April 2021; (c) the experimental observation period was one year, from May 2021 to April 2022; and (d) for the runoff plots with the WH&LE treatment and WH&LR treatment, a small number of weeds regenerated in the rainy season, which were removed once a month.
2.4.2. Supporting Equipment Installation and Runoff and Sediment Observation
Supporting observation equipment, namely an automatic monitoring system for runoff and sediment (MSC-RS-10 II, Xi’an Senmiao Electronic Technology Co., Ltd., Xi’an, China), was installed at each experimental observation site to measure the runoff and sediment yield in each runoff plot in real time. The runoff and sediment collected in each runoff plot flowed through the PVC diversion pipe (square 105 mm × 80 mm, approximately 0.5 m long) at the end of the outlet of the runoff plot and then entered the automatic monitoring system.
Each automatic monitoring system consisted of a data collector (MSM-A, Xi’an Senmiao Electronic Technology Co., Ltd., Xi’an, China), a set of power supplies, and four triangular measuring weirs (stainless steel material), respectively, distributed close to the outlets of the four runoff plots.
The data collector was directly connected to the four triangular measuring weirs through independent cables (inserted in PVC pipes and buried in the surface soil layer). Indeed, the independent cables enabled the data collector to be connected to two sensors of each measuring weir (eight sensors in total of the four weirs), which allowed the data monitored by all sensors to be centrally collected and stored in the data collector.
The power of each automatic monitoring system was supplied with a UPS battery (12 V/100 Ah, Shenzhen Lianke Zhongneng Technology Co., Ltd., Shenzhen, China) and solar panels (12 V/20 W, Jiangsu Zhenwang Electric Co., Ltd., Suzhou, China).
The four triangular measuring weirs were installed horizontally just below the end of the diversion pipe at the outlet of each runoff plot to measure the runoff and sediment parameters (Figure 2). The triangular measuring weir had a rectangular shape with dimensions of 500 mm × 350 mm × 250 mm, and the top surface (stainless steel buckle plate) had a 150 mm × 150 mm water inlet. To prevent rainfall outside the runoff plot from falling, a stainless-steel proofing cover was installed above the water inlet. The outlet of the triangular weir was located on the front wall of its weir body, which was an inverted isosceles triangle with a weir mouth angle of 30°, a base length of 200 mm, and a height of 250 mm. The distance between the outlet and the bottom of the weir was 10 mm. A water level sensor (MSS-S-100, Xi’an Senmiao Electronic Technology Co., Ltd., Xi’an, China) and a photoelectric sediment transmitter (sensor) (HR80000-1M2E, Shaanxi Hengrui Measurement and Control System Co., Ltd., Baoji, China) were installed in the inner part of each triangular measuring weir to automatically monitor the water level height (H) and sediment density (ρs), and the data were recorded every 5 min. According to H and ρs, the runoff (R) and sediment (S) on slopes generated by a single rainfall event can be further calculated. The detailed calculation methods are described below.
where Q is the slope runoff, m3/s; C is the flow coefficient, 0.588; g is the acceleration of gravity, 9.8 m/s2; θ is the weir mouth angle, 30°; and H is the water level height, m.
where R is the slope runoff, mm; Q is the slope runoff, m3/s; T is the runoff duration, which is 300 s; and A is the area of the runoff plot, m2.
where S is the slope sediment yield, t/km2; Q is the slope runoff, m3/s; T is the runoff duration, which is 300 s; ρs is the sediment density, kg/m3; and A is the area of the runoff plot, m2.
R = (Q · T)/(1000 A)
S = 1000 (Q · T · ρs)/A
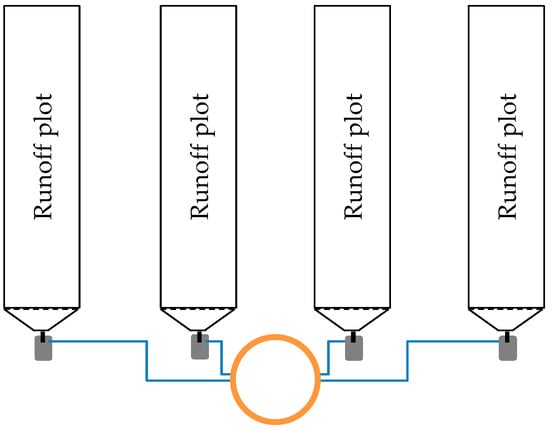
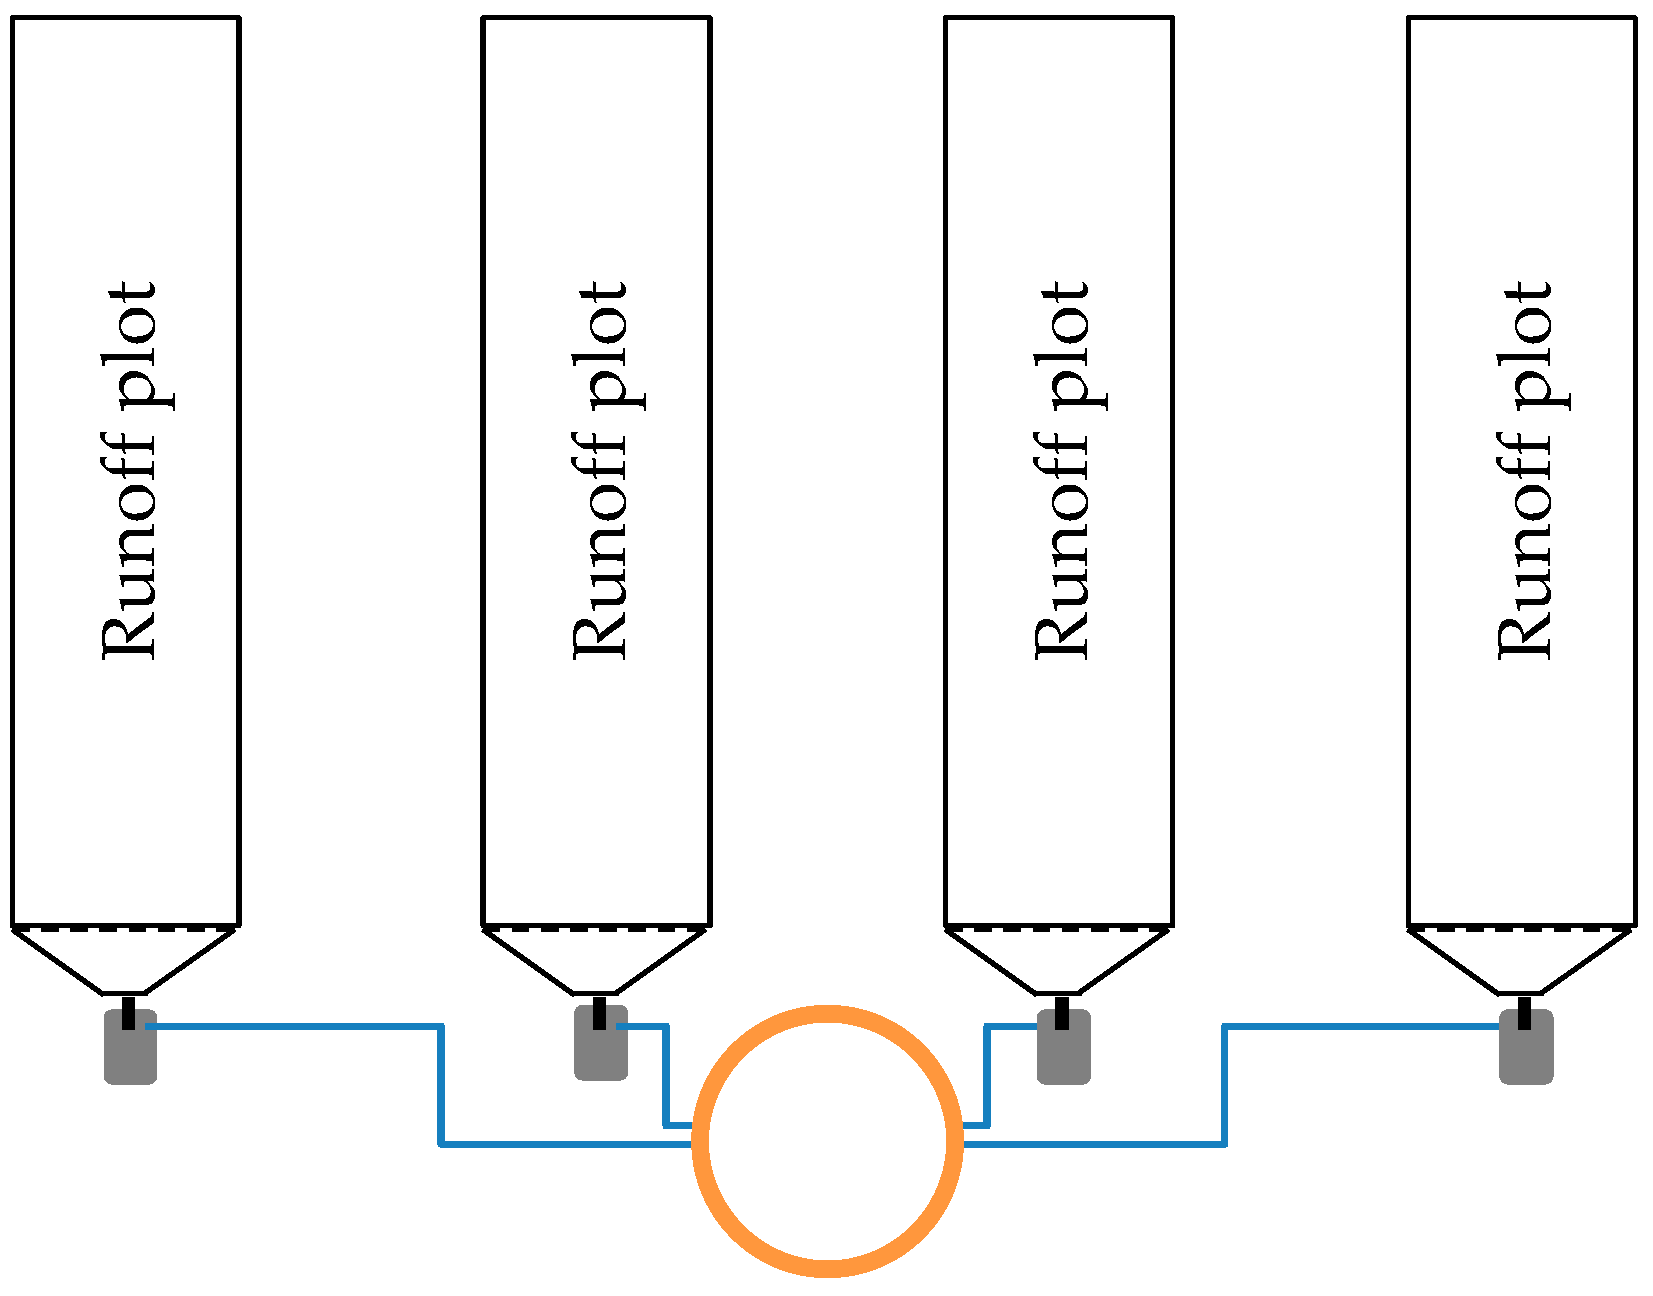
Figure 2.
The diagram of the runoff plots’ distribution with designation and organization of the automatic monitoring system. Notes: the orange circle, the gray rectangle and the blue lines represent the data collector (with a set of power supplies), the triangular measuring weirs, and the independent cables between the data collector and each weir, respectively.
2.5. Statistical Analysis
SPSS 26.0 software (IBM SPSS Statistics, Chicago, IL, USA) was used to analyze the differences in runoff and sediment yield on the slopes of the different surface treatment plots and their correlations with rainfall characteristics. Then, the effects of surface treatment mode and rainfall characteristics on runoff and sediment yield on the slopes were comprehensively analyzed.
3. Results
3.1. Rainfall, Throughfall, and Rainfall Yielding Runoff and Sediment in the Study Area during the Study Period
During the study period (May 2021 to April 2022), 202 rainfall events were observed in the study area, with light rain in the majority, moderate rain in second place, less heavy rain, and no rainstorms or extremely heavy rainstorms. The total precipitation during the study period was 855.48 mm. In terms of precipitation, the numerical relationships between the three rainfall classifications were moderate rain > light rain > heavy rain. Moderate rain had the highest precipitation, accounting for 51.69% of the total precipitation. Throughfall in forests was the largest component of rainfall redistribution, and the amount of throughfall during the study period was 739.11 mm. In terms of throughfall rates, the numerical relationships between the three rainfall classifications were as follows: heavy rain > moderate rain > light rain (Table 3).
Table 3.
Classification of rainfall events during the study period (May 2021 to April 2022).
During the study period, 10 rainfall events in the experimental plantations produced runoff and sediment on the slope (Table 4). The minimum precipitation for rainfall-producing runoff and sediment was 8.3 mm, with the lowest 170 min and a lowest peak precipitation intensity of 2.20 mm/h. The throughfall rate remained at a high level (≥71.25%). Although the precipitation intensity and throughfall rate (only 53.14%) were low on 16 October 2021, the rainfall lasted for a long time (990 min) and caused soil erosion.
Table 4.
Characteristics of rainfall yielding runoff and sediment during the study period (May 2021 to April 2022).
During the study period, the Re of runoff and sediment yield were quite different, and the minimum and maximum Re were 3.38 MJ·mm/(ha·h) and 132.76 MJ·mm/(ha·h), respectively (Table 4). According to the numerical value of rainfall erosivity Re, the rainfall yielding runoff and sediment in the study period were divided into four categories: I, II, III, and IV. The Re of these four categories of rainfall were distributed in four numerical intervals, namely (0, 10), [10, 20), [20, 50), and [50, 150) (Table 4). Category I rainfall was characterized by low and medium precipitation (8.3–20.7 mm), short and medium duration (170–990 min), and low precipitation intensity (2.20–5.93 mm/h) for a total of five events; Category II rainfall was characterized by medium and high precipitation (9.4–31.9 mm), medium and long duration (180–1280 min), and low and moderate precipitation intensity (3.73–9.10 mm/h), for a total of three events; Category III rainfall was characterized by moderate precipitation (21.6 mm), moderate duration (440 min), and moderate precipitation intensity (8.93 mm/h) only once; and Category IV rainfall was characterized by moderate precipitation (23.3 mm), short duration (300 min), and heavy precipitation intensity (27.50 mm/h), also only once.
3.2. Characteristics of Slope Runoff and Sediment Yield under the Conditions of Invasive Plant Control and Litter Management
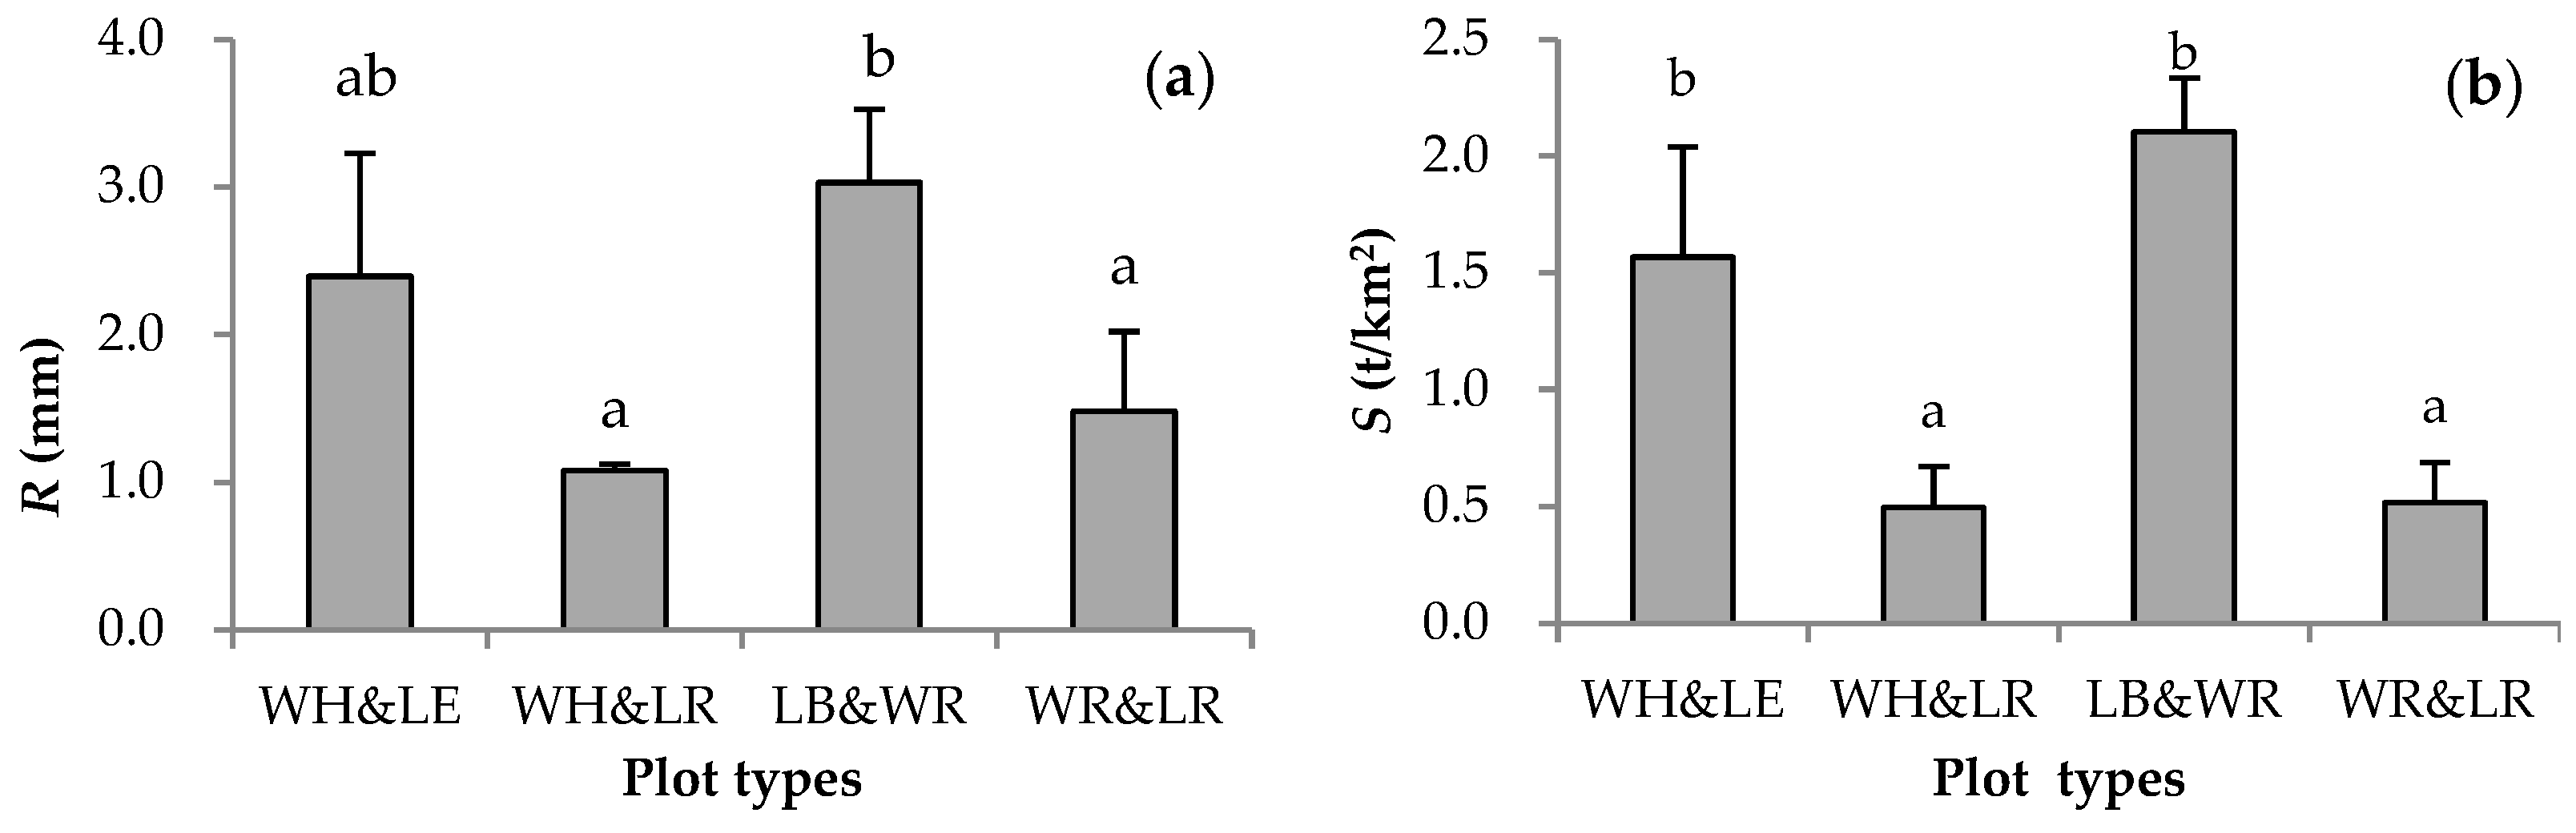
During the study period, the relationships of the cumulative runoff of the WH&LE plots, WH&LR plots, LB&WR plots, and WR&LR plots were as follows: LB&WR plots (3.03 mm) > WH&LE plots (2.39 mm) > WR&LR plots (1.48 mm) > WH&LR plots (1.08 mm) (Figure 3a). The cumulative runoff of the LB&WR plots was slightly greater than that of the WH&LE plots and was significantly greater than that of the WH&LR plots and WR&LR plots (p < 0.05). The relationships between the cumulative sediment yield of the four types of runoff plots were as follows: LB&WR plots (2.10 t/km2) > WH&LE plots (1.57 t/km2) > WR&LR plots (0.52 t/km2) > WH&LR plots (0.50 t/km2) (Figure 3b). The sediment yield of the LB&WR plots and WH&LE plots was significantly greater than that of the WH&LR plots and WR&LR plots (p < 0.05).

Figure 3.
The cumulative runoff and sediment yield in various runoff plots in experimental plantations during the study period (May 2021 to April 2022). Note: Subfigures (a,b) show the cumulative runoff yield and the cumulative sediment yield, respectively, in various runoff plots in the experimental plantations during the study period (May 2021 to April 2022). Different letters in each subfigure represent significant differences, with a significance level of p < 0.05.
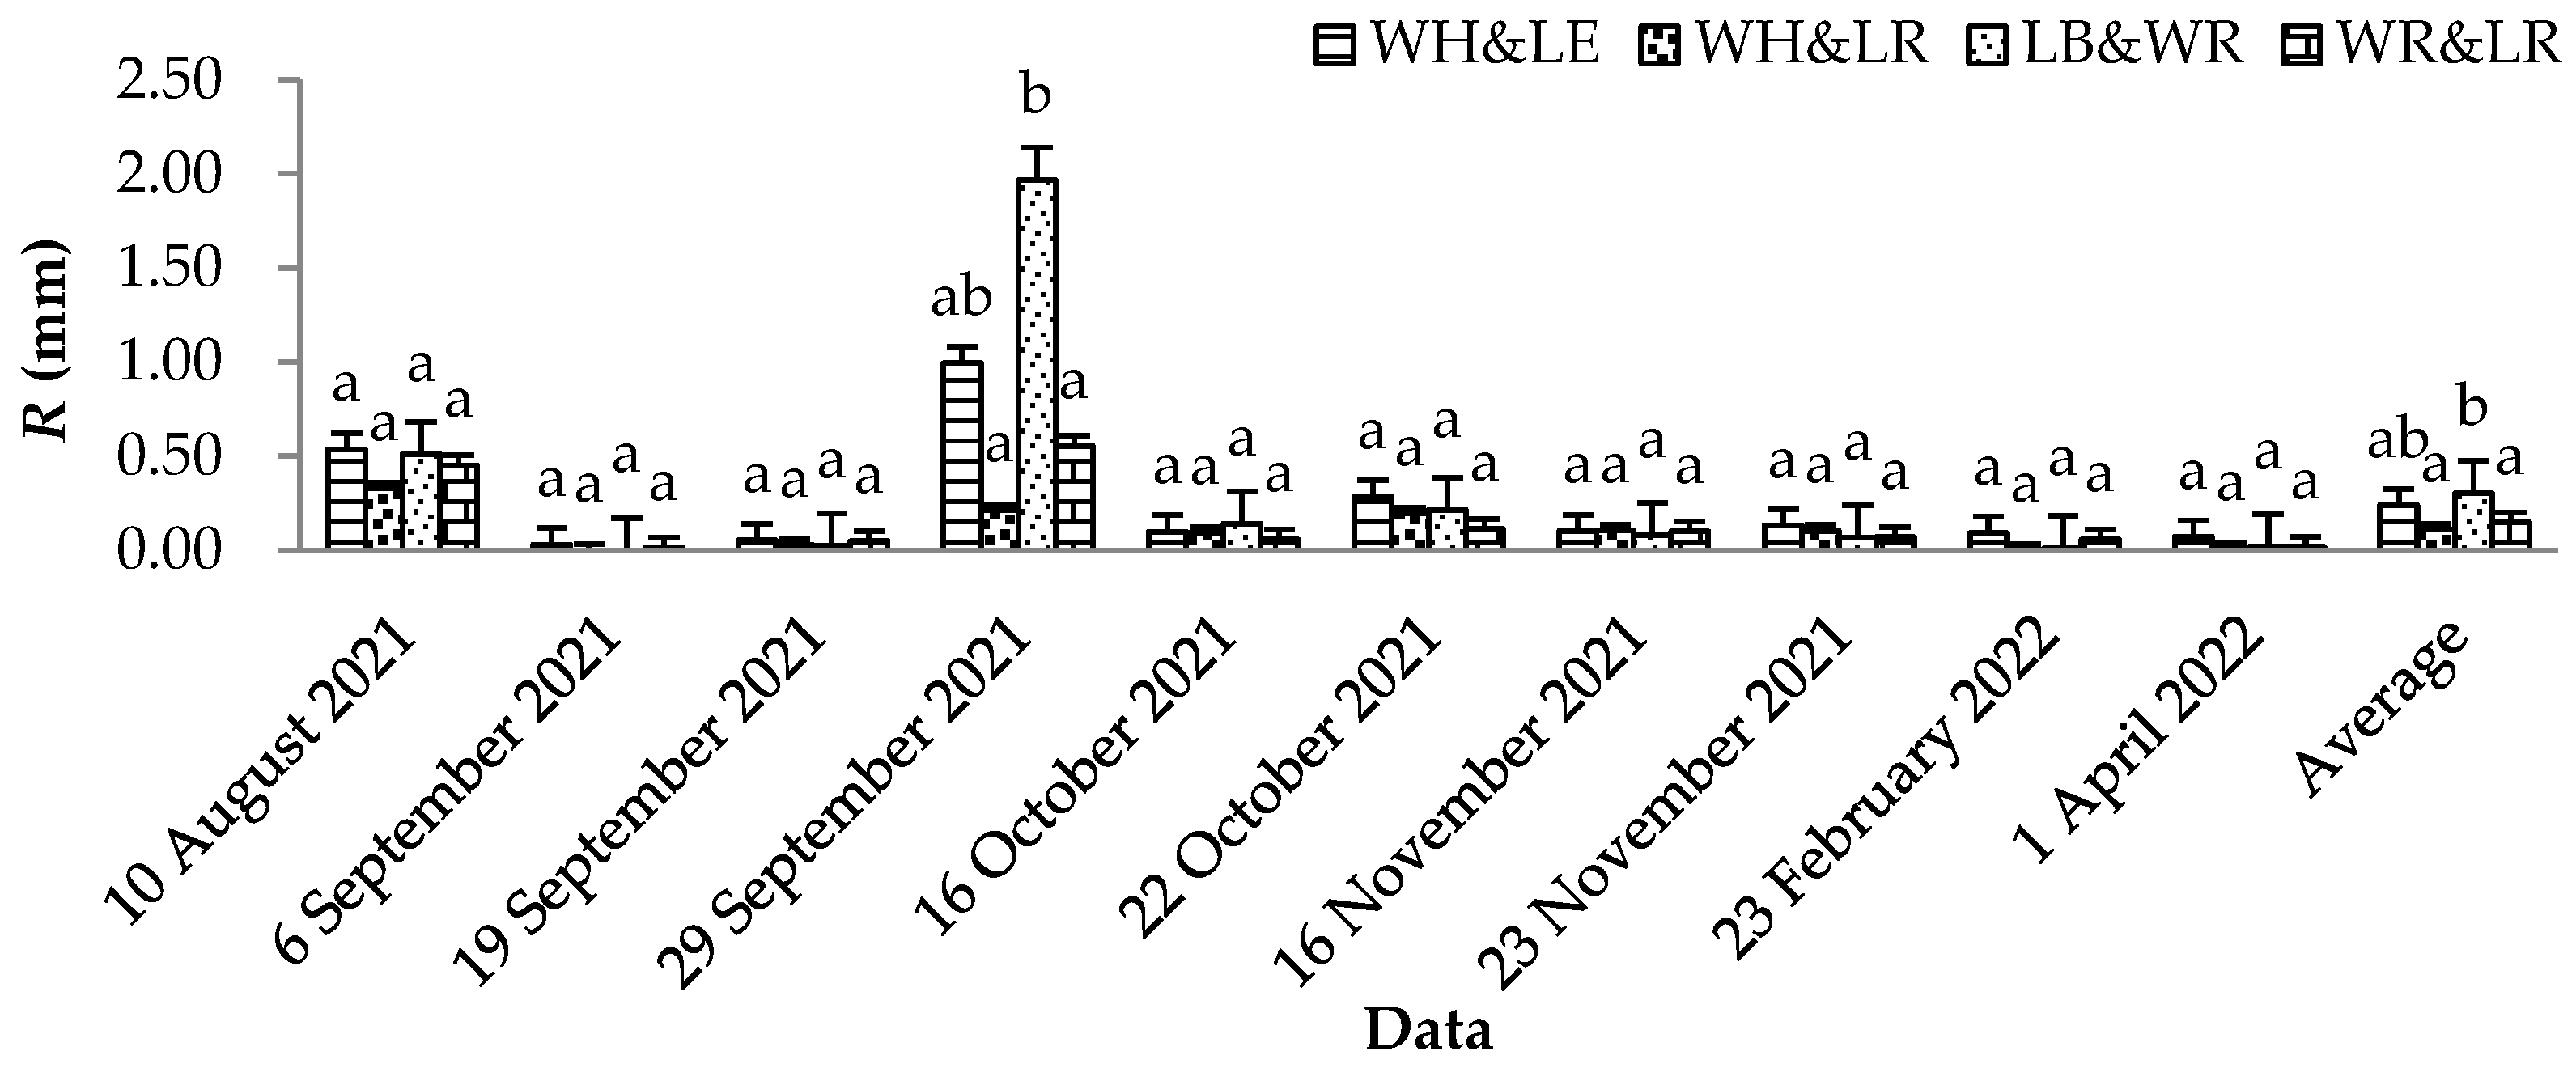
During the study period, 10, 8, 9, and 10 slope runoff events were monitored in the WH&LE plots, WH&LR plots, LB&WR plots, and WR&LR plots, respectively (Figure 4). For a single runoff yielding event, there was no significant difference in runoff between the four types of runoff plots (p < 0.05), except for the runoff event on 29 September 2021. The runoff of the LB&WR plots on 29 September 2021 was significantly greater than that of the WH&LR plots and WR&LR plots (p < 0.05), which were 9.4 times and 3.6 times greater than that of the WH&LR plots and WR&LR plots, respectively.

Figure 4.
Runoff yield from single rainfall events in various runoff plots in experimental plantations during the study period (May 2021 to April 2022). Note: Different letters represent significant differences, with a significance level of p < 0.05.
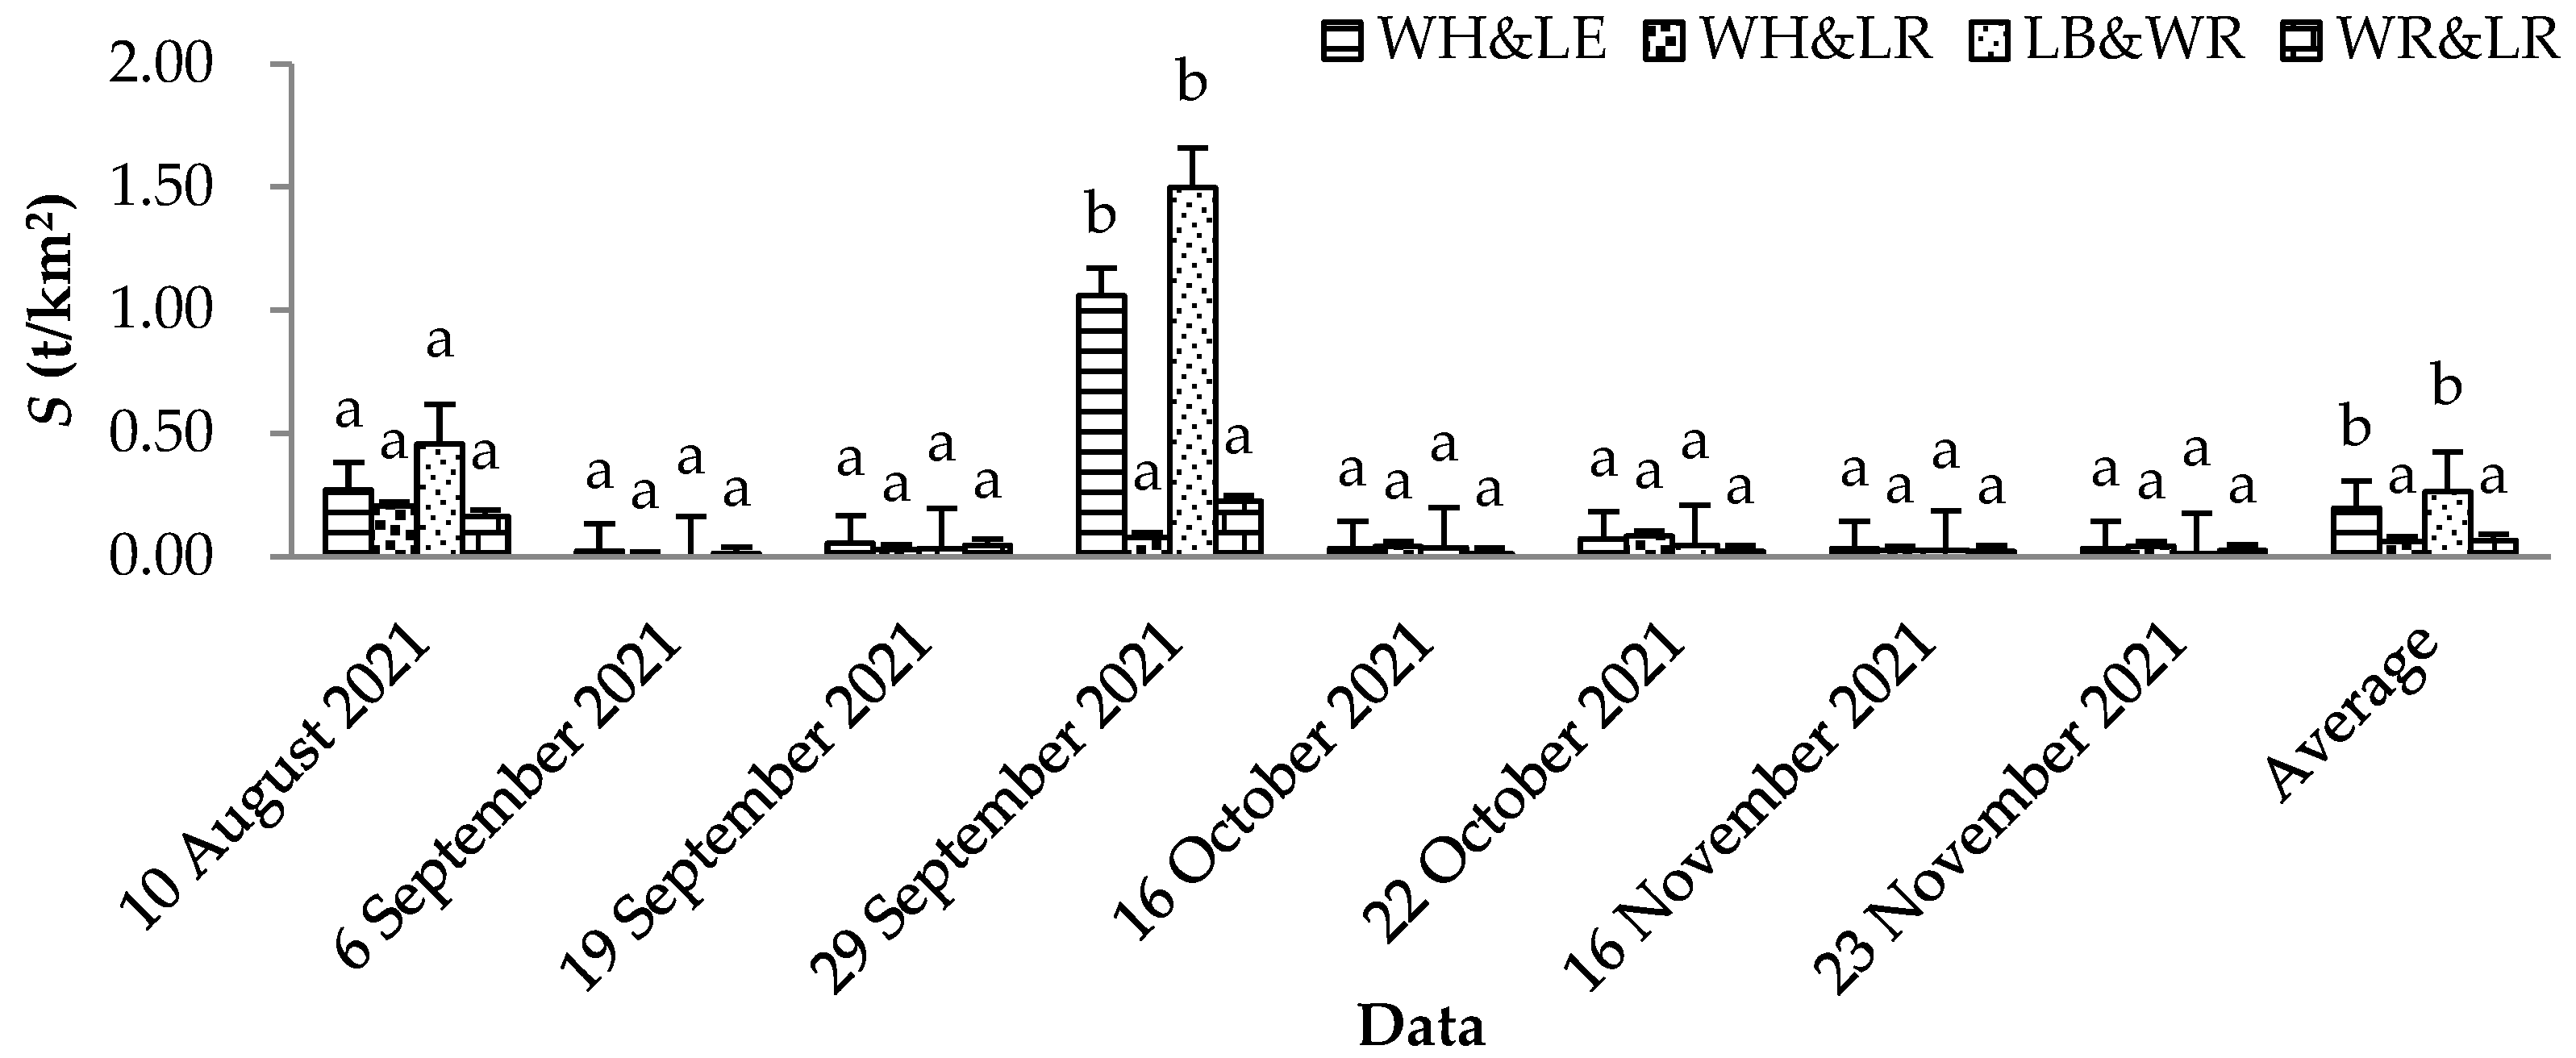
During the study period, 8, 7, 7, and 8 sediment yield events were monitored in the WH&LE, WH&LR, LB&WR, and WR&LR plots, respectively (Figure 5). For a single sediment yielding event, there was no significant difference in sediment between the runoff plots of the four treatments (p < 0.05), except for the sediment yielding event on 29 September 2021. The amount of sediment in the WH&LE plots and LB&WR plots on 29 September 2021 was significantly greater than that in the WH&LR plots and WR&LR plots (p < 0.05); the amount of sediment in the WH&LE plots was 13.3 times and 4.8 times greater than that in the WH&LR plots and WR&LR plots, respectively; and the amount of sediment in the LB&WR plots was 18.8 times and 6.8 times greater than that in the WH&LR plots and WR&LR plots, respectively.

Figure 5.
Sediment yield from single rainfall events in various runoff plots in experimental plantations during the study period (May 2021 to April 2022). Note: Different letters represent significant differences, with a significance level of p < 0.05.
3.3. Correlations between Slope Runoff and Sediment and Rainfall Characteristics
3.3.1. Correlations between Slope Runoff and Rainfall Characteristics
The slope runoff R was closely related to the rainfall characteristics, but the correlations between R and the rainfall parameters in the runoff plots of the four treatments were not the same (Table 5). There was a positive correlation between R and precipitation P and throughfall TF in the WH&LE plots, WH&LR plots, LB&WR plots, and WR&LR plots, but the correlation did not reach a significant level. Except for the WH and LR plots, R in the other three types of runoff plots was negatively correlated with precipitation duration, PD, and throughfall duration, TFD, but did not reach a significant level. In the WH&LE plots and LB&WR plots, R was extremely significantly positively correlated with peak precipitation intensity PI30 and peak throughfall intensity TFI30 (p < 0.01); in the WR&LR plots, there was a significant positive correlation between R and PI30 (p < 0.05), and there was an extremely significant positive correlation between R and TFI30 (p < 0.01); that is, in the WH&LE plots, LB&WR plots, and WR&LR plots, the greater the PI30 and TFI30, the greater the R, and TFI30 was more decisive for R in these three types of runoff plots. There was a highly significant positive correlation between R and Re in the WH&LE plots and LB&WR plots (p < 0.01), while there was a significant positive correlation between R and Re in the WR&LR plots (p < 0.05). The response of R to rainfall characteristics in the WH&LR plots was weak, and there was no significant correlation between R and rainfall parameters.
Table 5.
Correlations between runoff (R) and precipitation parameters in the experimental plantations during the study period (May 2021 to April 2022).
3.3.2. Correlations between Slope Sediment and Rainfall Characteristics
The correlations between sediment S and rainfall parameters in the four types of runoff plots were extremely similar to those between runoff and rainfall parameters (Table 6). The only difference was that there was a significant positive correlation between sediment S and TFI30 in the WR&LR plots (p < 0.05), while runoff R was highly significantly positively correlated with TFI30 (p < 0.01).
Table 6.
Correlations between sediment yield (S) and precipitation parameters in the experimental plantations during the study period (May 2021 to April 2022).
Summary for the results: during the one-year study period, 202 rainfall events were recorded, 10 of which produced runoff and sediment. Compared to the WR&LR plots, the WH&LE plots and LB&WR plots generated higher (significantly or not, p < 0.05) runoff and sediment, as they were influenced significantly by PI30, TFI30, and Re (p < 0.01).
4. Discussion
4.1. Responses of Slope Runoff and Sediment to the Management of Invasive Weeds and Litter in Forestland
When rainfall conditions are the same, surface runoff and soil erosion are mainly regulated by soil conditions (soil porosity and permeability) and vegetation factors (vegetable type and coverage) [32]. Generally, the looser the soil, the better the permeability, and the lower the surface runoff and soil loss; the higher the vegetation coverage, the lower the surface runoff and soil loss. In this study, the R and S on the slope differed among the four surface treatments in the plantations. In terms of the cumulative R and cumulative S in the runoff plots during the study period, the order was LB&WR plots > WH&LE plots > WR&LR plots > WH&LR plots.
After implementing WH&LE processing, the slope surface lost the buffering effects of surface plant cover on rainfall, resulting in more runoff and sediment in the runoff plots, which was consistent with the research results from Boer and Puigdefábregas [33]; that is, raindrops splashed the exposed surface directly and caused more soil erosion.
LB&WR processing not only removed the understory vegetation and litter but also caused the surface soil to form a water-repellent layer due to fire, and the water permeability of the soil decreased [34], resulting in greater runoff and sediment in the LB&WR plots than in the WH&LE plots. According to a study by Malvar et al. [35], the water repellency of burned soil weakened over time. This rule was also verified in this study. For example, before October 2021, the R and S of the LB&WR plots were significantly different from those of the other three treatments, and then they converged. Nevertheless, in terms of the time period of the disappearance of water repellence in the burned soil, this study differed from the conclusion proposed by Carrà et al. [36], that the negative impact of prescribed burning on soil hydrology was limited to 3 to 4 months after prescribed burning. The results also suggested that to avoid serious losses of soil and water resources during the rainy season, it is not appropriate to carry out the prescribed burning of litter on slope plantations in Central Yunnan. Even if it is carried out, it should be carried out in the early dry season.
WH&LR processing increased the thickness of the surface litter layer, thereby reducing the risk of slope soil and water loss, which was consistent with the research results from Sun et al. [37] on the relationship between litter thickness and the response of runoff and sediment in mountain forests on the northern slope of the Tianshan Mountains.
4.2. Impacts of Rainfall Characteristics on Slope Runoff and Sediment under Conditions Involving Invasive Weeds and Litter Management
Rainfall characteristics are the key driving force of soil and water loss [38], and rainfall intensity has the most obvious impact on slope erosion [39]. In this study, the R and S of the WH&LE plots and LB&WR plots increased with increasing PI30 and TFI30. This was because the kinetic energy of rainfall increased with increasing rainfall intensity [40], which in turn led to an increase in the amount of runoff and sediment, giving PI30 and TFI30 a significant coefficient of determination for soil erosion on slopes under the implementation of linkage management measures.
The R of the WH&LR plots was significantly correlated with PI30 and TFI30, while S was not significantly correlated with PI30 or TFI30. This result might be attributed to the following reasons: after weed control, the biomass became litter in situ, which increased the surface roughness and runoff resistance and reduced the flow velocity and sediment transport capacity of runoff [41]. The results suggested that to reduce soil loss effectively, the invasive weed biomass after control should be classified as litter in situ.
The ability of surface cover to intercept and weaken raindrop kinetic energy decreases with increasing rainfall intensity [42], so it is more likely to cause severe soil and water loss in forest areas under heavy and moderate rainfall intensities. In this study, in the rainfall events on 10 August and 29 September 2021, the plots of the four treatments all produced larger R and S values during the study period. Therefore, when implementing invasive weed and litter management measures, attention should be given to preventing soil and water loss caused by heavy and moderate rainfall.
4.3. Slope Runoff and Sediment Are Jointly Affected by Rainfall Characteristics as Well as by Management Measures for Invasive Weeds and Litter in Forestland
Generally, runoff and sediment production on slopes are the result of a combination of multiple factors [43]. This study showed that the slope hydrological impacts of invasive weeds and litter management in eucalyptus plantations were influenced by rainfall characteristics and different management measures. Under the same rainfall conditions, management measures for invasive weeds and litter in woodlands were the main factors leading to differences in soil erosion. Compared with independent or neglected measures of management, integrated management measures have a high risk of soil and water loss, which is related to surface cover and soil permeability [44]. Under the same management practices, slope runoff and sediment were mainly regulated by rainfall intensity. Under heavy and moderate-intensity rainfall, the effect of surface cover weakens in the later period of rainfall [45], and the risk of soil and water loss increases. Therefore, to avoid severe soil and water loss caused by heavy and moderate intensity rainfall, it is necessary to carefully choose management measures for invasive weeds and litter and their implementation time.
4.4. The Main Directions of the Follow-Up Exploration of This Study
This study focused on the impacts of slope runoff and sediment but did not observe the hydrological impacts of the litter layer and soil layer. Although this will not affect the results of the study, if these two studies can be supplemented, it will make the study of slope hydrological impacts more complete.
This study was based only on a one-year field observation experiment, which revealed the hydrological impacts of short-term joint management of invasive weeds and litter on slopes. Therefore, it is necessary to explore the hydrological impacts of medium-term and long-term integrated management on slopes further by extending the field observation period in the future.
5. Conclusions
The integrated management measures of invasive weeds and litter in slope plantations may worsen soil and water loss and should be used with caution. In contrast, an independent management measure that classifies the biomass of invasive weeds as litter in situ after the control can avoid this risk and can be popularized and applied. Consequently, invasive weed prevention and control should not be performed in tandem with litter management in slope plantations; rather, these tasks should be performed separately.
Author Contributions
Conceptualization, F.Y. and X.H.; methodology, F.Y. and X.H.; software, S.Y. and X.H.; validation, S.Y. and X.H.; formal analysis, S.Y. and X.H.; investigation, S.Y., Z.J., Y.Y., Z.L., W.Y. and J.Y.; resources, Z.J., Y.Y., Z.L., W.Y., J.Y., G.Z. and Q.C.; data curation, S.Y. and F.Y.; writing—original draft preparation, S.Y. and F.Y.; writing—review and editing, G.Z. and Q.C.; visualization, S.Y. and X.H.; supervision, G.Z. and Q.C.; project administration, F.Y. and X.H.; funding acquisition, F.Y., G.Z. and Q.C. All authors have read and agreed to the published version of the manuscript.
Funding
This work was supported by the National Natural Science Foundation of China (Grant Nos: 31960305 & 31460191), the Special Research Project of Forestry Public Welfare Industry of the State Forestry Administration of China (Grant No: 201204101-10), the Science and Technology Plan Project of Yunnan, China (Grant No: 202401BD070001-114), the First-Class Discipline Construction Project of Yunnan, China (Yunjiaofa [2022] No. 73), and the “Double First-Class” Construction Project of Yunnan University, China (No grant number).
Data Availability Statement
The data presented in this study are available on request from the corresponding authors.
Acknowledgments
We extend our sincere gratitude to all the people who helped with the research, including those who offered advice on topic selection, hardware provision, language processing, writing support, and article proofreading. They are (but are not limited to) Chunfeng Bu, Songbai Song, Zhanli Wang, Guangjun Zhang, and Yongqing Ma of Northwest Agriculture and Forestry University, China; Zhibin He of Northwest Institute of Eco-Environment and Resources, Chinese Academy of Sciences; Yu An of Northeast Institute of Geography and Agroecology, Chinese Academy of Sciences; Kun Tian, Keqin Wang, Chengzhong He, and An’an Duan of Southwest Forestry University, China; and Wenhua Su, Xiaokun Ou, and Jianping Wu of Yunnan University, China. We also thank all the anonymous experts who reviewed the manuscript.
Conflicts of Interest
The authors declare no conflicts of interest.
References
- National Forestry and Grassland Administration, P.R.C. China Forestry Statistical Yearbook (2020); China Forestry Publishing House: Beijing, China, 2021. [Google Scholar]
- Luo, H.; Zhou, T.; Wu, H.; Gao, S.; Li, Z.; Xu, P.; Cao, L. Different responses of planted and natural forests to short-term and prolonged droughts in Yunnan. J. Beijing Norm. Univ. Nat. Sci. 2016, 52, 518–524. [Google Scholar] [CrossRef]
- Pisarello, K.L.; Sun, G.; Evans, J.M.; Fletcher, R.J. Potential long term water yield impacts from pine plantation management strategies in the southeastern United States. For. Ecol. Manag. 2022, 522, 120454. [Google Scholar] [CrossRef]
- Olander, L.; Warnell, K.; Warziniack, T.; Ghali, Z.; Miller, C.; Neelan, C. Exploring the use of ecosystem services conceptual models to account for the benefits of public lands: An example from national forest planning in the United States. Forests 2021, 12, 267. [Google Scholar] [CrossRef]
- Zhou, X.; Zhu, H.; Yuanguang, W.; Goodale, U.; Zhu, Y.; Yu, S.; Li, C.; Li, X. Intensive management and declines in soil nutrients lead to serious exotic plant invasion in Eucalyptus plantations under successive short-rotation regimes. Land Degrad. Dev. 2019, 31, 297–310. [Google Scholar] [CrossRef]
- Hou, X.; Duan, C.; Tang, C.Q.; Fu, D. Nutrient relocation, hydrological functions, and soil chemistry in plantations as compared to natural forests in Central Yunnan, China. Ecol. Res. 2010, 25, 139–148. [Google Scholar] [CrossRef]
- Whitworth-Hulse, J.I.; Magliano, P.N.; Zeballos, S.R.; Aguiar, S.; Baldi, G. Global patterns of rainfall partitioning by invasive woody plants. Glob. Ecol. Biogeogr. 2021, 30, 235–246. [Google Scholar] [CrossRef]
- Sadeghi, S.M.M.; Van Stan, J.T.; Pypker, T.G.; Friesen, J. Canopy hydrometeorological dynamics across a chronosequence of a globally invasive species, Ailanthus altissima (mill., tree of heaven). Agric. For. Meteorol. 2017, 240–241, 10–17. [Google Scholar] [CrossRef]
- Takahashi, M.; Giambelluca, T.W.; Mudd, R.G.; DeLay, J.K.; Nullet, M.A.; Asner, G.P. Rainfall partitioning and cloud water interception in native forest and invaded forest in Hawai’i Volcanoes National Park. Hydrol. Process 2011, 25, 448–464. [Google Scholar] [CrossRef]
- Prinsloo, F.W.; Scott, D.F. Streamflow responses to the clearing of alien invasive trees from riparian zones at three sites in the Western Cape Province. S. Afr. For. J. 1999, 185, 1–7. [Google Scholar] [CrossRef]
- Dzikiti, S.; Schachtschneider, K.; Naiken, V.; Gush, M.; Moses, G.; Maitre, D.C.L. Water relations and the effects of clearing invasive Prosopis trees on groundwater in an arid environment in the Northern Cape, South Africa. J. Arid Environ. 2013, 90, 103–113. [Google Scholar] [CrossRef]
- Cavaleri, M.A.; Ostertag, R.; Cordell, S.; Sack, L. Native trees show conservative water use relative to invasive trees: Results from a removal experiment in a Hawaiian wet forest. Conserv. Physiol. 2014, 2, cou016. [Google Scholar] [CrossRef] [PubMed]
- Hata, K.; Kawakami, K.; Kachi, N. Increases in soil water content after the mortality of non-native trees in oceanic island forest ecosystems are due to reduced water loss during dry periods. Sci. Total Environ. 2016, 545–546, 372–380. [Google Scholar] [CrossRef] [PubMed]
- Rebelo, A.J.; Holden, P.B.; Hallowes, J.; Eady, B.; Cullis, J.D.S.; Esler, K.J.; New, M.G. The hydrological impacts of restoration: A modelling study of alien tree clearing in four mountain catchments in South Africa. J. Hydrol. 2022, 610, 127771. [Google Scholar] [CrossRef]
- Liang, H.; Ma, Q.; Wen, Y.; Guo, J.; Yang, J. Characteristics of soil and water loss in eucalyptus seedling forest under different afforestation and tending disturbance. Bull. Soil Water Conserv. 2016, 4, 39. (In Chinese) [Google Scholar] [CrossRef]
- Xia, L.; Song, X.; Fu, N.; Cui, S.; Li, L.; Li, H.; Li, Y. Effects of forest litter cover on hydrological response of hillslopes in the Loess Plateau of China. Catena 2019, 181, 104076. [Google Scholar] [CrossRef]
- Wasserman, T.N.; Waltz, A.E.M.; Roccaforte, J.P.; Springer, J.D.; Crouse, J.E. Natural regeneration responses to thinning and burning treatments in ponderosa pine forests and implications for restoration. J. For. Res. 2022, 33, 741–753. [Google Scholar] [CrossRef]
- Engel, V.; Jobbágy, E.G.; Stieglitz, M.; Williams, M.; Jackson, R.B. Hydrological consequences of Eucalyptus afforestation in the Argentine Pampas. Water Resour. Res. 2005, 41, W10409. [Google Scholar] [CrossRef]
- Scott, D.F.; Prinsloo, F.W. Longer-term effects of pine and eucalypt plantations on streamflow. Water Resour. Res. 2008, 44, W00A08. [Google Scholar] [CrossRef]
- Walden, L.L.; Harper, R.J.; Mendham, D.S.; Henry, D.J.; Fontaine, J.B. Eucalyptus reforestation induces soil water repellency. Soil Res. 2015, 53, 168–177. [Google Scholar] [CrossRef]
- Dzikiti, S.; Gush, M.B.; Maitre, D.C.L.; Maherry, A.; Jovanovic, N.Z.; Ramoelo, A.; Cho, M.A. Quantifying potential water savings from clearing invasive alien Eucalyptus camaldulensis using in situ and high resolution remote sensing data in the Berg River Catchment, Western Cape, South Africa. For. Ecol. Manag. 2016, 361, 69–80. [Google Scholar] [CrossRef]
- Mugunga, C.P.; Kool, D.; Van Wijk, M.T.; Mohren, G.M.J.; Giller, K.E. Water use by short rotation Eucalyptus woodlots in southern Rwanda. Agroforest Syst. 2015, 89, 1119–1139. [Google Scholar] [CrossRef]
- Maier, C.A.; Albaugh, T.J.; Cook, R.I.; Hall, K.; Vose, J.M. Comparative water use in short-rotation Eucalyptus benthamii and Pinus taeda trees in the Southern United States. For. Ecol. Manag. 2017, 397, 126–138. [Google Scholar] [CrossRef]
- Close, D.C.; Davidson, N.J.; Johnson, D.W.; Abrams, M.D.; Hart, S.C.; Lunt, I.D.; Archibald, R.D.; Adams, B.H.A. Premature decline of Eucalyptus and altered ecosystem processes in the absence of fire in some Australian forests. Bot. Rev. 2009, 75, 191–202. [Google Scholar] [CrossRef]
- Lara, A.; Jones, J.; Little, C.; Vergara, N.S. Streamflow response to native forest restoration in former Eucalyptus plantations in South Central Chile. Hydrol. Process 2021, 35, e14270. [Google Scholar] [CrossRef]
- Mattos, T.S.; de Oliveira, P.T.S.; Lucas, M.C.; Wendland, E. Groundwater recharge decrease replacing pasture by Eucalyptus plantation. Water 2019, 11, 1213. [Google Scholar] [CrossRef]
- Peng, M.; Yang, X.; Chen, J.; Chen, J.; Jin, Z.; Li, Z.; Zhang, C.; Niu, X. Study on Forest Ecosystem Service Function of Haikou Forest Farm in Kunming City, Yunnan Province; China Forestry Publishing House: Beijing, China, 2021. [Google Scholar]
- GB/T 28592-2012; National Standard of the People’s Republic of China: Grade of Precipitation. Standards Press of China: Beijing, China, 2012.
- Brown, L.C.; Foster, G.R. Storm erosivity using idealized intensity distributions. T. ASAE 1987, 30, 379. [Google Scholar] [CrossRef]
- USDA. Science Documentation: Revised Universal Soil Loss Equation Version 2 (RUSLE 2); USDA: Washington, DC, USA, 2013. [Google Scholar]
- Wischmeier, W.H.; Smith, D.D. Rainfall energy and its relationship to soil loss. Trans. Amer. Geophys. Union 1958, 39, 285–291. [Google Scholar] [CrossRef]
- Yang, Q.; Yang, G.; Zhao, Q.; Dai, L. Characteristics of runoff and sediment yield on slope with different rainfall and vegetation cover in karst area. Bull. Soil Water Conserv. 2020, 40, 9–16. (In Chinese) [Google Scholar] [CrossRef]
- Boer, M.; Puigdefábregas, J. Effects of spatially structured vegetation patterns on hillslope erosion in a semiarid Mediterranean environment: A simulation study. Earth Surf. Proc. Land. 2005, 30, 149–167. [Google Scholar] [CrossRef]
- DeBano, L.F. The role of fire and soil heating on water repellency in wildland environments: A review. J. Hydrol. 2000, 231, 195–206. [Google Scholar] [CrossRef]
- Malvar, M.C.; Prats, S.A.; Nunes, J.P.; Keizer, J.J. Soil water repellency severity and its spatio-temporal variation in burnt eucalypt plantations in North-Central Portugal. Land Degrad. Dev. 2016, 27, 1463–1478. [Google Scholar] [CrossRef]
- Carrà, B.G.; Bombino, G.; Lucas-Borja, M.E.; Plaza-Alvarez, P.A.; D’Agostino, D.; Zema, D.A. Prescribed fire and soil mulching with fern in Mediterranean forests: Effects on surface runoff and erosion. Ecol. Eng. 2022, 176, 106537. [Google Scholar] [CrossRef]
- Sun, X.; Li, J.M.; Zhang, Y.; Li, X.; Lu, J.; She, F. Analysis on characteristics and influencing factors of runoff and sediment yield in forest land on the north slope of Tianshan Mountains. J. Environ. Sci. 2021, 30, 1821–1830. (In Chinese) [Google Scholar] [CrossRef]
- Fang, N.; Shi, Z.; Li, L.; Guo, Z.; Liu, Q.; Ai, L. The effects of rainfall regimes and land use changes on runoff and soil loss in a small mountainous watershed. Catena 2012, 99, 1–8. [Google Scholar] [CrossRef]
- Huo, J.; Yu, X.; Liu, C.; Chen, L.; Zheng, W.; Yang, Y.; Tang, Z. Effects of soil and water conservation management and rainfall types on runoff and soil loss for a sloping area in North China. Land Degrad. Dev. 2020, 31, 2117–2130. [Google Scholar] [CrossRef]
- Li, G.; Wan, L.; Cui, M.; Wu, B.; Zhou, J. Influence of canopy interception and rainfall kinetic energy on soil erosion under forests. Forests 2019, 10, 509. [Google Scholar] [CrossRef]
- Keesstra, S.D.; Rodrigo-Comino, J.; Novara, A.; Giménez-Morera, A.; Pulido, M.; Di Prima, S.; Cerdà, A. Straw mulch as a sustainable solution to decrease runoff and erosion in glyphosate-treated clementine plantations in Eastern Spain. An assessment using rainfall simulation experiments. Catena 2019, 174, 95–103. [Google Scholar] [CrossRef]
- Han, D.; Deng, J.; Gu, C.; Mu, X.; Gao, P.; Gao, J. Effect of shrub-grass vegetation coverage and slope gradient on runoff and sediment yield under simulated rainfall. Int. J. Sediment Res. 2021, 36, 29–37. [Google Scholar] [CrossRef]
- Tang, C.; Liu, Y.; Li, Z.; Guo, L.; Xu, A.; Zhao, J. Effectiveness of vegetation cover pattern on regulating soil erosion and runoff generation in red soil environment, Southern China. Ecol. Indic. 2021, 129, 107956. [Google Scholar] [CrossRef]
- Huang, J.; Wu, P.; Zhao, X. Effects of rainfall intensity, underlying surface and slope gradient on soil infiltration under simulated rainfall experiments. Catena 2013, 104, 93–102. [Google Scholar] [CrossRef]
- Huang, Z.; Ouyang, Z.; Li, F.; Zheng, H.; Wang, X. Response of runoff and soil loss to reforestation and rainfall type in red soil region of Southern China. J. Environ. Sci. 2010, 22, 1765–1773. [Google Scholar] [CrossRef] [PubMed]
Disclaimer/Publisher’s Note: The statements, opinions and data contained in all publications are solely those of the individual author(s) and contributor(s) and not of MDPI and/or the editor(s). MDPI and/or the editor(s) disclaim responsibility for any injury to people or property resulting from any ideas, methods, instructions or products referred to in the content. |
© 2024 by the authors. Licensee MDPI, Basel, Switzerland. This article is an open access article distributed under the terms and conditions of the Creative Commons Attribution (CC BY) license (https://creativecommons.org/licenses/by/4.0/).