
The Impact of Climate Change and Human Activities on the Spatial and Temporal Variations of Vegetation NPP in the Hilly-Plain Region of Shandong Province, China

 ,
,  , , ,
, , ,  ,
,
Abstract
1. Introduction
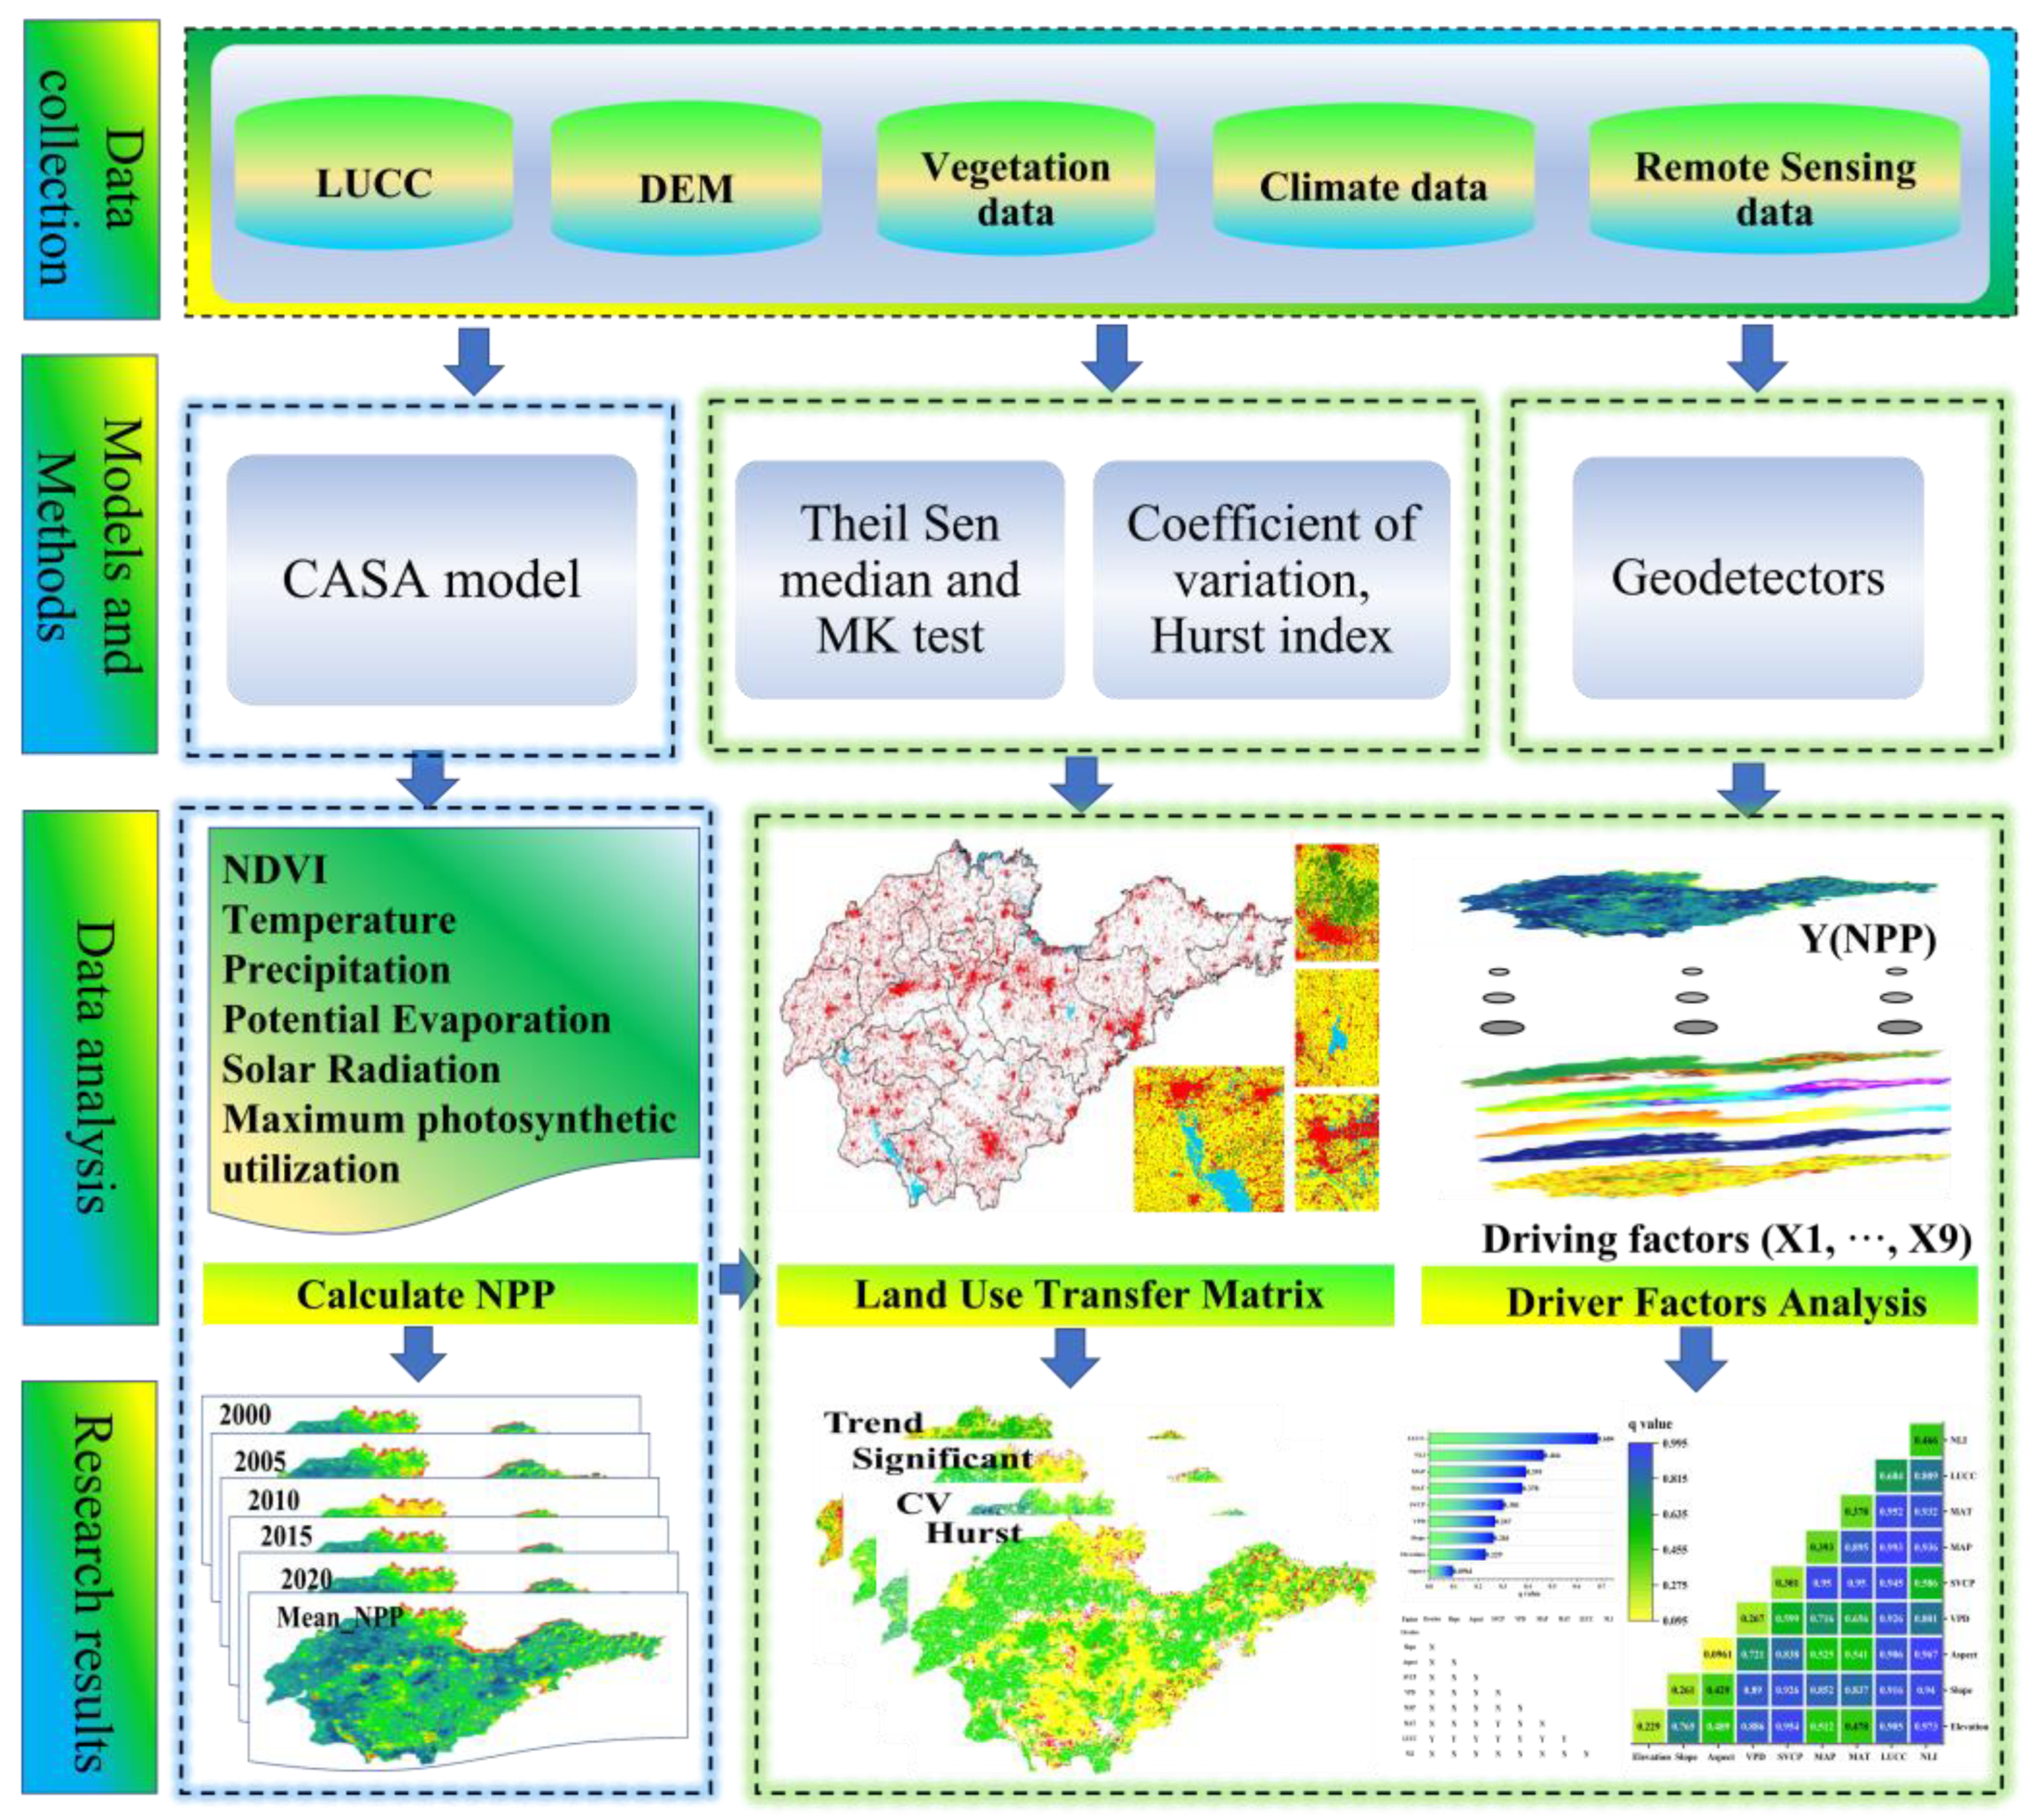
2. Materials and Methods
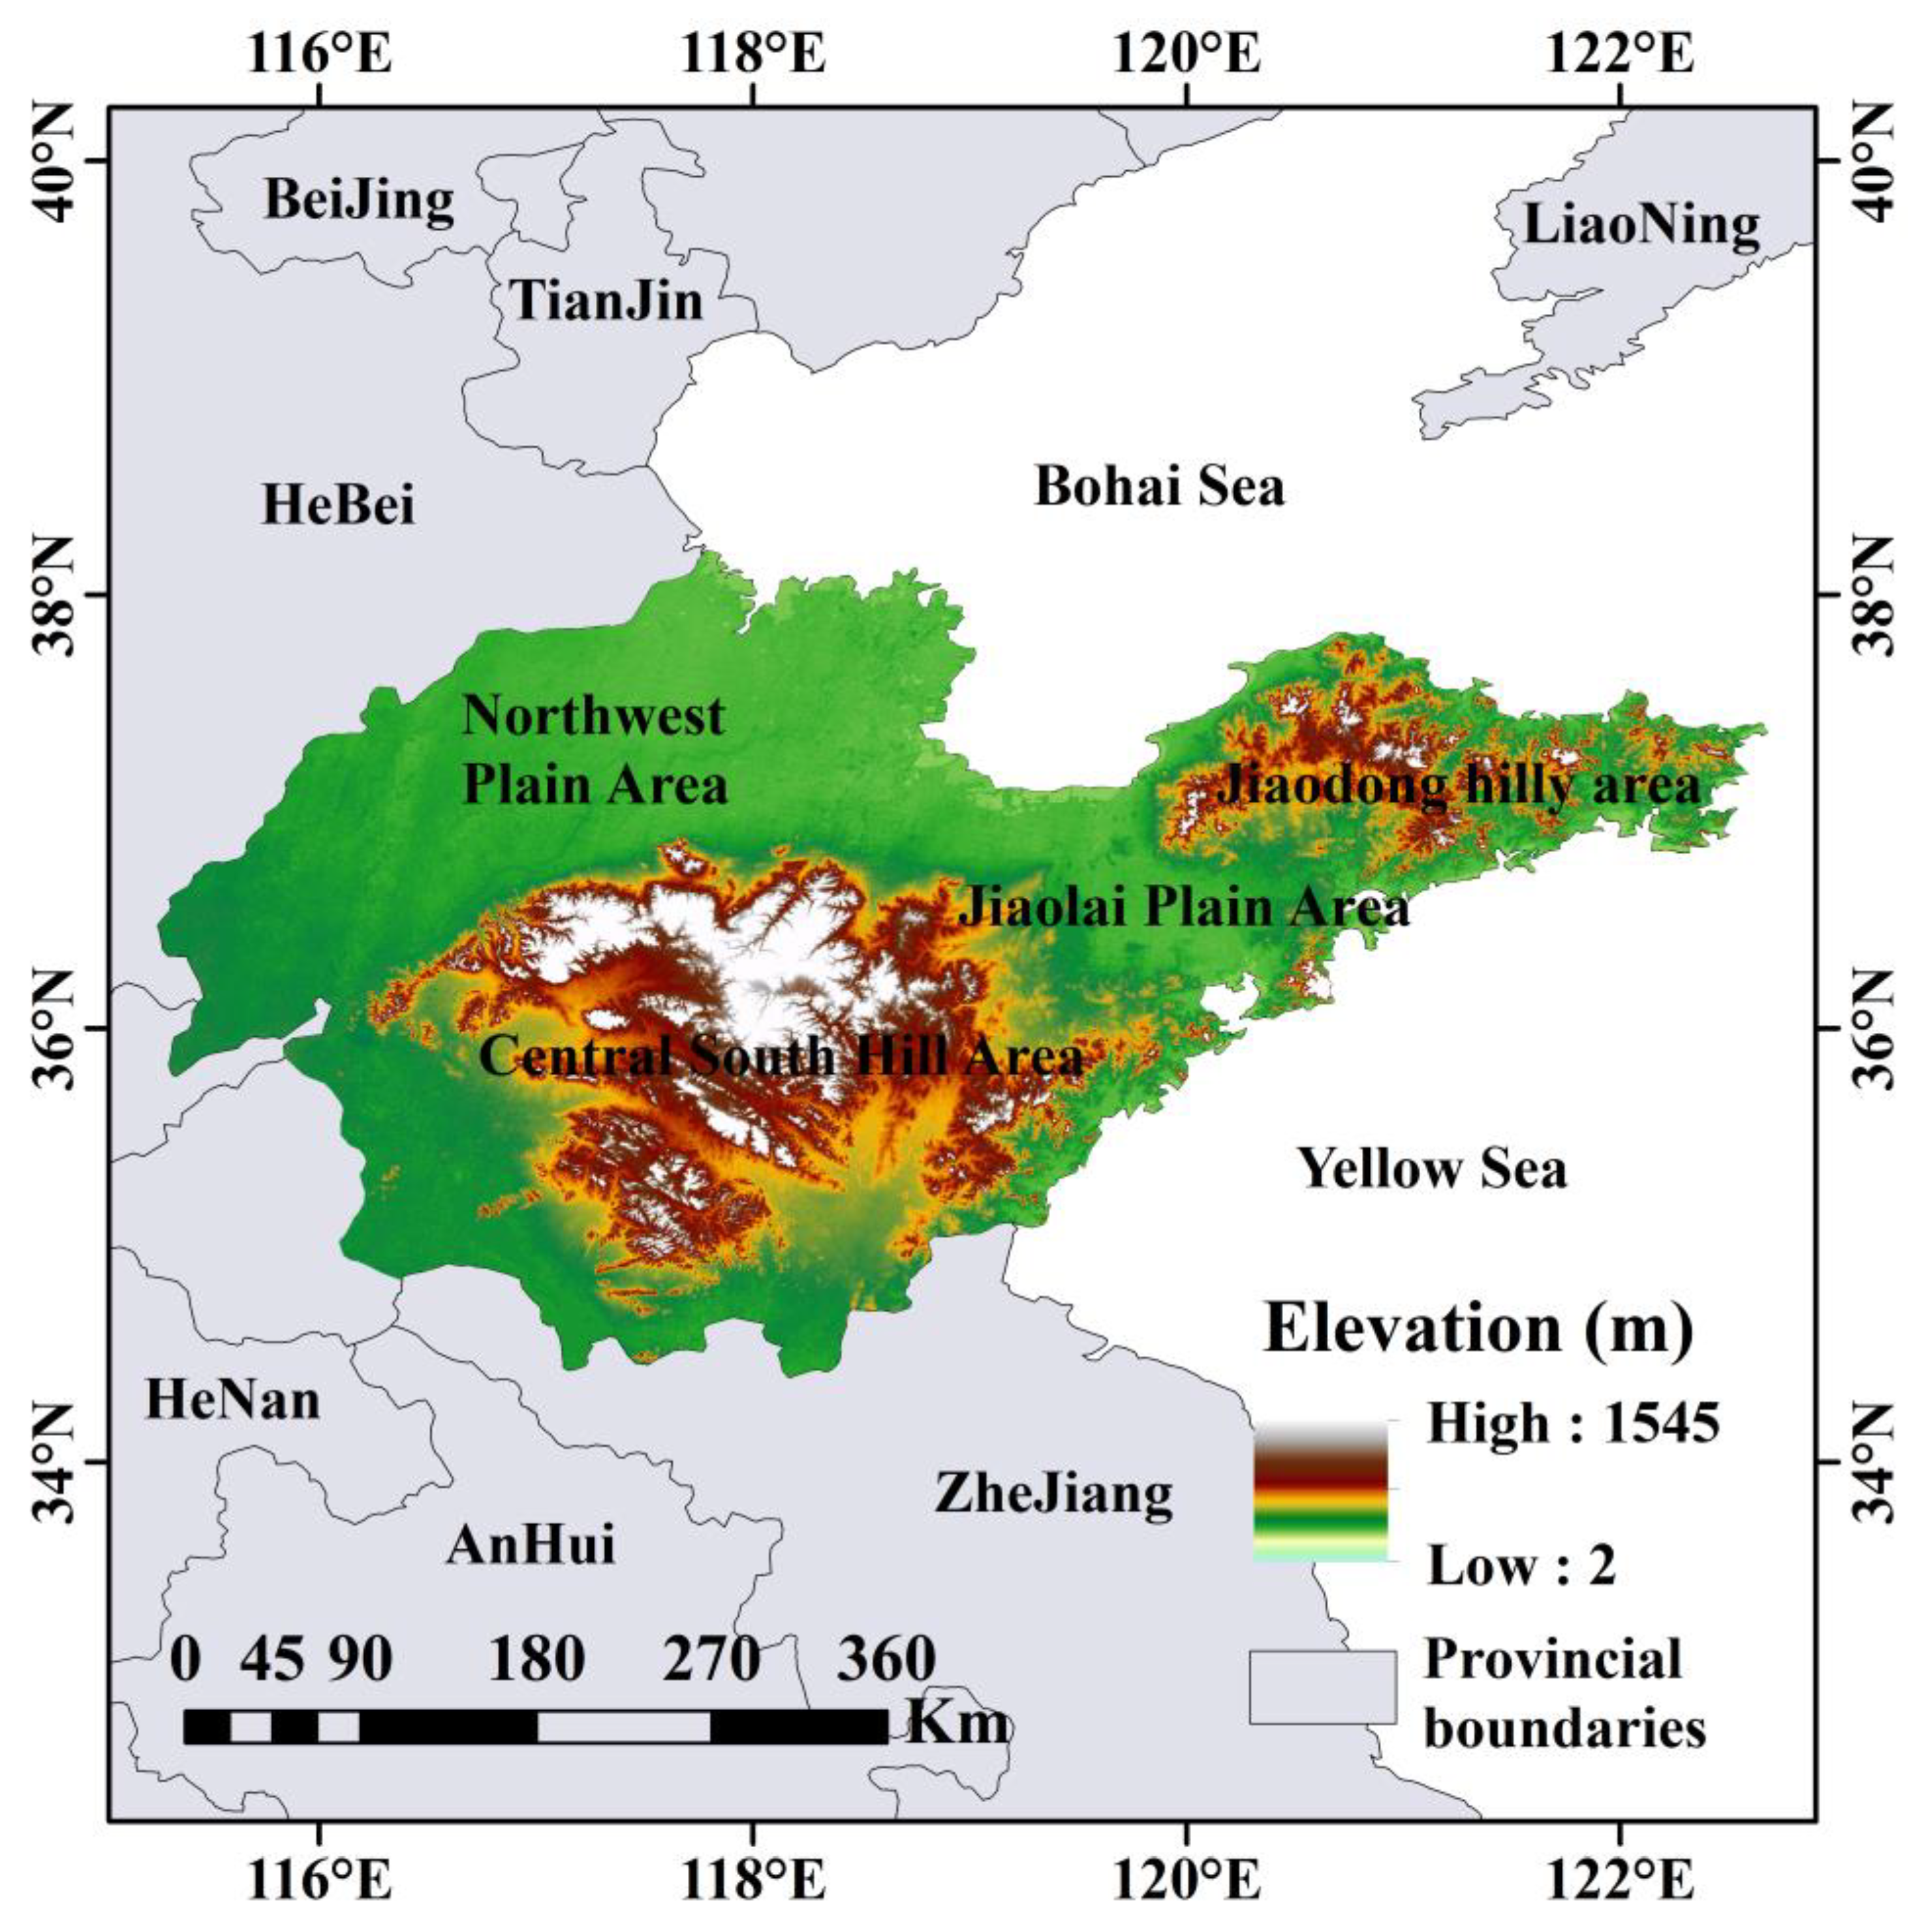
2.1. Research Area
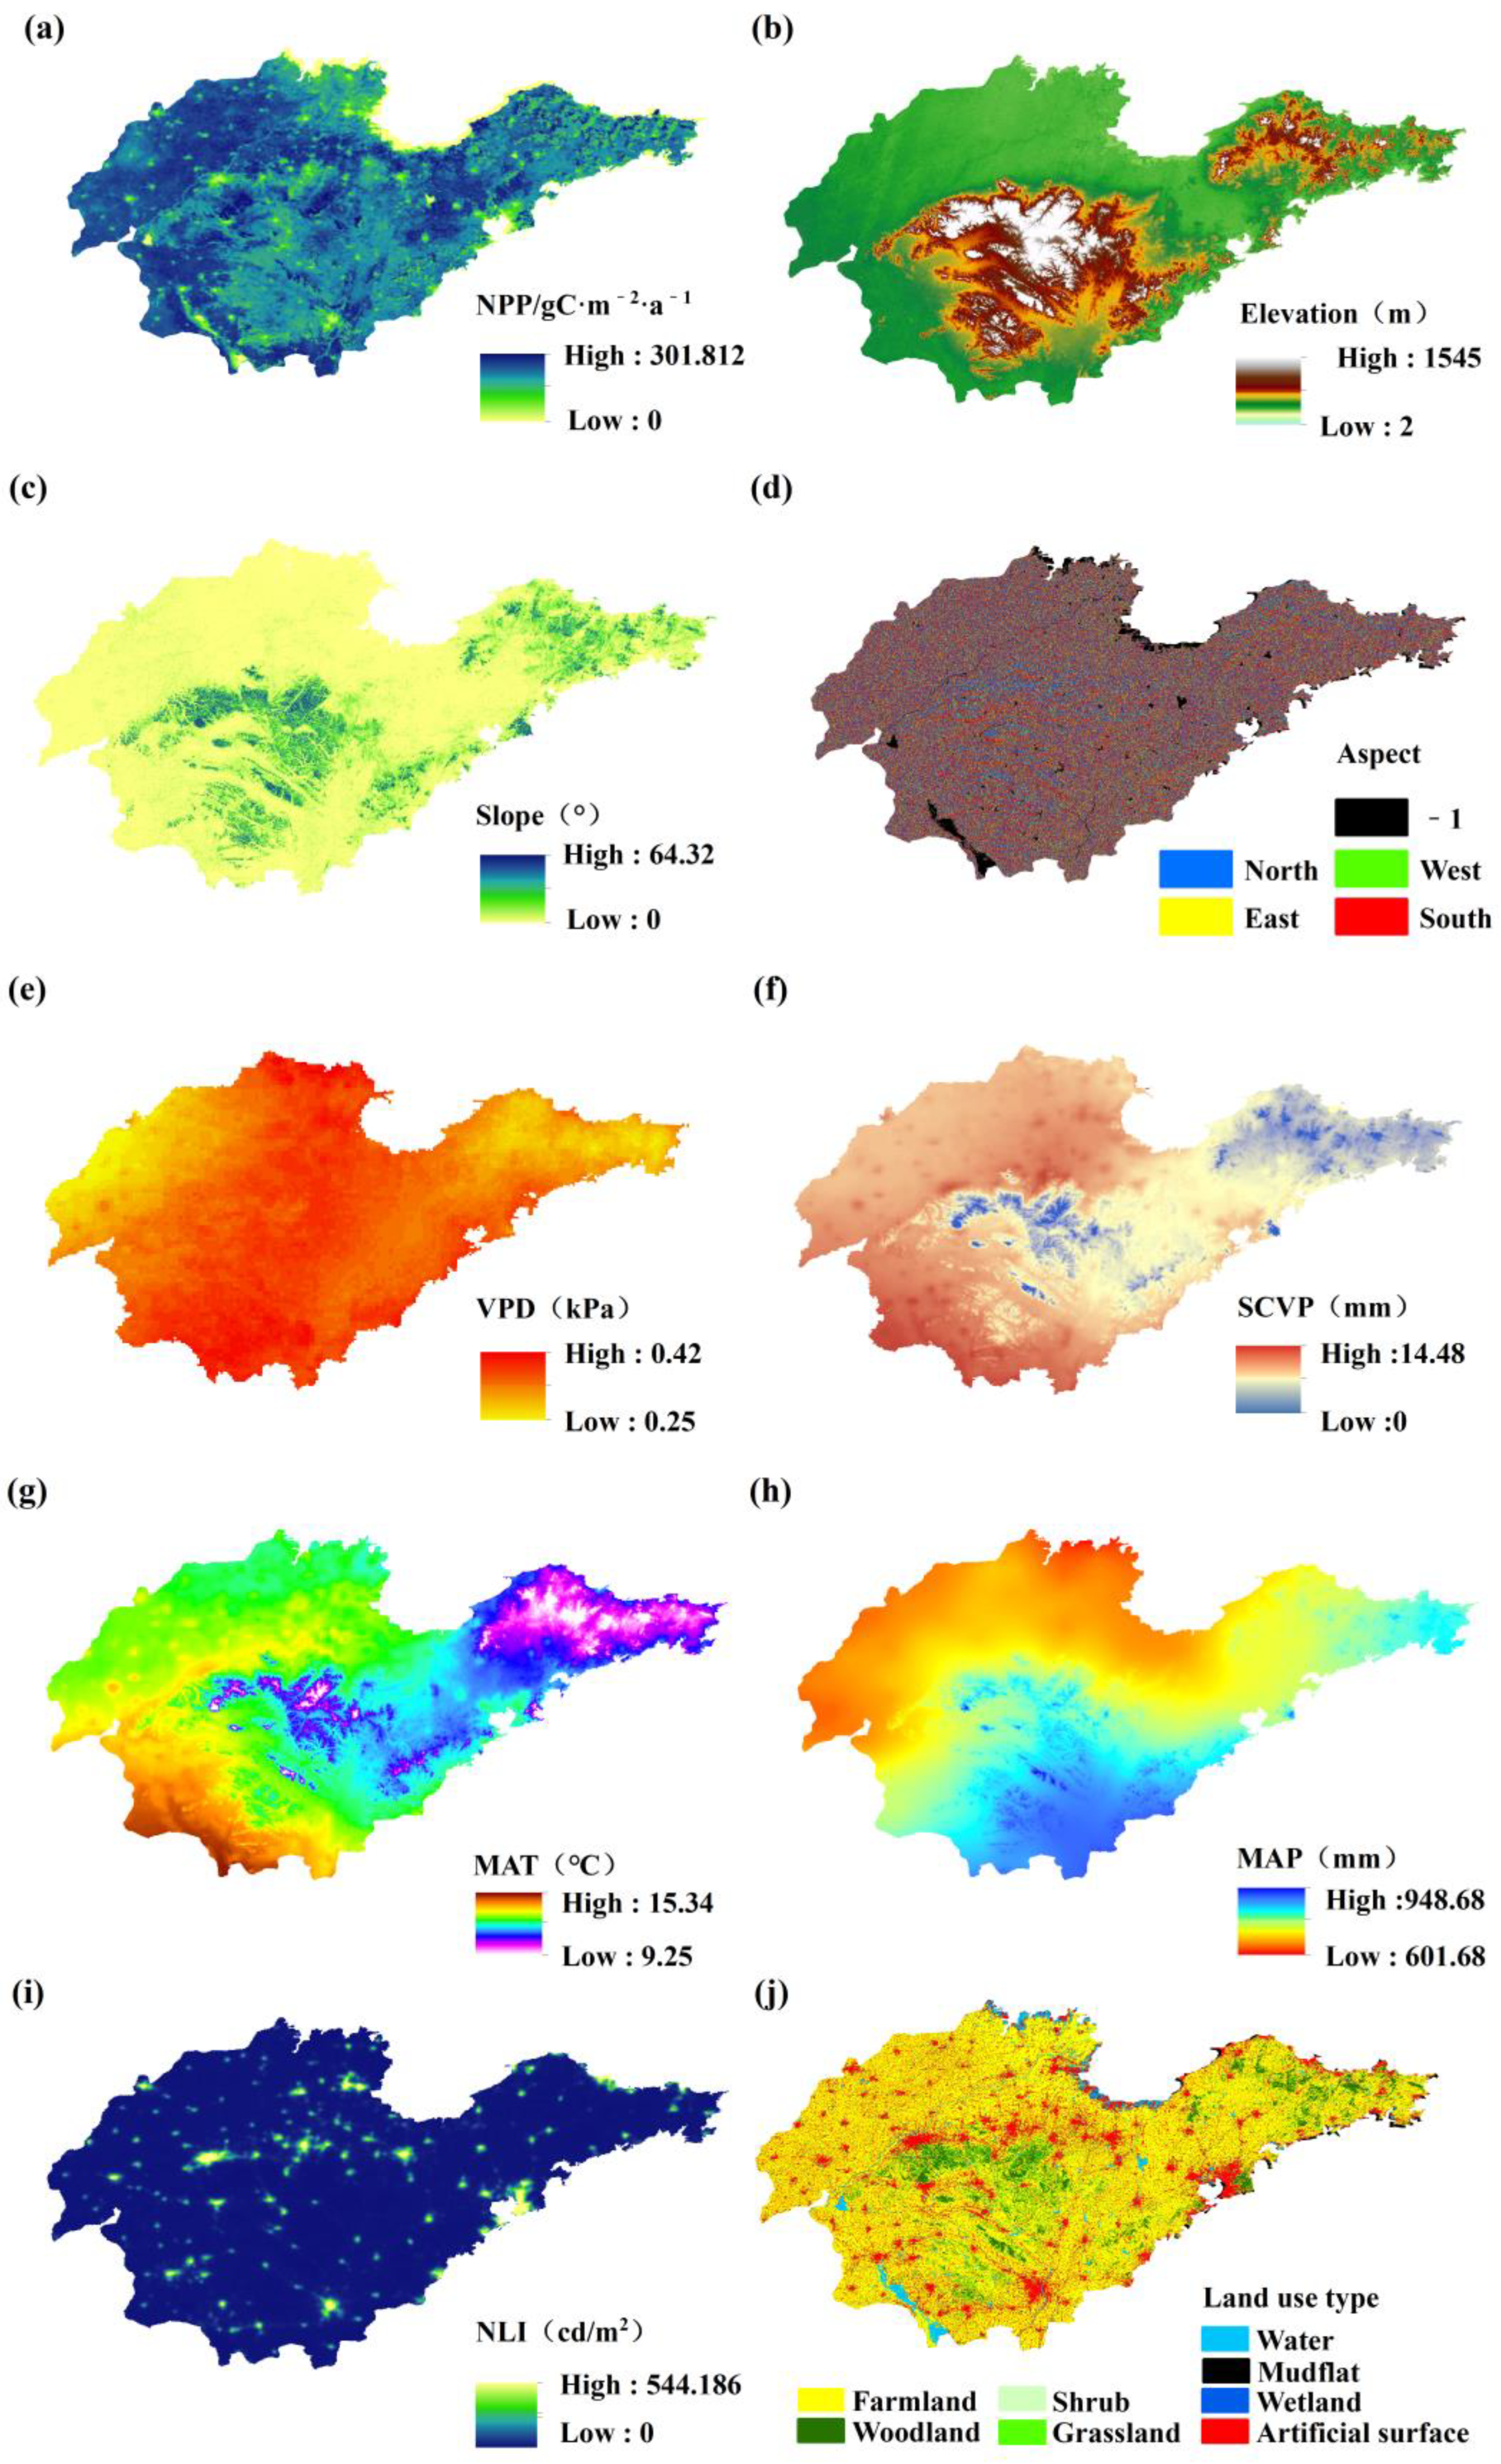
2.2. Data Sources
2.3. Methods
2.3.1. Land Use Change Analysis
2.3.2. CASA Model
2.3.3. Analysis of Trend and Coefficient of Variation
2.3.4. Hurst Index
2.3.5. Geographic Detector
- (1)
- Factor detection: Factor detection is an analysis of the single factor interpretation power of vegetation NPP that explores various influencing factors in the geographic detector [18,40,41]. Firstly, we conducted a spatial overlay analysis of the vegetation NPP layer and driving factor layer in the study area. Secondly, we adopted three discretization methods, namely natural, standard deviation, and equal spacing, to convert continuous data into categorical data to divide the driving factors of different spatial categories into sub-regions or categories. To detect the relative importance of each driving factor through significance testing, we use the size of q value to represent the explanatory power of driving factors on vegetation NPP. In the calculation process, we chose the optimal discretization method (equidistant) to limit uncertainty. The formula for calculating the q value of each explanatory variable is as follows:In the formula, N represents the total number of samples in the entire study area, σ2 represents the global variance of the response variable, L is the number of layers (regions), and Nh is the number of samples in layer h. σh2 represents the variance of the predicted variable X in response to the variable in layer h. The value range of the q statistic is from 0 to 1, where the larger the q value of a single detection factor, the greater its impact on vegetation NPP changes and the greater the spatial heterogeneity of the explanatory variable (Y) along the predictive variable layer (X).
- (2)
- Interaction detection: Interactive detection is suitable for identifying the heterogeneity of vegetation NPP spatial changes caused by the combination of detection driving factors and . The five outcomes of the interaction are described by Wang et al. [41]. This study uses the trend of the NPP change in the SDHP from 2000 to 2020 as the independent variable Y and 9 driving factors, such as terrain, climate, and human activities, as detection factor X.
- (3)
- Ecological detector: This model aims to determine whether there is a significant difference in the impact of any two factors on the evolution of vegetation NPP and determine whether the influence of X1 on the spatial distribution of NPP is more important than X2, measured through the F-statistic.
- (4)
- Risk detector: According to the risk detector, it is possible to quantitatively analyze the regions with differences in vegetation NPP change characteristics, that is, the differences in the impact of a driving factor on vegetation NPP at two different levels. The t-statistics are used to test the significance of risk detection. Therefore, we can determine the appropriate range or type of driving factors that are conducive to the growth of vegetation NPP. The range of driving factors with the highest average NPP value is suitable for vegetation NPP growth.
3. Results
3.1. Analysis of LUCC in the SDHP
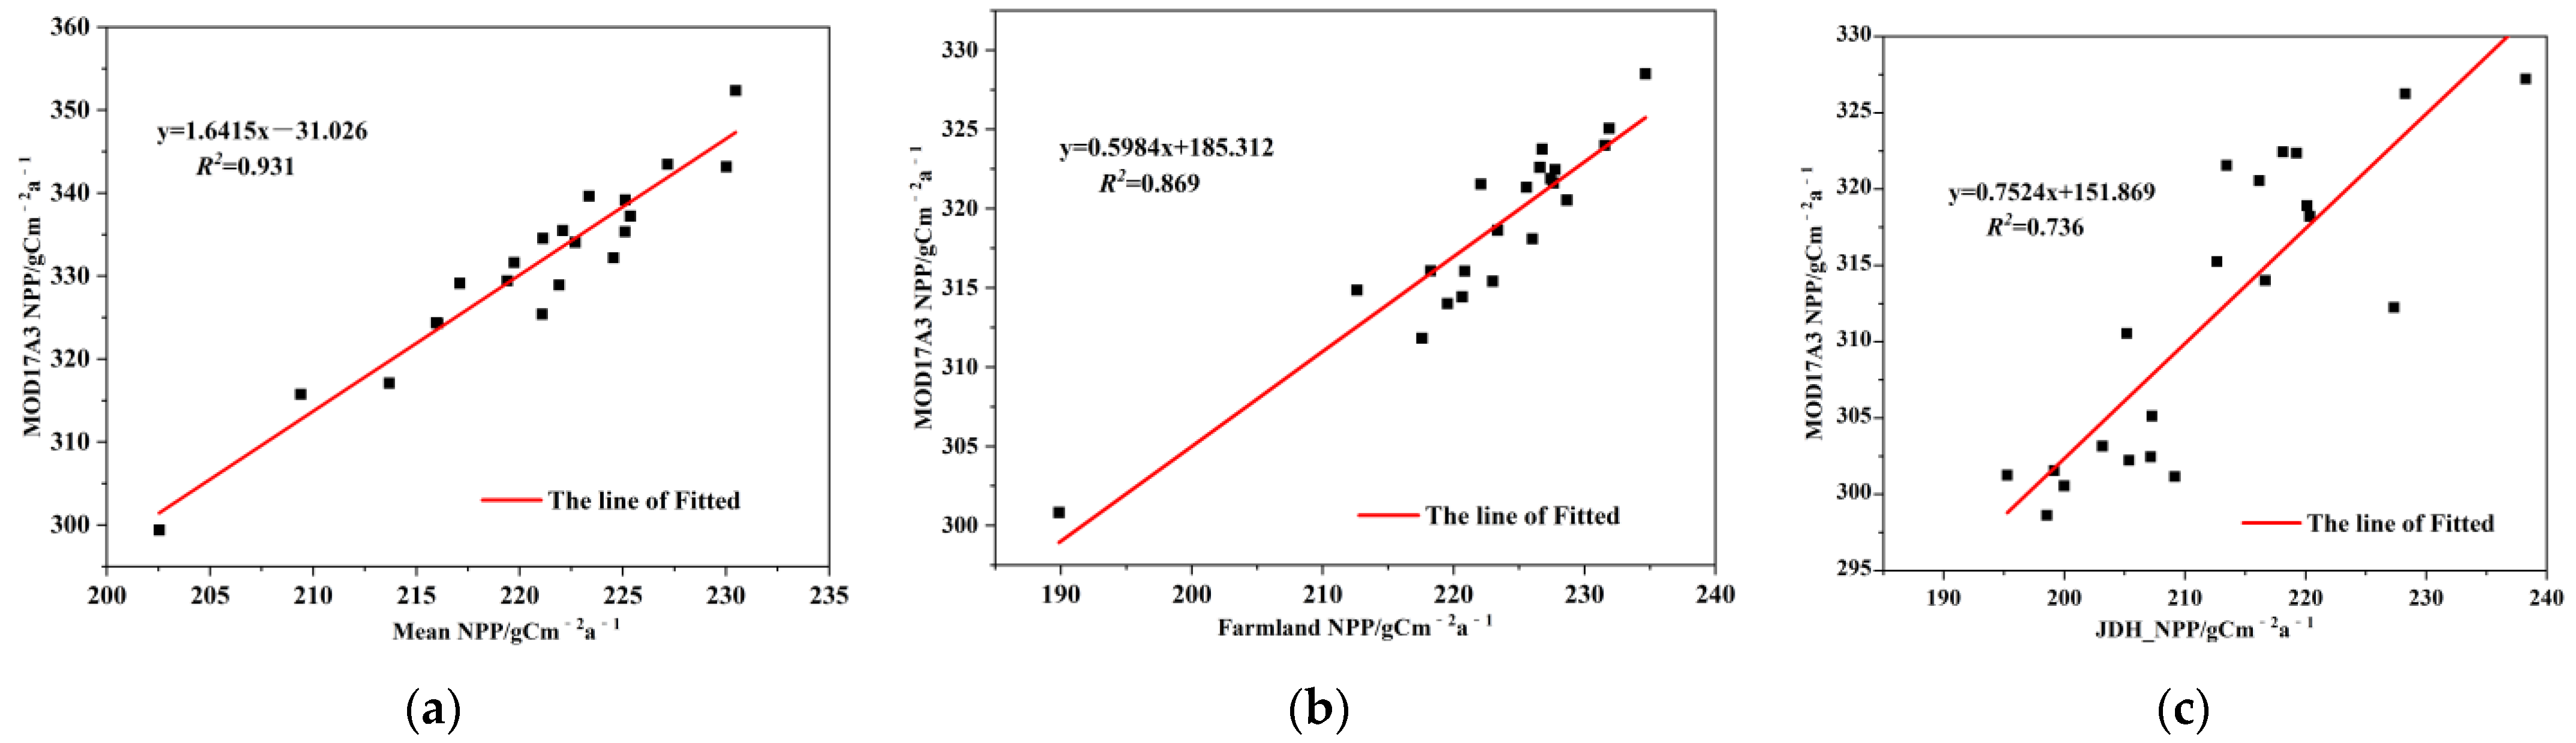
3.2. CASA Model Accuracy Verification
3.3. The Characteristics of NPP’s Spatiotemporal Variation
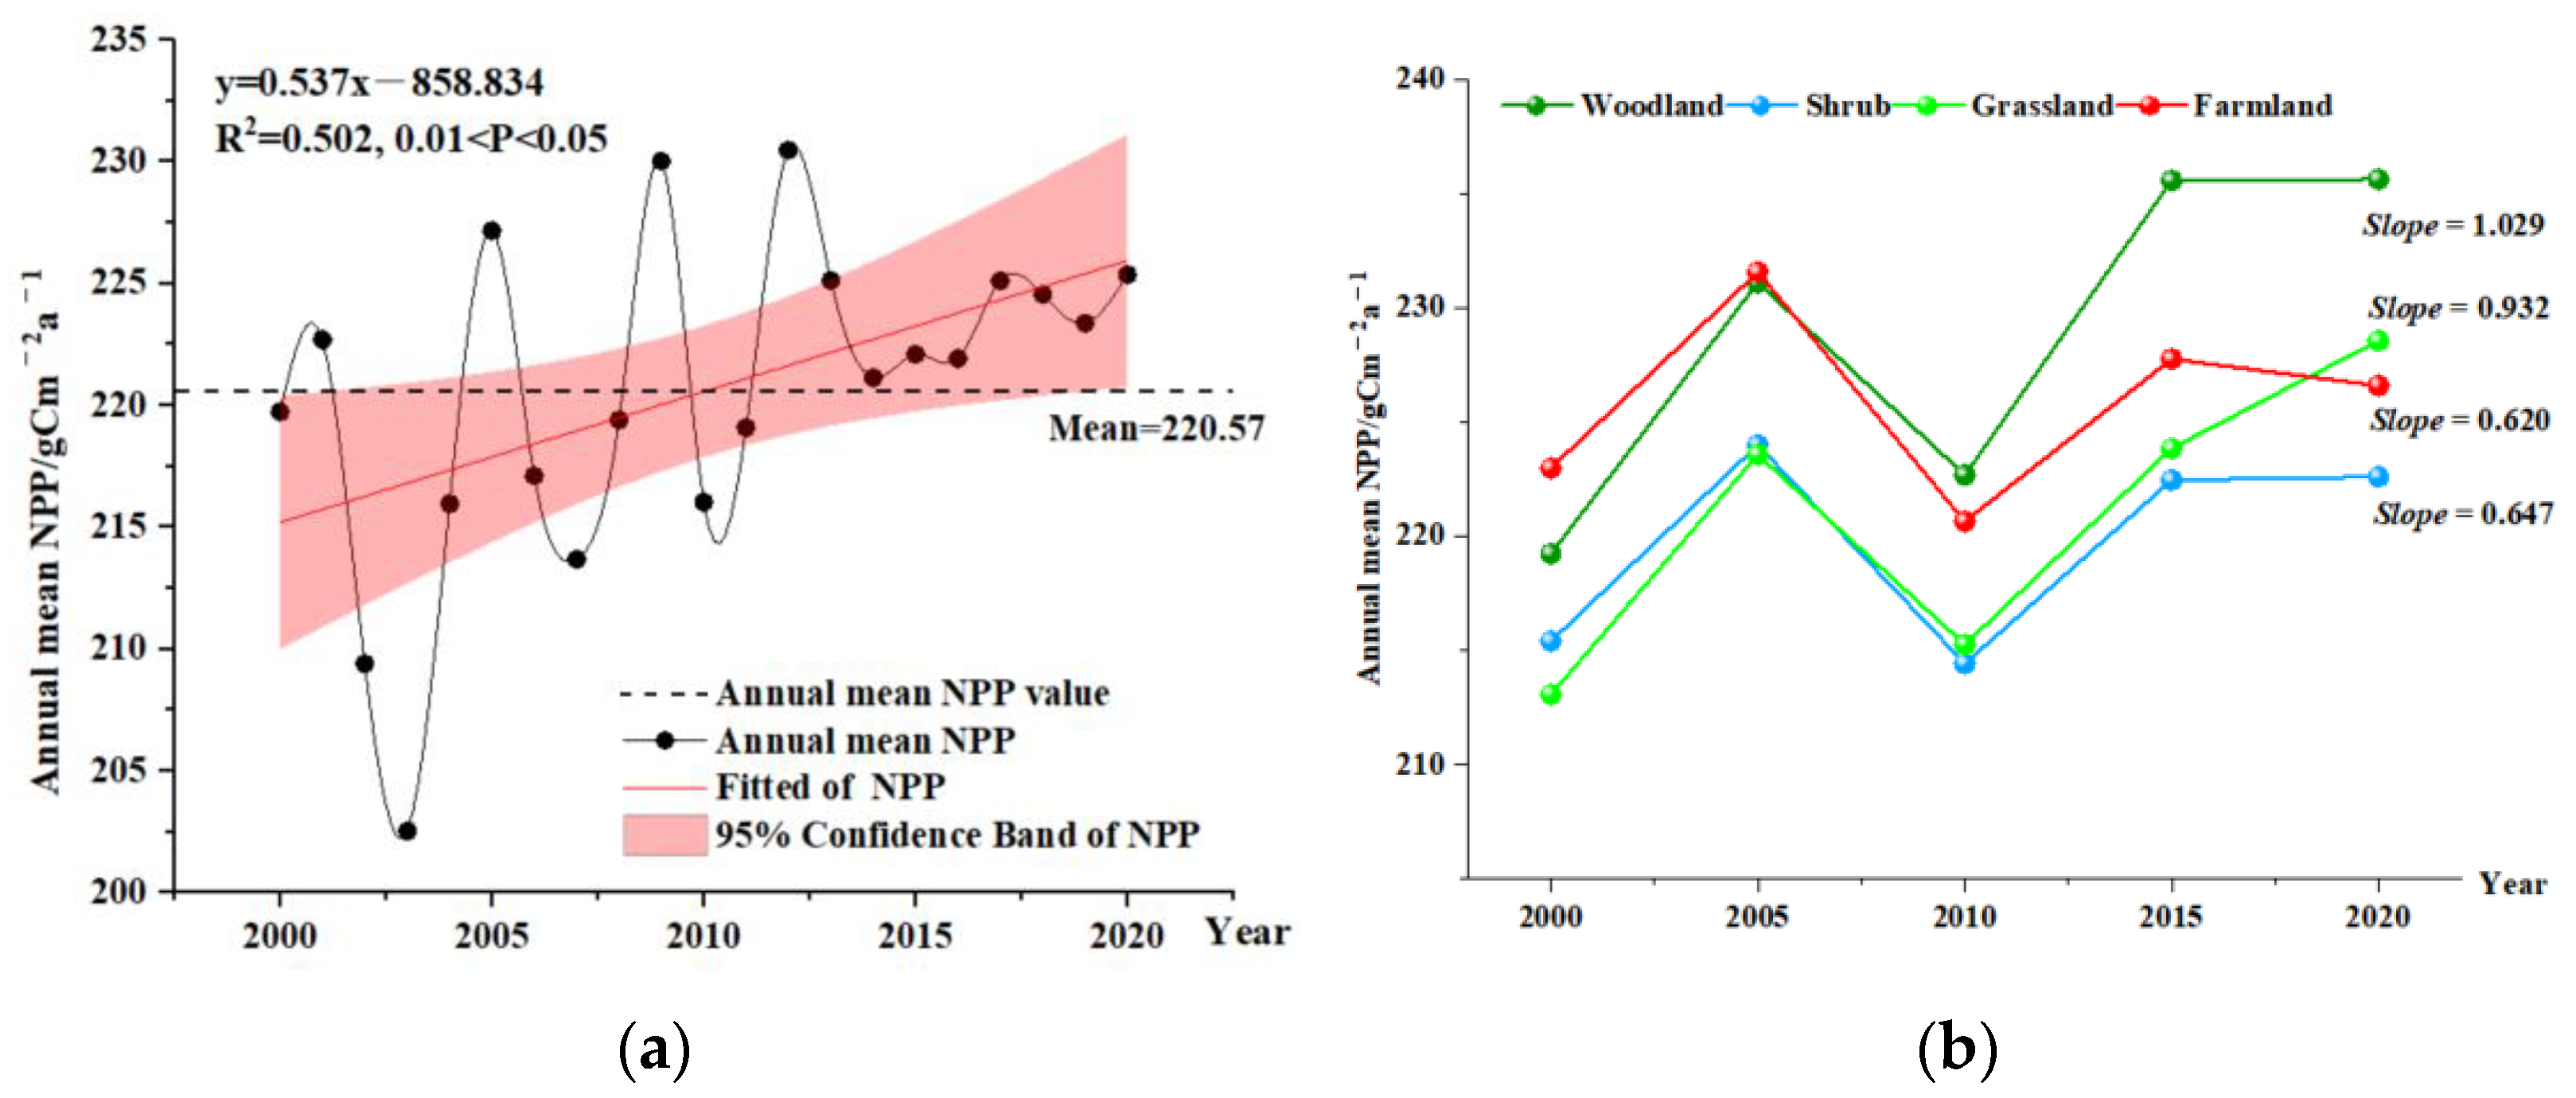
3.3.1. The Temporal Variation of Vegetation NPP
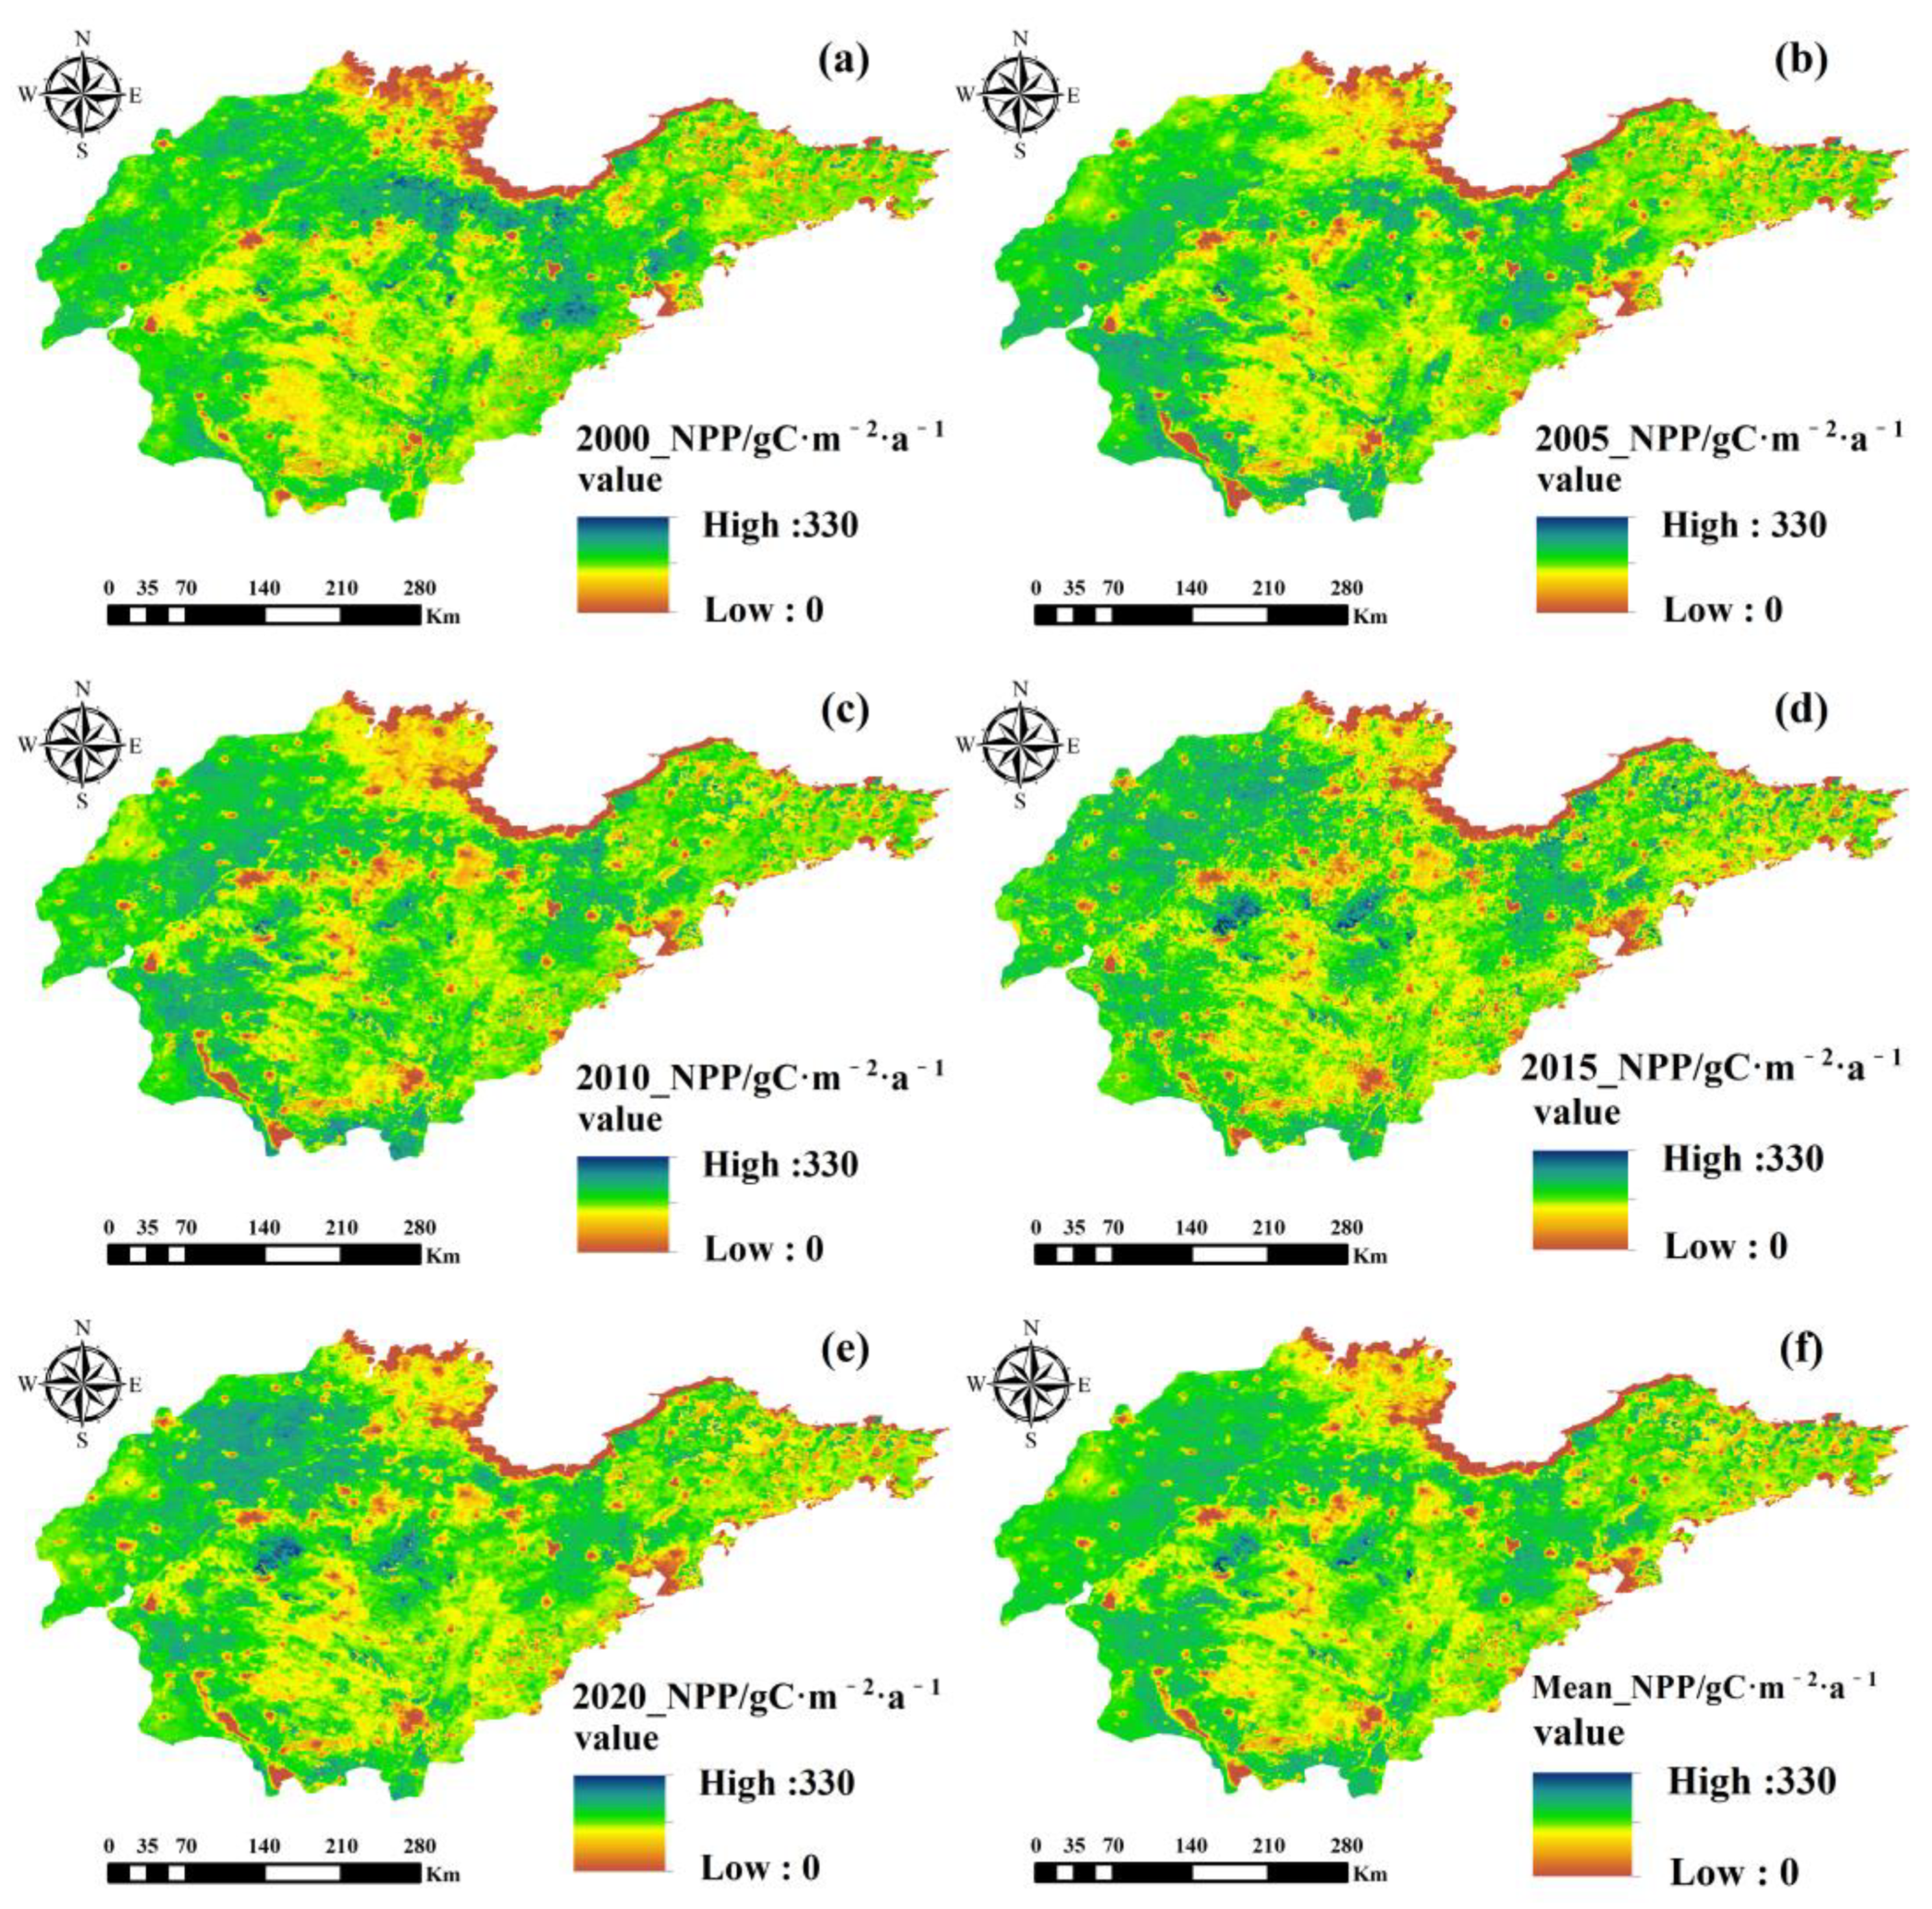
3.3.2. The Spatial Distribution of Vegetation NPP
3.4. The Spatiotemporal Variation Index and Spatial Pattern of NPP
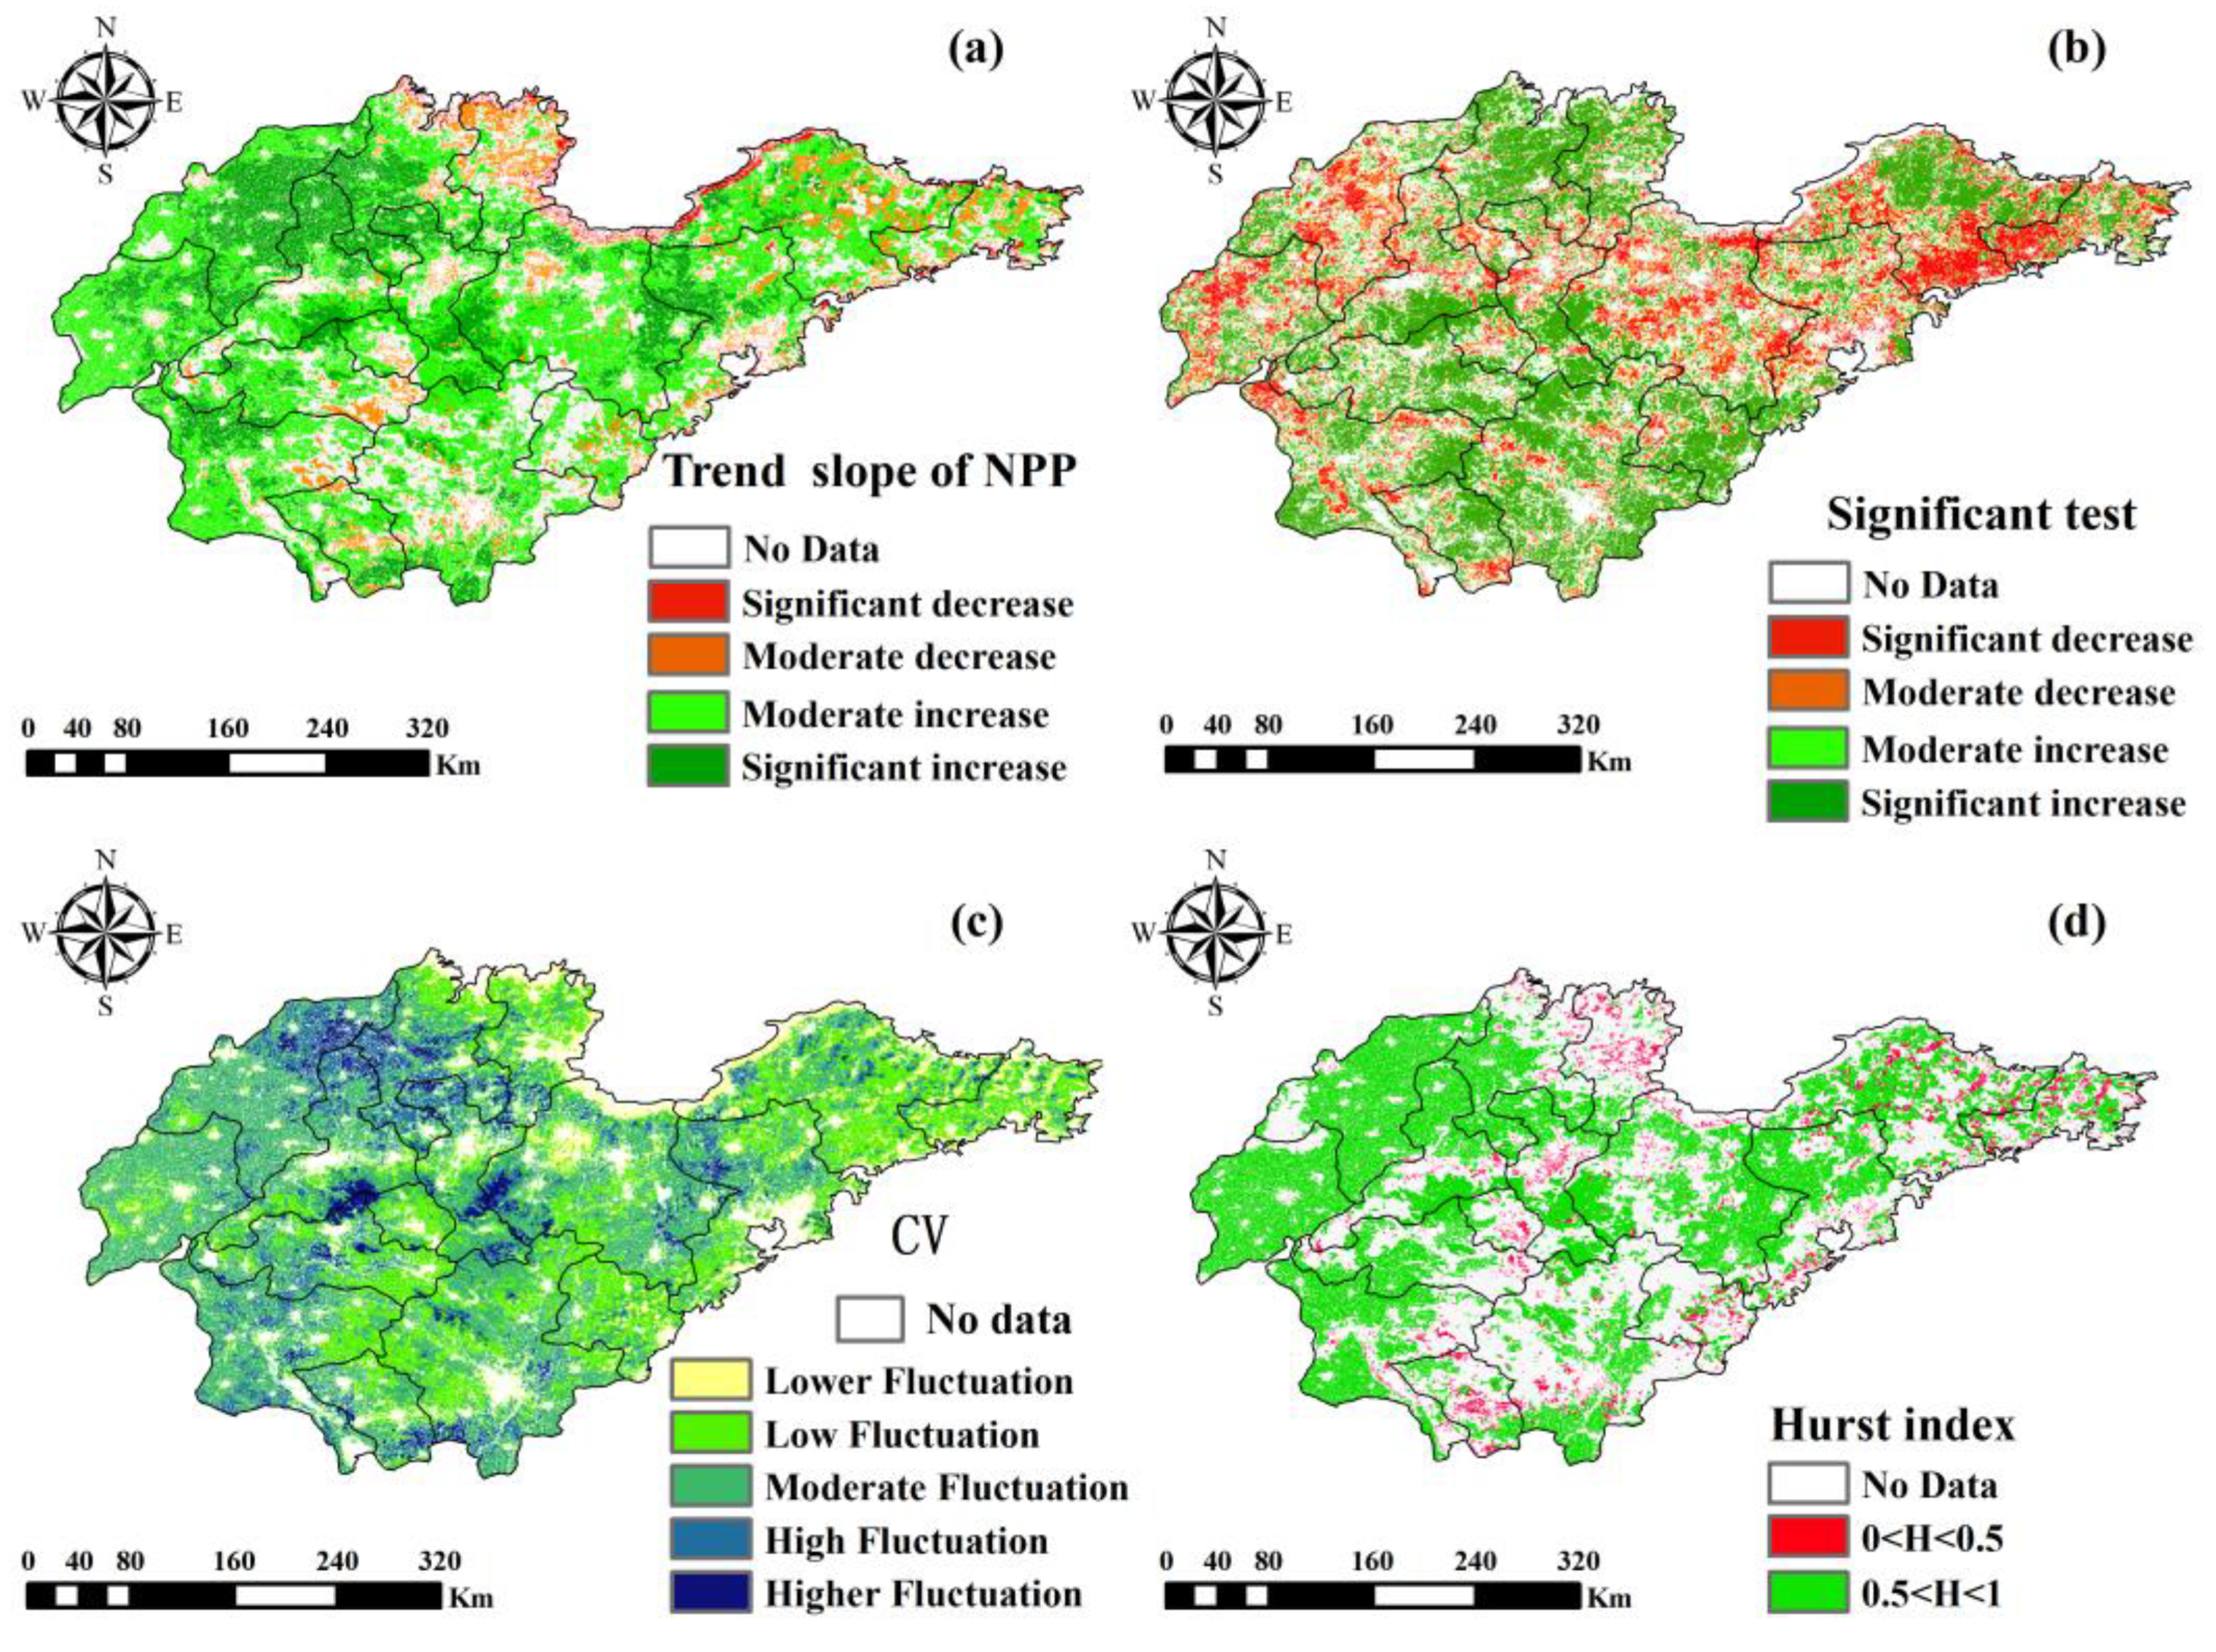
3.4.1. The Trend and Significance of NPP Changes
3.4.2. Characteristics of NPP Spatial Coefficient of Variation
3.4.3. Prediction of NPP Change Trend
3.5. Analysis of Driving Factors for Spatiotemporal Differentiation of NPP
4. Discussion
4.1. Analysis of Spatio-Temporal Dynamics in Vegetation NPP
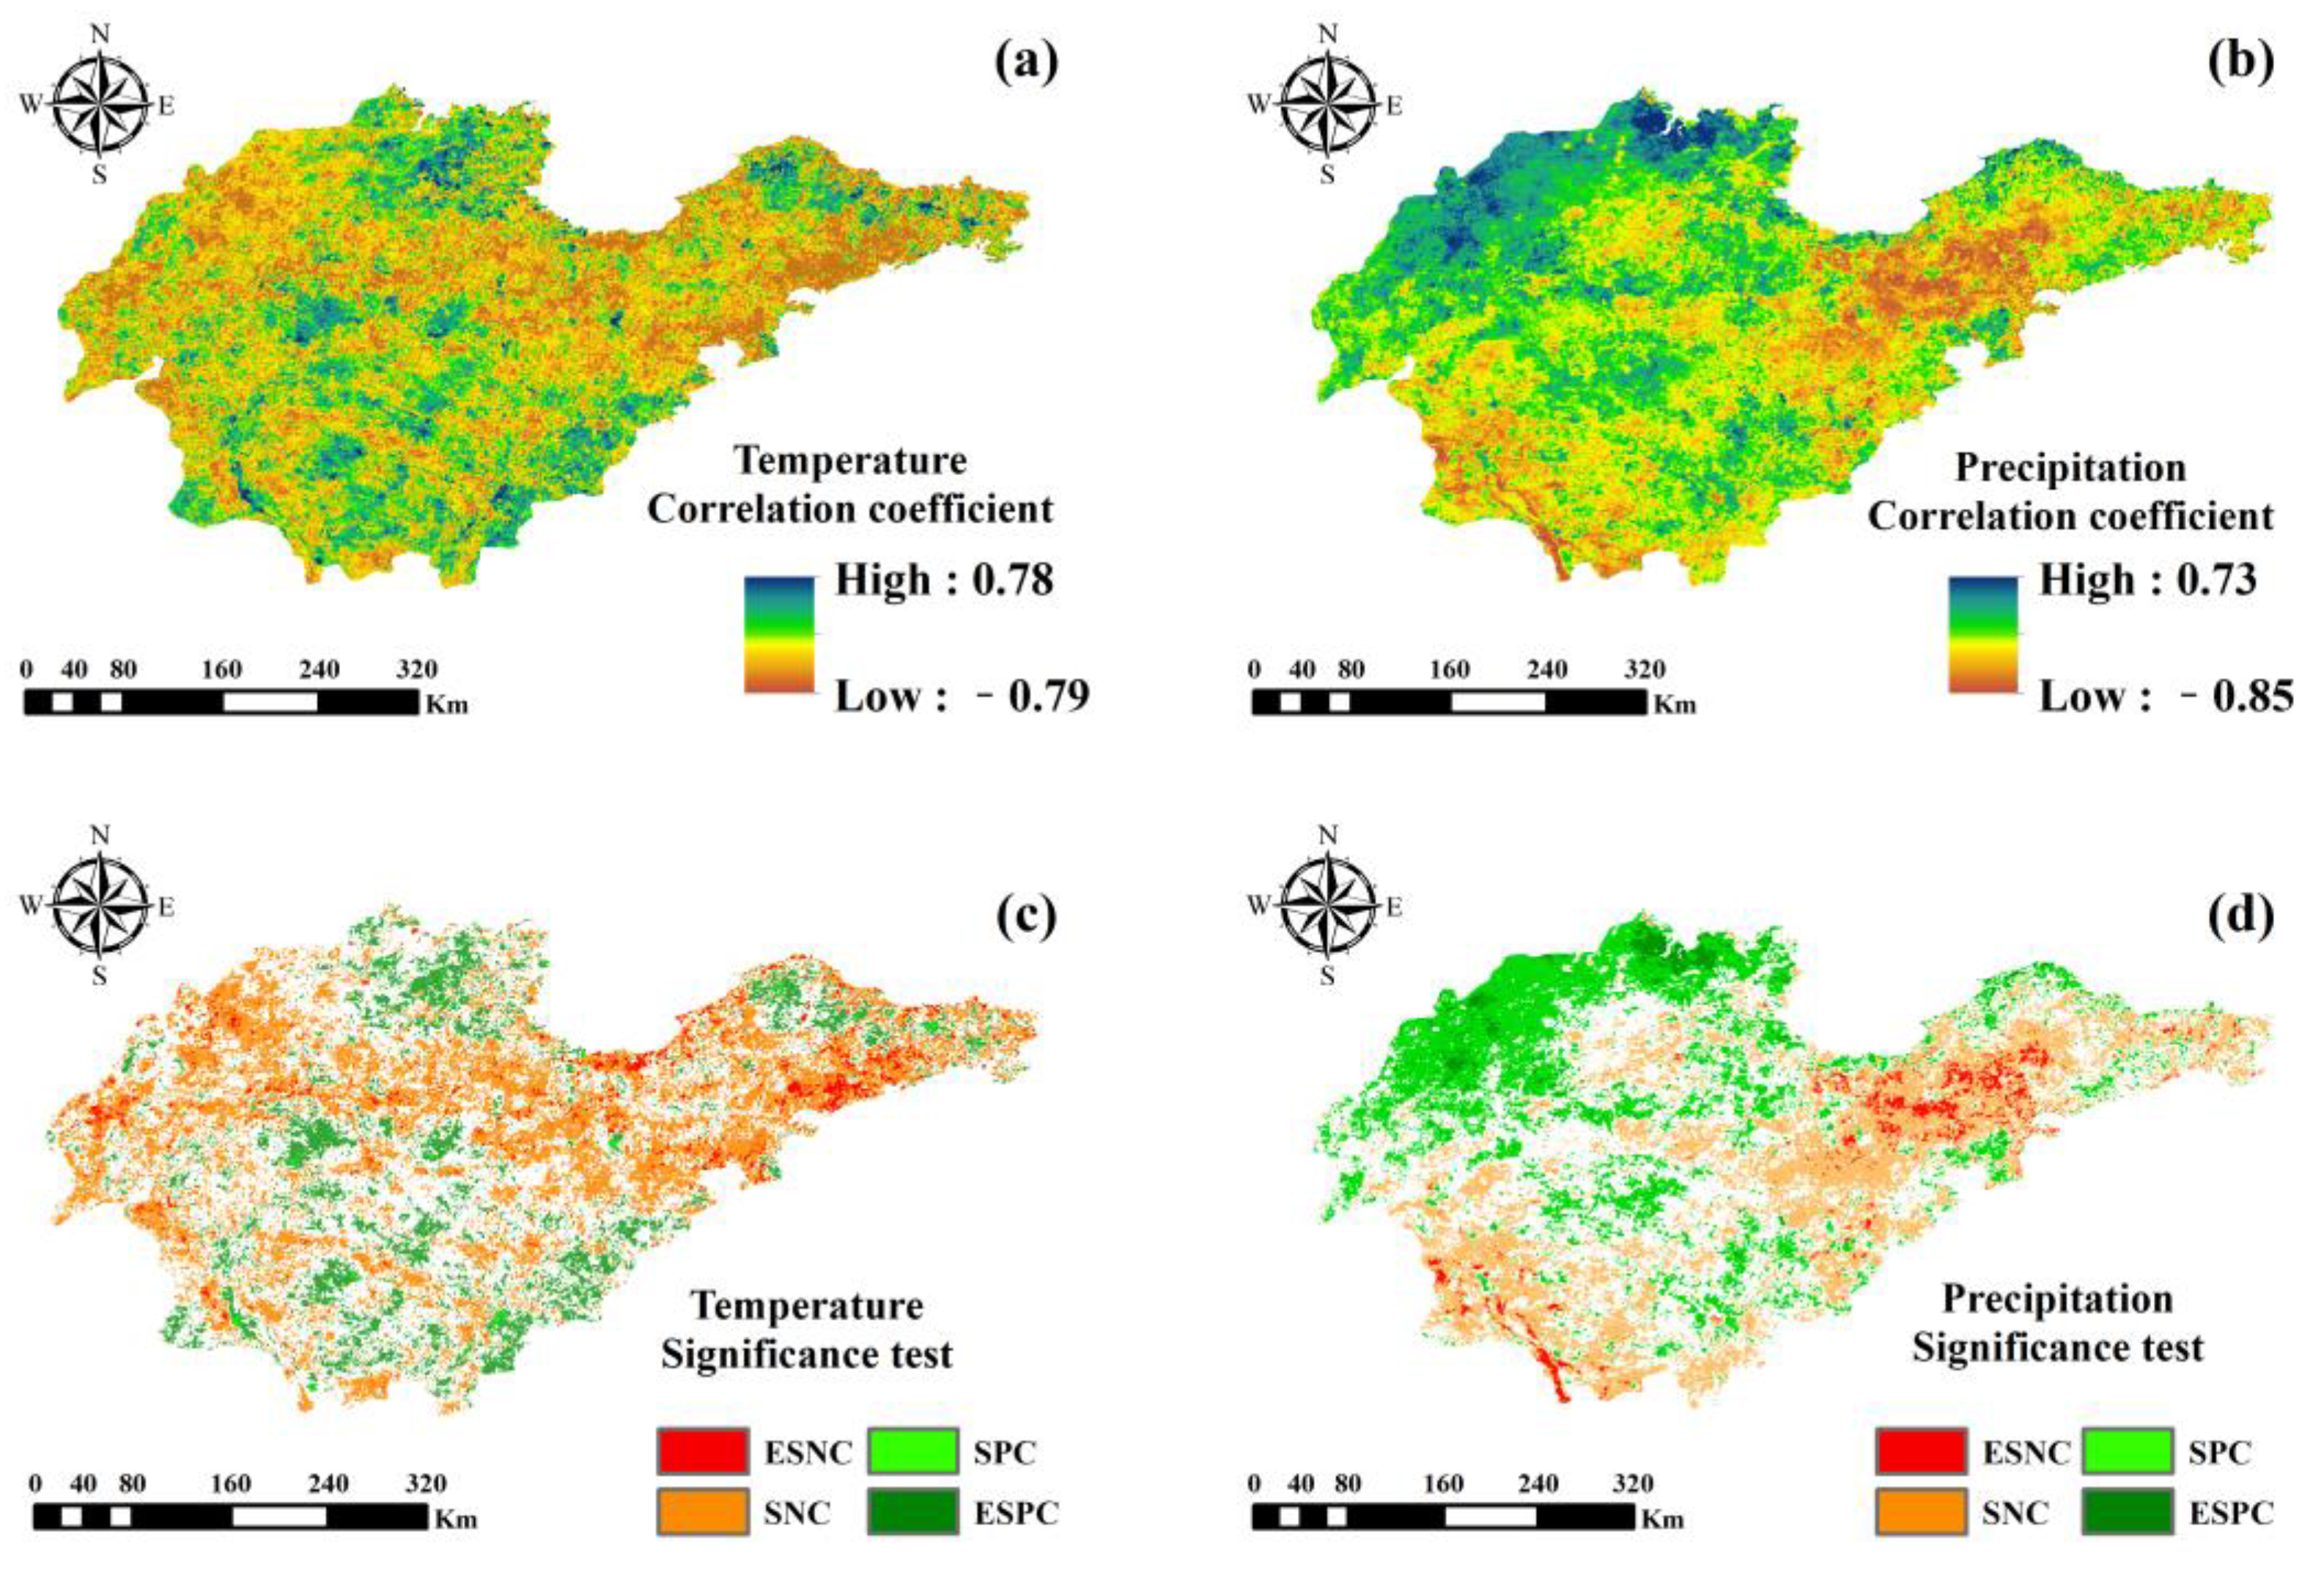
4.2. NPP’s Response to Climate-Related Factors
4.3. Impact of Human Activities on NPP Changes
4.4. Interactions between Climate Change and Human Activities on NPP
4.5. Limitations and Prospects
5. Conclusions
- (1)
- Within the hilly and plain regions of Shandong Province, farmland represents the most expansive land use type. From 2000 to 2020, a gradual shift in land use dynamics occurred, marked by a consistent decline in the area dedicated to farmland and grasslands. In contrast, there was a concurrent increase in the area allocated to other land use types, including forests, shrubs, and water bodies. Over the course of twenty years, the average net primary productivity (NPP) of vegetation in these areas was calculated to be 220.6 ± 6.6 g C·m−2·a−1, demonstrating a modest yet progressive increase, with an annual growth rate of 0.537 g C·m−2·a−1. Nonetheless, it is essential to highlight that this upward trend exhibits significant variability, underlining the presence of substantial fluctuations within the overall pattern of vegetation NPP growth.
- (2)
- The spatiotemporal differentiation features of NPP in Shandong Province’s hilly mountainous plain exhibit high variability in terms of space. The entire vegetation NPP value is steadily growing from the coast to the interior. The degree of spatial distribution variation is low in the southeast and high in the northwest. This can be primarily attributed to the high instability of NPP in plain agriculture, while the NPP of vegetation in hilly and mountainous areas remains relatively stable. However, the future NPP in the central and southern mountainous areas, as well as the JDH areas, will have weak anti-continuity alterations, with an emphasis on development land and its surroundings.
- (3)
- With an explanatory power of more than 45%, the land use change and night light index have the most effects on the variation of vegetation NPP in Shandong’s plains and hilly regions. Furthermore, q values for annual average temperature, yearly average precipitation, and seasonal precipitation coefficient of variation are 0.301, 0.393, and 0.378, respectively, suggesting that these climatic factors also have a significant role in NPP changes. Thus, in Shandong’s plain and hilly regions, vegetation NPP variations are mostly caused by human activity.
Author Contributions
Funding
Data Availability Statement
Acknowledgments
Conflicts of Interest
References
- Cao, D.; Zhang, J.; Zhang, T.; Yao, F.; Ji, R.; Zi, S.; Li, H.; Cheng, Q. Spatiotemporal Variations and Driving Factors of Global Terrestrial Vegetation Productivity Gap under the Changing of Climate, CO2, Landcover and N Deposition. Sci. Total Environ. 2023, 880, 162753. [Google Scholar] [CrossRef] [PubMed]
- Bejagam, V.; Sharma, A.; Wei, X. Projected Decline in the Strength of Vegetation Carbon Sequestration under Climate Change in India. Sci. Total Environ. 2024, 916, 170166. [Google Scholar] [CrossRef]
- Lyu, J.; Fu, X.; Lu, C.; Zhang, Y.; Luo, P.; Guo, P.; Huo, A.; Zhou, M. Quantitative Assessment of Spatiotemporal Dynamics in Vegetation NPP, NEP and Carbon Sink Capacity in the Weihe River Basin from 2001 to 2020. J. Clean. Prod. 2023, 428, 139384. [Google Scholar] [CrossRef]
- Feng, H.; Kang, P.; Deng, Z.; Zhao, W.; Hua, M.; Zhu, X.; Wang, Z. The Impact of Climate Change and Human Activities to Vegetation Carbon Sequestration Variation in Sichuan and Chongqing. Environ. Res. 2023, 238, 117138. [Google Scholar] [CrossRef]
- Mi, X.; Feng, G.; Hu, Y.; Zhang, J.; Chen, L.; Corlett, R.T.; Hughes, A.C.; Pimm, S.; Schmid, B.; Shi, S.; et al. The Global Significance of Biodiversity Science in China: An Overview. Natl. Sci. Rev. 2021, 8, nwab032. [Google Scholar] [CrossRef] [PubMed]
- Pan, Y.; Birdsey, R.A.; Fang, J.; Houghton, R.; Kauppi, P.E.; Kurz, W.A.; Phillips, O.L.; Shvidenko, A.; Lewis, S.L.; Canadell, J.G.; et al. A large and persistent carbon sink in the world’s forests. Science 2011, 333, 988–993. [Google Scholar] [CrossRef]
- Beck, P.S.A.; Goetz, S.J. Satellite Observations of High Northern Latitude Vegetation Productivity Changes between 1982 and 2008: Ecological Variability and Regional Differences. Environ. Res. Lett. 2011, 6, 045501. [Google Scholar] [CrossRef]
- Chen, S.; Ma, M.; Wu, S.; Tang, Q.; Wen, Z. Topography Intensifies Variations in the Effect of Human Activities on Forest NPP across Altitude and Slope Gradients. Environ. Dev. 2023, 45, 100826. [Google Scholar] [CrossRef]
- Zhang, J.; Zhang, Y.; Qin, Y.; Lu, X.; Cao, J. The Spatiotemporal Pattern of Grassland NPP in Inner Mongolia Was More Sensitive to Moisture and Human Activities than That in the Qinghai-Tibetan Plateau. Glob. Ecol. Conserv. 2023, 48, e02709. [Google Scholar] [CrossRef]
- Peng, Q.; Wang, R.; Jiang, Y.; Li, C. Contributions of Climate Change and Human Activities to Vegetation Dynamics in Qilian Mountain National Park, Northwest China. Glob. Ecol. Conserv. 2021, 32, e01947. [Google Scholar] [CrossRef]
- Robles, M.; Peyron, O.; Brugiapaglia, E.; Ménot, G.; Dugerdil, L.; Ollivier, V.; Ansanay-Alex, S.; Develle, A.-L.; Tozalakyan, P.; Meliksetian, K.; et al. Impact of Climate Changes on Vegetation and Human Societies during the Holocene in the South Caucasus (Vanevan, Armenia): A Multiproxy Approach Including Pollen, NPPs and brGDGTs. Quat. Sci. Rev. 2022, 277, 107297. [Google Scholar] [CrossRef]
- Ge, W.; Deng, L.; Wang, F.; Han, J. Quantifying the Contributions of Human Activities and Climate Change to Vegetation Net Primary Productivity Dynamics in China from 2001 to 2016. Sci. Total Environ. 2021, 773, 145648. [Google Scholar] [CrossRef]
- Qi, S.; Chen, S.; Long, X.; An, X.; Zhang, M. Quantitative Contribution of Climate Change and Anthropological Activities to Vegetation Carbon Storage in the Dongting Lake Basin in the Last Two Decades. Adv. Space Res. 2023, 71, 845–868. [Google Scholar] [CrossRef]
- Liu, Y.; Xu, M.; Guo, B.; Yang, G.; Li, J.; Yu, Y. Changes in the Vegetation NPP of Mainland China under the Combined Actions of Climatic-Socioeconomic Factors. Forests 2023, 14, 2341. [Google Scholar] [CrossRef]
- Qin, Z.; Sha, Z. Modeling the Impact of Urbanization and Climate Changes on Terrestrial Vegetation Productivity in China by a Neighborhood Substitution Analysis. Ecol. Model. 2023, 482, 110405. [Google Scholar] [CrossRef]
- Venkatesh, K.; John, R.; Chen, J.; Jarchow, M.; Amirkhiz, R.G.; Giannico, V.; Saraf, S.; Jain, K.; Kussainova, M.; Yuan, J. Untangling the Impacts of Socioeconomic and Climatic Changes on Vegetation Greenness and Productivity in Kazakhstan. Environ. Res. Lett. 2022, 17, 095007. [Google Scholar] [CrossRef]
- Chen, X.; Zhang, Y. Impacts of Climate, Phenology, Elevation and Their Interactions on the Net Primary Productivity of Vegetation in Yunnan, China under Global Warming. Ecol. Indic. 2023, 154, 110533. [Google Scholar] [CrossRef]
- Wu, Y.; Yang, J.; Li, S.; Guo, C.; Yang, X.; Xu, Y.; Yue, F.; Peng, H.; Chen, Y.; Gu, L.; et al. NDVI-Based Vegetation Dynamics and Their Responses to Climate Change and Human Activities from 2000 to 2020 in Miaoling Karst Mountain Area, SW China. Land 2023, 12, 1267. [Google Scholar] [CrossRef]
- Xue, Y.; Bai, X.; Zhao, C.; Tan, Q.; Li, Y.; Luo, G.; Wu, L.; Chen, F.; Li, C.; Ran, C.; et al. Spring Photosynthetic Phenology of Chinese Vegetation in Response to Climate Change and Its Impact on Net Primary Productivity. Agric. For. Meteorol. 2023, 342, 109734. [Google Scholar] [CrossRef]
- Piao, S.; Wang, X.; Park, T.; Chen, C.; Lian, X.; He, Y.; Bjerke, J.W.; Chen, A.; Ciais, P.; Tømmervik, H.; et al. Characteristics, Drivers and Feedbacks of Global Greening. Nat. Rev. Earth Environ. 2020, 1, 14–27. [Google Scholar] [CrossRef]
- Piao, S.; Friedlingstein, P.; Ciais, P.; Zhou, L.; Chen, A. Effect of Climate and CO2 Changes on the Greening of the Northern Hemisphere over the Past Two Decades. Geophys. Res. Lett. 2006, 33, L23402. [Google Scholar] [CrossRef]
- Xue, S.; Ma, B.; Wang, C.; Li, Z. Identifying Key Landscape Pattern Indices Influencing the NPP: A Case Study of the Upper and Middle Reaches of the Yellow River. Ecol. Model. 2023, 484, 110457. [Google Scholar] [CrossRef]
- Gong, X.; Li, Y.; Wang, X.; Zhang, Z.; Lian, J.; Ma, L.; Chen, Y.; Li, M.; Si, H.; Cao, W. Quantitative Assessment of the Contributions of Climate Change and Human Activities on Vegetation Degradation and Restoration in Typical Ecologically Fragile Areas of China. Ecol. Indic. 2022, 144, 109536. [Google Scholar] [CrossRef]
- Melser, R.; Coops, N.C.; Wulder, M.A.; Derksen, C. Multi-Source Remote Sensing Based Modeling of Vegetation Productivity in the Boreal: Issues & Opportunities. Can. J. Remote Sens. 2023, 49, 2256895. [Google Scholar] [CrossRef]
- Shi, Z.; Wang, Y.; Zhao, Q.; Zhang, L.; Zhu, C. The Spatial Changes of NPP and its Driving Mechanisms in China from 2001 to 2020. J. Ecol. Environ. 2022, 31, 2111–2123. [Google Scholar] [CrossRef]
- Wang, S.; Wang, W.; Wu, Y.; Li, W.; Zhao, S.; Chen, Z. Effects of a Changing Climate and Anthropogenic Impacts on Net Primary Production in Yinshanbeilu, Inner Mongolia, China. Environ. Impact Assess. Rev. 2023, 102, 107185. [Google Scholar] [CrossRef]
- Xu, B.; Feng, Z.; Chen, Y.; Zhou, Y.; Shao, Y.; Wang, Z. Assessing the Distribution and Driving Effects of Net Primary Productivity along an Elevation Gradient in Subtropical Regions of China. Forests 2024, 15, 340. [Google Scholar] [CrossRef]
- Xu, Y.; Lu, Y.-G.; Zou, B.; Xu, M.; Feng, Y.-X. Unraveling the Enigma of NPP Variation in Chinese Vegetation Ecosystems: The Interplay of Climate Change and Land Use Change. Sci. Total Environ. 2024, 912, 169023. [Google Scholar] [CrossRef]
- Liu, J.; Gao, J. Effects of Climate and Land Use Change on the Changes of NPp in the FarmingPastoral Ecotone of Northern China. Resour. Sci. 2009, 31, 493–500. [Google Scholar]
- Yang, S.; Yang, X.; Zhang, J.; Gao, X.; Zhou, J.; Wu, X. Assessing the Impacts of Rural Depopulation and Urbanization on Vegetation Cover: Based on Land Use and Nighttime Light Data in China, 2000–2020. Ecol. Indic. 2024, 159, 111639. [Google Scholar] [CrossRef]
- Gong, H.; Cao, L.; Duan, Y.; Jiao, F.; Xu, X.; Zhang, M.; Wang, K.; Liu, H. Multiple Effects of Climate Changes and Human Activities on NPP Increase in the Three-North Shelter Forest Program Area. For. Ecol. Manag. 2023, 529, 120732. [Google Scholar] [CrossRef]
- Chao, Z.; Zhang, P.; Wang, X.; Qian, J. Terrestrial net primary production and its spatio-temporal patterns in ShandongProvince during 2001–2010. Pratacult. Sci. 2013, 30, 829–835. [Google Scholar]
- Liu, Y.; Zhang, Y.; Zhang, C.; Xiao, B.; Liu, L.; Cao, Y. Spatial and temporal variations of vegetation net primary productivity and its responses to climate change in Shandong Province from 2000 to 2015. Chin. J. Ecol. 2019, 38, 1464–1471. [Google Scholar] [CrossRef]
- Yang, J.; Huang, X. The 30 m Annual Land Cover Datasets and Its Dynamics in China from 1985 to 2022. Earth Syst. Sci. Data 2023, 13, 3907–3925. [Google Scholar] [CrossRef]
- Peng, S. 1-Km Monthly Mean Temperature Dataset for China (1901–2022); National Tibetan Plateau: Beijing, China, 2023. [Google Scholar] [CrossRef]
- Feng, F.; Wang, K. High spatial Resolution (10 km) Surface Solar Radiation Dataset with by Merging Sunshine Hours over China China (1983–2017). 2020. Available online: https://data.tpdc.ac.cn/en/data/a82849b0-9af5-457d-8968-4471dd845f2e/ (accessed on 3 April 2024).
- Jiang, W.; Yuan, L.; Wang, W.; Cao, R.; Zhang, Y.; Shen, W. Spatio-Temporal Analysis of Vegetation Variation in the Yellow River Basin. Ecol. Indic. 2015, 51, 117–126. [Google Scholar] [CrossRef]
- Xi, Z.; Chen, G.; Xing, Y.; Xu, H.; Tian, Z.; Ma, Y.; Cui, J.; Li, D. Spatial and Temporal Variation of Vegetation NPP and Analysis of Influencing Factors in Heilongjiang Province, China. Ecol. Indic. 2023, 154, 110798. [Google Scholar] [CrossRef]
- Hurst, H.E. Long-Term Storage Capacity of Reservoirs. Trans. Am. Soc. Civ. Eng. 1951, 116, 770–799. [Google Scholar] [CrossRef]
- Zhang, M.; Kafy, A.-A.; Ren, B.; Zhang, Y.; Tan, S.; Li, J. Application of the Optimal Parameter Geographic Detector Model in the Identification of Influencing Factors of Ecological Quality in Guangzhou, China. Land 2022, 11, 1303. [Google Scholar] [CrossRef]
- Wang, J.; Xu, C. Geodetectors: Principles and Prospects. Acta Geogr. Sin. 2017, 72, 116–134. [Google Scholar]
- Luo, Y.; Zhnag, S. Temporal-spatial variation characteristics and driving factors of vegetation NPP in Shandong Province. Guihaia 2019, 39, 690–700. [Google Scholar]
- Tian, Z.; Zhang, D.; He, X.; Guo, H.; Wei, H. Spatiotemporal Variations in Vegetation Net Primary Productivity and Their Driving Factors in Yellow River Basin from 2000 to 2015. Res. Soil Water Conserv. 2019, 26, 255–262. [Google Scholar] [CrossRef]
- Zhang, X.; Cao, Q.; Ji, S.; Chen, H.; Zhang, T.; Liu, J. Quantifying the contributions of cimate change and human activities to vegetation dynamic changes in the Yellow River Delta. Acta Sci. Circum. 2022, 42, 56–69. [Google Scholar] [CrossRef]
- Zhou, Y.; Yue, D.; Guo, J.; Chao, Z.; Meng, X. Assessing the Impact of Land Conversion and Management Measures on the Net Primary Productivity in the Bailong River Basin, in China. Catena 2021, 207, 105672. [Google Scholar] [CrossRef]
- Hu, H.; Liu, G. Carbon sequestration of China’s National Natural Forest Protection Project. Acta Ecol. Sin. 2006, 26, 291–296. [Google Scholar]
- Sun, X. Application of Cultivated Land in Jinan Returned to Forestland and Grassland Basing on GIS. J. Soil Water Conserv. 2003, 5, 85–87. [Google Scholar] [CrossRef]
- Zhang, Y.; Zhang, C.; Wang, Z.; Chen, Y.; Gang, C.; An, R.; Li, J. Vegetation Dynamics and Its Driving Forces from Climate Change and Human Activities in the Three-River Source Region, China from 1982 to 2012. Sci. Total Environ. 2016, 563–564, 210–220. [Google Scholar] [CrossRef]
- Wu, Y.; Gu, L.; Li, S.; Guo, C.; Yang, X.; Xu, Y.; Yue, F.; Peng, H.; Chen, Y.; Yang, J.; et al. Responses of NDVI to Climate Change and LUCC along Large-Scale Transportation Projects in Fragile Karst Areas, SW China. Land 2022, 11, 1771. [Google Scholar] [CrossRef]


| Data Types | Factors | Resolution | Period | URL |
|---|---|---|---|---|
| Vegetation | Net primary productivity | 30 m | 2000–2020 | https://lpdaac.usgs.gov/ (accessed on 15 September 2023) |
| Normalized difference vegetation index | 30 m | 2000–2020 | https://data.tpdc.ac.cn (accessed on 16 September 2023) | |
| Climate | Surface solar radiation | 1 km | 2000–2017 | https://data.tpdc.ac.cn (accessed on 22 September 2023) |
| Seasonality of precipitation (coefficient of variation) | 1 km | 2000–2018 | https://www.worldclim.org/data/ (accessed on 1 December 2023) | |
| Mean annual temperature and precipitation | 1 km | 1982–2022 | http://www.geodata.cn/ (accessed on 18 December 2023) | |
| Vapor pressure deficit | 1 km | 2000–2020 | https://climate.northwestknowledge.net/ (accessed on 1 December 2023) | |
| Terrain | Elevation | 30 m | – | http://www.gscloud.cn/ (accessed on 20 October 2023) |
| Slope | 30 m | – | – | |
| Aspect | 30 m | – | – | |
| Human activity | Land use type | 30 m | 2000–2020 | https://zenodo.org/ (accessed on 22 December 2023) |
| Night-time light index | 1 km | 2000–2020 | https://ngdc.noaa.gov/ (accessed on 12 September 2023) |
| p | Significance Level | p | Significance Level |
|---|---|---|---|
| p < 0.01 | significant decrease | p < 0.01 | significant increase |
| 0.01 < p < 0.05 | moderate decrease | 0.01 < p < 0.05 | moderate increase |
| p > 0.05 | non-significant decrease | p > 0.05 | non-significant increase |
| Factors | Elevation | Slope | Aspect | SVCP | VPD | MAP | MAT | LUCC | NLI |
|---|---|---|---|---|---|---|---|---|---|
| Elevation | |||||||||
| Slope | N | ||||||||
| Aspect | N | N | |||||||
| SVCP | N | N | N | ||||||
| VPD | N | N | N | N | |||||
| MAP | N | N | N | N | N | ||||
| MAT | N | N | N | N | N | N | |||
| LUCC | Y | Y | Y | Y | Y | Y | Y | ||
| NLI | N | N | N | N | N | N | N | N |
| Factors | Adaptation Range/Type | Mean NPP (g C·m−2·a−1) |
|---|---|---|
| Elevation | 309–618 m | 225.45 |
| Slope | 12.9–25.7 ° | 219.95 |
| Aspect | South/East | 218.47 |
| SVCP | 5.8–8.7 mm | 223.26 |
| VPD | 0.25–0.28 kPa | 217.97 |
| MAP | 776–915 mm | 222.79 |
| MAT | 11.7–12.9 °C | 221.15 |
| LUCC | Woodland/Farmland | 218.91 |
| NLI | 109–327 cd/m2 | 217.18 |
Disclaimer/Publisher’s Note: The statements, opinions and data contained in all publications are solely those of the individual author(s) and contributor(s) and not of MDPI and/or the editor(s). MDPI and/or the editor(s) disclaim responsibility for any injury to people or property resulting from any ideas, methods, instructions or products referred to in the content. |
© 2024 by the authors. Licensee MDPI, Basel, Switzerland. This article is an open access article distributed under the terms and conditions of the Creative Commons Attribution (CC BY) license (https://creativecommons.org/licenses/by/4.0/).
Share and Cite
Wu, Y.; Yang, J.; Li, S.; Yu, H.; Luo, G.; Yang, X.; Yue, F.; Guo, C.; Zhang, Y.; Gu, L.; et al. The Impact of Climate Change and Human Activities on the Spatial and Temporal Variations of Vegetation NPP in the Hilly-Plain Region of Shandong Province, China. Forests 2024, 15, 898. https://doi.org/10.3390/f15060898
Wu Y, Yang J, Li S, Yu H, Luo G, Yang X, Yue F, Guo C, Zhang Y, Gu L, et al. The Impact of Climate Change and Human Activities on the Spatial and Temporal Variations of Vegetation NPP in the Hilly-Plain Region of Shandong Province, China. Forests. 2024; 15(6):898. https://doi.org/10.3390/f15060898
Chicago/Turabian StyleWu, Yangyang, Jinli Yang, Siliang Li, Honggang Yu, Guangjie Luo, Xiaodong Yang, Fujun Yue, Chunzi Guo, Ying Zhang, Lei Gu, and et al. 2024. "The Impact of Climate Change and Human Activities on the Spatial and Temporal Variations of Vegetation NPP in the Hilly-Plain Region of Shandong Province, China" Forests 15, no. 6: 898. https://doi.org/10.3390/f15060898
APA StyleWu, Y., Yang, J., Li, S., Yu, H., Luo, G., Yang, X., Yue, F., Guo, C., Zhang, Y., Gu, L., Wu, H., & Yuan, P. (2024). The Impact of Climate Change and Human Activities on the Spatial and Temporal Variations of Vegetation NPP in the Hilly-Plain Region of Shandong Province, China. Forests, 15(6), 898. https://doi.org/10.3390/f15060898