Article

An Improved RANSAC-ICP Method for Registration of SLAM and UAV-LiDAR Point Cloud at Plot Scale

1
School of Surveying and Land Information Engineering, Henan Polytechnic University, Jiaozuo 454000, China
2
Key Laboratory of Digital Earth Science, Aerospace Information Research Institute, Chinese Academy of Sciences, Beijing 100094, China
*
Author to whom correspondence should be addressed.
Forests 2024, 15(6), 893; https://doi.org/10.3390/f15060893
Submission received: 18 April 2024 / Revised: 15 May 2024 / Accepted: 17 May 2024 / Published: 21 May 2024
(This article belongs to the Special Issue Airborne and Terrestrial Laser Scanning in Forests)

Abstract

:
Simultaneous Localization and Mapping (SLAM) using LiDAR technology can acquire the point cloud below the tree canopy efficiently in real time, and the Unmanned Aerial Vehicle LiDAR (UAV-LiDAR) can derive the point cloud of the tree canopy. By registering them, the complete 3D structural information of the trees can be obtained for the forest inventory. To this end, an improved RANSAC-ICP algorithm for registration of SLAM and UAV-LiDAR point cloud at plot scale is proposed in this study. Firstly, the point cloud features are extracted and transformed into 33-dimensional feature vectors by using the feature descriptor FPFH, and the corresponding point pairs are determined by bidirectional feature matching. Then, the RANSAC algorithm is employed to compute the transformation matrix based on the reduced set of feature points for coarse registration of the point cloud. Finally, the iterative closest point algorithm is used to iterate the transformation matrix to achieve precise registration of the SLAM and UAV-LiDAR point cloud. The proposed algorithm is validated on both coniferous and broadleaf forest datasets, with an average mean absolute distance (MAD) of 11.332 cm for the broadleaf forest dataset and 6.150 cm for the coniferous forest dataset. The experimental results show that the proposed method in this study can be effectively applied to the forest plot scale for the precise alignment of multi-platform point clouds.

1. Introduction

Accurately and comprehensively acquiring forest structural parameters is significant for forest inventories, ecological research and response to global climate change [1,2,3]. Light detection and ranging (LiDAR) is a non-destructive sensor system that uses a laser beam to detect the 3D information of forest canopy rapidly and accurately, which can overcome the saturation issues of optical remote sensing [4,5,6]. The dense point cloud of the forest can be acquired from different LiDAR platforms, but the complete 3D structure information cannot be described by using a point cloud from a single platform [7,8,9]. In order to obtain forest structural parameters more accurately, it is essential to establish the fusion of multi-platform LiDAR data [10]. However, due to the complexity of forest scenes and the indistinctiveness of characteristic patterns, the accurate registration of multi-platform LiDAR data remains challenging.
Near-surface LiDAR systems can be categorized into Unmanned Aerial Vehicle LiDAR (UAV-LiDAR) and Terrestrial Laser Scanning LiDAR (TLS-LiDAR) according to the platform [11,12]. UAV-LiDAR can acquire high-precision forest point clouds in a few minutes, providing detailed information about forest canopies. However, trunk information usually cannot be detected due to the top-down scanning method [13,14,15]. In contrast, TLS-LiDAR can accurately and rapidly capture 3D structural information below the canopy, such as Diameter at Breast Height (DBH) [16]. For TLS-LiDAR, it faces challenges in acquiring information about the top canopy due to scanning perspective and canopy occlusion [17].
In recent years, TLS-LiDAR has evolved from ground-fixed 3D laser scanning systems with relatively low efficiency to mobile 3D laser scanning systems. Ground mobile LiDAR utilizes high-precision Simultaneous Localization and Mapping (SLAM) algorithms and inertial navigation systems for real-time data stitching and mapping, improving operational efficiency. Proudman et al. [18] successfully estimated the DBH within 7 cm error using point cloud data that were collected by handheld mobile LiDAR through least squares optimization, which was consistent with the study by Bauwens. Bauwens et al. [19] compared the accuracy of forest structural parameters obtained by TLS and the mobile laser scanning system, which found that the mobile laser scanning obtained the best estimate of DBH. Tai et al. [20] used LiDAR-SLAM technology for the three-dimensional modeling of plantation forests and achieved high-precision estimation of carbon stock. Due to LiDAR-SLAM also being obstructed by tree canopy shading, the scanned point cloud is likewise limited to understory structures. To overcome the limitation, some scholars have combined the unique advantages of multi-platform by using point clouds from UAV to align with point clouds from TLS or SLAM platforms. Ghorbani et al. [21] indicated that ALS and TLS systems can capture forest 3D information from different perspectives. Zhou et al. [22] registered ALS and TLS point cloud data based on canopy gap shape feature points and subsequently estimated tree parameters from the fused data. The results suggested that the combined point cloud was significantly effective in extracting forest 3D structural information. Thus, point cloud registration is a prerequisite for the fusion of multi-platform LiDAR data [23].
The main purpose of point cloud registration is to establish correspondences between two or more sets of point clouds in different coordinate systems and align or match the data by adjusting their positions [24,25]. However, due to differences in coordinates and density of point cloud from multi-platform LiDAR, these differences may lead to bias during the data registration process, which can have an impact on the accurate estimation of forest tree structural parameters [26]. In order to improve the accuracy of point cloud registration, forestry applications frequently require semi-automated methods, such as manual point selection, but also utilize attribute information from the canopy or trunks to minimize errors. For instance, it is a prevalent approach to extract shape features of the crown and geometric features of the trunk (e.g., straight lines or nearly straight lines) to detect similarities for matching. Paris et al. [27] transformed collected point cloud data into raster data and matched them based on canopy similarity between ALS and TLS. However, this method was computationally expensive, and canopy segmentation became more challenging for densely vegetated forests. Polewski et al. [28] used trunk location points and the highest point of the canopy for matching. As the number of matching points increased, the average accuracy reached 0.66 m. The improved accuracy in the experimental results further validated the importance of efficiently and accurately detecting corresponding points between two point sets, which was essential for precisely calculating the transformation matrix and achieving the registration of two datasets.
At present, the registration of point cloud data is generally divided into two steps: coarse registration and fine registration. Coarse registration is a form of global alignment that uses the geometric features of point clouds without considering the initial position [29,30]. Common coarse registration methods include three approaches: Normal Distributions Transform (NDT), Fast Point Feature Histogram (FPFH), and Random Sample Consensus (RANSAC): (1) The NDT algorithm [31] achieves coarse registration by transforming the reference point cloud into a multidimensional normal distribution. Hong et al. [32] achieved accurate registration of point cloud data based on traditional NDT by introducing the probability of point samples. Wang et al. [33] compared three algorithms (i.e., PL-ICP, ICP and NDT) to verify the effectiveness of the registration framework. The experimental results showed that the NDT algorithm had high execution efficiency. However, this method had limited matching accuracy in scenes with high forest point cloud density; (2) The FPFH algorithm [34,35] is an effective and robust feature descriptor. It establishes a coordinate system between points within the neighborhood of key points, calculating the angles between features such as normal vectors and the coordinate system. Zhao et al. [36] proposed three automated and parameter-free coarse-to-fine registration methods and recommended the FPFH-OICP algorithm as the optimal registration choice for natural secondary forests. Chen et al. [37] utilized ULS and TLS data clustering to generate maps hierarchically and combined FPFH features to realize the reconstruction of forest vertical structure and registration. However, this method was sensitive to noise in point clouds; (3) The RANSAC algorithm [38] can fit robust models, estimating point cloud features through singular value decomposition. Also, it is robust to noise and outliers [39]. Dai et al. [40] utilized semantic key points and the RANSAC algorithm for TLS-TLS and TLS-UAV point cloud registration. The results indicated that the proposed framework could improve the practicality and efficiency of multi-source data matching. Tao et al. [41] proposed a method based on 2D feature points and used a two-point RANSAC algorithm with constraints to compute the 3D transformation, which successfully achieved the registration of point pairs. However, this method only had a certain probability of obtaining reliable models. The probability of correctly matching the corresponding point is low, which is proportional to the number of iterations.
After coarse registration, fine registration is usually applied to SLAM and UAV-LiDAR data at the individual tree scale for the accurate alignment of canopy details. For the fine registration, the Iterative Closest Point (ICP) algorithm [42,43] is usually adopted for the local registration of low overlap and large-scale point clouds [44]. It iteratively matches corresponding points based on a closest distance criterion and determines the transformation connecting two point clouds [45]. However, its efficiency is dependent on the availability of an initial estimate of the relative position and orientation of the two datasets, which are derived from the coarse registration.
In order to overcome the low probability and poor accuracy of the traditional RANSAC registration algorithm for fitting robust models in dense forest registration, this study proposed an improved RANSAC-ICP algorithm (i.e., RANSAC Bidirectional Matching-ICP, RBFM-ICP) for the registration of SLAM and UAV-LiDAR point cloud, which include coarse registration and fine registration. For coarse registration, the point cloud features of two datasets are firstly extracted by using feature descriptor FPFH, and the corresponding point pairs are determined by bidirectional feature matching, and then the RANSAC algorithm is applied to the corresponding point pairs to calculate the initial transformation matrix. For fine registration, the ICP algorithm is employed to refine the transformation matrix, which is used for the accurate alignment of the SLAM and UAV-LiDAR point cloud. After that, the SLAM and UAV-LiDAR point cloud can be fused together for the derivation of forest structure parameters, such as tree height, diameter at breast height, etc.

2. Materials and Methods

2.1. Study Area

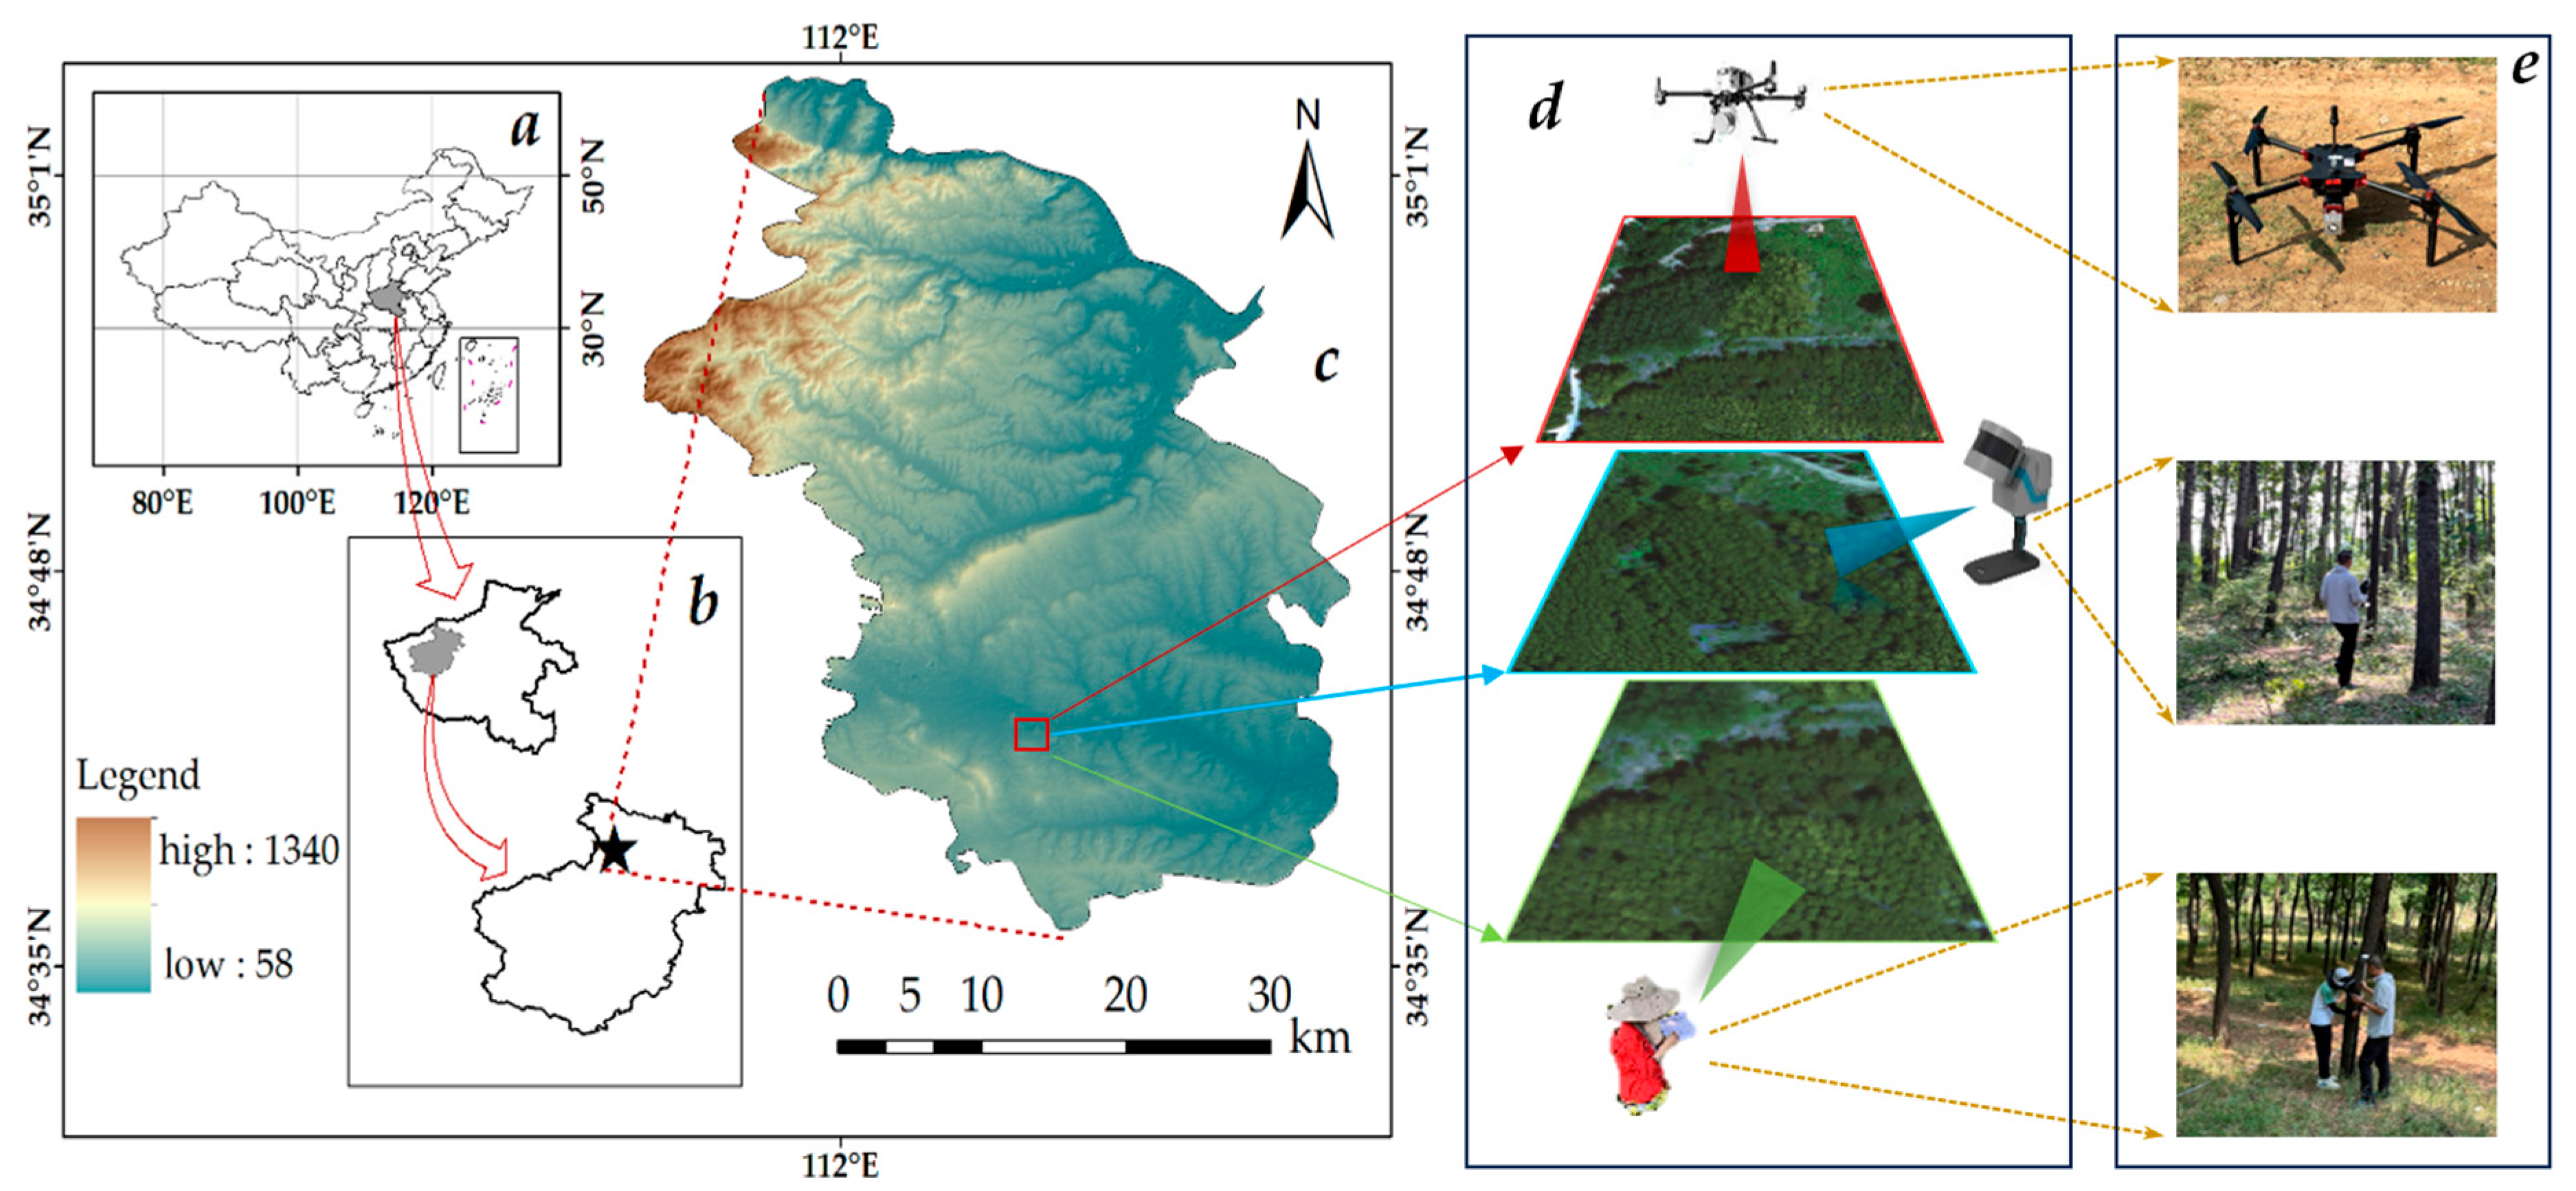
The study area is located in the Yushan Mining Area in Luoyang City in northern China (112.14° E–112.51° E, 34.53° N–34.83° N) (Figure 1). The mining area features interlaced hills and complex terrain, with an average elevation of 350 m. The vegetation is diverse and includes various types of trees, shrubs, herbs and mosses. Among them, trees are dominated by deciduous broadleaf forests, which are mainly composed of locust tree groves, poplar groves and oak tree groves, accounting for 90% of the deciduous broadleaf forests. In addition, the region has a temperate continental climate with significant temperature differences between the four seasons and a relatively uniform distribution of precipitation.
To validate the effectiveness and robustness of the proposed method, point cloud data were collected from three sample plots (Plot A, Plot B and Plot C) based on different forest stand types and stem densities, and the size of each plot is approximately 30 m×30 m. The stand types of both Plots A and B are locust tree forests with stem densities of 877 stems/ha and 983 stems/ha, respectively. Plot C is composed of poplar tree forests, with a stem density of 347 stems/ha. We collected these three datasets in July 2023, as can be seen in Figure 1a–c.
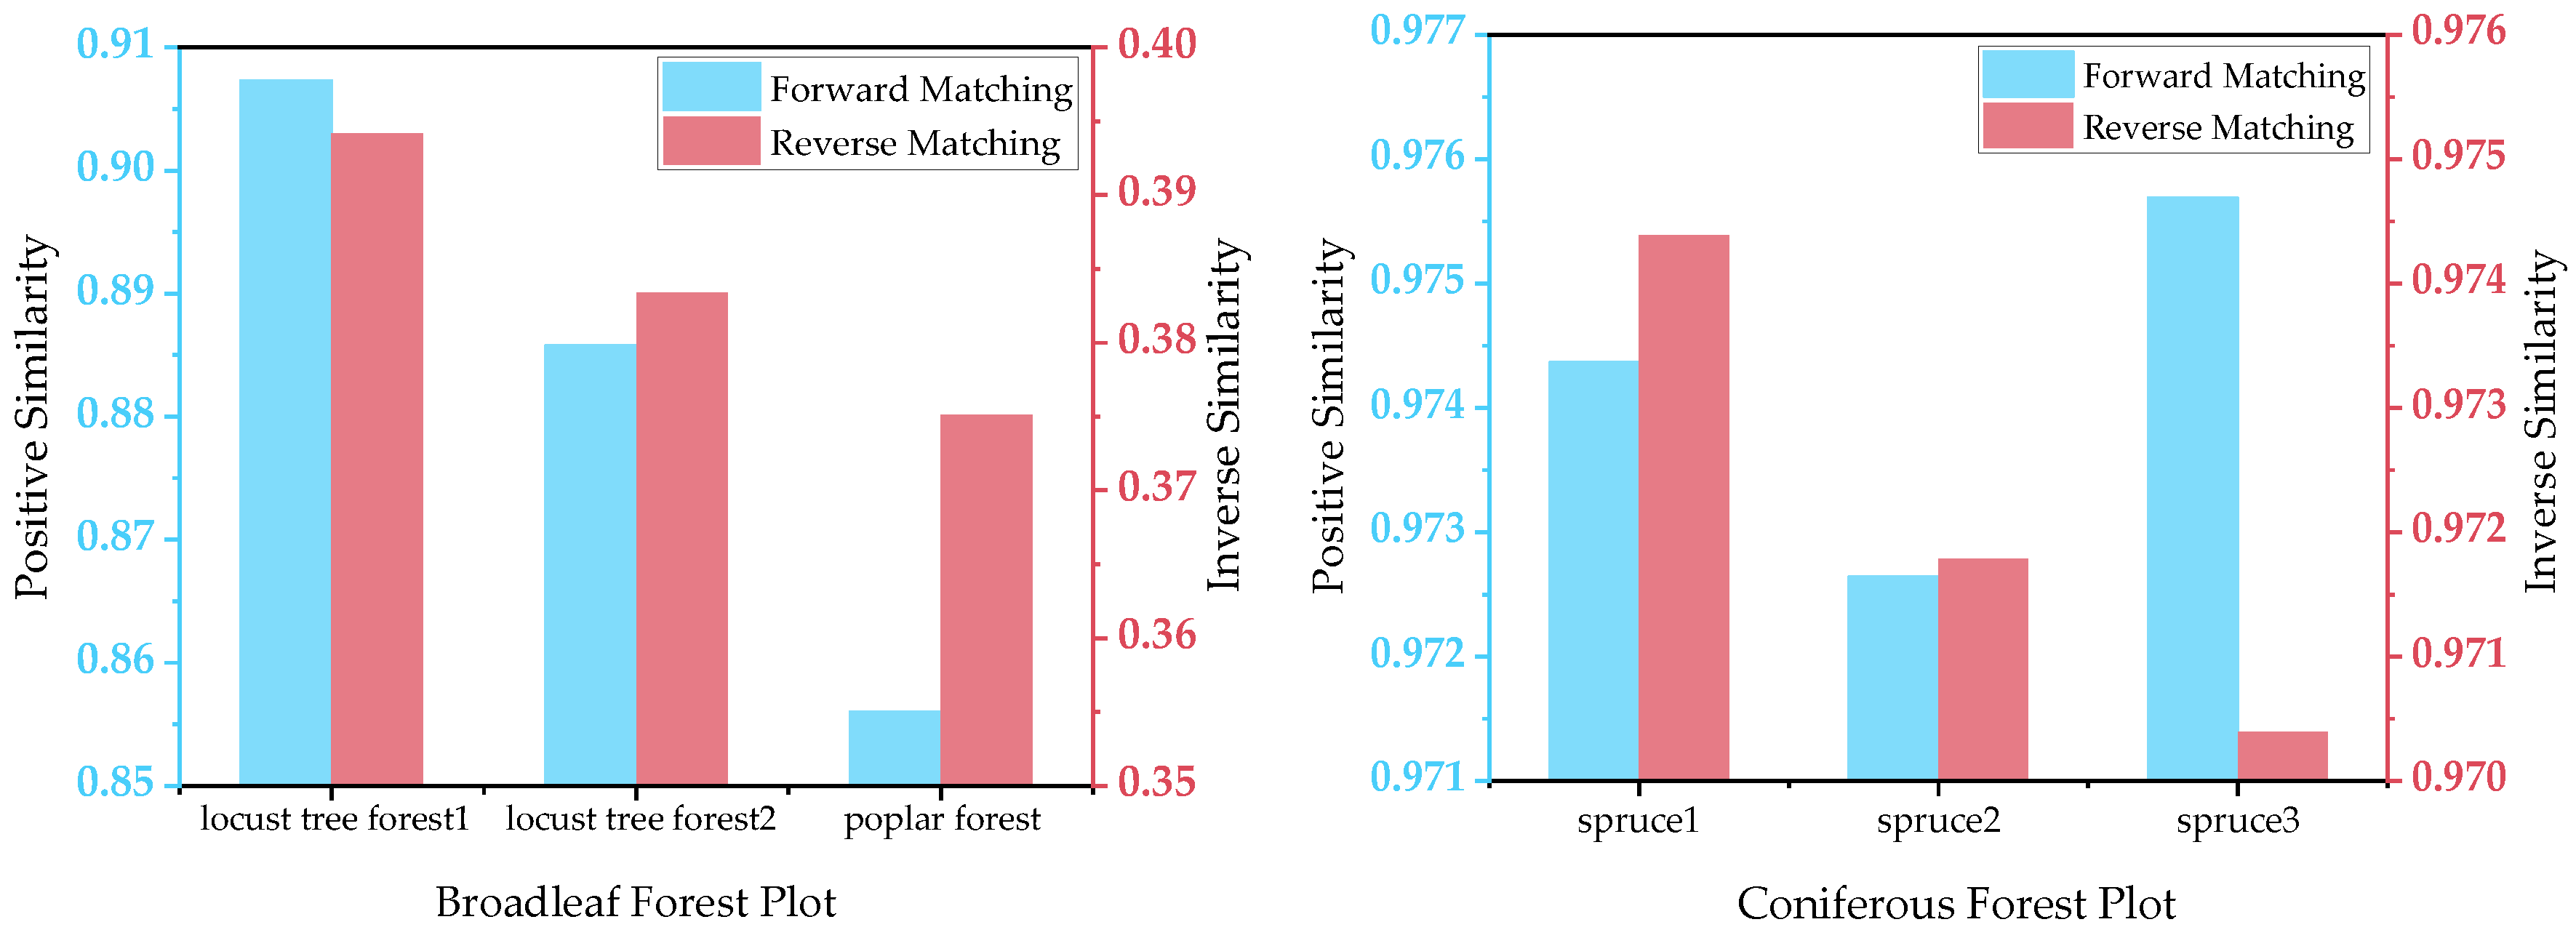
Broadleaf and coniferous forests are the two typical vegetation types in our study area. Therefore, to further explore the generalizability of the proposed method, three coniferous forest plots, each with a size of 30 m×30 m, were included in this study for additional validation.

2.2. Multi-Platform LiDAR Data

Two types of laser scanning data from different platforms were used in this study: Unmanned Aerial Vehicle LiDAR data (UAV-LiDAR) and handheld mobile LiDAR data (LiDAR-SLAM). In July 2023, UAV-LiDAR point clouds were collected for a forest area spanning 0.210 square kilometers in the Yushan Mining Area by using D-Lidar200 equipped with the RIEGL mini VUX-1UAV system. The lowest and highest elevations in the surveyed area were 554 m and 599 m, respectively. Flight path spacing was 71 m, with the UAV flying at an altitude of approximately 80 m above the ground at a speed of 8 m/s. Average point density in the surveyed area was about 50 points/m2. Detailed parameters of D-Lidar200 are provided in Table 1.
Sample plots of shrubbery, poplar forests and locust tree forests were acquired during the same period using a Feima SLAM 100 handheld LiDAR scanner. SLAM 100 is the first handheld mobile LiDAR scanner produced by Feima Robotics, which has a 360° rotating platform with a 270° × 360° point cloud coverage. Combined with the industry’s SLAM algorithm, SLAM 100 can obtain high-precision 3D point cloud data of the surrounding environment even in conditions with no illumination and no GPS positioning. Detailed parameters of SLAM 100 are provided in Table 2.

2.3. Overview of the Method

Figure 2 shows the automatic, unmarked coarse-to-fine registration process of point cloud data from two platforms. The process primarily consists of four steps: (1) data pre-processing, including removal of noise points (e.g., isolated and outlier points), coordinate centralizing, and ground point filtering; (2) coarse registration, where downsampling is performed on SLAM and UAV-LiDAR by using the voxel grid algorithm, the Pearson correlation coefficients of the point pairs are computed by using the FPFH feature descriptor and the bidirectional feature matching algorithm, and then the RANSAC algorithm is applied to compute the initial transformation matrix; (3) fine registration, where the point cloud is divided into a series of subspaces by using the KD-tree algorithm to accelerate nearest neighbor search in the ICP process [46,47], with the target of refining the transformation matrix; (4) accuracy assessment and analysis to quantify the transformation errors between the aligned SLAM and UAV-LiDAR datasets. Overall, compared to the limitation that the traditional RANSAC algorithm requires to traverse all the points to fit the transformation matrix, our proposed method obtains a set of randomly sampled initial point sets with a small range and higher accuracy by using bidirectional feature matching algorithm according to these point sets to compute the transformation matrix, which can significantly improve the efficiency and accuracy of registration.

2.4. Data Pre-Processing

The pre-processing of raw LiDAR data from two scanners mainly consists of three steps. The process includes:
(1) Removing noise points. Due to the high density of shrubbery in the study area and differences in the operational modes of multi-platform LiDAR sensors, along with potential human operational errors, the collected point cloud data show noise points. Therefore, the collected data cannot be directly used. In order to remove the effect of noise points, the study uses Gaussian filtering to remove the points that differ from the mean value as noise points based on the standard deviate multiplier.
(2) Ground point filtering. To determine whether the subsequent fused point cloud trunks can fit the complete cross-sectional circle. We use two methods for the secondary separation of ground and non-ground points by moving surface filtering and slope filtering. It is worth noting that we set the maximum slope threshold to 2° during the slope filtering process, considering the variation of ground undulation.
(3) Coordinate centralizing. UAV-LiDAR can obtain precise location information through the Global Positioning System (GPS), thereby establishing a global coordinate system. In contrast, LiDAR-SLAM lacks direct GPS signal support and faces the challenge of not being able to obtain accurate positions directly. Thus, when importing point cloud data, there may be a situation where the two datasets are significantly distant. In this study, we improved the stability of data calculations by centralizing both datasets to a unified coordinate system. Specifically, we unify the LiDAR-SLAM data, which lack positional information, with the UAV-LiDAR data into a similar coordinate system by subtracting the respective centroid coordinates x s , y s , z s and x u , y u , z u from the two point cloud datasets. (Note: The coordinates of x u , y u , z u are added to the target point cloud after the accurate transformation of fine registration before output). Based on the pre-processing, point cloud data are used for further registration and analysis.

2.5. Coarse Registration

The coarse registration of SLAM and UAV-LiDAR point cloud data includes the following steps:
(1) Voxel grid downsampling. Due to non-uniform density, large data volume and irregularities in SLAM and UAV-LiDAR point clouds, direct coarse registration of raw point clouds results in low accuracy. Therefore, experiments use voxel grid downsampling [48] to divide the point cloud space into regular voxels, which improves the efficiency and robustness of the registration algorithm by retaining one or more points with features within each voxel. The absolute density of each voxel is reduced while retaining geometric information for coarse registration. The voxel grid size is selected based on the range of the laser scanner and the density of the point cloud, and voxel sizes of 0.5 and 0.25 m are used to traverse the SLAM and UAV-LiDAR data, respectively.
(2) Extract FPFH features. Coarse registration is used to obtain relative transformation between related data by extracting the corresponding features [49]. Of the existing methods, the fast point feature histogram (FPFH) descriptor aims to generate robust and stable feature descriptions based on the geometric relationships of neighboring points within a specified range. It calculates the geometrical relations between the query point P q and its k neighbor points, which incorporates the estimated surface normal of the P q and the angle difference between the normal vectors and the line connecting the neighbors of P q and Q j [50]. These geometric features of the inquiry point ( P q ) and its k neighbors are aggregated to generate the simplified point feature histogram (SPFH) as the feature descriptors. Finally, the FPFH of the point P q is determined by calculating the SPFH of the k neighbor by the weight ω i .
FPFH P q = SPFH P q + 1 k i = 1 k 1 ω i SPFH P i
where P q represents the query point, SPFH (simple point feature histogram) represents simplified features considering only the query point and its neighboring points, and ω i represents the distance weight between the query point and its neighbors.
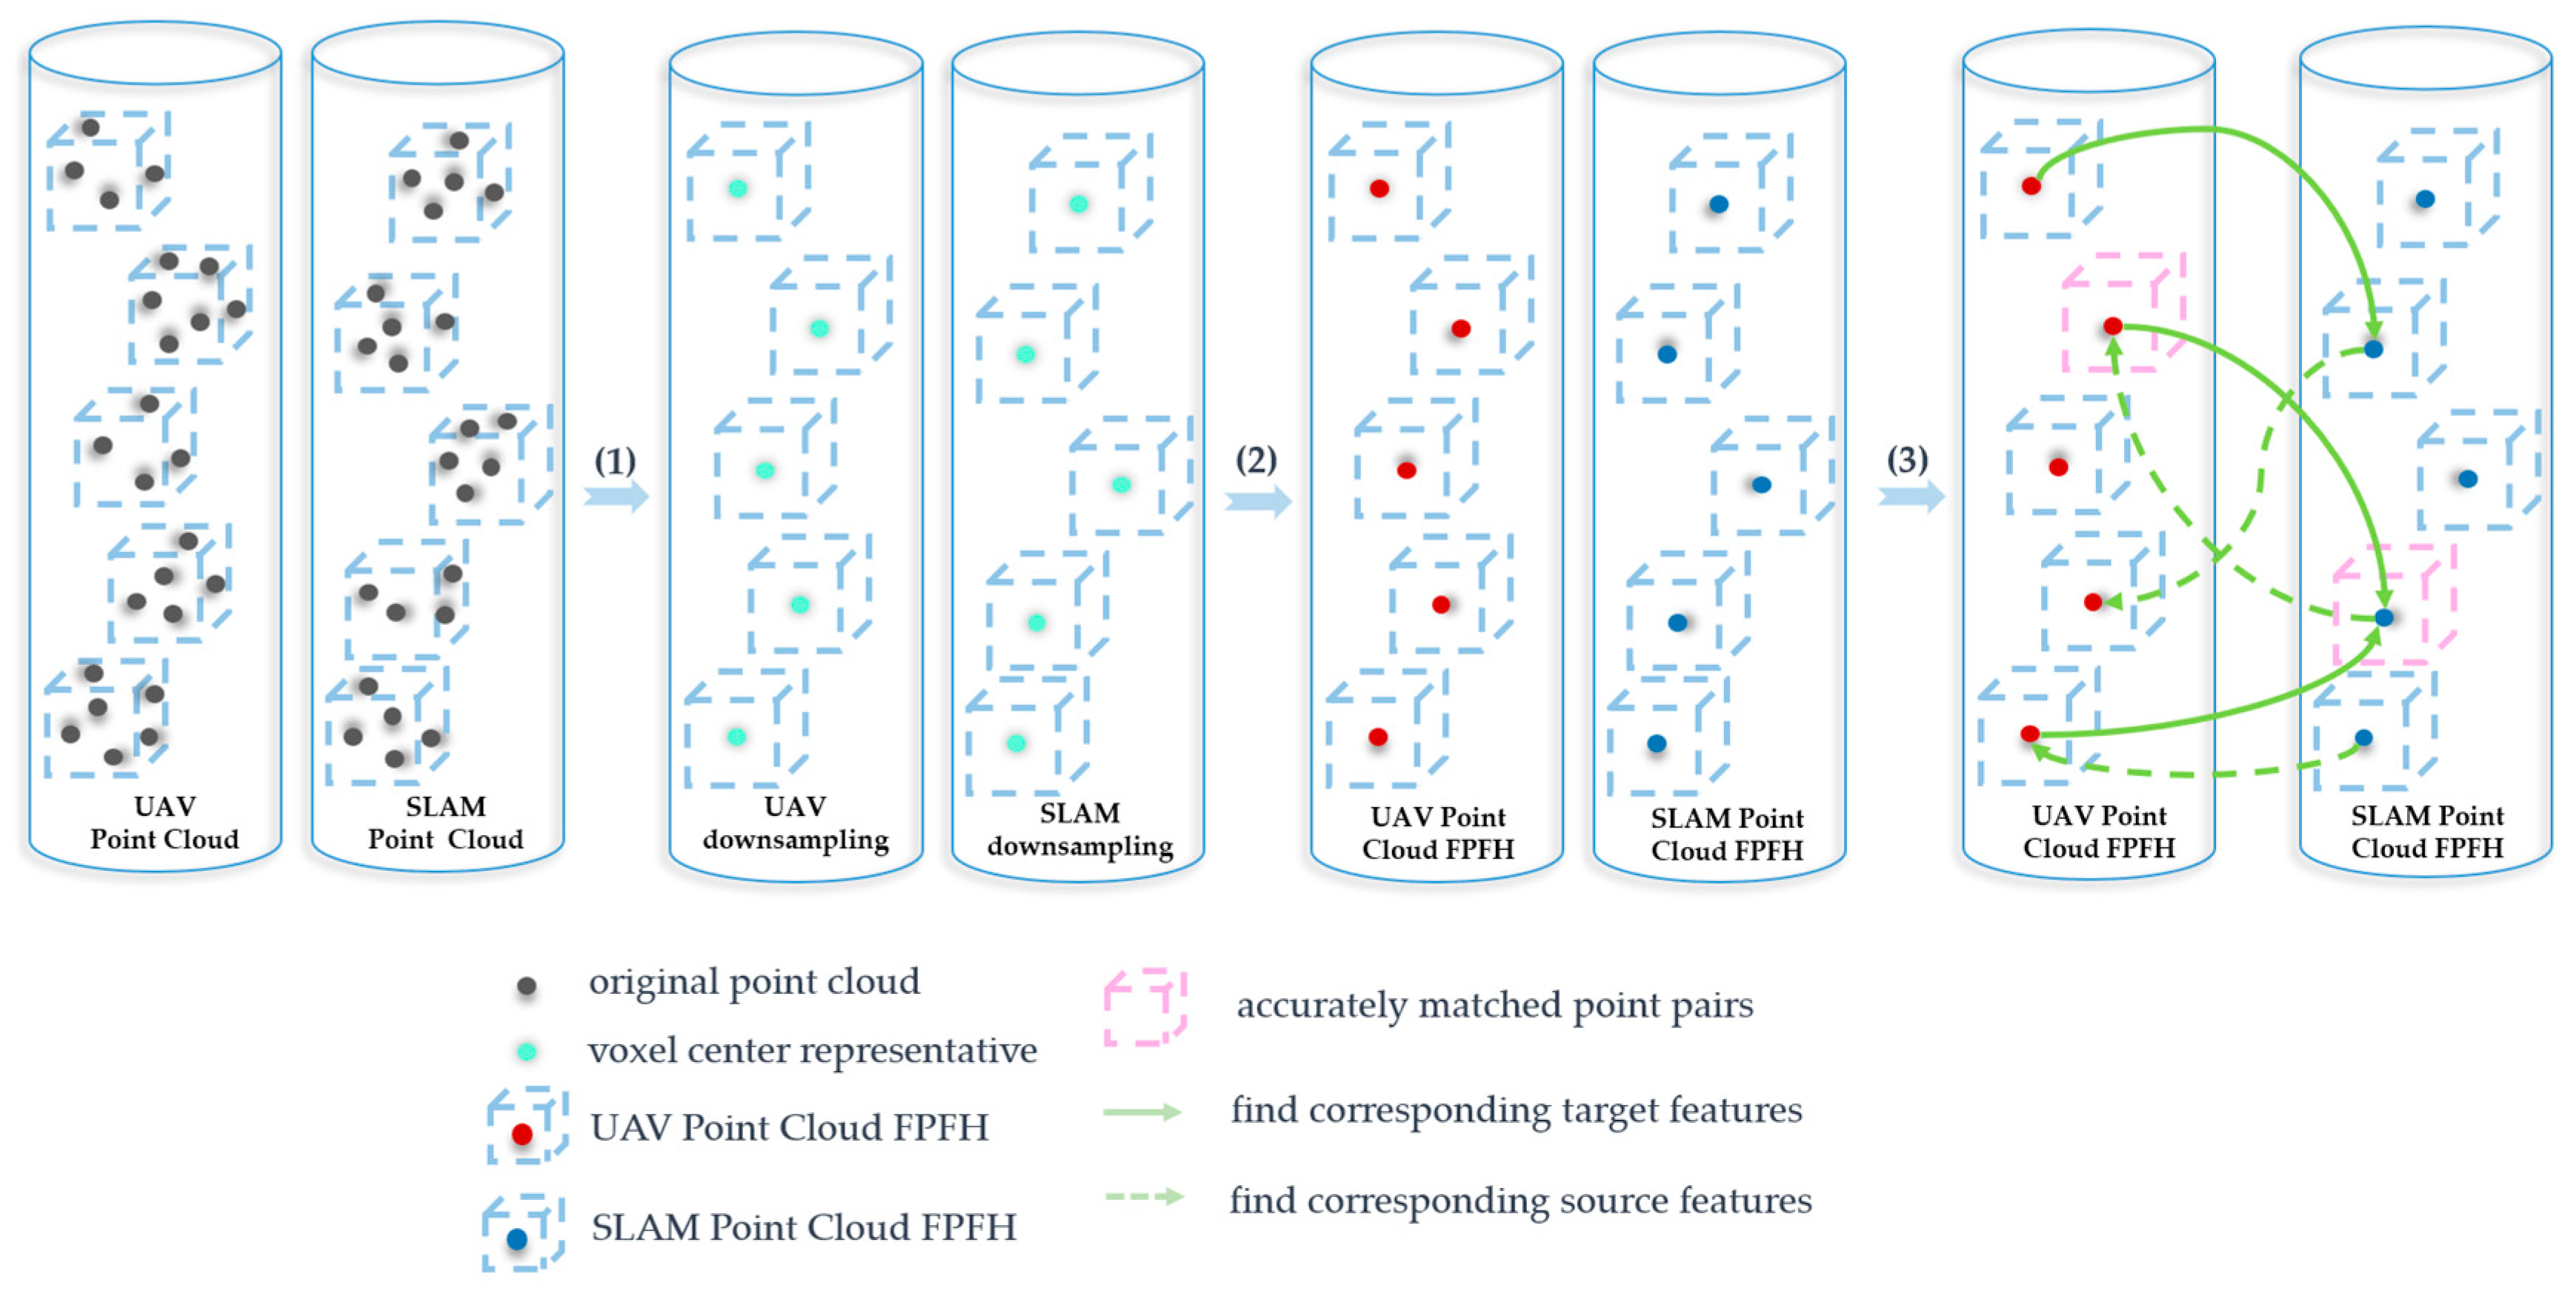
(3) Bidirectional feature matching. Based on the extracted FPFH feature descriptors, a loop (i.e., bidirectional feature matching) is added before the initialization of the local sampling of the RANSAC algorithm. In this loop, firstly, establish KD-tree indexes for the reference point cloud and the target point cloud. Secondly, use the KD-tree to detect the feature point Q i with the highest similarity to the query point P i in the target point cloud and record the index T i of this feature point Q i . In order to characterize the degree of similarity between the reference point cloud and the target point cloud, we transform the 33-dimensional FPFH feature vectors contained in the two datasets into arrays A and B and calculate the correlation between the two types of data based on the Pearson correlation coefficient.
r = i = 1 n A i A ¯ B i B ¯ i = 1 n A i A ¯ 2 i = 1 n B i B ¯ 2
where A i and B i represent the elements of the i-th dimension in arrays A and B . A ¯ and B ¯ are the means of arrays A and B , respectively. And n is the dimensionality of the arrays (33 dimensions).
Finally, take the feature point Q i from the second step as the query point, identify the most similar feature point P i in the reference point cloud, and record the index T i of P i . If the index of P i (i.e., T i ) points to a point that is also P i , save P i from the reference point cloud and Q i from the target point cloud into the container N. Loop through all points and store all matched point pairs that satisfy the above operations in the container N, which will also serve as a small-scale point cloud set for the random sampling initialization of the RANSAC algorithm. Figure 3 provides a comprehensive display of steps (1–3).
(4) Calculate the initial transformation matrix. A set of randomly sampled initialized point pair set with small range and high accuracy can be obtained by bidirectional feature matching. Then, the RANSAC algorithm can complete the coarse registration by fitting the optimal transformation matrix based on this set of point pairs. Random Sample Consensus (RANSAC) is a computational transformation method for constructing robust models. The main steps include: (1) Local random point sampling initialization. Three non-collinear data points p 1 , p 2 , p 3 are selected from the reference point cloud P(UAV), followed by the corresponding set of points q 1 , q 2 , q 3 being selected from the target point cloud Q(SLAM). (2) Calculate rotational translation matrix H = R | t by the least squares algorithm and transform the target point cloud Q into a new dataset Q’. (3) Compare Q’ and H, calculate the number of consistent or matching points to form a consensus set, and calculate the score by the matching points in the consensus set until the score reaches a predefined threshold or the maximum number of iterations is satisfied. (4) Select the optimal transformation matrix M to align the target point cloud with the reference point cloud. The pseudo-code for the coarse registration algorithm is shown in Algorithm 1.
Algorithm 1 Coarse Registration
Input: Point cloud datasets from different platforms
Output: Number of matched point pairs and initial transformation matrix
1:Point Cloud A and Point Cloud B ← voxel grid downsampling and extract FPFH features
2:While (iterations < Point Cloud A. size) do
3:  calculate the highest similarity match in point cloud B with Pearson correlation coefficient
4:  index1[i] ← store the nearest neighbor index of the i-th point in cloud B in index1
5:end while
6:While (iterations < Point Cloud B. size) do
7:  calculate the highest similarity match in point cloud A with Pearson correlation coefficient
8:  index2[i] ← store the nearest neighbor index of the i-th point in cloud A in index2
9:end while
10:Bidirectional Feature Matching (vector<int> index1, vector<int> index2)
11:{
12:  While (iterations < index1.size) do
13:    int m = index1[i]
14:    int n = index2[m]
15:    if (n = = i)
16:     store this set of point pairs in a structure variable
17:     store all the point pairs that meet the above conditions in container N
18:     else
19:     filter out this point pair
20:   end while
21:}
22:Perform RANSAC algorithm
23:return Number of matched point pairs and initial transformation matrix

2.6. Fine Registration

To reduce the alignment error after coarse registration between the SLAM and UAV-LiDAR point cloud, we further use the ICP algorithm for fine registration to enhance alignment accuracy between the two point cloud datasets. Iterative Closest Point (ICP) algorithm constructs a rigid transformation by matching query points P i (from UAV) with corresponding points Q i (from SLAM), which iteratively and accurately aligns the two datasets through repeated searching and transformation until convergence is achieved. The KD-tree is constructed for the initial position point cloud dataset before the iterative process, where each node represents a point, and the tree’s segmentation axes (i.e., x, y and z coordinate axes) are determined by the position of the points. In each iteration, for the target points, the KD-tree can be used to find the closest point in the reference point cloud. The convergence criterion between the reference point cloud and the target point cloud is the transformation error d R M S P , Q . If d R M S P , Q is less than the convergence threshold (minimum distance ε), the algorithm stops iterating; otherwise, it proceeds to the next iteration.
d R M S P , Q = 1 n i , j = 1 n x i x j 2 + y i y j 2 + z i z j 2 < ε 1 j ε
where x i , y i , z i are the three-dimensional coordinates of the reference points (i.e., UAV), and x j , y j , z j are the three-dimensional coordinates of the target points (i.e., SLAM). ε is the minimum distance threshold between two points, and n and m are the number of reference and target points, respectively.

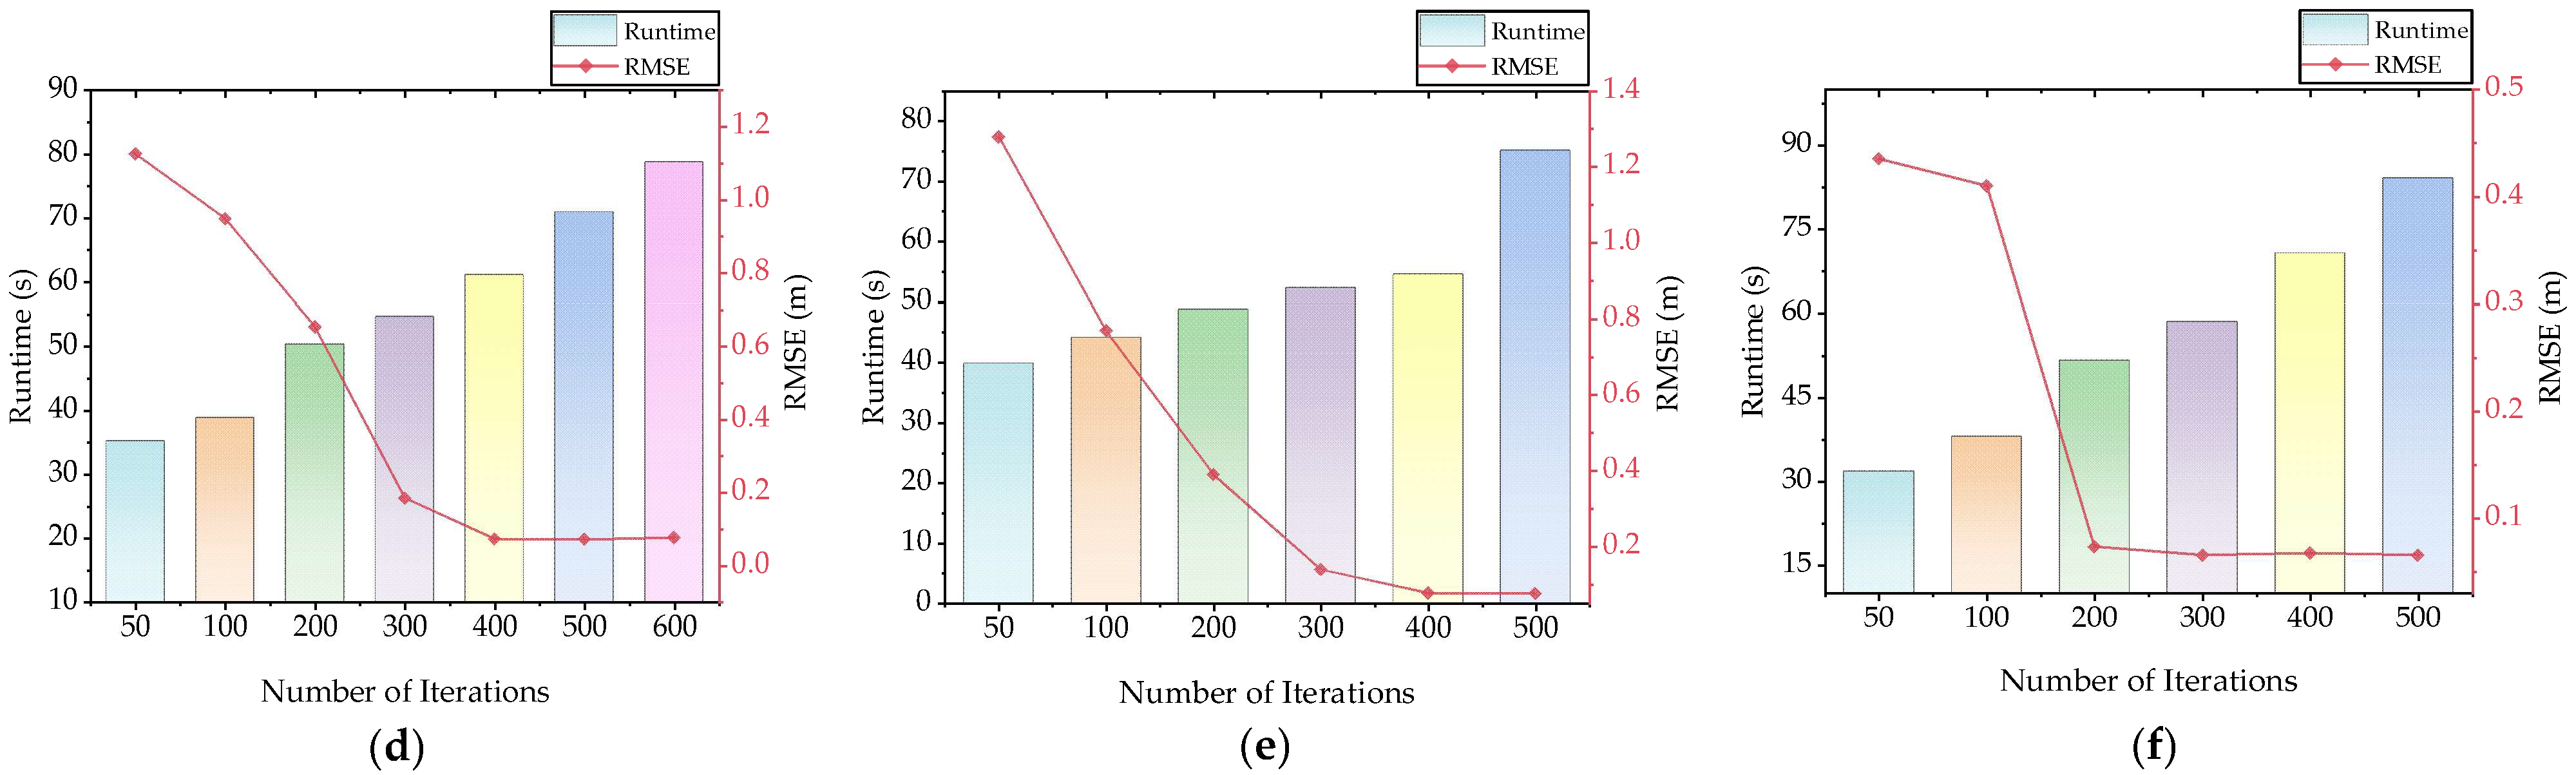
2.7. Accuracy Assessment

Non-rigid transformation is a type of transformation that allows objects to undergo shape changes, whereas the translations and rotations performed by the aligned LiDAR point cloud are rigid transformations. It means that the relative positions and distances between the parts of the object do not change after the transformation. The transformation error between reference and target points can be expressed by calculating the Euclidean distance between corresponding points. This distance metric takes into account differences in both horizontal and vertical directions, thereby considering the positional offset between matched point pairs. Mean absolute distance (MAD) and root mean square error (RMSE) are used in this research to quantitatively evaluate the performance of the two coarse-to-fine algorithms as follows:
MAD = 1 n i = 1 n x i x i
RMSE = 1 n i = 1 n x i x i 2
where x i represents a point in the reference point cloud, x i represents the corresponding point in the transformed point cloud, x i x i represents the Euclidean distance between corresponding points x i and x i , and n is the number of corresponding points.

3. Result

3.1. Qualitative Evaluation

Figure 4 shows the coarse registration results of two point cloud datasets using both the traditional RANSAC algorithm and the improved RANSAC algorithm. Additionally, the introduction of FPFH descriptors required the normals of points and the neighborhood radius for the query point. In this study, the computation of point normals and the search radius for querying points were set to 1 m and 2 m, respectively. The number of iterations was set to 1000. In Figure 4, it can be seen that only a few samples managed to achieve a close registration between the two platform datasets by the traditional RANSAC algorithm. Most target samples showed large deviations away from the reference point cloud. In contrast, the RANSAC algorithm based on bidirectional feature matching (i.e., RBFM algorithm) achieved robust coarse alignment results for different stand types (broadleaf and coniferous) at the same number of iterations.
Figure 5 shows the visual evaluation of fine registration using the ICP algorithm to align canopy details after obtaining the initial position through coarse registration for both stand types. Both algorithms (i.e., R-ICP and RBFM-ICP) showed excellent registration performance in global alignment, but the RBFM-ICP algorithm performed better in local alignment (i.e., slices II and III). Due to the capability of the SLAM laser to effectively scan the understory environment, both algorithms showed the potential to fit the cross-sections of tree trunks into complete circles (slice I). However, when examining the registration of tree trunks and canopies (slices II, III), the two algorithms showed some differences. (1) Trunk section (Slice II): the RBFM-ICP algorithm presented more details compared to the R-ICP algorithm. In terms of the branching of the main trunk, the improved algorithm was able to capture more challenging structures. However, individual secondary branches presented more ambiguity in the R-ICP algorithm. (2) Crown Section (Slice III): the RBFM-ICP algorithm exhibited higher accuracy compared to the R-ICP algorithm. The alignment of individual branches was more precise, and the canopy’s highest point was closer to the central axis of the trunk. It was worth noting that, in comparison to broadleaf forests, there was almost no horizontal offset at the highest point of the canopy of coniferous forest. This was because broadleaf forestw, with their irregular leaf shapes, were prone to falling into a local minimum and sliding along flat surfaces, resulting in a misalignment of the highest point [51].

3.2. Quantitative Evaluation

In this study, the performance of the two registration algorithms was quantified based on the mean absolute distance between the two point cloud data in the vertical and horizontal directions. According to the statistical results in Table 3 and Table 4, the mean absolute distance (i.e., MAD) values of the two coarse-to-fine registration algorithms were less than 17 cm in both the horizontal and vertical directions, with the distance in the vertical direction being smaller. The RBFM-ICP algorithm had higher accuracy than the R-ICP algorithm in both directions (broadleaf forests: MAD reduced horizontally by 2.295 cm and vertically by 0.45 cm; coniferous forests: MAD reduced horizontally by 0.734 cm and vertically by 0.764 cm), and the performance of the RBFM-ICP algorithm was consistent with Figure 5. The transformation matrices of the two registration algorithms (R-ICP and RBFM-ICP) were also compared. In broadleaf forests, the horizontal transformation error was reduced by 14.43%, and the vertical transformation error was reduced by 8.84% (horizontal RMSE: 16.366 vs. 14.003 cm; vertical RMSE: 13.514 vs. 12.319 cm). In coniferous forests, the transformation error was reduced by 4.28% in the horizontal direction and 6.4% in the vertical direction (horizontal RMSE: 7.661 vs. 7.333 cm; vertical RMSE: 7.434 vs. 6.958 cm).
Furthermore, the accuracy of both algorithms in the vertical direction was slightly higher than that in the horizontal direction. This result was consistent with the findings of Zhao [36]. The possible reasons for this phenomenon included: (1) the laser scanning beam characteristics, which led to the formation of a uniform scan line in the vertical direction, while in the horizontal direction, it might have been affected by obstacles or reflections, which reduced the registration accuracy of the blade in the horizontal direction; (2) for UAV-LiDAR, the canopy penetration phenomenon could be divided into two directions, vertical and horizontal directions. At an angle of approximately 27°, it reached saturation. In the unsaturated state, the penetration in the vertical direction might have been greater than that in the horizontal direction [5]. Thus, more canopy information was reflected in the vertical direction.
Among different forest types, coniferous forests achieved higher transformation accuracy. From the results in Table 3, it can be seen that the transformation errors in the broadleaf forest dataset were significantly larger than those in the coniferous forest dataset. The mean absolute distance varied between 10 cm and 17 cm, with the second plot in the locust tree forest having the largest mean absolute distance and root mean square error among all datasets. Additionally, Table 4 shows that the mean absolute distance for the three sample plots ranged from 6 cm to 7.5 cm, and under the RBFM-ICP algorithm, the mean absolute distance was compressed to the range of 5 cm to 7 cm. Notably, the third plot in the spruce forest attained the smallest mean absolute distance and root mean square error among all datasets. This was because coniferous forests had a more regular canopy structure and leaf profile compared to broadleaf forests, leading to easier extraction of multidimensional features such as stable normal vectors and angles. Overall, the quality of the registration was affected by the type of forest plot, but the improved algorithm was stable and accurate for aligning the SLAM and UAV-LiDAR point cloud.

4. Discussion

4.1. Runtime Performance Analysis of the Proposed Method

The proposed method and all experiments were implemented on a computer with an Intel (R) Core (TM) i5-12500H CPU @ 2.50 GHz and 16.0 GB RAM. The pre-processing of the LiDAR data was performed with the “Point Cloud Magic v2.0” software (PCM was developed by the team of Professor Cheng Wang). Access to the software can be found at http://www.lidarcas.cn/soft (accessed on 20 August 2023). And the other operations were implemented by C++ programming. For the C++ compilation environment, we used tools such as Visual Studio 2013 for development and compilation.
The algorithms did not require specific settings for other parameters except for the number of coarse registration iterations and the iteration termination condition for ICP (i.e., ε: representing the minimum distance threshold between reference and target points).
Furthermore, this study used the R-ICP algorithm in different types of forest stand scenarios, which required an average of 1000 iterations to achieve convergence in the registration results (average runtime: 141.575 s). However, the improved registration algorithm by bidirectional feature matching compressed the average number of iterations to 340, which significantly improved the registration efficiency. Figure 6 shows the execution efficiency and transformation error of the RBFM-ICP algorithm for various scenarios with different numbers of iterations.
From Figure 6, the number of iterations significantly decreased for all six datasets when the transformation error met the threshold conditions. Among them, the efficiency of the locust tree forest 2 dataset was the highest, with the number of iterations reduced to 40 and the execution time shortened to 36.21 s, which improved the execution efficiency by 74.42% compared with the R-ICP algorithm. The number of iterations for other datasets was compressed to 200–500, the execution time was compressed to 54 s–140 s, and the execution efficiency was improved by 1.12%–61.86% compared with the R-ICP algorithm. In addition, for the locust tree forest 1 dataset, the number of iterations between 300 and 400 showed a sharp decrease in transformation errors, indicating the presence of other iteration counts within this range that satisfied the transformation error threshold.
Overall, the RBFM-ICP algorithm used FPFH descriptors to extract geometric relationships within a specific range to generate 33-dimensional features, which were used to construct matching indexes for the most similar point pairs of point cloud data from the two platforms and to reduce the subset of point clouds for which RANSAC randomly fits a robust model. It was worth noting that the RBFM-ICP algorithm was similarly evaluated for performance on datasets with different forest stand types. The transformation error of coniferous forests was lower than that of broadleaf forests, and this result was similar to that of Zhao et al. [36] (RMSE for coniferous forests: 0.0384 m; RMSE for broadleaf forests: 0.1279 m). This was because coniferous trees have obvious apical or umbrella structures compared to broadleaf trees [52]. Thus, the sparse canopy of conifers formed by the apical structure and needle-shaped leaves was susceptible to capture by UAV, which provided more canopy details to the registration algorithm than broadleaf trees [47,53,54]. In addition, most of the existing studies that successfully match multi-source data are time-consuming. For example, Dai et al. [24] achieved the registration of TLS and ULS in a 32 m × 32 m sample plot with an average execution time of 10.8 min. Zhang et al. [49] proposed a workflow for automatically registering multi-source point clouds without the need for manual markers, with an average execution time of 53.23 s for the coarse registration of UAV and TLS data. Therefore, it is promising to apply the improved algorithm to register SLAM and UAV accurately and efficiently for dense forests in the future.

4.2. Correlation Analysis Based on Matched Point Pairs

The bidirectional feature matching proposed in this study was mainly performed by calculating the similarity of FPFH between the query point and the search point and storing the index of the point with the highest calculated similarity. We used the Pearson correlation coefficient to calculate the correlation of each set of matched point pairs to represent the similarity between them. Before calculating the correlation of matched pairs of points, we transformed the 33-dimensional feature vectors of each feature point of the two datasets into arrays for easy calculation. Figure 7 shows the average similarity between the forward and reverse matching processes.
From Figure 7, the average similarity of both forward and reverse matching processes for coniferous forests was significantly higher than that for broadleaf forests. It was worth noting that for the three datasets of broadleaf forests, the forward similarity was mainly distributed between 0.85 and 0.91, while the reverse similarity was mainly distributed between 0.37 and 0.40, with a large difference in forward and reverse similarity. In contrast, the forward and reverse similarity of the three datasets for coniferous forests showed a high degree of consistency, clustered between 0.97 and 0.98. This indicated that for different stand types, coniferous forests have a greater probability of identifying the best feature match than broadleaf forests.
Furthermore, as shown in Table 5, three datasets for coniferous forests had higher matched point pairs than broadleaf forests, with the average matched point pairs for the two stand types being 50 and 2773, respectively. The poplar forest had the lowest number of matched point pairs, with only 35 matched pairs, while the spruce 1 sample plot had the highest number of matched point pairs, with 2845 pairs. Matched pairs of points were concentrated between 30–70 pairs for broadleaf forests and between 2700–2850 pairs for coniferous forests. The results showed that compared to broadleaf forests, coniferous forests had a more regular canopy structure and leaf contours, which facilitated the extraction of feature information and increased the number of matched point pairs.

4.3. Effect Analysis of the Coarse Registration

The coarse registration results of point cloud data from different platforms will directly affect the accuracy of fine registration. In order to compare the effect of the two coarse registration algorithms on ICP, we analyzed their effects in terms of efficiency and accuracy of the ICP registration at the same number of iterations (1000 iterations). The results of the two algorithms are summarized in Table 6 and Table 7.
As can be seen from Table 6 and Table 7, the coarse registration results based on the traditional RANSAC algorithm were primarily in the range of 55 cm–73 cm, while the coarse registration results of the RBFM algorithm were mainly concentrated in the range of 16 cm–38 cm. The accuracy of the improved coarse registration algorithm was significantly better than the traditional coarse registration algorithm, which had been improved by 47.95%–70.91%. Among them, the coarse registration RMSE of spruce sample 2 and sample 3 based on the RBFM algorithm reached approximately 17 cm.
It is worth noting that the accuracy of coarse registration results directly affected the execution time and precision of the ICP registration algorithm. Based on the traditional RANSAC algorithm for ICP registration, the execution time was mainly concentrated in 20 s–29 s, and the RMSE after fine registration ranged between 7 cm–16.5 cm. In contrast, the execution time of ICP registration based on the RBFM algorithm was mainly in the range of 4 s–13.1 s, and the RMSE after fine registration was concentrated in the range of 6.5 cm–14.5 cm. Improved RANSAC algorithm increased the efficiency of the ICP registration by 54.83%–80%. Therefore, we concluded that the accuracy of coarse registration results directly affected the fine registration algorithm. The RBFM algorithm reduced the execution time of the ICP algorithm and increased the final registration accuracy.
In addition, it could also be seen from the two tables that the improved RANSAC algorithm took a longer execution time compared to the traditional RANSAC algorithm for the same number of iterations. Therefore, the RBFM algorithm did not have an advantage for the same number of iterations. We analyzed the reasons for this, mainly because it took more time to calculate the Pearson correlation coefficient of matched pairs and the process of filtering non-matched points by bidirectional feature matching. This is also a direction for further exploration of the study in the future.

4.4. Limitations

In this study, our proposed RBFM-ICP algorithm successfully achieves the registration of SLAM without absolute coordinate and UAV-LiDAR point cloud data. This accomplishment is expected to facilitate the synergistic utilization of multi-platform LiDAR data and can provide a promising solution for accurate quantification of individual tree parameters, efficient forest inventories, precise forest monitoring and sustainable forest management. Nevertheless, there are still some limitations to our proposed method. The experiments were only conducted on small-scale plots (i.e., 30 m × 30 m) in secondary forests in northern China. To improve the generalizability of the algorithm, it is necessary to test the accuracy and efficiency in other stand types (e.g., mixed broadleaf–coniferous forests and tropical rainforests) and in large-scale sample plots (e.g., 100 m × 100 m). For example, Terryn et al. [51] performed a fusion of terrestrial and UAV laser scanning data in an Australian rainforest and compared it with survey data. The results of the study indicated that fused data significantly improved the quantification accuracy of forest structures at large landscape scales. Therefore, our research awaits further refinement in the future.

5. Conclusions

The establishment of multi-platform LiDAR data fusion is of great significance for accurately obtaining forest structural parameters to quantify the contribution of forests to the global carbon cycle and monitor environmental issues. We propose an automated, nearly parameter-free registration algorithm, which successfully achieves the registration of SLAM without absolute coordinate and UAV-LiDAR point cloud data. The improved RANSAC algorithm, which introduces bidirectional feature matching, filters a large number of non-corresponding points and significantly reduces the number of iterations while ensuring accuracy.
From the experimental results, it is found that the proposed method achieves good performance in terms of registration accuracy and execution efficiency, and higher accuracy of registration is realized under different forest types and stem densities. This suggests that the algorithm facilitates multi-source LiDAR data fusion and provides a generalized and robust method for accurate quantification of forest structural parameters and forest inventory. However, the performances of this improved algorithm for LiDAR data fusion on other forest types for different LiDAR platform data should be further investigated.

Author Contributions

Conceptualization, S.Z. and H.W.; methodology, S.Z. and H.W.; software, C.W. and Y.W.; validation, S.W.; investigation, Z.Y.; resources, Z.Y.; data curation, S.Z.; writing—original draft preparation, S.Z.; writing—review and editing, S.Z. and H.W. All authors have read and agreed to the published version of the manuscript.

Funding

This research was supported by the National Natural Science Foundation of China [grant number 42071405], the State Key Project of National Natural Science Foundation of China–Key projects of joint fund for regional innovation and development [grant number U22A20566], the Fundamental Research Funds for the Universities of Henan Province [grant number NSFRF220203] and the Science and Technology Research Project of Henan Province [No. 232102321104].

Data Availability Statement

The data used to support the findings of this study are presented in the article. Further inquiries can be directed to the corresponding author.

Acknowledgments

We thank the support of Saihanba National Forest Park in Hebei Province, China for the experiments, and we also thank the team led by researcher Cheng Wang for planning and developing the “Point Cloud Magic” software (http://www.lidarcas.cn/soft, accessed on 20 August 2023).

Conflicts of Interest

The authors declare no conflicts of interest.

References

  1. Chambers, J.Q.; Asner, G.P.; Morton, D.C.; Anderson, L.O.; Saatchi, S.S.; Espírito-Santo, F.D.B.; Palace, M.; Carlos, S., Jr. Regional ecosystem structure and function: Ecological insights from remote sensing of tropical forests. Trends Ecol. Evol. 2007, 22, 414–423. [Google Scholar] [CrossRef] [PubMed]
  2. Noë, J.L.; Erb, K.H.; Matej, S.; Magerl, A.; Bhan, M.; Gingrich, S. Altered Growth Conditions More Than Reforestation Counteracted Forest Biomass Carbon Emissions 1990–2020. Nat. Commun. 2021, 12, 6075. [Google Scholar] [CrossRef] [PubMed]
  3. Li, Z.; Liu, Q.; Pang, Y. Review on forest parameters inversion using LiDAR. Remote Sens. 2016, 20, 1138–1150. [Google Scholar] [CrossRef]
  4. Luo, S.; Wang, C.; Xi, X.; Pan, F.; Peng, D.; Zou, J.; Nie, S.; Qin, H. Fusion of airborne LiDAR data and hyperspectral imagery for aboveground and belowground forest biomass estimation. Ecol. Indic. 2017, 73, 378–387. [Google Scholar] [CrossRef]
  5. Liang, X.; Kankare, V.; Hyyppä, J.; Wang, Y.; Kukko, A.; Haggrén, H.; Yu, X.; Kaartinen, H.; Jaakkola, A.; Guan, F.; et al. Terrestrial laser scanning in forest inventories. ISPRS J. Photogramm. Remote Sens. 2016, 115, 63–77. [Google Scholar] [CrossRef]
  6. Jin, S.; Sun, X.; Wu, F.; Su, Y.; Li, Y.; Song, S.; Xu, K.; Ma, Q.; Baret, F.; Jiang, D.; et al. Lidar sheds new light on plant phenomics for plant breeding and management: Recent advances and future prospects. ISPRS J. Photogramm. Remote Sens. 2021, 171, 202–223. [Google Scholar] [CrossRef]
  7. Guo, Q.; Su, Y.; Hu, T.; Guan, H.; Jin, S.; Zhang, J.; Zhao, X.; Xu, K.; Wei, D.; Kelly, M.; et al. Lidar Boosts 3D Ecological Observations and Modelings: A Review and Perspective. IEEE Geosci. Remote Sens. Mag. 2021, 9, 232–257. [Google Scholar] [CrossRef]
  8. Wang, Y.; Ni, W.; Sun, G.; Chi, H.; Zhang, Z.; Guo, Z. Slope-adaptive waveform metrics of large footprint lidar for estimation of forest aboveground biomass. Remote Sens. Environ. 2019, 224, 386–400. [Google Scholar] [CrossRef]
  9. Guan, H.; Su, Y.; Hu, T.; Wang, R.; Ma, Q.; Yang, Q.; Sun, X.; Li, Y.; Jin, S.; Zhang, J.; et al. A Novel Framework to Automatically Fuse Multiplatform LiDAR Data in Forest Environments Based on Tree Locations. IEEE Trans. Geosci. Remote Sens. 2020, 58, 2165–2177. [Google Scholar] [CrossRef]
  10. Panagiotidis, D.; Abdollahnejad, A.; Slavik, M. 3D point cloud fusion from UAV and TLS to assess temperate managed forest structures. Int. J. Appl. Earth Obs. Geoinf. 2022, 112, 102917. [Google Scholar] [CrossRef]
  11. Zhang, W.; Wan, P.; Wang, T.; Cai, S.; Chen, Y.; Jin, X.; Yan, G. A novel approach for the detection of standing tree stems from plot-level terrestrial laser scanning data. Remote Sens. 2019, 11, 211. [Google Scholar] [CrossRef]
  12. Nunes, M.H.; Camargo, J.L.C.; Vincent, G.; Calders, K.; Oliveira, R.S.; Huete, A.; Moura, Y.M.d.; Nelson, B.; Smith, M.N.; Stark, S.C.; et al. Forest fragmentation impacts the seasonality of Amazonian evergreen canopies. Nat. Commun. 2022, 13, 917. [Google Scholar] [CrossRef]
  13. Liu, Q.; Ma, W.; Zhang, J.; Liu, Y.; Xu, D.; Wang, J. Point-cloud segmentation of individual trees in complex natural forest scenes based on a trunk-growth method. J. For. Res. 2021, 32, 2403–2414. [Google Scholar] [CrossRef]
  14. Wallace, L.; Musk, R.; Lucieer, A. An Assessment of the Repeatability of Automatic Forest Inventory Metrics Derived From UAV-Borne Laser Scanning Data. IEEE Trans. Geosci. Remote Sens. 2014, 52, 7160–7169. [Google Scholar] [CrossRef]
  15. Balsi, M.; Esposito, S.; Fallavollita, P.; Nardinocchi, C. Single-tree detection in high-density LiDAR data from UAV-based survey. Eur. J. Remote Sens. 2018, 51, 679–692. [Google Scholar] [CrossRef]
  16. Liu, G.; Wang, J.; Dong, P.; Chen, Y.; Liu, Z. Estimating Individual Tree Height and Diameter at Breast Height (DBH) from Terrestrial Laser Scanning (TLS) Data at Plot Level. Forests 2018, 9, 398. [Google Scholar] [CrossRef]
  17. Liu, L.; Pang, Y.; Li, Z.; Si, L.; Liao, S. Combining Airborne and Terrestrial Laser Scanning Technologies to Measure Forest Understorey Volume. Forests 2017, 8, 111. [Google Scholar] [CrossRef]
  18. Proudman, A.; Ramezani, M.; Digumarti, S.T.; Chebrolu, N.; Fallon, M. Towards real-time forest inventory using handheld LiDAR. Rob. Auton. Syst. 2022, 157, 104240. [Google Scholar] [CrossRef]
  19. Bauwens, S.; Bartholomeus, H.; Calders, K.; Lejeune, P. Forest Inventory with Terrestrial LiDAR: A Comparison of Static and Hand-Held Mobile Laser Scanning. Forests 2016, 7, 127. [Google Scholar] [CrossRef]
  20. Tai, H.; Xia, Y.; Yan, M.; Li, C.; Kong, X. Construction of Artificial Forest Point Clouds by Laser SLAM Technology and Estimation of Carbon Storage. Appl. Sci. 2022, 12, 10838. [Google Scholar] [CrossRef]
  21. Ghorbani, F.; Chen, Y.; Hollaus, M.; Pfeifer, N. A Robust and Automatic Algorithm for TLS–ALS Point Cloud Registration in Forest Environments Based on Tree Locations. IEEE J. Sel. Top. Appl. Earth Obs. Remote Sens. 2024, 17, 4015–4035. [Google Scholar] [CrossRef]
  22. Zhou, R.; Sun, H.; Ma, K.; Tang, J.; Chen, S.; Fu, L.; Liu, Q. Improving Estimation of Tree Parameters by Fusing ALS and TLS Point Cloud Data Based on Canopy Gap Shape Feature Points. Drones 2023, 7, 524. [Google Scholar] [CrossRef]
  23. Shenkin, A.; Chandler, C.J.; Boyd, D.S.; Jackson, T.; Disney, M.; Majalap, N.; Nilus, R.; Foody, G.; bin Jami, J.; Reynolds, G. The World’s Tallest Tropical Tree in Three Dimensions. Front. For. Glob. Change 2019, 2, 32. [Google Scholar] [CrossRef]
  24. Dai, W.; Yang, B.; Liang, X.; Dong, Z.; Huang, R.; Wang, Y.; Li, W. Automated fusion of forest airborne and terrestrial point clouds through canopy density analysis. ISPRS J. Photogramm. Remote Sens. 2019, 156, 94–107. [Google Scholar] [CrossRef]
  25. Zhang, Z.; Chen, G.; Wang, X.; Shu, M. DDRNet: Fast point cloud registration network for large-scale scenes. ISPRS J. Photogramm. Remote Sens. 2021, 175, 184–198. [Google Scholar] [CrossRef]
  26. Wang, M.; Im, J.; Zhao, Y.; Zhen, Z. Multi-Platform LiDAR for Non-Destructive Individual Aboveground Biomass Estimation for Changbai Larch (Larix olgensis Henry) Using a Hierarchical Bayesian Approach. Remote Sens. 2022, 14, 4361. [Google Scholar] [CrossRef]
  27. Paris, C.; Kelbe, D.; van Aardt, J.; Bruzzone, L. A Novel Automatic Method for the Fusion of ALS and TLS LiDAR Data for Robust Assessment of Tree Crown Structure. IEEE Trans. Geosci. Remote Sens. 2017, 55, 3679–3693. [Google Scholar] [CrossRef]
  28. Polewski, P.; Erickson, A.; Yao, W.; Coops, N.; Krzystek, P.; Stilla, U. Object-based coregistration of terrestrial photogrammetric and ALS point clouds in forested areas. ISPRS Ann. Photogramm. Remote Sens. Spatial Inf. Sci. 2016, 3, 347–354. [Google Scholar] [CrossRef]
  29. Lu, W.; Wan, G.; Zhou, Y.; Fu, X.; Yuan, P.; Song, S. DeepVCP: An End-to-End Deep Neural Network for Point Cloud Registration. In Proceedings of the IEEE/CVF International Conference on Computer Vision (ICCV), Seoul, Republic of Korea, 27 October–2 November 2019. [Google Scholar]
  30. Wang, Y.; Solomon, J. Deep Closest Point: Learning Representations for Point Cloud Registration. In Proceedings of the IEEE/CVF International Conference on Computer Vision (ICCV), Seoul, Republic of Korea, 27 October–2 November 2019. [Google Scholar]
  31. Biber, P.; Strasser, W. The normal distributions transform: A new approach to laser scan matching. In Proceedings of the IEEE/RSJ International Conference on Intelligent Robots and Systems (IROS 2003), Las Vegas, NV, USA, 27 October–1 November 2003. [Google Scholar]
  32. Hong, H.; Lee, B.H. Probabilistic normal distributions transform representation for accurate 3D point cloud registration. In Proceedings of the IEEE/RSJ International Conference on Intelligent Robots and Systems (IROS), Vancouver, BC, Canada, 24–28 September 2017. [Google Scholar]
  33. Wang, X.; Chen, Q.; Wang, H.; Li, X.; Yang, H. Automatic registration framework for multi-platform point cloud data in natural forests. Int. J. Remote Sens. 2023, 44, 4596–4616. [Google Scholar] [CrossRef]
  34. Rusu, R.B.; Marton, Z.C.; Blodow, N.; Beetz, M. Persistent Point Feature Histograms for 3D Point Clouds. Comput. Sci. 2008, 16, 1834227. [Google Scholar]
  35. Rusu, R.B.; Blodow, N.; Beetz, M. Fast Point Feature Histograms (FPFH) for 3D registration. In Proceedings of the IEEE International Conference on Robotics and Automation, Kobe, Japan, 12–17 May 2009. [Google Scholar]
  36. Zhao, Y.; Im, J.; Zhen, Z.; Zhao, Y. Towards accurate individual tree parameters estimation in dense forest: Optimized coarse-to-fine algorithms for registering UAV and terrestrial LiDAR data. GISci. Remote Sens. 2023, 60, 2197281. [Google Scholar] [CrossRef]
  37. Chen, J.; Zhao, D.; Zheng, Z.; Xu, C.; Pang, Y.; Zeng, Y. A clustering-based automatic registration of UAV and terrestrial LiDAR forest point clouds. Comput. Electron. Agric. 2024, 217, 108648. [Google Scholar] [CrossRef]
  38. Fischler, M.A.; Bolles, R.C. Random sample consensus: A paradigm for model fitting with applications to image analysis and automated cartography. Commun. ACM 1981, 24, 381–395. [Google Scholar] [CrossRef]
  39. Raguram, R.; Chum, O.; Pollefeys, M.; Matas, J.; Frahm, J.-M. USAC: A Universal Framework for Random Sample Consensus. IEEE Trans. Pattern Anal. Mach. Intell. 2013, 35, 2022–2038. [Google Scholar] [CrossRef]
  40. Dai, W.; Kan, H.; Tan, R.; Yang, B.; Guan, Q.; Zhu, N.; Xiao, W.; Dong, Z. Multisource forest point cloud registration with semantic-guided keypoints and robust RANSAC mechanisms. Int. J. Appl. Earth Obs. Geoinf. 2022, 115, 103105. [Google Scholar] [CrossRef]
  41. Tao, W.; Xiao, Y.; Wang, R.; Lu, T.; Xu, S. A Fast Registration Method for Building Point Clouds Obtained by Terrestrial Laser Scanner via 2D Feature Points. IEEE J. Sel. Top. Appl. Earth Obs. Remote Sens. 2024, 17, 9324–9336. [Google Scholar] [CrossRef]
  42. Besl, P.J.; McKay, N.D. A method for registration of 3-D shapes. IEEE Trans. Pattern Anal. Mach. Intell. 1992, 14, 239–256. [Google Scholar] [CrossRef]
  43. Shi, X.; Liu, T.; Han, X. Improved Iterative Closest Point (ICP) 3D point cloud registration algorithm based on point cloud filtering and adaptive fireworks for coarse registration. Int. J. Remote Sens. 2020, 8, 3197–3220. [Google Scholar] [CrossRef]
  44. Bouaziz, S.; Tagliasacchi, A.; Pauly, M. Sparse Iterative Closest Point. Comput. Graph. Forum. 2013, 32, 113–123. [Google Scholar] [CrossRef]
  45. Zhen, Z.; Yang, L.; Ma, Y.; Wei, Q.; Jin, H.I.; Zhao, Y. Upscaling aboveground biomass of larch (Larix olgensis Henry) plantations from field to satellite measurements: A comparison of individual tree-based and area-based approaches. GISci. Remote Sens. 2022, 59, 722–743. [Google Scholar] [CrossRef]
  46. Li, S.; Wang, J.; Liang, Z.; Su, L. Tree point clouds registration using an improved ICP algorithm based on kd-tree. In Proceedings of the IEEE International Geoscience and Remote Sensing Symposium (IGARSS), Beijing, China, 10–15 July 2016. [Google Scholar]
  47. Ren, T.; Wu, R. An Acceleration Algorithm of 3D Point Cloud Registration Based on Iterative Closet Point. In Proceedings of the Asia-Pacific Conference on Image Processing, Electronics and Computers (IPEC), Dalian, China, 14–16 April 2020. [Google Scholar]
  48. Xiong, B.; Jiang, W.; Li, D.; Qi, M. Voxel Grid-Based Fast Registration of Terrestrial Point Cloud. Remote Sens. 2021, 13, 1905. [Google Scholar] [CrossRef]
  49. Zhang, W.; Shao, J.; Jin, S.; Luo, L.; Ge, J.; Peng, X.; Zhou, G. Automated Marker-Free Registration of Multisource Forest Point Clouds Using a Coarse-to-Global Adjustment Strategy. Forests 2021, 12, 269–285. [Google Scholar] [CrossRef]
  50. Wang, Y.; Yan, C.; Feng, Y.; Du, S.; Dai, Q.; Gao, Y. STORM: Structure-Based Overlap Matching for Partial Point Cloud Registration. IEEE Trans. Pattern Anal. Mach. Intell. 2023, 45, 1135–1149. [Google Scholar] [CrossRef]
  51. Terryn, L.; Calders, K.; Bartholomeus, H.; Bartolo, R.E.; Brede, B.; D’hont, B.; Disney, M.; Herold, M.; Lau, A.; Shenkin, A.; et al. Quantifying tropical forest structure through terrestrial and UAV laser scanning fusion in Australian rainforests. Remote Sens. Environ. 2022, 271, 112912. [Google Scholar] [CrossRef]
  52. Calders, K.; Adams, J.; Armston, J.; Bartholomeus, H.; Bauwens, S.; Bentley, L.P.; Chave, J.; Danson, F.M.; Demol, M.; Disney, M.; et al. Terrestrial laser scanning in forest ecology: Expanding the horizon. Remote Sens. Environ. 2020, 251, 112102. [Google Scholar] [CrossRef]
  53. Cline, M.G.; Deppong, D.O. The Role of Apical Dominance in Paradormancy of Temperate Woody Plants: A Reappraisal. J. Plant Physiol. 1999, 155, 350–356. [Google Scholar] [CrossRef]
  54. Barbier, F.F.; Dun, E.A.; Beveridge, C.A. Apical Dominance. Curr. Biol. 2017, 27, 864–865. [Google Scholar] [CrossRef]
Figure 1. (a) Henan Province of China, (b) Luoyang City, (c) Topographic map of Xin’an County, (d) Top-down view of the data collection area, (e) UAV-LiDAR, LiDAR-SLAM and ground-based measurements.
Forests 15 00893 g001
Figure 2. Research workflow.
Forests 15 00893 g002
Figure 3. (1) represents that the original point cloud is downsampled through the voxel grid to preserve the voxel center point. (2) represents the extraction of voxel centroid FPFH features. (3) represents bidirectional matching of the FPFH features for the voxel center points between the reference point cloud and target point cloud.
Forests 15 00893 g003
Figure 4. Coarse registration of two algorithms for different stand types. (a) Coarse registration of the RANSAC algorithm for broadleaf forest. (b) Coarse registration of the RBFM algorithm for broadleaf forest. (c) Coarse registration of the RANSAC algorithm for coniferous forest. (d) Coarse registration of the RBFM algorithm for coniferous forest.
Forests 15 00893 g004
Figure 5. Visual evaluation of two coarse-to-fine alignment algorithms (i.e., R-ICP and RBFM-ICP). (a) Broadleaf forest sample plots. (b) Coniferous forest sample plots. White dots represent UAV data, and elevation-rendered dots represent SLAM data. Slices I, II and III represent the 1.3 m above ground level diameter at breast height (DBH) fitting, trunk and crown sections, respectively.
Forests 15 00893 g005
Figure 6. Execution efficiency and transformation error of the RBFM-ICP algorithm for various scenarios with different numbers of iterations. (ac) Three sample datasets of broadleaf forest; (df) Three sample datasets of coniferous forest.
Forests 15 00893 g006aForests 15 00893 g006b
Figure 7. Average similarity between forward and reverse matching processes.
Forests 15 00893 g007
Table 1. Basic parameters of UAV-LiDAR data.
UAV (D-Lidar 200)Parameters
Laser Scanning InstrumentsRIEGL mini VUX-1UAV
Spot Frequency100 kpts/s
Range Accuracy±5 cm
Laser Divergence Angle1.6 × 0.5 (mrad)
Scanning Speed10–100 lines/s
Measurement Distance (maximum)250 m (>60% reflectance)
330 m (>80% reflectance)
Table 2. Basic parameters of LiDAR-SLAM data.
SLAM 100Parameters
Laser Field of View270° × 360°
Spot Frequency320 kpts/s
Measurement Distance (maximum)120 m
Range Accuracy±5 cm
Echo Intensity8 bits
Table 3. Accuracy assessment of horizontal and vertical direction transformations in broadleaf forests.
Sample PlotR-ICPRBFM-ICP
MAD (cm)RMSE (cm)MAD (cm)RMSE (cm)
locust tree forest 115.874/10.753 *17.726/14.372 *12.982/10.347 *14.027/12.843 *
locust tree forest 216.306/11.463 *18.236/14.753 *13.121/10.74315.221/13.072 *
poplar tree forest11.479/10.349 *13.137/11.417 *10.671/10.126 *12.762/11.042 *
Mean14.553/10.855 *16.366/13.514 *12.258/10.405 *14.003/12.319 *
Std2.181/0.460 *2.293/1.491 *1.124/0.255 *1.004/0.908 *
Note: * indicates vertical direction and unmarked * indicates horizontal direction.
Table 4. Accuracy assessment of horizontal and vertical direction transformations in coniferous forests.
Sample PlotR-ICPRBFM-ICP
MAD (cm)RMSE (cm)MAD (cm)RMSE (cm)
spruce 16.872/6.773 *7.481/7.156 *6.391/6.223 *7.384/6.937 *
spruce 27.496/7.344 *8.385/8.191 *6.708/6.574 *7.931/7.548 *
spruce 36.581/6.326 *7.117/6.955 *5.650/5.353 *6.684/6.390 *
Mean6.983/6.814 *7.661/7.434 *6.249/6.050 *7.333/6.958 *
Std0.382/0.417 *0.533/0.542 *0.443/0.513 *0.510/0.473 *
Note: * indicates vertical direction and unmarked * indicates horizontal direction.
Table 5. Number of matched point pairs for different stand types.
Stand TypeSample PlotMatched PairsMean
Broadleaf forestlocust tree forest 16650
locust tree forest 249
poplar tree forest35
Coniferous forestspruce 128452773
spruce 22748
spruce 32727
Table 6. The effect of the RANSAC algorithm on ICP.
Sample PlotRANSACICP
Runtime (s)RMSE (cm)Runtime (s)RMSE (cm)
locust tree forest 1159.12460.32620.76116.049
locust tree forest 2132.41872.66528.56216.495
poplar tree forest138.36661.50322.35112.277
spruce 187.85655.71321.2627.319
spruce 289.33459.40120.7408.288
spruce 3106.83255.22721.8437.036
Mean118.98860.80622.58711.244
Std26.3475.7792.7333.949
Table 7. The effect of the RBFM algorithm on ICP.
Sample PlotRBFMICP
Runtime (s)RMSE (cm)Runtime (s)RMSE (cm)
locust tree forest 1209.94437.7528.53113.435
locust tree forest 2163.13834.20813.03414.147
poplar tree forest169.38937.2269.17511.902
spruce 1130.33018.4984.9727.161
spruce 2137.68316.8966.1977.740
spruce 3159.02916.9534.4706.537
Mean161.58526.9227.73010.154
Std25.6799.5512.9283.099
Disclaimer/Publisher’s Note: The statements, opinions and data contained in all publications are solely those of the individual author(s) and contributor(s) and not of MDPI and/or the editor(s). MDPI and/or the editor(s) disclaim responsibility for any injury to people or property resulting from any ideas, methods, instructions or products referred to in the content.

