Abstract
The ancient Magnoliaceae family is being seriously threatened by climate change, especially for Yulania trees under threat. Little is currently understood regarding the appropriate geographic range of Yulania zenii, as well as how it has reacted to various climate situations from past to present. Here, we chose MaxEnt for final modeling after first using ten Biomod2 models to approximate its possible distribution in China. The findings indicated that the three main environmental parameters impacting its distribution were the monthly mean diurnal range of temperature, the precipitation seasonality of variation coefficient, and elevation. Currently, its appropriate distribution is primarily in southern Anhui, eastern Hunan, central Hubei, southern Jiangsu, and both northern Jiangxi and Zhejiang. The total suitable area of Y. zenii was found to be 14.68 × 10⁴ km2, only taking up 1.53% of China’s total territory, which is larger than known. During the Last Interglacial and Middle Holocene, its suitable habitats were larger than they are currently, exhibiting a relatively continuous distribution. Under various future climate scenarios, its suitable habitats may averagely decrease by 20.26% compared with the current case, and these habitats may become more fragmented. Collectively, the centroid of Y. zenii is expected to migrate towards the southeast in the future. Therefore, our findings demonstrate, for the first time, that climate change has had an adverse effect on this species in terms of its distribution from the past to the current and into the future. Our study could contribute to the conservation, management, introduction, and cultivation of Y. zenii in China and provide a reference for other endangered Yulania species in this country under the conditions of climate change.
1. Introduction
The spatial distribution of plants is affected by climate [1]. Historical fluctuations in the global climate have significantly influenced the current distribution patterns of most species [2]. As early as the last interglacial period, approximately 12,000–14,000 years ago, when the global temperature was around 2 °C higher than pre-Industrial Revolution levels, numerous plant species survived climate change by migrating to previously unoccupied habitats [3]. The Middle Holocene is the latest typical great warm period, in which the average annual temperature exceeded that of the present day [4]. During the late Holocene Megathermal, most plant populations migrated from low to high latitudes [5]. Over the last few decades, global warming has become more pronounced, thus exacerbating such an impact on plants’ distributions. According to the recently released Sixth Assessment Report of the United Nations Intergovernmental Panel on Climate Change (IPCC), the global temperature is expected to rise by more than 1.5 °C by 2030 [6]. Therefore, global warming may alter the environmental conditions and population sizes of plants, thereby triggering a shift in their distribution range [7].
Climate change plays a pivotal role in influencing plants’ distribution patterns on a regional scale [8]. Generally, endangered tree species are more vulnerable to climate change compared with those widely distributed. This is primarily attributed to the high endemism and small population size of such threatened trees, making them poor at adapting in the face of climate change [9]. Furthermore, these species usually have discontinuous or highly fragmented habitats, resulting in difficulties in migration and even rendering them at risk of extinction in the context of climate change. For instance, Zhao et al. (2020) employed the MaxEnt model to predict the suitable distribution of the endangered Carpinus tientaiensis and pointed out that most of its core distribution will drastically shrink in the next several decades [10]. Yan and Zhang (2022) stated that, for the endemic and endangered Parrotia subaequalis, its suitable habitats in China may become more fragmented under future climate conditions [11]. As a result, endemic tree species may be more vulnerable to climate change.
The family Magnoliaceae originated no later than the early Tertiary [12]. There are 333 species of Magnoliaceae worldwide, of which 185 are threatened, accounting for 55.56% of the total species of Magnoliaceae [13]. There are 112 species in China, of which 80 are threatened, accounting for 71.43% of the total species [14]. Among these Chinese magnolias, Yulania zenii (W. C. Cheng) D. L. Fu is a deciduous tree endemic to China. It was first collected from Baohua Mountain with an altitude of 250–300 m, Jiangsu Province, China, and described as a new Magnolia species, namely Magnolia zenii Cheng, by W. C. Cheng in 1933 [15]. Baohua Mountain is characterized by the north subtropical monsoon climate, with an average annual temperature of 15.4 °C, an average annual precipitation of 1018.6 mm, and a main soil type of brown soil as well [16]. This tree is hysteranthous and usually blooms from March to April every year. It has nine nearly spoon-shaped pink or white tepals for each flower, with an aromatic odor in spring, and it has cylindric aggregate follicles that are purplish red, turning brown in autumn (Figure 1). Its twigs are green when young and become purple when old. Its adult tree has a tall and straight trunk, up to nearly 30 m in height [17]. Therefore, this Chinese magnolia has high value in ornamental horticulture. Meanwhile, it can serve as a valuable material for elucidating molecular phylogeny and floral evolution in Magnoliaceae [18]. This tree has a high level of genetic diversity at the species level [19]. However, its male and female gametophytes’ development is often abnormal [20], its net photosynthetic rate is low (unpublished data from G.F. Zhang), and it faces fierce interspecific competition from neighboring trees [16], all of which are unfavorable for the growth and survival of its tree saplings in fields.
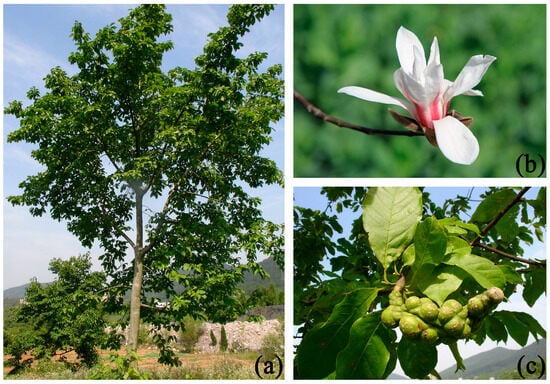
Figure 1.
Photos of Y. zenii in the field. (a) Individuals in the field; (b) blooming flower; and (c) aggregate follicles. The photos were taken by Guangfu Zhang.
Over the past several decades, its wild populations have been increasingly threatened by reproductive barriers and anthropogenic interference, especially due to tourism development in subtropical eastern China [18]. Hence, it has been listed as a second-grade species in the List of National Key Protected Wild Plants since 2021 (https://www.forestry.gov.cn/, accessed on 5 March 2024). In 2023, it was listed as one of China’s 100 most critically endangered species, i.e., Plant Species with Extremely Small Populations in China [21]. Furthermore, it has been classified as a “critically endangered” (CR) species in the IUCN Red List (https://www.iucnredlist.org/, last accessed on 20 March 2024).
Y. zenii is often characterized by a rather restricted geographical range. As stated in the Flora of China (Volume 7), this plant species is exclusively found on Baohua Mountain, located in Jurong City, Jiangsu Province, in eastern China [17]. Subsequently, the majority of academics share a consensus regarding its distribution, as evidenced by Hao et al. (2000) [22], Yin (2013) [23], Liu (2015) [24], and Zhang et al. (2022) [25]. In their 2023 book “National Key Protected Wild Plants of China”, Jin et al. reported that this species was exclusively found on Mt. Baohua [26]. However, recent studies suggest that wild populations of Y. zenii are also present in other provinces. For example, this species was found in North Luoxiao National Forest Park in 2022 [27] and Shending Mountain Provincial Forest Park in 2023 (https://www.forestry.gov.cn/, accessed on 10 March 2024). Both locations are situated in Yueyang City, Hunan Province. Another example is from the mountainous area of northwestern Ruichang City, Jiangxi Province (https://www.jiujiang.gov.cn/, accessed on 15 March 2024). There were 11 individuals of Y. zenii reported therein. It seems that this species currently appears in at least three Chinese provinces, including Jiangsu, Jiangxi in eastern China, and Hunan in central China. Therefore, we think that its actual distribution range should be much wider than its recorded distribution in China.
Species distribution models (SDMs) serve as a crucial instrument in studying the potential impact of climate change on species distributions. Generally, SDMs can predict a species’ suitable area across space and time by integrating its occurrence records with corresponding environmental information [28]. SDMs can be divided into two categories: mechanistic and correlative models. Mechanistic models typically rely on data pertaining to the predicted species’ life history, functional traits, or physiological responses to environmental fluctuations. However, it is challenging to obtain such data, and furthermore, they are only appropriate for well-studied species in terms of functional traits [29]. In contrast, correlative models primarily utilize the known presence (or non-presence) point data of species. Nowadays, correlative models are widely applied due to the accessibility of these data on species distribution and their environment relative to mechanistic models [30]. Currently, correlative models which are widely used include the maximum entropy model (MaxEnt), generalized additive model (GAM), generalized linear model (GLM), random forest model (RF), multivariate adaptive regression spline model (MARS), artificial neural network model (ANN), ecological niche factor analysis model (ENFA), and genetic algorithm for rule-set production model (GARP) [31]. Among them, MaxEnt stands out as one of the most widely utilized SDMs because of its accurate predictions, simple operation, small sample sizes, and effective noise reduction [32,33]. In particular, this model has now been extensively used for predicting the potential distribution of rare and endangered plants, their key environmental factors, as well as suitable habitat selection for their introduction and cultivation under future climate scenarios [34,35]. The reason for this is that such species usually have a limited distribution range and few occurrence records [10]. Even so, each model has its own advantages and disadvantages based on different principles and algorithms. More recently, Biomod2 ensemble models have been developed to predict the potential distributions of endangered species [36]. Biomod2 can improve prediction accuracy with different types of mathematical statistics relative to a single species distribution model and increase the reliability of research results [37]. However, Biomod2 has limitations in its data processing capacity and therefore cannot be used to deal with large areas or high-resolution data [38].
In this study, we first collected data on the distribution points of Y. zenii and related environmental variables (climate, terrain, and soil). Then, we used Biomod2 for pre-modeling. Subsequently, we employed the selected model to predict its potential suitable area in China. This study has three main objectives. Firstly, it aims to identify the key environmental factors that influence the spatial distribution of Y. zenii. Secondly, it aims to predict the potential ranges of Y. zenii under different climate scenarios, including past, current, and future conditions, and determine the routes of migration for its centroid. Lastly, it aims to propose appropriate measures for the conservation and management of Y. zenii.
2. Materials and Methods
2.1. Species Occurrence Data
The data regarding the wild distribution of Y. zenii were primarily obtained through the following approaches: (1) Investigating in field: in the past three years (2021–2023), we carried out comprehensive surveys for Y. zenii wild populations in Anhui, Jiangsu, Jiangxi, Zhejiang, and other provinces of eastern China to acquire their spatial localities. (2) Searching through resource sharing platforms: these include the Global Biodiversity Information Facility (GBIF, https://www.gbif.org/, last accessed on 5 January 2024), the National Specimen Information Infrastructure (NSII, http://nsii.org.cn/, last accessed on 5 January 2024), the Chinese Virtual Herbarium (CVH, https://www.cvh.ac.cn/, last accessed on 5 January 2024), and the Plant Photo Bank of China (PPBC, http://ppbc.iplant.cn/, last accessed on 5 January 2024). (3) Consulting the published literature and relevant reports [27]: we used the key words of Y. zenii’s specific name, Latin name, and its synonym (i.e., Magnolia zenii) in Flora of China, provincial floras, and related checklists to gather its distribution points. In this way, we initially collected 32 natural distribution records of Y. zenii.
After eliminating erroneous and duplicate distribution records, we employed a tool in the SDMs toolbox (version 2.6), which is called Spatially Rarefy Occurrence Data for SDMs, to ensure that each 1 km × 1 km grid contained only one distribution point [39]. This approach to rarefying distribution points is supposed to align with the resolution of the environmental data, aiming to minimize the number of distribution points existing in the spatial autocorrelation and prevent overfitting the model [40]. In the end, we acquired the latitude and longitude data of 12 distribution points of Y. zenii (Figure 2; Table S1). To facilitate data preparation for modeling, the distribution data file was converted into the CSV format.
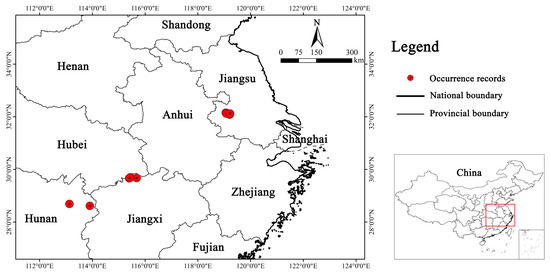
Figure 2.
Distribution of 12 occurrence records of Y. zenii in China.
2.2. Environmental Variables
Thirty-eight selected environmental factors were classified into three categories: climate, terrain, and soil. For climate data, we opted for bioclimatic factors that had been widely used in related research [35,41,42]. Past periods (the last interglacial period, approximately 12,000–14,000 years ago, and the Middle Holocene, around 6000 years ago), the current, and future periods (specifically, the 2050s and 2070s) were all considered in this study. Nineteen bioclimatic factors from these periods were downloaded from Worldclim (https://www.worldclim.org/, accessed on 5 January 2024) (version 1.4). Then, we unified the resolution to 30 s (1 km × 1 km), primarily to guarantee precision during modeling. Given that a single climate model is unrepresentative in predicting future climate scenarios, we chose to use a combined model that integrates multiple climate models [43]. Accordingly, the bioclimatic data for the future periods were obtained by calculating the equally weighted average values of three global climate models: the Beijing Climate Center Climate System Model version 1.1 (BCC-CSM1-1), the Community Climate System Model version 4 (CCSM4), and an Earth system model based on the Model for Interdisciplinary Research on Climate (MIROC-ESM). In the context of future climate, there are four typical Representative Concentration Pathways (RCPs) for greenhouse gases: RCP 2.6, RCP 4.5, RCP 6.0, and RCP 8.5. These pathways represent different scenarios of climate change, ranging from the lowest to the highest emission scenarios. Furthermore, they have been widely employed in examining species’ responses to climate change [44]. Both RCP 4.5 and RCP 6.0 represent intermediate and stable climate change scenarios, with RCP 4.5 being considered more significant than RCP 6.0 [45]. Therefore, we reduced our selection to three commonly utilized RCPs: RCP 2.6 (representing a moderate emission scenario), RCP 4.5 (signifying a medium and stable emission scenario), and RCP 8.5 (indicating a high emission scenario). Ultimately, climate data were collected for six emission scenarios encompassing two future periods: 2050s RCP 2.6, 2050s RCP 4.5, 2050s RCP 8.5, 2070s RCP 2.6, 2070s RCP 4.5, and 2070s RCP 8.5.
In topographic data, elevation and slope were included. Over time, topographic factors typically undergo negligible to no change [46]. As a consequence, they were integrated into the model as constant variables in order to improve the precision of the predicted outcomes. The elevation data were obtained via download from WorldClim (https://www.world-clim.org, accessed on 5 January 2024), ensuring a 30 s spatial resolution. The DEM (Digital Elevation Model) data obtained from the National Earth System Science Data Center (http://www.geodata.cn, accessed on 5 January 2024) were utilized to extract the slope information. The Chinese soil dataset (version 1.2) was obtained from the National Qinghai–Tibet Plateau Scientific Data Center and was also downloaded (http://www.tpdc.ac.cn/zh-hans/, accessed on 5 January 2024). Finally, from the dataset, seventeen varieties of topsoil data (0–30 cm) were selected as the soil data utilized in this study. Considering that the last interglacial period and the Middle Holocene represent two significant paleoclimatic epochs, during which the Earth’s environment underwent profound transformations, only 19 bioclimatic factors were chosen in these two epochs for subsequent modeling [47]. As for the current and future periods, we still selected three distinct types of environmental data: climate, topography, and soil data.
The environmental data from the aforementioned three types were uniformly standardized under the WGS1984 coordinate system. The “Extract by Mask and Clip” tool in the ArcGIS 10.8 software was applied to make sure that the data were only confined to the territory of China. Subsequently, the resampling tool was employed to harmonize the resolution of all the data to a level of 30 s. Concurrently, Pearson’s correlation analysis was used to mitigate collinear interference among correlated environmental factors, ensuring that redundant information did not contaminate the model’s prediction process [48]. This approach significantly enhanced the precision of the prediction outcomes. The specific operation steps are outlined as follows: Initially, the distribution data of Y. zenii and environmental data were input into the model for a preliminary simulation, which allowed us to obtain the original contribution rate of each environmental factor. Afterwards, we utilized the Spatial Analyst tool in ArcGIS 10.8 to extract the value of each environmental factor precisely at all distribution points. Lastly, we conducted a test in R 4.3.1 to determine the Pearson correlation coefficient (r) between these environmental factors. Environmental factors with a low contribution rate among these factors, with correlation coefficient | r | ≥ 0.8, were subsequently eliminated from the analysis [36]. Table 1 presents the environmental factors for subsequent modeling in various periods and their corresponding contribution rates.

Table 1.
Description of 38 environmental variables and percent contribution of variables (in bold font) used in the final MaxEnt model under different climate scenarios. Note: LIG and MH mean the last interglacial period and the Middle Holocene, respectively.
2.3. Modeling Process
Biomod2 is a multi-model ensemble platform that relies on ten widely used modeling techniques [49]. We employed Biomod2 to model the potential distribution of Y. zenii in the current period. By utilizing 75% of the distribution points as the training set, we conducted 10 repeated operations to obtain the AUC and TSS values for each model. By doing so, this practice can enable us to accurately assess its performance. We then noticed that MaxEnt performed much better than each of the others (Table 2).
Table 2.
The mean value (±SD) of the area under curve (AUC) and true skill statistic (TSS) of different model algorithms.
Prior to formal modeling, it is imperative to select suitable values for the regularization multiplier (RM) and feature class (FC) within the MaxEnt model [35]. The regularization multiplier ranged from 0.5 to 4.0, with increments of 0.5, resulting in eight regularization multipliers. The MaxEnt model encompassed five distinct feature types: linear (L), quadratic (Q), hinge (H), product (P), and threshold (T) [42]. After optimizing the MaxEnt model, the final parameter combination was determined to be RM = 1 and FC = LQ. Subsequently, the modeling operation was executed in MaxEnt 3.4.4. Consequently, 25% of the distribution points were randomly chosen as the test set, while the remaining 75% served as the training set. To guarantee the precision of the prediction results, we employed the Bootstrap method to replicate the calculation ten times. Then, we selected “Cloglog” as the output mode and “ASC” as the preserved format.
To evaluate the models’ performance, we utilized the area under the receiver operating characteristic curve (AUC) and the true skill statistic (TSS) [50]. The AUC value typically ranged from 0 to 1, and a value closer to 1 indicated higher accuracy. It can be categorized as follows: failing (0.5–0.6), poor (0.6–0.7), fair (0.7–0.8), good (0.8–0.9), and excellent (0.9–1.0) [51]. The TSS values varied between -1 and +1, with values closer to 1 indicating superior performance, while values closer to or below 0 suggested inferior performance. The models can also be divided into five groups in terms of the TSS: excellent (TSS > 0.8), good (0.6–0.8), fair (0.4–0.6), poor (0.2–0.4), and failing (TSS < 0.2) [52]. The overall performance of the model was assessed by calculating the average AUC and TSS values obtained from 10 replicates.
2.4. Geospatial Data Analysis
The results of 10 average operations generated by MaxEnt were imported into ArcGIS 10.8 for visualization. Given the endangered status of Y. zenii, we employed the approach of maximizing the sum of sensitivity and specificity (max SSS) to set the threshold for the suitable area [53,54]. This threshold selection was considered to be highly effective when using a model with presence-only data to divide suitable areas into different levels [53]. In light of the threshold of the max SSS (0.2639), we categorized the potential distribution of Y. zenii into four levels: unsuitable (0.0–0.27), low suitability (0.27–0.51), moderately suitable (0.51–0.76), and highly suitable (0.76–1.00) [42]. Next, we calculated the suitable area for each type.
Centroid migration can characterize the distribution changes of species under different climatic scenarios. We employed the SDMtoolbox in ArcGIS 10.8 to simulate the changing situation of this species’ centroid migration under nine climate scenarios [40]. Moreover, we also determined their direction and distances in different periods.
3. Results
3.1. Model Performance
We calculated the AUC and TSS values of each model except the GAM, which could not run due to its few occurrence records [55]. Among the nine models (Table 2), MaxEnt had the minimum standard deviation, exhibiting its excellent stability. More importantly, only MaxEnt simultaneously satisfied the criteria of an AUC > 0.9 and a TSS > 0.8, thus indicating its superior performance compared to the other models within Biomod2. Consequently, MaxEnt was ultimately chosen for subsequent modeling.
Using the MaxEnt model, we calculated its AUC and TSS values following 10 simulations under various climate scenarios (Table 3). On the whole, the average AUC value was 0.9820, and the average TSS value was 0.9085, suggesting that MaxEnt performed well.
Table 3.
The mean value (±SD) of the area under curve (AUC) and true skill statistic (TSS) under different climate scenarios using the MaxEnt model.
3.2. Main Environmental Factors
We determined the percentage contribution of selected environmental factors using MaxEnt (Table 1). Among the key environmental factors affecting the distribution of Y. zenii at present, the top three were Bio2 (mean diurnal range), Bio15 (precipitation seasonality of variation coefficient), and elevation. Their contribution rates were, respectively, 32.9%, 21.1%, and 14.8%, with a cumulative proportion of 68.8%. In the last interglacial period, the key environmental factors were Bio15 (43.1%), Bio3 (isothermality, 27.1%), and Bio2 (25.2%), amounting to 95.4%. During the Middle Holocene, the key environmental factors were Bio15 (39.9%), Bio2 (32.1%), and Bio3 (19.4%), respectively; their total contribution rate was up to 91.4%. Under different climate scenarios, Bio2 and Bio15 were recognized as common leading factors.
When the existence probability was greater than 0.51, it corresponded to a moderately or highly suitable area, which was conducive to the growth of Y. zenii. We opted to utilize the response curve generated by MaxEnt to reveal the relationships between environmental factors and the existence probability in the current period (Figure 3). The existence probability of this species showed a trend of first increasing and then decreasing with the change in the mean diurnal range (Bio2) and reached a maximum at 6.88 °C. As shown in Figure 3a, it was optimal for the survival of Y. zenii when the range was 4.87–9.06 °C. Its existence probability gradually decreased with an increasing precipitation seasonality of variation coefficient (Bio15), and its adaptation range was 20–64 (Figure 3b). The suitable values for the elevation factor ranged from 0 to 500 m (Figure 3c). And the existence probability dropped sharply as the elevation rose.
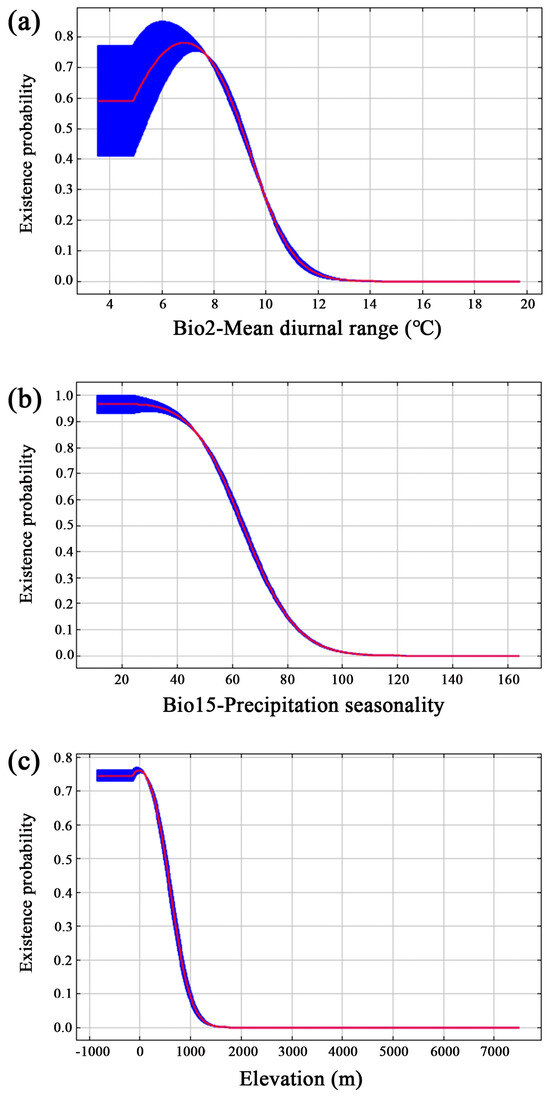
Figure 3.
Response curves of Y. zenii to key bioclimatic variables. (a) Mean diurnal range (Bio2, °C); (b) Precipitation seasonality (Bio15); (c) Elevation (m).
3.3. Current Potential Suitable Distribution
The current suitable area for Y. zenii was found to be primarily concentrated in southern Jiangsu, southern Anhui, northern Zhejiang, eastern Hunan, central Hubei, and northern Jiangxi (Figure 4); additionally, a few suitable areas were forecasted in Sichuan and Chongqing in southwestern China. Overall, the suitable distribution was predominantly concentrated in eastern and central China. The moderately suitable area was relatively continuous, while the highly suitable area was noticeably fragmented (Figure 4). For Y. zenii, its total suitable area was 14.68 × 10⁴ km2, constituting only 1.53% of China’s total territory. Furthermore, its highly suitable area only accounted for 0.55% (Table 4).
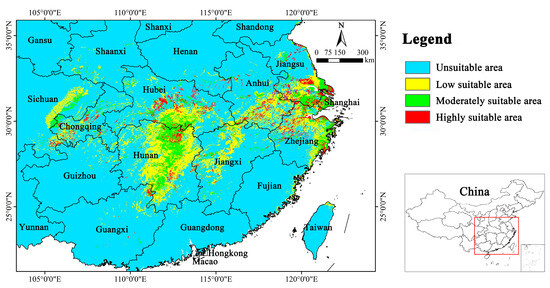
Figure 4.
Potential suitable distribution of Y. zenii under current climate in China.
Table 4.
Potential suitable areas of Y. zenii under different climate scenarios. Up arrow (↑) means increase compared to the current scenario; down arrow (↓) means decrease compared to the current scenario.
3.4. Potential Suitable Distribution in the Past
During the last interglacial period, suitable habitats for Y. zenii were primarily concentrated in eastern Hunan, southern Anhui, southern Jiangsu, northern Zhejiang, and the junction area between Jiangxi, Anhui, and Hubei in China (Figure 5). On the whole, its suitable distribution exhibited a continuous pattern. However, the highly suitable area displayed a fragmented distribution in certain parts of the Zhejiang, Anhui, and Hunan provinces. The total suitable area amounted to 23.58 × 10⁴ km2, which is 60.63% larger than the current suitable area. The highly suitable area occupied 11.42 × 10⁴ km2, with a sharp increase of 117.52% relative to the current (Table 4).
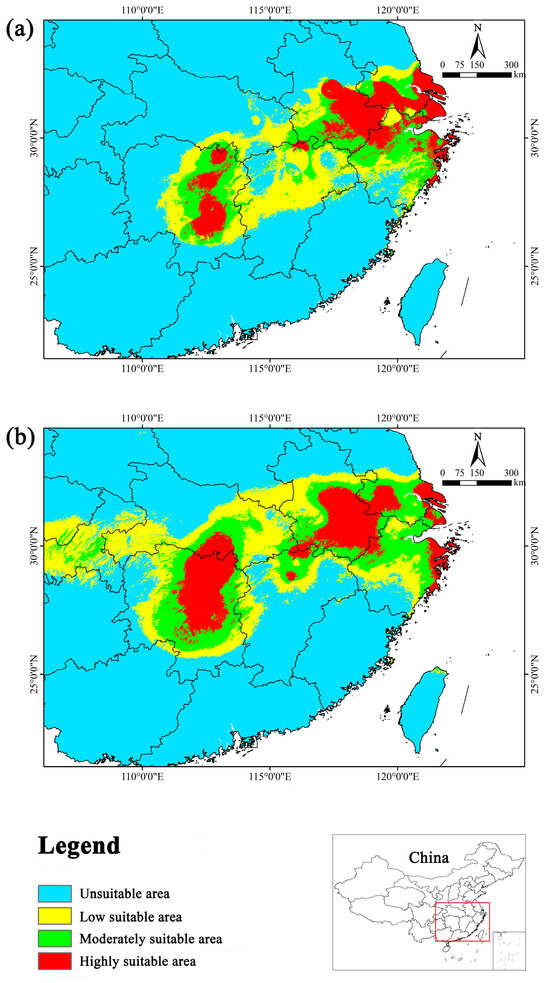
Figure 5.
Potential suitable distribution of Y. zenii in two past periods in China. (a) Last interglacial (LIG); (b) Middle Holocene (MH).
In the Middle Holocene, suitable habitats were mainly distributed in southern Anhui, southern Jiangsu, northern Jiangxi, eastern Hubei, central and eastern Hunan, the coastal areas of Zhejiang, the junction of the Zhejiang and Anhui provinces, the junction of the Hunan and Hubei provinces, and the junction of the three provinces Jiangxi, Hubei, and Anhui (Figure 5). Compared with the last interglacial period, the suitable distribution in the Middle Holocene exhibited a more continuous pattern with less fragmentation. The total suitable area amounted to 35.68 × 10⁴ km2, showing an increase of 143.05% compared to the present. Moreover, the highly suitable area was 14.73 × 10⁴ km2, with a dramatic increase of 180.57% compared to the current (Table 4).
In brief, from the last interglacial period to the Middle Holocene and subsequently to the present, the suitable area for Y. zenii initially increased and then decreased. The same goes for its highly suitable area. The suitable area decreased significantly in the current period compared to the two past periods. Furthermore, the current habitat has become increasingly fragmented due to climate change.
3.5. Potential Suitable Distribution in the Future
The suitable area distribution was primarily predicted to be concentrated in southern Jiangsu, southern Anhui, northern Zhejiang, eastern Hunan, central Hubei, and northern Jiangxi in the future, which largely aligns with the current suitable distribution. However, the suitable area is expected to be reduced in these provinces to varying degrees. In addition, we noticed that the highly suitable area is expected to expand in the coastal area of Zhejiang Province under three scenarios, namely 2050s RCP 4.5, 2050s RCP 8.5, and 2070s RCP 8.5 (Figure 6).
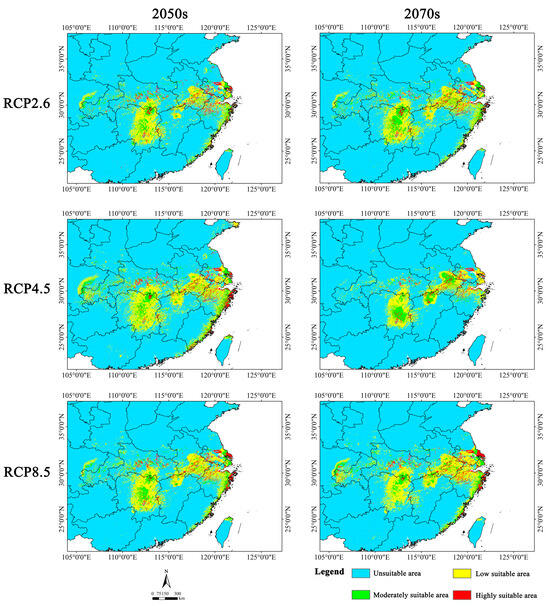
Figure 6.
Potential suitable distribution of Y. zenii in China under different future climatic scenarios (RCP 2.6, RCP 4.5, and RCP 8.5) in the 2050s and 2070s.
Under various emission scenarios, the average suitable area was predicted to amount to 11.71 × 10⁴ km2, indicating a decrease of 20.26% compared with the current suitable area. Among the six future scenarios, the suitable area is expected to be reduced the least in the 2050s RCP 4.5 scenario, with a decline of only 2.04% relative to the current suitable area. Conversely, the suitable area is expected to undergo the largest loss in the 2070s RCP 4.5 scenario, decreasing by nearly 40% in comparison with the current situation. Furthermore, the highly suitable area is predicted to decrease to varying degrees. The mean highly suitable area under the six future scenarios is expected to amount to 3.88 × 10⁴ km2, which is 26.07% lower compared with current conditions. This reduction is predicted to be lowest (10.67%) in the 2050s RCP 4.5 scenario, while it is expected to be highest (47.81%) in the 2070s RCP 4.5 scenario (Table 4).
In terms of the future periods, there is expected to be a lesser reduction in the suitable area in the 2050s (16.83%) than in the 2070s (23.68%) (Table 4). Additionally, the expected rate of decline in the suitable area differed under the various emission scenarios in the same period. In the 2050s, the suitable area was predicted to exhibit the smallest decrease under RCP 4.5, whereas the largest predicted decrease was observed under RCP 2.6. In the 2070s, the suitable area is expected to decrease the least under RCP 8.5 and the most under RCP 4.5. This indicates that the suitable area of Y. zenii was predicted to decrease under all six future scenarios (Table 4).
Overall, the suitable habitats for Y. zenii are expected to exhibit a decreasing trend in the future (2050s and 2070s), with severe habitat fragmentation.
3.6. Centroid Migration under Different Scenarios
The current centroid coordinates of Y. zenii (31.177° N, 111.656° E) are situated in Yuan’an County, Yichang City, Hubei Province. From the last interglacial period (30.041° N, 115.156° E) to the Middle Holocene (31.567° N, 111.271° E) and then to the current, the centroid migrated northwestward by 407.69 km at first and subsequently southeastward by 56.64 km. Under RCP 2.6, the centroid was predicted to migrate southeastward with a distance of 85.62 km in the 2050s (30.845° N, 112.467° E), while it is expected to shift 142.53 km to the southeast in the 2070s (30.592° N, 112.986° E). Under RCP 4.5, it is expected to migrate 51.97 km southeastward in the 2050s (30.900° N, 112.096° E) and 132.31 km to the southeast in the 2070s (31.001° N, 113.031° E). Under RCP 8.5, the centroid was predicted to move northeastward by a distance of 29.65 km in the 2050s (31.417° N, 111.792° E) and 57.51 km in the 2070s (31.303° N, 112.243° E).
Collectively, the centroid has exhibited a sinuous migratory pattern, initially shifting northwestward from the last interglacial period to the Middle Holocene and subsequently southeastward towards the present. From the present to the future, the migration direction prediction did not show a consistent trend. Specifically, the centroid was predicted to shift southeastward under RCP 2.6 and RCP 4.5, whereas it was predicted to migrate northeastward under RCP 8.5 (Figure 7).
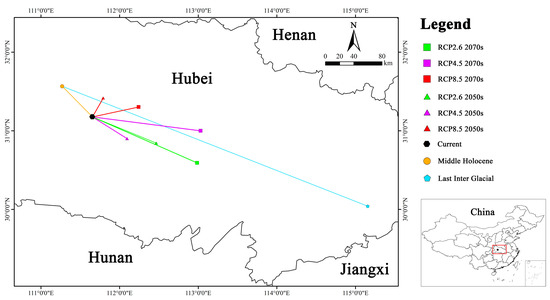
Figure 7.
Centroid migration routes of Y. zenii under different climate scenarios.
4. Discussion
4.1. Model Evaluation
Ten models from the Biomod2 package were employed to preliminarily simulate the potential geographical distribution of endangered Y. zenii in China. Only the MaxEnt model had an AUC > 0.9 and, simultaneously, a TSS > 0.8 (Table 2), exhibiting superior performance. Therefore, MaxEnt was selected for final modeling.
Then, we removed the collinearity of the 38 environmental factors and optimized the model parameters (i.e., FC and RM) to ensure that the MaxEnt model had high accuracy and reliability (Table 1). The results showed that the mean values of both the AUC and TSS were all greater than 0.9 under the nine climate scenarios (Table 3), indicating that the MaxEnt performed well. In addition, each of them had a very low standard deviation.
Moreover, the forecasted current distribution is in line with the known occurrence records of Y. zenii. Therefore, we used the optimized MaxEnt to predict the potential areas under past, current, and future climate scenarios, respectively.
4.2. Key Environmental Factors
Bio2, Bio3, and Bio15 were the main environmental factors in the two paleoclimatic periods. During the last interglacial period, the contribution rates of the three factors were 25.2%, 27.1%, and 43.1%, respectively. In the Middle Holocene, their contribution rates were 32.1%, 19.4%, and 39.9%, respectively. Under the current climate conditions, the main environmental factors were Bio2, Bio15, and elevation, with contribution rates of 32.9%, 21.1%, and 14.8%, respectively (Table 1). This indicates that among the three types of environmental factors (climate, terrain, and soil), climate may play a more significant role in limiting Y. zenii’s distribution. Furthermore, Bio2 and Bio15 were identified as the key factors during the past and current periods. Shi et al. (2021) simulated the future suitable distribution of Magnolia wufengensis using three types of environmental factors and concluded that climate was the main influencing factor [56], which is consistent with our results.
At present, the key environmental factors restricting the distribution of Y. zenii include Bio2, Bio15, and elevation. When the mean diurnal range (Bio2) is 4.87–9.06 °C, the precipitation seasonality of variation coefficient (Bio15) varies between 20 and 64, and the altitude ranges from 0 to 500 m, which is beneficial to the survival of this species (Figure 3).
In general, the diurnal temperature range is largest at low latitudes (average 12 °C), followed by middle latitudes (7–9 °C), and smallest at high latitudes (3–4 °C) [57]. At present, the distribution area of Y. zenii is concentrated in the three provinces of Jiangsu, Jiangxi, and Hunan (Figure 2). Its geographical range is between 24°29′ N and 35°08′ N, which is within a middle latitude region. Therefore, the mean diurnal range herein corresponds to the suitable range for this species. As shown in Figure 3b, with the increase in the variation coefficient of precipitation seasonality (Bio15), the existence probability of Y. zenii showed an obvious decline. Y. zenii is vulnerable to Bio15, and therefore it grows well in areas with little variation in the coefficient of precipitation seasonality. As far as altitude is concerned, Y. zenii is largely distributed at low altitudes. An example is its wild population from Mt. Baohua, Jurong City, Jiangsu Province, in which it mainly occurs in hilly areas with an altitude of 220 m [17]. Another example is its wild population from Ruichang City, Jiangxi Province, with an elevation of about 400 m. The third example is from Mt. Shending in Miluo City, Hunan Province, where its wild individuals have been recorded in recent years. And this tree only reaches up to 464.3 m of elevation in distribution. Therefore, the altitude of Y. zenii populations from known sites is consistent with our predicted elevation range (0–500 m) (Figure 3c). This species is mainly found in low mountain forests in subtropical China [17,24], which may make it susceptible to human activities.
Therefore, we have identified the key environmental factors affecting the distribution of Y. zenii for the first time and further determined their corresponding optimal ranges. Namely, this tree species is suitable to grow in low-altitude areas with small variations in the mean diurnal range and precipitation seasonality.
4.3. Current Suitable Area of Y. zenii
The MaxEnt model predicted, for the first time, that the current suitable area of Y. zenii is 14.68 × 10⁴ km2 (Table 4), only accounting for 1.53% of China’s total territory. These suitable areas are mainly distributed in southern Jiangsu, southern Anhui, northern Zhejiang, eastern Hunan, central Hubei, and northern Jiangxi (Figure 4). At present, it is generally recognized that this species only occurs on Mt. Baohua in Jurong City, Jiangsu Province [26,58]. This indicates that the actual distribution of Y. zenii is larger than known in China.
For one thing, there are many similarities among closely related species from Yulania in terms of ecological and morphological characteristics [59]. This makes it challenging to distinguish Y. zenii from other similar species in the field because this tree usually has short florescence in subtropical forests with a high canopy density [18]. Furthermore, such a species often has small populations restricted to segregated habitats within mountainous regions due to human interference. Another thing is that this species has bright red seeds with arils at maturity, which can attract frugivorous birds to disperse its seeds [21]. This may efficiently expand its range.
4.4. Suitable Area Change in the Past and Future
Y. zenii had 23.58 × 10⁴ km2 of suitable area in the last interglacial period, and this extended to 35.68 × 10⁴ km2 in the Middle Holocene. Compared to the current period, its suitable area in these two historical periods was 60.63% and 143.05% larger, respectively (Table 4). Hence, its suitable area in the past was significantly larger than that of the current. During the last interglacial period, the climate was warm and arid with low precipitation [60]. This may constrain the growth of this species. The Middle Holocene was the last great warm period, and its climate was warm and humid, with high levels of precipitation [61]. During this period, it may have been more conducive for Y. zenii to grow and reproduce; thus, its suitable area was significantly greater.
On the contrary, Y. zenii was predicted to have 11.71 × 10⁴ km2 of the mean suitable area in the six future climate scenarios (2050s and 2070s), 20.26% lower on average compared to the current distribution (Table 4). The predicted average suitable area was 12.21 × 10⁴ km2 for the 2050s, while it was 11.20 × 10⁴ km2 for the 2070s. Therefore, Y. zenii will undergo a significant decline in terms of suitable area in future scenarios. In the coming future, global temperatures are expected to constantly rise, coupled with frequent extreme weather events and intensive human activities [62]. Therefore, the suitable distribution of Y. zenii is expected to continue shrinking.
By and large, the centroid of Y. zenii will migrate to the southeast under future climate scenarios (Figure 7), which is consistent with the whole expected migrating direction of Allium mongolicum in China in the future [63]. This may be attributed to the tree trait that Y. zenii prefers to grow in a warm and humid habitat [20].
Overall, Y. zenii’s suitable area has been shrinking from the past to the present, and this will continue into the future. Our results are in line with those of other endangered tree species, such as Pseudotaxus chienii [64], Semiliquidambar cathayensis [65], and Lonicera oblata [66]. Based on our MaxEnt modeling, the whole population of Y. zenii was relatively widely distributed in the past (Figure 5), then it has dramatically contracted recently (Figure 4), and it will further become more fragmented in the future (Figure 6). Therefore, we believe that climate change has had a negative effect on Y. zenii regarding its distribution, especially in terms of suitable area and habitat integrity.
4.5. Conservation Implications for Y. zenii
Currently, most studies have long held the belief that Y. zenii only occurs on Mt. Baohua, Jiangsu Province, eastern China [23,24,26]. However, our findings demonstrate that its current potential suitable area is much larger than the known range. More recently, this species has been found to be present in the northern part of Mt. Luoxiao, which is located in Yueyang, Hunan Province, central China [27]. Therefore, we propose to carry out a comprehensive survey on its wild populations in central and eastern China, particularly in southern Anhui, central Hubei, eastern Hunan, southern Jiangsu, northern Jiangxi, and northern Zhejiang. Furthermore, it has been reported that Y. zenii has higher genetic diversity at the species level, which is detected by inter-simple sequence repeat (ISSR) markers, than other endangered tree species with limited geographical distribution [19]. However, the ISSR analysis sampled just one population from Mt. Baohua, and accordingly, such a practice of sampling seems unlikely to reflect the actual situation of this species. Hence, given its wide distribution range across various provinces in China, it is necessary to conduct extensive sampling to reveal its genetic diversity and structure in the coming future.
In addition, due to its high ornamental value, Y. zenii has been introduced into some botanical gardens, such as the Nanjing Botanical Garden Memorial Sun Yat-Sen, South China Botanical Garden, Kunming Botanical Garden, Wuhan Botanical Garden, and Lushan Botanical Garden in China [67] and the Arnold Arboretum in the USA [68]. Based on introduction and cultivation observations, it is noted that this tree grows poorly in the south subtropical region of China, while it grows well in the middle subtropical region [67]. More importantly, almost all cultivated plants of Y. zenii come from Mt. Baohua, eastern China [67]. Therefore, it is highly recommended that other provinces besides Jiangsu (i.e., Mt. Baohua) be considered for future introduction and cultivation in provenance.
Secondly, we found that climate change has a negative impact on the distribution of Y. zenii. As early as 2012, it was regarded as one of the most-at-risk 120 species in China, which were described as Plant Species with Extremely Small Populations (PSESP) [69]. In 2023, it was listed on the updated national PSESP checklist with 100 species [21]. Although its potential distribution is larger than known, our modeling results indicate that its main distribution areas are separated from each other in different provinces of China (Figure 4). To make things worse, its suitable habitat may become more fragmented under future climate scenarios. Therefore, climate change should be taken into account to expand its population size when making conservation plans for Y. zenii in the future.
We also found that the key environmental factors affecting its distribution are Bio2, Bio15, and elevation. According to the modeling results, for Y. zenii, its suitable area may be low-altitude regions with a small mean diurnal range and little variation in seasonal precipitation. For Y. zenii, its adult trees usually blossom in early spring and have short florescence, lasting, at most, 15 d. Soon afterwards, some carpels may be abortive during embryonic development, resulting in distorted aggregate follicles (Figure 1c). This is probably because its fruit setting rate is vulnerable to precipitation. The fruit setting rate is low when the climate is dry; in contrast, it is high when precipitation is abundant [20]. Therefore, the leading climate factors predicted by MaxEnt (e.g., Bio2, Bio15) are in agreement with the fact that this species is mainly distributed in the warm and humid subtropical mountains in China. Accordingly, this provides valuable information on reasonable management and planting practices for Y. zenii, particularly in terms of climate.
There are 25 species of Yulania in the Magnoliaceae family worldwide, which occur in temperate and subtropical Asia as well as North America [70]. There are 18 species of Yulania in China, which exist in the Yangtze River basin and its southern regions [70]. Among them, nine species are currently under threat in light of the IUCN Red List Category and Criteria. Specifically, Y. zenii and Yulania sinostellata are classified as critically endangered (CR). Yulania dawsoniana, Yulania pilocarpa, and Yulania viridula are classified as endangered (EN). Yulania amoena, Yulania liliiflora, Yulania sargentiana, and Yulania campbellii are classified as vulnerable (VU) [14]. Except for Yulania campbellii, the other eight Yulanias are all endemic to China. In this study, we selected Y. zenii as a representative species. Our findings indicate that climate change may have had an adverse effect on its habitats’ suitability in the past, as well as, in the present and future. Our MaxEnt modeling, for the first time, reveals the response of Y. zenii to climate change during different periods. Therefore, this study can provide a reference for other endangered Yulania species in China under the conditions of climate change.
5. Conclusions
In this study, we first applied Biomod2 for preliminary modeling and chose MaxEnt for formal modeling. We used its distribution data and three types of environmental variables (climate, terrain, and soil) to project the potential distribution of the endangered Y. zenii in China. Our results showed that the main environmental factors affecting its distribution were Bio2 (mean diurnal range), Bio15 (precipitation seasonality of variation coefficient), and elevation, and that climatic factors may play a vital role in limiting its geographical distribution. For the first time, we determined its current suitable area, which is 14.68 × 10⁴ km2, accounting for only 1.53% of China’s total territory. This distribution area is larger than currently documented and is mainly distributed in eastern and central China. During two historical periods (the last interglacial period and the Middle Holocene), Y. zenii had a much larger area than at present. Under future scenarios, its suitable area will averagely decrease by 20.26%. Our findings confirm that from the past to the present to the future, climate change has had and will have a negative influence on this species, especially in terms of suitable area and habitat integrity. Our study is conducive to the conservation, management, introduction, and cultivation of Y. zenii, and can also provide valuable information for other endangered Yulania species in China. In addition, only natural factors were considered in our modeling, and other factors such as human disturbance and land use change should be taken into account in the future.
Supplementary Materials
The following supporting information can be downloaded at https://www.mdpi.com/1999-4907/15/5/883/s1: Table S1: Latitude and Longitude Coordinates of 12 Occurrence Records of the Endangered Yulania zenii in China.
Author Contributions
H.W.: data curation, formal analysis, and writing—original draft; F.Z.: investigation, data curation; G.Z.: investigation, conceiving the study, and leading the writing. All authors have read and agreed to the published version of the manuscript.
Funding
This research was funded by the investigation and assessment of key protected wild plants in Jiangsu Province (No. 2023053SMnull0162).
Data Availability Statement
The data presented in this study are available on request from the corresponding author.
Acknowledgments
We thank G. Yan, H. W. Cai, Y. R. Zhou, X. Lu, and T. Liu for their valuable advice on an earlier draft of the manuscript.
Conflicts of Interest
The authors declare no conflicts of interest.
Correction Statement
This article has been republished with a minor correction to resolve spelling and grammatical errors. This change does not affect the scientific content of the article.
References
- Dyderski, M.K.; Pawlik, Ł. Spatial distribution of tree species in mountain national parks depends on geomorphology and climate. For. Ecol. Manag. 2020, 474, 118366. [Google Scholar] [CrossRef]
- Veloz, S.D.; Williams, J.W.; Blois, J.L.; He, F.; Otto-Bliesner, B.; Liu, Z.Y. No-analog climates and shifting realized niches during the late quaternary: Implications for 21st-century predictions by species distribution models. Glob. Chang. Biol. 2012, 18, 1698–1713. [Google Scholar] [CrossRef]
- Turney, C.S.M.; Jones, R.T. Does the Agulhas current amplify global temperatures during Super-Interglacials? J. Quat. Sci. 2010, 25, 839–843. [Google Scholar] [CrossRef]
- Shi, Y.F.; Kong, Z.Z.; Wang, S.M.; Tang, L.Y.; Wang, F.B.; Yao, T.D.; Zhao, X.T.; Zhang, P.Y.; Shi, S.H. Mid-Holocene climates and environments in China. Glob. Planet. Chang. 1993, 7, 219–233. [Google Scholar]
- Feng, L.; Sun, J.J.; El-Kassaby, Y.A.; Yang, X.Y.; Tian, X.N.; Wang, T.L. Predicting potential habitat of a plant species with small populations under climate change: Ostrya rehderiana. Forests 2022, 13, 129. [Google Scholar] [CrossRef]
- Kikstra, J.S.; Nicholls, Z.R.J.; Smith, C.J.; Lewis, J.; Lamboll, R.D.; Byers, E.; Sandstad, M.; Meinshausen, M.; Gidden, M.J.; Rogelj, J.; et al. The IPCC Sixth Assessment Report WGIII climate assessment of mitigation pathways: From emissions to global temperatures. Geosci. Model Dev. 2022, 15, 9075–9109. [Google Scholar] [CrossRef]
- Ren, Z.C.; Zagortchev, L.; Ma, J.X.; Yan, M.; Li, J.M. Predicting the potential distribution of the parasitic Cuscuta chinensis under global warming. BMC Ecol. 2020, 20, 28. [Google Scholar] [CrossRef] [PubMed]
- Qin, A.L.; Liu, B.; Guo, Q.S.; Bussmann, R.W.; Ma, F.Q.; Jian, Z.J.; Xu, G.X.; Pei, S.X. Maxent modeling for predicting impacts of climate change on the potential distribution of Thuja sutchuenensis Franch., an extremely endangered conifer from southwestern China. Glob. Ecol. Conserv. 2017, 10, 139–146. [Google Scholar] [CrossRef]
- Vincent, H.; Bornand, C.N.; Kempel, A.; Fischer, M. Rare species perform worse than widespread species under changed climate. Biol. Conserv. 2020, 246, 108586. [Google Scholar] [CrossRef]
- Zhao, R.N.; Chu, X.J.; He, Q.Q.; Tang, Y.; Song, M.; Zhu, Z.L. Modeling current and future potential geographical distribution of Carpinus tientaiensis, a critically endangered species from China. Forests 2020, 11, 774. [Google Scholar] [CrossRef]
- Yan, G.; Zhang, G.F. Predicting the potential distribution of endangered Parrotia subaequalis in China. Forests 2022, 13, 1595. [Google Scholar] [CrossRef]
- Nie, Z.L.; Wen, J.; Azuma, H.; Qiu, Y.L.; Sun, H.; Meng, Y.; Sun, W.B.; Zimmer, E.A. Phylogenetic and biogeographic complexity of Magnoliaceae in the Northern Hemisphere inferred from three nuclear data sets. Mol. Phylogenet. Evol. 2008, 48, 1027–1040. [Google Scholar] [CrossRef] [PubMed]
- Linsky, J.; Coffey, E.E.D.; Beech, E.; Rivers, M.; Cicuzza, D.; Oldfield, S.; Crowley, D. Assessing Magnoliaceae through time: Major global efforts to track extinction risk status and ex situ conservation. Plants People Planet 2023, 5, 496–501. [Google Scholar] [CrossRef]
- Qin, H.N. Seed Plants of China: Checklist, Uses and Conservation Status; Hebei Science and Technology Press: Shijiazhuang, China, 2020; ISBN 9787571706494. [Google Scholar]
- Cheng, W.C. Magnoliaceae, in vascular plants of Nanjing II, by C. P’ei. Contrib. Biol. Lab. Sci. Soc. China Bot. Ser. 1933, 8, 291–293. [Google Scholar]
- Jiang, G.M.; Sun, G.; Zhang, G.F.; Wang, J.W. Intra-and interspecific competition of endangered plant Magnolia zenii. Chin. J. Ecol. 2010, 29, 201–206. [Google Scholar]
- Wu, Z.Y.; Raven, P.H.; Hong, D.Y. Flora of China; Science Press: Beijing, China, 2008; Volume 7, ISBN 9781930723818. [Google Scholar]
- Chu, X.L. Conservation and related research progress of rare and endangered plant Yulania zenii. Bot. Res. 2021, 10, 331. [Google Scholar]
- Chen, Y.X.; Nan, C.H. ISSR Analysis on genetic diversity of endangered plant Magnolia zenii. J. Sichuan Agric. Univ. 2016, 34, 445–449. [Google Scholar]
- Wang, S. Study on the Reproductive Biology of the Critically Endangered Plant Magnolia Zenii ‘Cheng’; Nanjing Forestry University: Nanjing, China, 2020. [Google Scholar]
- Zhang, G.F.; Yi, X.G. Vegegraphy of Jiangsu; Fujian Science and Technology Publishing House: Fuzhou, China, 2023; ISBN 9787533571337. [Google Scholar]
- Hao, R.M.; Huang, Z.Y.; Liu, X.J.; Wang, Z.L.; Xu, H.Q.; Yao, Z.G. The natural distribution and characteristics of the rare and endangered plants in Jiangsu, China. Chin. Biodivers. 2000, 8, 153–162. [Google Scholar]
- Yin, H. Rare and Endangered Plants in China; China Forestry Publishing House: Beijing, China, 2013; ISBN 9787503870262. [Google Scholar]
- Liu, Q.X. Flora of Jiangsu; Jiangsu Phoenix Science and Technology Press: Nanjing, China, 2015; Volume 2, ISBN 9787553701073. [Google Scholar]
- Zhang, G.F.; Xiong, T.S.; Sun, T.; Li, K.D.; Shao, L.Y. Diversity, distribution, and conservation of rare and endangered plant species in Jiangsu Province. Biodivers. Sci. 2022, 30, 21335. [Google Scholar] [CrossRef]
- Jin, X.H.; Zhou, Z.H.; Yuan, L.C. National Key Protected Wild Plants of China; Hubei Science and Technology Press: Wuhan, China, 2023; ISBN 9787570625895. [Google Scholar]
- Peng, Y. A critically endangered species of Yulania zenii was discovered in Hunan Province for the first time. For. Ecol. 2022, 4, 48. [Google Scholar]
- Yackulic, C.B.; Chandler, R.; Zipkin, E.F.; Royle, J.A.; Nichols, J.D.; Campbell Grant, E.H.; Veran, S. Presence-only modelling using MAXENT: When can we trust the inferences? Methods Ecol. Evol. 2013, 4, 236–243. [Google Scholar] [CrossRef]
- Evans, T.G.; Diamond, S.E.; Kelly, M.W. Mechanistic species distribution modelling as a link between physiology and conservation. Conserv. Physiol. 2015, 3, cov056. [Google Scholar] [CrossRef]
- Shabani, F.; Kumar, L.; Ahmadi, M. A comparison of absolute performance of different correlative and mechanistic species distribution models in an independent area. Ecol. Evol. 2016, 6, 5973–5986. [Google Scholar] [CrossRef] [PubMed]
- Sillero, N.; Arenas-Castro, S.; Enriquez-Urzelai, U.; Vale, C.G.; Sousa-Guedes, D.; Martínez-Freiría, F.; Real, R.; Barbosa, A.M. Want to model a species niche? A step-by-step guideline on correlative ecological niche modelling. Ecol. Model. 2021, 456, 109671. [Google Scholar] [CrossRef]
- Kong, W.Y.; Li, X.H.; Zou, H.F. Optimizing MaxEnt model in the prediction of species distribution. Chin. J. Appl. Ecol. 2019, 30, 2116–2128. [Google Scholar]
- Rathore, M.K.; Sharma, L.K. Efficacy of species distribution models (SDMs) for ecological realms to ascertain biological conservation and practices. Biodivers. Conserv. 2023, 32, 3053–3087. [Google Scholar] [CrossRef]
- Hills, R.; Bachman, S.; Forest, F.; Moat, J.; Wilkin, P. Incorporating evolutionary history into conservation assessments of a highly threatened group of species, South African Dioscorea (Dioscoreaceae). S. Afr. J. Bot. 2019, 123, 296–307. [Google Scholar] [CrossRef]
- Li, Y.C.; Li, M.Y.; Li, C.; Liu, Z.Z. Optimized maxent model predictions of climate change impacts on the suitable distribution of Cunninghamia lanceolata in China. Forests 2020, 11, 302. [Google Scholar] [CrossRef]
- Kiser, A.H.; Cummings, K.S.; Tiemann, J.S.; Smith, C.H.; Johnson, N.A.; Lopez, R.R.; Randklev, C.R. Using a multi-model ensemble approach to determine biodiversity hotspots with limited occurrence data in understudied areas: An example using freshwater mussels in Mexico. Ecol. Evol. 2022, 12, e8909. [Google Scholar] [CrossRef]
- Hao, T.X.; Elith, J.; Guillera-Arroita, G.; Lahoz-Monfort, J.J. A review of evidence about use and performance of species distribution modelling ensembles like BIOMOD. Divers. Distrib. 2019, 25, 839–852. [Google Scholar] [CrossRef]
- Li, R.Z.; Hu, X.J.; Li, Q.Z.; Liu, L.Y.; He, Y.R.; Chen, C.Y. Gap analysis of Firmiana danxiaensis, a rare tree species endemic to southern China. Ecol. Indic. 2024, 158, 111606. [Google Scholar] [CrossRef]
- Radosavljevic, A.; Anderson, R.P. Making better Maxent models of species distributions: Complexity, overfitting and evaluation. J. Biogeogr. 2014, 41, 629–643. [Google Scholar] [CrossRef]
- Brown, J.L.; Bennett, J.R.; French, C.M. SDMtoolbox 2.0: The next generation Python-based GIS toolkit for landscape genetic, biogeographic and species distribution model analyses. PeerJ 2017, 5, e4095. [Google Scholar] [CrossRef] [PubMed]
- Poirazidis, K.; Bontzorlos, V.; Xofis, P.; Zakkak, S.; Xirouchakis, S.; Grigoriadou, E.; Kechagioglou, S.; Gasteratos, I.; Alivizatos, H.; Panagiotopoulou, M. Bioclimatic and environmental suitability models for Capercaillie (Tetrao urogallus) conservation: Identification of optimal and marginal areas in Rodopi Mountain-Range National Park (Northern Greece). Glob. Ecol. Conserv. 2019, 17, e00526. [Google Scholar] [CrossRef]
- Zhou, Y.Z.; Lu, X.; Zhang, G.F. Potentially differential impacts on niche overlap between Chinese endangered Zelkova schneideriana and its associated tree species under climate change. Front. Ecol. Evol. 2023, 11, 1218149. [Google Scholar] [CrossRef]
- Chen, Q.H.; Yin, Y.J.; Zhao, R.; Yang, Y.; Teixeira da Silva, J.A.; Yu, X.N. Incorporating local adaptation into species distribution modeling of Paeonia mairei, an endemic plant to China. Front. Plant Sci. 2020, 10, 1717. [Google Scholar] [CrossRef]
- Zhang, J.H.; Li, K.J.; Liu, X.F.; Yang, L.; Shen, S.K. Interspecific variance of suitable habitat changes for four alpine Rhododendron species under climate change: Implications for their reintroductions. Forests 2021, 12, 1520. [Google Scholar] [CrossRef]
- Moss, R.H.; Edmonds, J.A.; Hibbard, K.A.; Manning, M.R.; Rose, S.K.; Van Vuuren, D.P.; Carter, T.R.; Seita, E.; Mikiko, K.; Kram, T.; et al. The next generation of scenarios for climate change research and assessment. Nature 2010, 463, 747–756. [Google Scholar] [CrossRef] [PubMed]
- Stanton, J.C.; Pearson, R.G.; Horning, N.; Ersts, P.; Reşit Akçakaya, H. Combining static and dynamic variables in species distribution models under climate change. Methods Ecol. Evol. 2012, 3, 349–357. [Google Scholar] [CrossRef]
- Yang, Y.; Wu, Y.X.; Chen, Q.H.; Liu, C.; Liu, G.L.; Cheng, S.P.; Wang, L.S. Potential spatiotemporal distribution changes and conservation recommendations of two connected endangered tree peony species (Paeonia decomposita & P. rotundiloba). Flora 2022, 294, 152131. [Google Scholar]
- Sillero, N.; Barbosa, A.M. Common mistakes in ecological niche models. Int. J. Geogr. Inf. Sci. 2021, 35, 213–226. [Google Scholar] [CrossRef]
- Zhao, G.H.; Cui, X.Y.; Sun, J.J.; Li, T.T.; Wang, Q.; Ye, X.Z.; Fan, B.G. Analysis of the distribution pattern of Chinese Ziziphus jujuba under climate change based on optimized biomod2 and MaxEnt models. Ecol. Indic. 2021, 132, 108256. [Google Scholar] [CrossRef]
- Allouche, O.; Tsoar, A.; Kadmon, R. Assessing the accuracy of species distribution models: Prevalence, kappa and the true skill statistic (TSS). J. Appl. Ecol. 2006, 43, 1223–1232. [Google Scholar] [CrossRef]
- Singh, M.; Arunachalam, R.; Kumar, L. Modeling potential hotspots of invasive Prosopis juliflora (Swartz) DC in India. Ecol. Inform. 2021, 64, 101386. [Google Scholar] [CrossRef]
- Wang, Z.W.; Yin, J.; Wang, X.; Chen, Y.; Mao, Z.K.; Lin, F.; Gong, Z.Q.; Wang, X.G. Habitat suitability evaluation of invasive plant species Datura stramonium in Liaoning Province: Based on Biomod2 combination model. Chin. J. Appl. Ecol. 2023, 34, 1272–1280. [Google Scholar]
- Liu, C.R.; White, M.; Newell, G. Selecting thresholds for the prediction of species occurrence with presence-only data. J. Biogeogr. 2013, 40, 778–789. [Google Scholar] [CrossRef]
- Xu, Y.D.; Huang, Y.; Zhao, H.R.; Yang, M.L.; Zhuang, Y.Q.; Ye, X.P. Modelling the effects of climate change on the distribution of endangered Cypripedium japonicum in China. Forests 2021, 12, 429. [Google Scholar] [CrossRef]
- Aguirre-Gutiérrez, J.; Carvalheiro, L.G.; Polce, C.; van Loon, E.E.; Raes, N.; Reemer, M.; Biesmeijer, J.C. Fit-for-purpose: Species distribution model performance depends on evaluation criteria-Dutch hoverflies as a case study. PloS ONE 2013, 8, e63708. [Google Scholar] [CrossRef] [PubMed]
- Shi, X.D.; Yin, Q.; Sang, Z.Y.; Zhu, Z.G.; Jia, Z.G.; Ma, L.Y. Prediction of potentially suitable areas for the introduction of Magnolia wufengensis under climate change. Ecol. Indic. 2021, 127, 107762. [Google Scholar] [CrossRef]
- Kong, F. Spatial and temporal variation characteristics and regional differences of days of diurnal temperature range in China from 1961 to 2018. J. Zhejiang Univ. (Sci. Ed.) 2020, 47, 422–434. [Google Scholar]
- Yu, S.X.; Wang, Z.H.; Peng, Y.D.; Zhao, H. Color Illustrations of Endangered and Protected Plants of China; China Customs Press: Beijing, China, 2023; ISBN 9787517507147. [Google Scholar]
- Wang, Y.M. A study on Subgenus Yulania; Northwest Sci-Tech University of Agriculture and Forestry: Yangling, China, 2003. [Google Scholar]
- Yan, H.; Ma, S.M.; Wei, B.; Zhang, H.X.; Zhang, D. Historical distribution patterns and environmental drivers of relict shrub Amygdalus pedunculata. Chin. J. Plant Ecol. 2022, 46, 766. [Google Scholar] [CrossRef]
- He, X.; Ma, W.X.; Zhao, T.T.; Ma, Q.H.; Liang, L.S.; Wang, G.X.; Yang, Z. Prediction of potential distribution of endangered species Corylus chinensis Franch in climate change context. For. Res. 2022, 35, 104–114. [Google Scholar]
- Wang, X.F.; Duan, Y.X.; Jin, L.L.; Wang, C.Y.; Peng, M.C.; Li, Y.; Wang, X.H.; Ma, Y.F. Prediction of historical, present and future distribution of Quercus sect. Heterobalanus based on the optimized MaxEnt model in China. Acta Ecol. Sin. 2023, 43, 6590–6604. [Google Scholar]
- Lang, X.P.; Fan, R.Y.; Li, Q.F. Analysis of potential suitable areas of Allium mongolicum in Northern China. Acta Agrestia Sin. 2023, 31, 3525–3534. [Google Scholar]
- Zhang, W.X.; Kou, Y.X.; Zhang, L.; Zeng, W.D.; Zhang, Z.Y. Suitable distribution of endangered species Pseudotaxus chienii (Taxaceae) in five periods using niche modeling. Chin. J. Ecol. 2020, 39, 600–613. [Google Scholar]
- Ye, X.Z.; Zhao, G.H.; Zhang, M.Z.; Cui, X.Y.; Fan, H.H.; Liu, B. Distribution pattern of endangered plant Semiliquidambar cathayensis (Hamamelidaceae) in response to climate change after the last interglacial period. Forests 2020, 11, 434. [Google Scholar] [CrossRef]
- Wu, Y.M.; Shen, X.L.; Tong, L.; Lei, F.W.; Mu, X.Y.; Zhang, Z.X. Impact of past and future climate change on the potential distribution of an endangered montane shrub Lonicera oblata and its conservation implications. Forests 2021, 12, 125. [Google Scholar] [CrossRef]
- Yang, K.M.; Chen, X.L.; Gong, X.; Wang, Y.L. Ex Situ Cultivated Flora of China (Magnoliaceae); Science Press: Beijing, China, 2016; ISBN 9787030429704. [Google Scholar]
- Dirr, M.A.; Adkins, J.A.; Olsen, R.T. Magnolia zenii Cheng. ‘Pink Parchment’. Hortic. Sci. 2002, 37, 709–710. [Google Scholar] [CrossRef]
- Yang, J.; Cai, L.; Liu, D.T.; Chen, G.; Gratzfeld, J.; Sun, W.B. China’s conservation program on plant species with extremely small populations (PSESP): Progress and perspectives. Biol. Conserv. 2020, 244, 108535. [Google Scholar] [CrossRef]
- Chen, Z.D.; Lu, A.M.; Liu, B.; Ye, J.F. Tree of Life for Chinese Vascular Plants; Science Press: Beijing, China, 2020; ISBN 9787030635600. [Google Scholar]
Disclaimer/Publisher’s Note: The statements, opinions and data contained in all publications are solely those of the individual author(s) and contributor(s) and not of MDPI and/or the editor(s). MDPI and/or the editor(s) disclaim responsibility for any injury to people or property resulting from any ideas, methods, instructions or products referred to in the content. |
© 2024 by the authors. Licensee MDPI, Basel, Switzerland. This article is an open access article distributed under the terms and conditions of the Creative Commons Attribution (CC BY) license (https://creativecommons.org/licenses/by/4.0/).