1. Introduction
The longleaf pine (
Pinus palustris P. Mill.) forest type was one of the most extensive in North America prior to the arrival of Europeans. It has been estimated that these ecosystems were dominant on nearly 37.2 million hectares [
1]. However, it is thought that they now occupy only about 1.3 million hectares [
1], but estimates vary to some extent (e.g.,
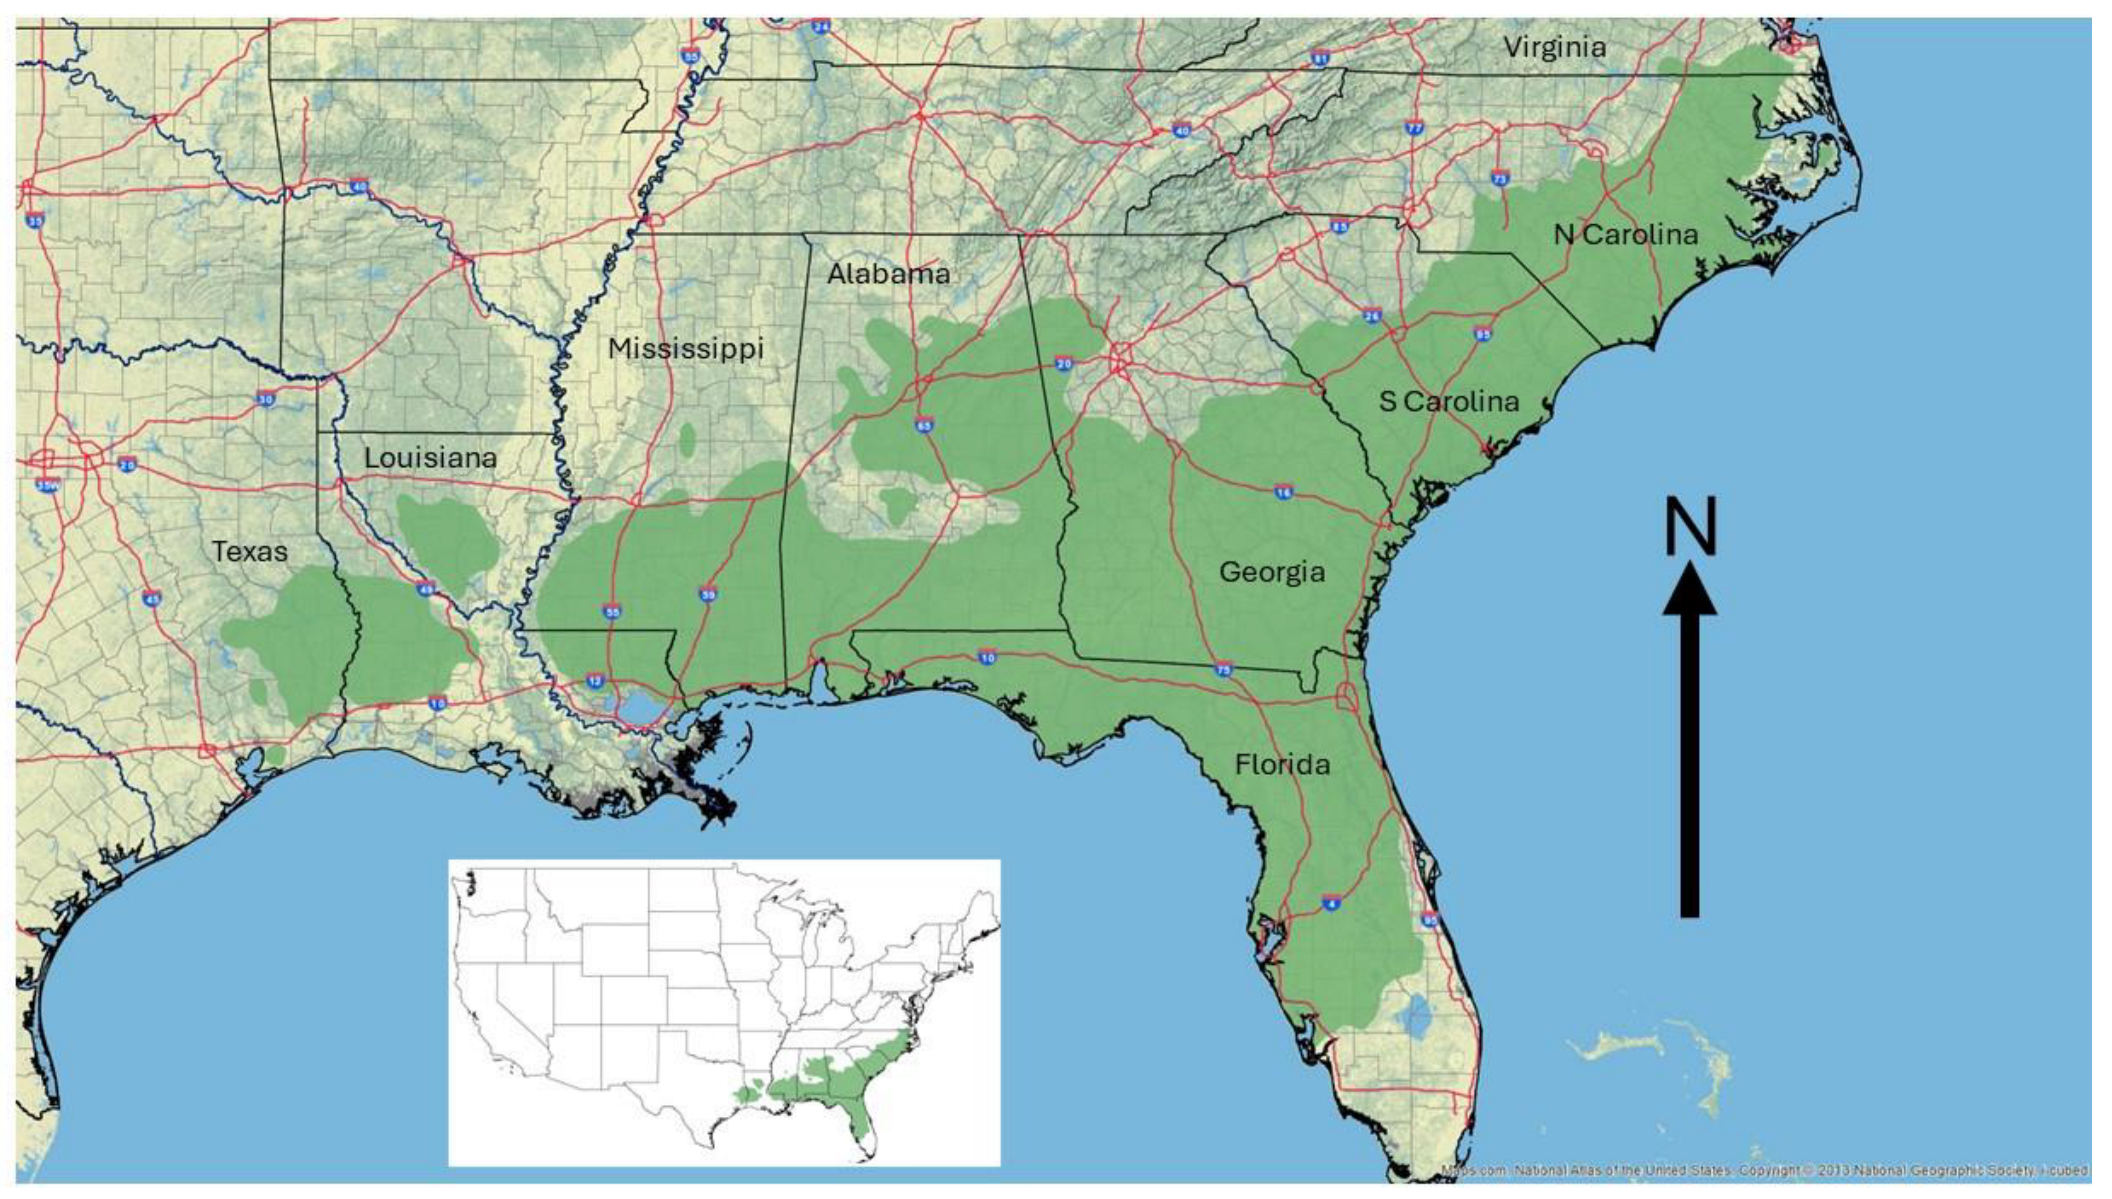
Table 1). The species was historically found in a range from southern Virginia to East Texas (
Figure 1) and occupied a significant amount of land in the southern half of the Gulf Coastal Plain [
2,
3]. Fire suppression and exclusion, replanting with faster-growing species such as loblolly pine (
Pinus taeda L.) and slash pine (
Pinus elliottii Engelm.) following the initial cutover of sites with westward expansion in the late 19th and early 20th centuries [
4] and continuing today, and denser stands to increase timber production have transformed the southeastern United States for centuries contributing to the substantial decrease in longleaf pine-dominated forests [
4,
5].
In its native area, longleaf pine can be a viable alternative to other southern yellow pines, such as loblolly pine and slash pine, because it is resistant to many pathogens and insects and has relatively low site requirements [
2]. With proper management, more valuable poles can be produced [
6,
7,
8]. Additionally, longleaf may incur less damage during hurricanes [
9,
10]. Concerns about the lost ecosystem services associated with a reduction in longleaf pine ecosystems [
4,
5] have prompted restoration efforts. Over the past 35 years or so, and continuing today, there has been a strong interest in restoring many longleaf pine ecosystems, including the use of natural regeneration approaches such as through shelterwood and seed tree operations. Thus, estimates of site quality and growth and yield are needed to help make optimal management decisions to meet landowner objectives [
6]. According to the USDA Forest Service Forest Inventory and Analysis (FIA) program [
11], there are around 893,000 naturally regenerated hectares in the southeastern United States (
Table 1).
Table 1.
Amount of USDA Forest Service Forest Inventory and Analysis (FIA) forestland estimated hectares by state in the southeastern United States of the longleaf pine forest type by stand origin [
11]. The amount of hectares established using seeding practices is not reported by the FIA program.
Table 1.
Amount of USDA Forest Service Forest Inventory and Analysis (FIA) forestland estimated hectares by state in the southeastern United States of the longleaf pine forest type by stand origin [
11]. The amount of hectares established using seeding practices is not reported by the FIA program.
| State | Natural | Planted | Total |
|---|
| Alabama | 148,034 | 157,861 | 305,895 |
| Florida | 289,130 | 115,188 | 404,318 |
| Georgia | 73,392 | 181,887 | 255,279 |
| Louisiana | 48,957 | 13,391 | 62,348 |
| Mississippi | 101,553 | 23,998 | 125,551 |
| North Carolina | 106,774 | 52,210 | 158,985 |
| South Carolina | 109,278 | 108,641 | 217,919 |
| Texas | 15,479 | 5476 | 20,955 |
| Virginia | 0 | 4174 | 4174 |
| Total | 892,598 | 662,826 | 1,555,424 |
The primary objective of this publication is to summarize the currently available site index and dominant height curves and equations for naturally regenerated longleaf pine stands that predict site index and/or dominant height as a direct function of on-site tree measurements. In addition, predictions from these equations are visually compared to see their behavior across a range of site conditions.
1.1. Site Quality Estimation
Often site quality estimates are used to directly identify the applicability of management actions and to determine the ability of a site to meet certain management objectives, and they are often included in growth and yield models for the prediction of future yields. A commonly used measure of site quality is site index (e.g., [
12]), or the height of some defined dominant portion of the stand at a standardized base or index age ([
13,
14] and [
15] (pp. 304–305)). Site index is used across the world [
16,
17,
18]. Conceptually, for a particular species, site index is a collective influence of soil factors and climatic conditions, and when excluding extremes, site index is thought to be independent of stand density ([
13,
14] and [
15] (p. 303)). Site index is both advantageous and non-advantageous because it is a function of the existing trees—thus, the existing genetics and management practices of the current rotation and previous rotations. However, it is often non-advantageous because it does not provide a direct explanation of site growing conditions. Although site index does not perfectly differentiate productive capabilities among sites ([
15] (pp. 311–312) and [
19,
20]), it is a simple-to-understand tool and it is widely accepted as a means of differentiating the ability of sites to produce a particular product class.
1.2. Site Index Construction and Configuration
Initially, site index curves were developed using interpolative graphical methods (e.g., [
21,
22]). Some measure of site trees, “dominant height,” was conducted across a range of sites, age was determined, and the paired height measurements were plotted over age. Site index curves were then visually interpolated. However, as statistics became more common and more sophisticated computing ability became available, empirically based site index curves were developed from some definition of height and age. For empirically based site index curves, there are two generally accepted forms, or types [
23]. The first is anamorphic curves and the second is polymorphic curves.
1.2.1. Anamorphic or Guide Curve
Anamorphic curves are often referred to as “guide curve” curves. This approach statistically fits a “guide curve” through the data (paired height–age observations) based on some model fitting criteria—often the minimization of squared deviations. A regionally, and silviculturally, applicable species base age is then selected and the “guide curve” site index is determined. Applicable site indexes are then graphically or mathematically obtained by relating the “guide curve” site index to desired site indexes. As noted by many, site index curves using this approach achieve different asymptotic (maximum) heights, but a constant proportional shape of curves is assumed regardless of site quality. This statement is somewhat confusing though. Often, the curves of different site qualities will not have the exact same shape through time visually or graphically. This is an important clarification, since a constant shape across time is often not observed graphically because the proportional rate among site indexes is constant across time, but the rate of change in height for the guide curve is not constant across time. As ([
21], p. 319) state in their work:
“To draw the curves in this manner is equivalent to an assumption that differences in site result in similar differences in the rate of height growth at all ages”.
Thus, the constant proportion of sites to the guide curve is multiplied by the rate of change in height, and therefore the shape is not always constant across time among all the site index classes. Thus, anamorphic curves can often have a polymorphic curve appearance, making it difficult sometimes to differentiate between anamorphic and polymorphic curves graphically.
When applying site index curves, it is important to take into account the range of ages used in construction. As noted by many studies, most likely the majority of the predicted dominant heights at older ages are biased low, or biased down (e.g., [
22,
24,
25,
26]). Stated differently, height is underpredicted. Due to the long-term nature of forestry, it could be stated with some degree of confidence that all site index equations have been developed from operational landbases, not experimentally designed research studies. Thus, often very few older stands exist on the landscape from which measurements can be made because the majority of the stands are harvested at younger ages. A confounding factor is that usually the older stands that do exist on the landscape are of poorer quality. This usually results from factors such as harvesting costs are not justified on lower-quality sites or silvicultural investment being made in other more inherently productive stands [
24,
26]. An example can be seen in Table 1 of the publication by [
27] where only two sites were used in the equation fitting of ages 71–90 years for the site indexes of 76–85 feet (23.2 m to 25.9 m, base age 50 years), and none were used for the site indexes of 86–95 feet (26.2 m to 29.0 m). There were a total of 38 observations for ages 71–90 years, and hence the “section” of curves for those ages are from lower-quality sites. Similar behavior can be seen in ([
28] (Table 96, p. 116)) and [
29]. Therefore, since the guide curve is fit through the middle of the data, and older ages are only represented by poorer sites, when site index is desired on better quality sites at older ages the estimated height–age patterns will likely be biased low.
1.2.2. Polymorphic
Polymorphic site index curve approaches were developed based on the findings that for most species the rate of height change through time is not constant across site qualities and that growth rates are not proportional among site qualities, and height curves for a species differ in shape depending upon the site [
22,
23]. Higher site qualities not only possess a greater height asymptote (maximum attainable height), but they approach and ultimately reach that asymptote faster, and hence sooner, at earlier ages. Lower site qualities have a lower height asymptote and most often a slower approach to that asymptote. Bull (1931, [
30]) is often credited as being the first to develop polymorphic site index equations regardless of species. Clutter et al. (1983, [
23]) define two types of polymorphic site index curves. The first being polymorphic-disjoint and the second being polymorphic-nondisjoint. For polymorphic-disjoint curves, unlike anamorphic curves, the constant proportional relationship among site qualities does not necessarily hold, but, similar to anamorphic curves, the curves still do not cross. However, not only does the constant proportionality not generally hold for polymorphic-nondisjoint curves, but the curves of site qualities may also actually cross one another at some point in time.
1.3. Base-Age Invariant
An issue with many initially developed polymorphic site index curves was that site index needed to be determined at a preselected base age [
31,
32]. This was problematic because often the predicted dominant height development would differ, for the same dataset, based on what base age was preselected [
31]. Hence, the polymorphic curves were specific to the preselected base age [
32]. Bailey and Clutter (1974, [
32]) were one of the first to introduce mathematical and statistical approaches to avoid having to use a preselected base age, rather the equation form would allow the user to select any desired base age. For southern yellow pine species, this has been extremely important since in many applications base ages have changed from 50 years to 25 years. Base-age invariant equations are advantageous because any base age can be selected. Because of the constant proportionality assumption, and the manner in which anamorphic curves are created, there are usually no issues associated with base-age invariance for anamorphic curves.
2. Available Site Index Equations for Naturally Regenerated Longleaf Pine Forests
Many site index and dominant height curves and equations requiring on-site tree measurements have been developed for naturally regenerated longleaf pine forests (
Table 2,
Table 3 and
Table 4). Kush et al. (2006, [
6]) provided a brief review of longleaf pine site index curves. The first site index curve is from [
28]. It is a series of graphical curves only, and no equation was provided, with site qualities ranging from 45 to 125 feet (13.7 m to 38.1 m) for a base age of 50 years. The curves were developed using data from across the southeastern US, and most likely entirely from naturally regenerated stands. The measurement plots were established in fully stocked stands, or in “normal” stands. Farrar (1973, [
33]) provided equations depicting the graphically only site index curves found in [
28]. Kush et al. (2006, [
6]) state that the conditioning of Farrar’s equation resulted in it failing to adequately represent the behavior of the [
28] curves for ages 15 years and younger. The equation found in [
33] was used as the site index equation in [
34], where [
34] defined site index to be dominants and co-dominants. Carmean et al. (1989, [
22]) took interpreted measurements from the site index curves found in [
28] and fit an equation capable of polymorphic behavior, base age 50 years. As stated in [
35], the USDA Forest Service Forest Vegetation Simulator (FVS) uses [
22]’s Equation (2), while the equation found in [
36], Equation (3), is used by the USDA Forest Service Forest Inventory and Analysis (FIA) program [
37].
The equations found in [
28,
36] were presented within overall growth and yield model systems. In some ways, it could be argued that [
40] presented site index curves for longleaf stands based on his two-point concept. Only the equations produced by [
22,
39] exhibit polymorphic behavior. All equations are base-age invariant, and although in many ways anamorphic curves do not adequately represent the biological height patterns of naturally regenerated longleaf stands, anamorphic curves have the advantage of being base-age invariant.
Equations (5)–(13) and (16) were developed using the same naturally regenerated dataset established in the states of Alabama, Florida, Georgia, and Mississippi [
27], commonly referred to as the Regional Longleaf Pine Growth Study (RLGS). Farrar (1981, [
27]) produced initial curves using this dataset with a 4th-degree polynomial equation form, fit using weighted least squares with the inverse of age
2 as the weight. It does not appear that serial correlation was accounted for. When using additional data beyond that used by [
27], Rayamajhi et al. (1999) [
29] updated his fourth-degree polynomial equation, and fit a second-degree polynomial equation and a Chapman–Richards equation. Ordinary least squares was used, and serial correlation was not accounted for. Rayamajhi et al. (1999, [
29]) ultimately suggested their 2nd-degree polynomial equation. Lauer and Kush (2010, [
39]) used the most recently updated dataset. Lauer and Kush (2010, [
39]), using additional data beyond that used by [
29], developed a dynamic site index equation, using as the base the Hossfeld model form, capable of producing polymorphic and even site-specific site index curves. Of all the equations discussed in this paper, only Equations (11) and (13) account for serial correlation when estimating parameters, and Equation (12) does not account for serial correlation. Lauer and Kush (2010, [
39]) recommended Equation (11), and it was subsequently used as the site index equation within an even-aged, naturally regenerated growth and yield model system presented in [
41]. For the RLGS dataset, different equations not only resulted from the updated datasets, but also the selection of different functional forms. Carmean et al. (1989, [
22]) took the equation from [
27] and produced a polymorphic site index equation of the Chapman–Richards form. A different weighting approach from [
27] was used by [
22] when estimating the parameters for the site index equation.
It should be noted that there is one potential equation for naturally regenerated stands not included in
Table 2,
Table 3 and
Table 4 which was presented by [
42]. The publication is hard to find, but predictions for a site index of 60 feet (18.3 m, base age 50 years) were presented by [
40]. Zeide (1999, [
40]) never commented on whether the data was obtained from naturally regenerated sites or plantations. Popham et al. (1979, [
43]) presented the equation form used by [
42] without the parameter estimates, but they also did not mention the data source.
All site index curves and equations referenced in
Table 2,
Table 3 and
Table 4 were developed using data obtained from even-aged, naturally regenerated stands. The RLGS (Equations (5)–(13) and (16)) measured longleaf pine trees in permanently established 0.1- and 0.2-acre plots (0.0405 hectares to 0.0809 hectares, [
27]), and plots were added as the study progressed [
38,
39]. Plots were mostly measured at 5-year intervals [
38,
39]. As previously mentioned, only the [
39] Equations (11) and (13) were developed taking into account serial correlation resulting from repeated measurements. Schumacher and Coile (1960, [
36]) measured trees in 0.2-acre (0.0809 hectares) temporary plots. Specific plot measurement approaches were never clearly specified in [
28], as noted also by [
22] since the number of dominant trees per plot was not provided. Only Equations (5)–(13) and (16) were fit using repeated measurement data which is considered superior to temporary plots when developing site index and dominant height equations [
23] (p. 46).
Due to issues with determining plot age in naturally regenerated even-aged longleaf pine stands, and also varying sample trees per plot, [
39] modeled individual trees rather than plot averages [
23] (pp. 39–40). They stated that the use of plot averaged age and height when using Equation (11) does not produce substantial errors, particularly for stands over 15 years of age, but technically individual tree height projections should be obtained first, and then these estimates should be averaged to obtain plot-level site index estimates. The users of Equations (11)–(13) should be aware of this issue when applying these equations.
3. Dominant Height Predictions
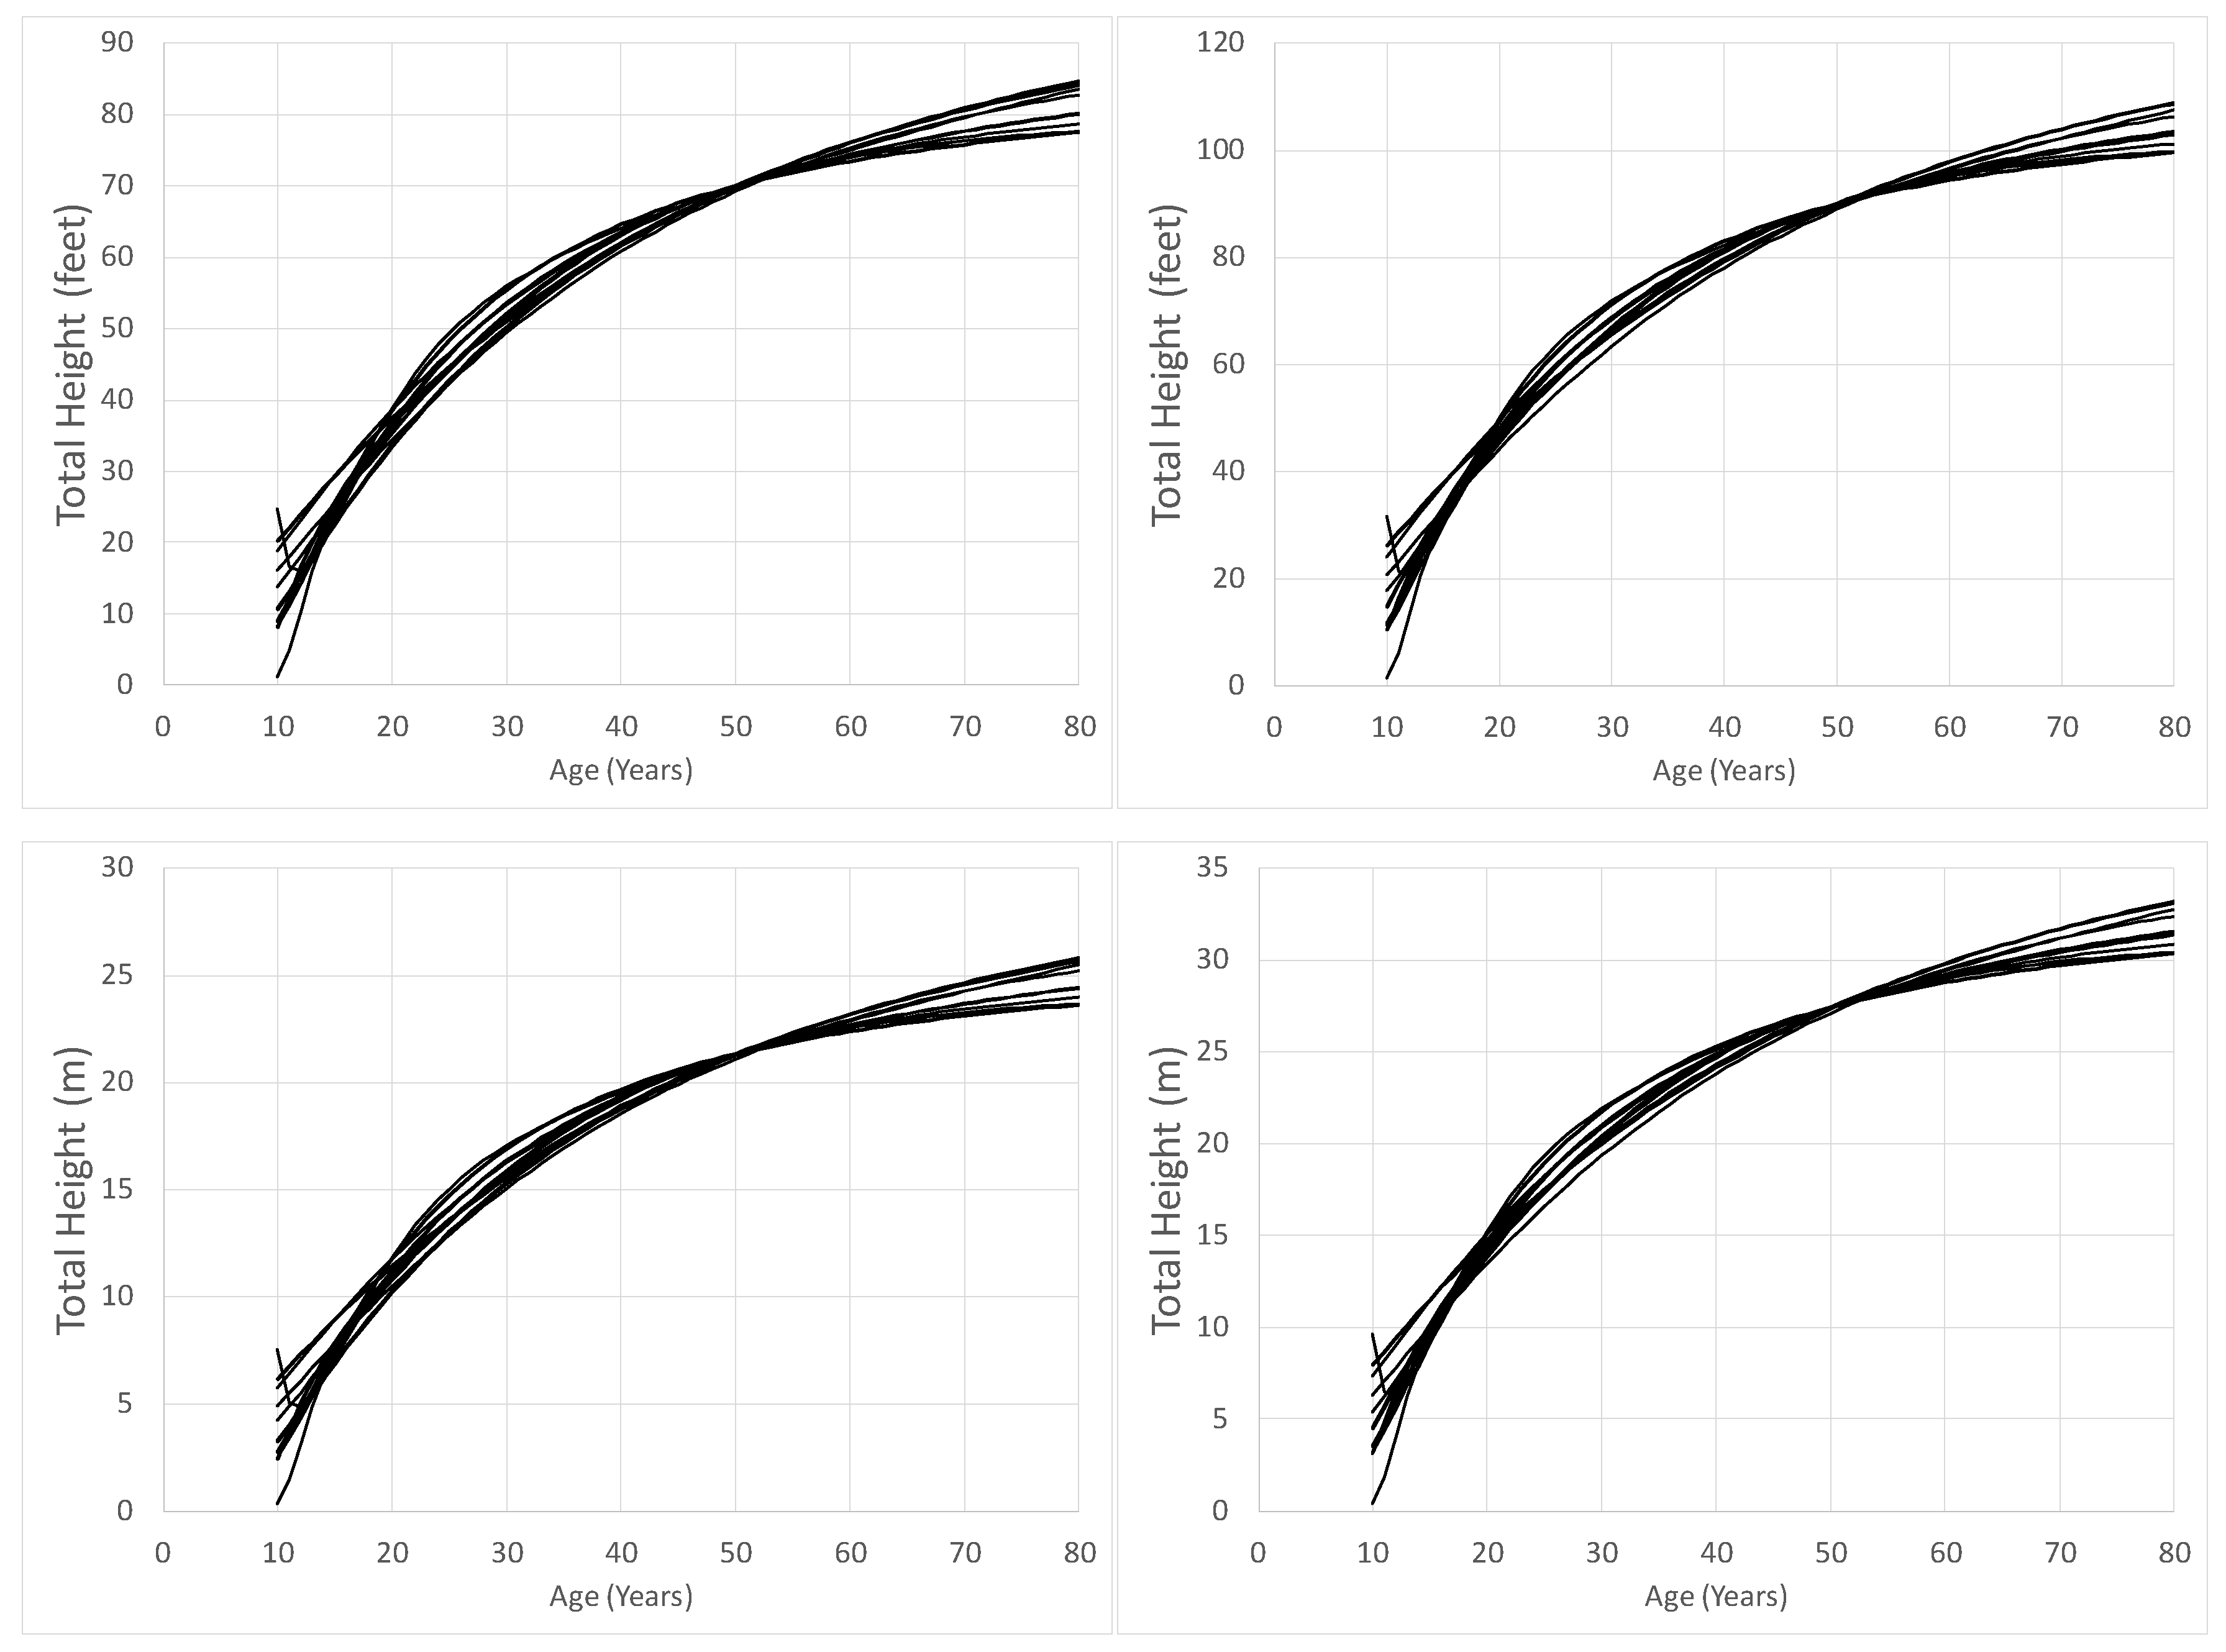
Figure 2 shows substantial differences in predicted “dominant” height by Equations (1), (3), (5), (7)–(16) across time for the stands with the site indices of 70 and 90 feet (21.3 m and 27.4 m, base age 50 years). The only polymorphic equations were produced by [
22] and [
39]. For both site indices 70 and 90 feet (21.3 m and 27.4 m, base age 50 years), at age 80 years, Equation (7) (found in [
38]) predicted the shortest heights at 77.6 feet and 99.7 feet (23.7 m and 30.4 m), while Equation (1) (found in [
33]) had the greatest heights of 84.8 feet and 109.0 feet (25.8 m and 33.2 m), respectively. Carmean et al. (1989, [
22]) presented two separate equations when estimating the curves of [
27,
28,
36], one to estimate dominant height from site index (used in
Figure 2 and presented in
Table 4) and one to estimate site index from dominant height (presented in
Table 3). For
Figure 2, since dominant height is being predicted, the parameter estimates from the dominant height equations were used (
Table 4).
The recommended equation by [
39], Equation (11), predicted the values of 84.4 feet and 103.4 feet (25.7 m and 31.5 m) for the site indexes of 70 feet and 90 feet (21.3 m and 27.4 m, base age 50 years) at age 80 years, respectively. Equation (11), found in [
39], was fit using an updated RLGS dataset (originally described by [
27]) relative to [
38], and they used different equation forms (
Table 3). For a site index of 70 feet (21.3 m, base age 50), at age 80 years, Equations (5), (12), (13), and (16) all predict similarly to Equation (11), but Equations (8)–(10) generally predict slightly shorter heights. Predictions for Equations (8), (9), and (10) were 80.3 feet (24.5 m), 77.7 feet (23.7 m), and 77.6 feet (23.7 m), respectively.
Similarly, for a site index of 90 feet (27.4 m, base age 50 years), Equations (9) and (10) predict shorter heights; the heights were 99.9 feet (30.4 m) and 99.8 feet (30.4 m), respectively. However, Equation (8) predicted height to be 103.2 feet (31.5 m) which is essentially the same as Equation (11), and height predictions from Equations (5) and (16), which were 107.6 feet (32.8 m) and 106.3 feet (32.4 m), respectively, exceeded that of Equation (11).
The differences in the estimates, and the relative behavior of the equations across site qualities, could be due to the anamorphic nature of the equations presented by [
27,
29,
38], different model forms, as well as the addition of older aged data in RLGS when equations were fit by [
39]. Although Equation (16), found in [
22], is polymorphic in nature, data were obtained from predictions using an anamorphic equation—Equation (5) from [
27].
Since Equation (14), which is presented by [
22] and based upon the published curves of [
28], is used by the FVS growth and yield model simulator for longleaf pine forests, and Equation (11) is recommended by [
39], and since Equation (3) as reported by [
36] is used by FIA,
Figure 3 presents predictions only from these equations. In addition to that, Equation (5) presented by [
27] was included since it is the original equation from the RLGS. Carmean et al. (1989, [
22]) presented two separate equations when estimating the curves of [
28], one to estimate dominant height from site index (used in
Figure 2 and
Figure 3 and presented in
Table 4) and one to estimate site index from dominant height (presented in
Table 3). For
Figure 3, since dominant height is being predicted, the parameter estimates from the dominant height equation were used.
For the lower site quality (site index 70 (21.3 m), base age 50 years), at age 80 years, predictions do not differ substantially among the four equations (
Figure 3). The equation by [
22] (Equation (14)) had the greatest predicted height of 84.6 feet (25.8 m) while the equation by [
36] (Equation (3)) had the shortest predicted height of 80.1 feet (24.4 m). Equation (5), as found in [
27], exhibits odd behavior for both site indexes for ages younger than 15 years (as noted by [
27]), and it is the curve that has the greatest predictions from ages 20 to 40. Most likely this erratic behavior is due to the use of a polynomial equation form (a 4th-degree polynomial). Often polynomial equations provide very good model fits of the data, but do not extrapolate well beyond the range of conditions used to fit the equation.
For the higher site quality (site index 90 (27.4 m), base age 50 years), at age 80 years, the dominant heights do not differ substantially (5.8 feet, 1.8 m). Similar to the lower quality site, the equation by [
22] had the greatest height (108.8 feet, 33.2 m), and the equation by [
36] (Equation (3)) had the shortest predicted height of 102.9 feet (31.4 m). Remember the equation from [
22] (Equation (14)) is a polymorphic equation developed based on anamorphic dominant height–age paired data from [
28]. This could lead to some inflexibility in the predictions across age, and perhaps result in greater predictions at older ages. Equations (5) and (11) were produced using the same source of data; however, the equation by [
39] (Equation (11)) was developed using a substantially updated dataset. For both site qualities, at younger ages, [
36] (Equation (3)) produces shorter trees relative to equations by [
22] (Equation (14)) and [
39] (Equation (11)). Schumacher and Coile (1960, [
36]) developed the equation using stands in the Atlantic Coastal Plain of the southeastern US while those produced by [
27] (Equation (5)) and [
39] (Equation (11)) are from the East Gulf Region. Schumacher and Coile (1960—Equation (3), [
36]) may differ in part from [
22] (Equation (14)) and [
39] (Equation (11)) because of its anamorphic nature.
It is hard to know specifically the ages used to produce Equation (3) [
36]. Although stands as young as 11 years of age were used by [
27], the dataset is dominated by stands 25 years of age and older.
4. Predictions of Site Index
Site index predictions (base age 50 years) for a 15-year-old stand with a dominant height of 35 feet (10.7 m, condition 1) differ substantially among equations while condition 2, a 35-year-old stand with a dominant height of 58 feet (17.7 m), has far less variability (
Table 5). For condition 1, the site index values average 96.6 feet (29.4 m) and range from 88.7 (27.0 m) to 105.8 feet (32.2 m), a 19.3% difference. The site indices have a standard deviation of 5.49 feet (1.7 m). For condition 2, the site index values average 69.8 feet (21.3 m) and range from 66.9 (20.4 m) to 71.7 feet (21.9 m), a 7.1% difference. The site indices have a standard deviation of 1.67 feet (0.5 m).
Condition 1 is on the fringe of the majority of modeling fitting data ages (
Table 2), while condition 2 is well within the range of the model fitting data ages, and thus this may explain in part why predictions for condition 2 have less variability among the equations. In relation to condition 1, it is known that site index estimates obtained when using younger data are often inconsistent and thus there are often significant errors.
Despite their site index curves, Equations (5)–(13), coming from nearly the same model fitting RLGS dataset, for condition 1, clearly model form resulted in different predictions. For the RLGS dataset, there was some variability among the anamorphic equations, but all anamorphic equations overpredicted site index compared to the polymorphic equations of both [
22,
39]. It could very well be that, when using younger data such as age 15 dominant heights, an anamorphic equation form is not flexible enough to account for reduced height growth near the ages of 50 years and beyond [
39].
Farrar (1981, [
27]) compared predictions from his equation (Equation (5)) with predictions from [
28] and [
36] (Equation (3)). He concluded for the RLGS dataset, based on his selected approach, that Equation (5) produced slightly better estimates of site index (base age 50 years). However, he only recommended his equation for the RLGS geographic region—the East Gulf. Rayamajhi et al. (1999, [
29]) concluded that their second-degree polynomial Equation (8) produced better estimates relative to the fourth-degree polynomial Equation (5) from [
27]. Beyond that, since Equation (8) is a second-degree polynomial equation it is more parsimonious, which is advantageous. When comparing the estimated site indexes (base age 50 years) of RLGS measurement plots, [
39] concluded that Equation (11) improved the estimation of site index in young stands relative to Equation (5) from [
27]. They noted that the site index estimates from Equation (11) when using younger data were still subject to error though, which is not surprising given it is well known that the use of young ages can produce large errors. For a 15-year-old stand with a dominant height of 35 feet (10.7 m, condition 1 in
Table 5), Equation (5) overpredicted by 12.9 feet (3.9 m) in site index (base age 50 years) relative to Equation (11). For other ages, as shown in
Figure 2 and
Figure 3 as well, [
39] found that both equations predict similarly, but that with age Equation (5) tends to overpredict relative to Equation (11).
No previous analysis has compared predictions from Equations (8)–(11). For conditions 1 and 2 in
Table 5, Equation (8) overpredicts site index (base age 50 years) relative to Equation (11) for the 15-year-old stand (condition 1) and underpredicts site index (base age 50 years) for the 35-year-old stand (condition 2). Although [
39] never compared the two equations, and the results in
Table 5 are not a validation analysis, since an updated dataset was used to produce Equation (11) and it is a dynamic equation capable of polymorphic behavior, while Equation (8) is a polynomial anamorphic equation, it is understood that Equation (11) is preferable to Equation (8) for applicable longleaf pine populations.
5. Factors Impacting Site Index and Dominant Height Predictions
Several factors can impact the behavior of dominant tree predictions, and hence greatly impact an estimate of site quality. These factors, then, should be considered when selecting what site index curve is to be used. One factor is the range of ages and likely even the stand densities of the stands used in model fitting. Yet another factor would certainly be whether anamorphic or polymorphic curves are used and yet another would be the functional form, or the mathematical equation itself being used to represent dominant height. For instance, whether a Schumacher model [
36], Chapman–Richards equation [
22], or Hossfeld [
39] model form is used. Yet another important consideration would be whether the equation form allows essentially site-specific predictions (dynamic) such as those of [
39]. Lauer and Kush (2010, [
39]) obtain site-specific, and hence polymorphic behavior, through the use of a dynamic site index equation approach (GADA—generalized algebraic difference approach). Beyond that, only Equations (5)–(13) and (16) (from the RLGS dataset) were fit using repeated measurement data which often better depicts the long-term trends in height growth than model-fitting data obtained from temporary plots [
23] (p. 46). All of the factors above can particularly impact predictions at the extremes of stand age, very young stands and older/mature stands. It should be noted that for the equations from [
39], the selection of the years to breast height age (G in
Table 3), can have a meaningful impact on dominant height and site index predictions. Beyond that, for [
22], the use of either the dominant height (
Table 4) or site index (
Table 3) parameter estimates can impact predictions.


