Article

Policies for Equity in Access to Urban Green Space: A Spatial Perspective of the Chinese National Forest City Policy

1
School of Art, Soochow University, Suzhou 215006, China
2
Faculty of Architecture and Urban Planning, University of Mons, Rue d’Havré 88, 7000 Mons, Belgium
*
Author to whom correspondence should be addressed.
Forests 2024, 15(4), 608; https://doi.org/10.3390/f15040608
Submission received: 2 March 2024 / Revised: 24 March 2024 / Accepted: 26 March 2024 / Published: 27 March 2024

Abstract

:
The development of China’s high-density urbanisation process has made people aware of the widespread injustice in urban green space (UGS) as a means to improving residents’ well-being. The Chinese National Forest City (NFCC) policy is one of China’s construction models that aims to develop urban greening and reduce the inequality of residents’ well-being. This study used a combination of qualitative research and index quantification to explore the relationship between the spatial distribution of NFCCs and the factors affecting inequality in green space allocation and their impacts. The results of the study show that changes in indicators in NFCC policy reflect the national government’s decision-making orientation towards achieving environmental equity, and that the main factors affecting the unequal spatial distribution of NFCCs are highly correlated with inequality in UGS resources. This study analysed the NFCC policy from a new perspective and provides useful information for the development of national forest policy in order to ensure sufficient green space in China and the elimination of environmental inequity.

1. Introduction

Rapid urbanisation has increased social inequality. Inequality refers to unequal access to green space or the protection from environmental hazards of groups at different socioeconomic levels or from different geographic areas, an important issue in the field of environmental justice [1,2,3]. Green spaces provide regulatory and cultural ecosystem services, purify the air, reduce traffic noise pollution, and increase carbon storage capacity [4]. However, because of these social, economic, and environmental benefits, society’s interaction with urban green spaces (UGSs) can be competitive, leading to environmental equity issues [5]. As high-density urbanisation is accelerating globally, particularly in Asia, high population density has severely strained the availability of both high-quality and high-density green space [6]. The COVID-19 epidemic’s recurrence and expansion forced people to consider the issue of health disparity brought on by the unequal use of space, causing them to turn to urban planning for new solutions [7,8]. In a sense, social issues are an opportunity for urban policymakers and residents to realise that the upgrading of urban human settlements should be paid attention to and be more considered, effectively promoting urban resilience and sustainable construction [9].
China, as one of the most rapidly urbanising countries, had its cities with populations of more than one million increase from 90 in 2000 to 161 in 2019 [10,11]. The Chinese government has begun to attach great importance to land greening and forest city construction in order to improve urban environmental quality and ecological resilience [12]. The national green space construction industry has gradually developed into a national development strategy through the establishment of a national forest city policy [13]. On this basis, the Chinese National Forest City (NFCC) policy was initiated in 2004 by the State Forestry Administration of China in order to alleviate urban environmental pollution [14]. The NFCC policy is now officially recognised as an urban construction mode where forest vegetation dominates the ecosystem and ecological construction is used to achieve the integration of urban and rural development [15]. This policy encourages local governments to actively include urban forest construction in urban planning and construction, thereby promoting urban ecological development at the government level. Implementing this policy is critical in developing the urban ecological green space system [16], greatly enhancing the overall environment, maintaining and protecting urban equity biodiversity, and promoting urban sustainability.
Currently, the mainstream research on the NFCC policy is focused on the literature. First, according to policies and regulations, construction scale, etc., the policy development process is divided into and elaborated upon in stages [17,18]. Second, it summarises problems in the policy implementation stage and suggests solutions [19]. Third, by combining the construction benefits of ecological, economic, and social scales, it analyses the public attitude, pressure, state, and response in order to explore the direction of its future advancement [20,21]. However, as a national urban development policy, modern information technologies, like remote sensing or geographic information systems, which play an important role in spatial research, should be applied. Most of the aforementioned studies focused on a single point of analysis on certain content, and they rarely combined time trajectories, development policies, social events, and spatial distribution. Regrettably, no research has been conducted with the aim of discovering the correlation that exists between the NFCC policy and the unequal distribution of green space, nor to analyse, from an environmental equity perspective, how the central government can link up with local governments to solve the problem of spatial inequality in terms of green spaces, along with how it can make use of China’s unique political system and existing resources or conditions in order to participate in the construction of urban complexes that meet the selection criteria of the NFCC policy so as to provide reference value for other urban areas [22].
This study utilized Geographic Information System (GIS) software (ArcGIS), web-mapping services (Google Earth), statistical software package (SPSS), and the factor detection model (Geo Detector) to study and explain the changes and implementation status of NFCC policy from the perspective of environmental equity. It also explores and explains the spatial heterogeneity of cities under the current NFCC policy and the driving factors of the spatial distribution. This is conducted to provide a scientific basis for the balanced development of NFCC policy. This study selected environmental equity as its research perspective and found that there was a correlation between NFCC green space and inequality, providing a new perspective for studying spatial green space strategies. This study also analysed how China currently achieves equality of UGS through NFCC policy to provide balanced ecological services for urban residents so as to meet future challenges. It is our hope that these results will provide policy governance experience and lessons for other high-density cities to better realise sustainable societies under the remit of environmental justice.
This article is structured as follows: First, Section 2 shows the analyses of the benefits of NFCC policy and explores its temporal evolution and conceptual shifts. Second, Section 3 introduces the data sources and methods of the research. Then, Section 4 and Section 5 provide the study’s main findings and the analysis and description of the results, respectively. Finally, Section 6 and Section 7 discuss and summarise the prospect of further research, respectively.

2. The thorough Examination of NFCC Policy

2.1. The Origin of NFCC Policy

The NFCC policy was developed based on the concept of the “urban forest”. In the U.S., the concept is generally understood to mean all trees within a city’s limits [23]. Some European countries define urban forests as larger forest areas within cities or peri-urban forests (Table 1) [24,25,26]. Differences in the conceptualisation of an urban forest reflect the functional scope and scale of urban forests in different countries [27]. Urban forests are recognised as an important resource that affect urban dwellers’ lives and improve the quality of the regional environment as well as the health and well-being of people in an equitable manner. As shown from the above definition, the concept of an urban forest has obvious urban cultural characteristics that reflect the cultural needs and value orientation of local urban citizens, and these furthermore have important significance in terms of the birth and development of NFCC policy.

2.2. Policy Evolution Process

The NFCC policy is a development model of an ecological city established by following the concept of the urban forest. The forest is introduced into and built within the city, reflecting the coordinated development of humans and the forest [28]. Currently, 219 NFCCs have been built across 26 provinces/regions. Combined with the policies and regulations published for the establishment of NFCCs, the variations in the quantity of NFCCs authorised over the years can be categorised into subsequent phases (Figure 1).
  • Initial (2004–2006)
This is the pilot exploration stage of an NFCC, starting in 2004, wherein the first batch was raised [29]. At this stage, the specific indicators of the policy were not yet improved, and the relevant concepts were still in discussion. Since the concept of a forest city originated in developed countries, this stage focused on adapting the concept to national political systems and development models. The central government also tried to encourage local governments to actively participate in NFCC choices in order to enhance the impact of the policy [30].
2.
Development (2007–2013)
The release of the preliminary “NFCC Evaluation Index” in 2007 marked the official entry into the stage of systematic standardisation. During this period, the government introduced a series of policies in order to better evaluate the degree of urban greening, meaning that the establishment of natural forests became a significant task for the State Forestry Administration, signifying the fundamental fulfilment of the policy [31].
3.
Maturation (2014-Present)
In 2014, the NFCC policy was officially approved as an internal approval project of the national government, meaning that the NFCC policy rose from the local municipal level to the national level as soon as the state government officially issued the NFCC Development Plan (2018–2025), with a target set of issuing 300 cases by 2025 [32]. Subsequently, the state government improved and supplemented the evaluation indicators (GBT37342-2019) [33]. The NFCC policy showed a planar distribution and even formed a local urban agglomeration distribution trend from the available information. At the same time, with the growth of China’s ecological civilisation construction and the development of the “beautiful China” initiative, the quality of NFCC construction became one of the most important indicators for the judgement of urban development [34].

2.3. Evolution of the Selection Criteria

2.3.1. NFCC Initial Selection Indicator

The NFCC policy aims to build a new urban living space that is green, fair, and sustainable. To adapt to China’s unique national conditions and cope with the ever-changing emergencies and international situations, the NFCC policy has improved itself alongside urbanisation, with continuous revision and adjustment [35]. Since their implementation in 2007, the evaluation indicators have been divided into four aspects, namely, local government leadership, management system, construction, and assessment [36]. Urban infrastructure and ecosystem construction are among the most important factors of this index. At this stage, the government proposed clear quantitative targets for overall forest coverage, for instance, requiring that the forest coverage rate of southern cities should be more than 35% of the total land area of this city and that of northern cities should be more than 25% of the total land area of this city [37].
Whether green space accessibility is equitable among communities is being increasingly considered an environmental justice issue [38]. At the early stage of the index’s establishment, the Chinese government proposed the urban greening index to cover the scope of NFCC assessment [39]. Furthermore, according to the “public leisure” part of the index evaluation, the green leisure space in an urban built-up area must be within 500 m of the residences of urban residents [40]. In 2012, the government issued a complete “NFCC Evaluation Index”, defining relevant terms clearly and providing more scientific adjustments in urban greening indicators [41]. For example, urban forest coverage rate requirements were redefined according to the annual precipitation and the proportion of natural wetland area to urban area [42]. The per capita green area of urban parks and the greening of all urban areas (streets, parking lots, important water sources, villages, and towns) were included in the index system [43]. At the same time, a more scientific normative index formula was published to calculate the degree of urban greening and the share of green space. Public participation was also incorporated into the index system [44].

2.3.2. NFCC Selection Indicators at the Development Stage

It is worth noting that the government attaches importance to environmental equity in the indicators. For example, in the policy framework, the government is required to prioritise the needs of citizens and facilitate them in the construction of forest cities [45]. Moreover, it pays attention to urban forestry economic and cultural industry policies and seeks the possibility of green industry [46]. In 2019, the State Administration for Market Supervision and Administration and the Standardization Administration promulgated and implemented the NFCC Evaluation Index (GB/T37342-2019) [47]. As compared with the previous evaluation index version, a new version of the index was designed, involving the factors of forest networks, forest health, ecological welfare, ecological culture, organisation, and management. In addition, five indicators were improved to increase the per capita green space, providing rural greening. The most important point requires cities to build large ecological leisure spaces such as forest parks and wetland parks, and the 20 km service radius of these places needs to cover more than 70% of the city area [48]. The changes in these indicators reflect the fact that the Chinese government has fully incorporated environmental fairness in green spaces into its policies and has put forward higher requirements.

2.3.3. NFCC Selection Indicators following COVID-19

Following the COVID-19 pandemic, in 2020, the government successively issued the “NFCC Management Measures”, the “NFCC Review Measures”, and the “NFCC Evaluation System Operation Manual” [49,50]. These policies put forward new requirements for the construction of UGSs, such as increasing the per capita green space area again and increasing the coverage of the 500 m of the UGS service radius [51]. In addition, the government was encouraged to establish a series of healing infrastructures, such as forest health bases and tourist landscapes. At the same time, through the improvement of the review methods and procedures, the government came to be supervised in its adherence to the construction of UGSs after they obtained the title of “NFCCs”. The current evaluation criteria mainly include the following: (1) restoration and establishment of ecological functional areas, enhancement of ecological service functions, and improvement of urban resilience in order to achieve environmental justice; (2) improvement of the quality of urban environmental green infrastructure in order to achieve the well-being of urban residents; (3) urban landscape improvement drawing on ecological and cultural intelligence; (4) establishment of the integration of urban and rural ecosystems, as well as the realisation of the equality of green resources; (5) the formation of green industries, the promotion of urban industrial transformation, and the narrowing of the economic gap between regions. The transformation of NFCC standards from a focus on quantity to quality also signals that the Chinese government is transforming from an economically focused, construction-oriented government to a public-service-oriented government. The central government has thus realised the importance of green space equality in accordance with the constantly adjusted NFCC evaluation system (Figure 2). This study finds that the Chinese government is trying to encourage local governments to realise equality in UGSs through the central power system and incorporate public participation into policy decision-making in order to optimise the urban governance structure [52]. In conclusion, the Chinese government has shown how the NFCC policy is progressive in creating resilient and sustainable cities by continuously modifying the NFCC indicator system.

2.4. Goals and Benefits

At the initial stage of forest city construction, the NFCC policy is important in improving the urban ecological environment. In 2005, Shenyang was named an “NFCC”, but it was once referred to as “one of the top ten polluted cities in China” by public opinion because of the pollution caused by the development of heavy industry [53]. The local government then actively responded to the NFCC policy. It presented an ecological rationale for the strategic choice to establish a city amidst a forest. After large-scale urban afforestation construction, the government built a complete urban forest landscape system in the urban area and the surrounding suburbs, providing good ecological conditions for its urban sustainability [54,55].
When the construction of forest cities entered the development stage under the implementation of the policy in 2004, 71.17 million hectares of the total area of China had been afforested, with the forest coverage rate increasing from 16.55 per cent to 20.36 per cent and the forest area increasing to 195 million hectares [56,57]. At the same time, to alleviate society’s contradiction between supply and demand, the national policy has gradually changed from “advocating efficiency first” to “safeguarding social fairness and justice” [58]. With the encouragement of the policy, local governments have carried out in-depth greening construction. According to the National Ecological Protection and Construction Plan (2013–2020), issued by the central government in 2013, the green coverage rate of urban built-up areas reached 38.6%, and the per capita green park area reached 11.18 square meters [59]. In the “NFCC Development Plan” issued by the central government in 2018, the average annual afforestation area of local cities granted NFCC status reached 200,000 mu [60]. The support and satisfaction rates of urban and rural residents for the construction of NFCCs in their cities exceeded over 95% in terms of people’s reported well-being.
In the mature stage, some traditional industrial or resource-based cities established a series of tourism and health industries based on green space resources in an attempt to promote urban transformation and green development [61,62]. The central government tried to establish a government-led construction structure that was implemented by the local government and participated in by the residents of the whole city [63]. Therefore, to promote the construction of a forest city, a construction platform for the participation of the whole society was built, and social capital was encouraged and introduced through policy support in order to invest in urban construction through public–private partnership (PPP), build–operate–transfer (BOT), etc.

2.5. Impact of NFCC on Inequalities in Green Space Allocations

In the context of environmental justice, green space equity aims to realise the right of all people and all social groups to equal access to green space resources and environmental amenities [64]. Green space equity argues that the effective participation of all people in the formulation and implementation of environmental laws, regulations, and policies, as well as the distribution of environmental benefits, should be equally protected. In China, the root cause of environmental inequity lies in the fact that, during the development process, all sectors of society prioritise socioeconomic output efficiency or the potential economic benefits brought about by green space in the allocation of green space, ignoring the equity dimension of social groups [65,66]. Therefore, the NFCC policy is a regulatory response proposed by the government in managing green space inequity, with the study of the correlation between the distribution characteristics of NFCCs and the factors leading to green space inequity from a spatial perspective also playing an important role in optimising NFCCs.

3. Materials and Methods

3.1. Data Sources

The national afforestation committee of the People’s Republic of China and the state forestry administration provided the study’s raw data (https://www.forestry.gov.cn/, accessed on 1 November 2023), released by the NFCC list. Up until now, 219 cases have been issued, including 17 batches from 2004 (Figure 3). Social institutions or organisations have issued similar lists due to the particularity of China’s political system. The most authoritative is the list released by the central government [67]. Similarly, these data, along with standards and norms, are among the most authoritative data and can be used as evidence for conducting UGS distribution and access research [68]. The geospatial coordinate data of this research were taken from Google Earth.
Other urban information was based on the updated government work report and statistical yearbook at the end of 2023, which imported socioeconomic data from the various administrative regions as attributes. When these data were entered into the database, projects that were burdened or cancelled due to regional changes in the administrative area were reorganised. The NFCC spatial distribution map was created by reintegrating the final data into 219 position coordinates.

3.2. Research Methodology

Spatial distribution pattern is the main research direction of spatial statistics; any phenomenon is based on the development of a certain geospatial development, and therefore will inevitably have some local characteristics and development of unbalanced characteristics. This paper’s indicator metrics can often explain these characteristics.
In addition, the study overlayed some of the visualised variables (e.g., topography, climate, population density) with the NFCC spatial distribution on a model of oceanic topography land with the help of GIS technology, which allows for a clearer judgement of the drivers affecting the spatial distribution.

3.2.1. Nearest Neighbour Index

The nearest neighbour index calculates the geographic coordinates of how close points are to each other in a geographic space. The nearest neighbour index is often used to assess the spatial equity and accessibility of urban public green spaces [69]. In this research, the main use was to analyse whether the spatial pattern of an NFCC is uniform, random, and condensed. The calculation formula is as follows:
R = d ¯ d E = 2 D d ¯ d ¯ = i = 1 n i n E = 1 2 A n = 1 2 D
where R is the nearest neighbour index, d ¯ is the average distance between the nearest points, and E is the theoretical closest distance. If the R value is greater than 1, the NFCC presents a discrete distribution in terms of space. If the R value equals 1, the NFCC is distributed randomly in terms of space. If the R value is less than 1, the NFCC is clustered. At the same time, its significance can be evaluated by the Z value.

3.2.2. Geographic Concentration

The geographical concentration index is one particular index used to gauge the degree of concentration of the study item in the spatial distribution [70]. In this study, geographic concentration was mainly used to analyse the strength of NFCC concentration at the urban geographic scale in order to understand the spatial distribution structure of NFCCs [71]. The value ranged from 0 to 100. The distribution is more concentrated the higher the G value, and the distribution is more discrete the lower the G value. The precise formula is shown below:
G = 100 × i = 1 n x i T 2
The formula takes T as the total amount of NFCC, x i as the total amount of NFCCs by province, n as the number of cities, and G as the geographical concentrated index.

3.2.3. Imbalance Index

Differences in the spatial distribution of NFCCs show differences in the allocation of green space resources in different regions. In this study, the imbalance index was used to reflect the balanced distribution of NFCCs at the administrative level. The specific formula is as follows:
S = i = 1 n Y i 50 n + 1 100 n 50 n + 1
In the formula, n is the number of provinces and municipalities, n = 28 , and Y i is the cumulative percentage of the number of NFCCs in the total provinces. If S = 0 , then 0 S 1 , indicating that NFCCs are dispersed equally throughout all province cities. All forest cities will be gathered in one specific urban area if S = 1 . The more S values tend towards 1, the more uneven the distribution.

3.2.4. Kernel Density Estimation

As NFCCs have uneven distribution in a region and their inhomogeneity varies with the area of the computational cell, this study accurately expressed the spatial distribution density and degree of aggregation of NFCCs in the physical plane through the Kernel density estimation and clearly assessed the dispersed or discrete characteristics of NFCC spatial distribution through morphological features [72]. Afterwards, the degree of spatial clustering of NFCCs was evaluated at the administrative area level [73]. The calculation formula is as follows:
f n x = 1 n h i = 1 n k x x i h
where the number of NFCCs is represented by n , the distance between the estimated point x and the sample x i is denoted by x x i , the search radius is represented by h , the kernel density estimate is denoted by f n , and the spatial weight function is represented by k.

3.2.5. Pearson Correlation Coefficient

This equation, often known as the linear correlation coefficient for short, quantifies the strength of the linear relationship between x and y and is used to assess how one element affects the quantity of NFCC distributions [74]. In this study, we attempted to use this model to calculate the correlation between the factors affecting the equity of green space resource allocation (national forest resources, variations in the number of cities across provinces, economic development level) and the NFCC distributions, helping us to better understand the link between the two [75]. The formula is as follows:
r x y = i = 1 n x i x ¯ y i y ¯ / i = 1 n x i x ¯ 2 i = 1 n y i y ¯ 2
The formula uses n as the total amount of cities and provinces represented as NFCCs, or x , y , and x ¯ y ¯ as the sample mean and the average of the two variables, respectively. r x y ranges from ( 1,1 ) ; r = 1 indicates a perfect positive linear correlation between the two, that is, Y = a X + b ( a > 0 ) ; r = 1 indicates a perfect negative linear correlation between the two, that is, Y = a X + b ( a < 0 ) . The correlation between the variables is stronger the higher the absolute value of r , and vice versa.

3.2.6. Geographic Detector

In the absence of any assumption, the geographic detector is a tool for identifying the links between elements affecting spatial differentiation and geographical phenomena [76]. Multivariable collinearity does not alter the computation or the outcome. As a spatial statistical method, this model is frequently used to quantitatively study the influence of external factors on the distribution of urban green space resources, and it can quantify the relative importance of the relevant factors. In this study, the model explored the explanatory power of socioeconomic factors affecting the equity of green space allocation on the regional differentiation of NFCCs, helping us to understand which factors are more likely to affect the distribution of NFCCs, as well as to propose effective strategies on this basis [77,78,79]. The standard of measurement was the q value. The model’s formula is as follows:
q = 1 h = 1 L N h σ h 2 N σ 2
The formula calculates L by dividing the entire number of subregions by the amount that affects elements x (number). N h represents the number of NFCCs in the specified region (location), N indicates the total number of NFCCs within this region (local), and σ h 2 represents the NFCC density variation within each subregion. The variation in NFCC concentration for each province is denoted by σ 2 . The [(0–1)] range is where q is valued. The factor’s influence on the NFCC’s spatial distribution increases with larger q values and decreases with smaller q values. If q = 1 , the factor completely affects its spatial distribution; if q = 0 , the factors are independent of their spatial distribution. When q = 1 , the factor’s spatial distribution is entirely influenced by it; when q = 0 , the factor’s spatial distribution is unaffected.

3.3. The Framework of Research

The present research investigated NFCCs using an index and spatial software. The research involved Arc GIS 10.8, IBM SPSS Statistics 26, and GeoDetector 2018 software. Esri created and maintained the Arc GIS 10.8 client software line in order to offer geographic information system services with precise analytical findings and powerful visual representation [80,81]. SPSS Statistics 26 is a commonly used software platform for statistical analysis, providing advanced statistical analysis, machine learning algorithms, and data integration to test the correlation of spatial factors [82]. A statistical tool called GeoDetector 2018 software was used to identify the factors that influence spatial differentiation. It can identify the explanatory power of the influence of spatial differentiation on several elements at once [83]. This study established a geospatial information base by extracting the geospatial information of NFCCs and determined the type of spatial distribution and degree of aggregation of NFCCs using the proximity index, geographic concentration index, and imbalance index. To further determine whether NFCC distribution has a substantial impact on green space equity in each region, the study overlapped the factors affecting green space equity with the spatial distribution of NFCCs by employing the Pearson correlation coefficient and used a geodetector to measure the explanatory power of green space equity drivers on the distribution of NFCCs to test the impact of NFCCs on the spatial distribution of green space (Figure 4).

4. Results

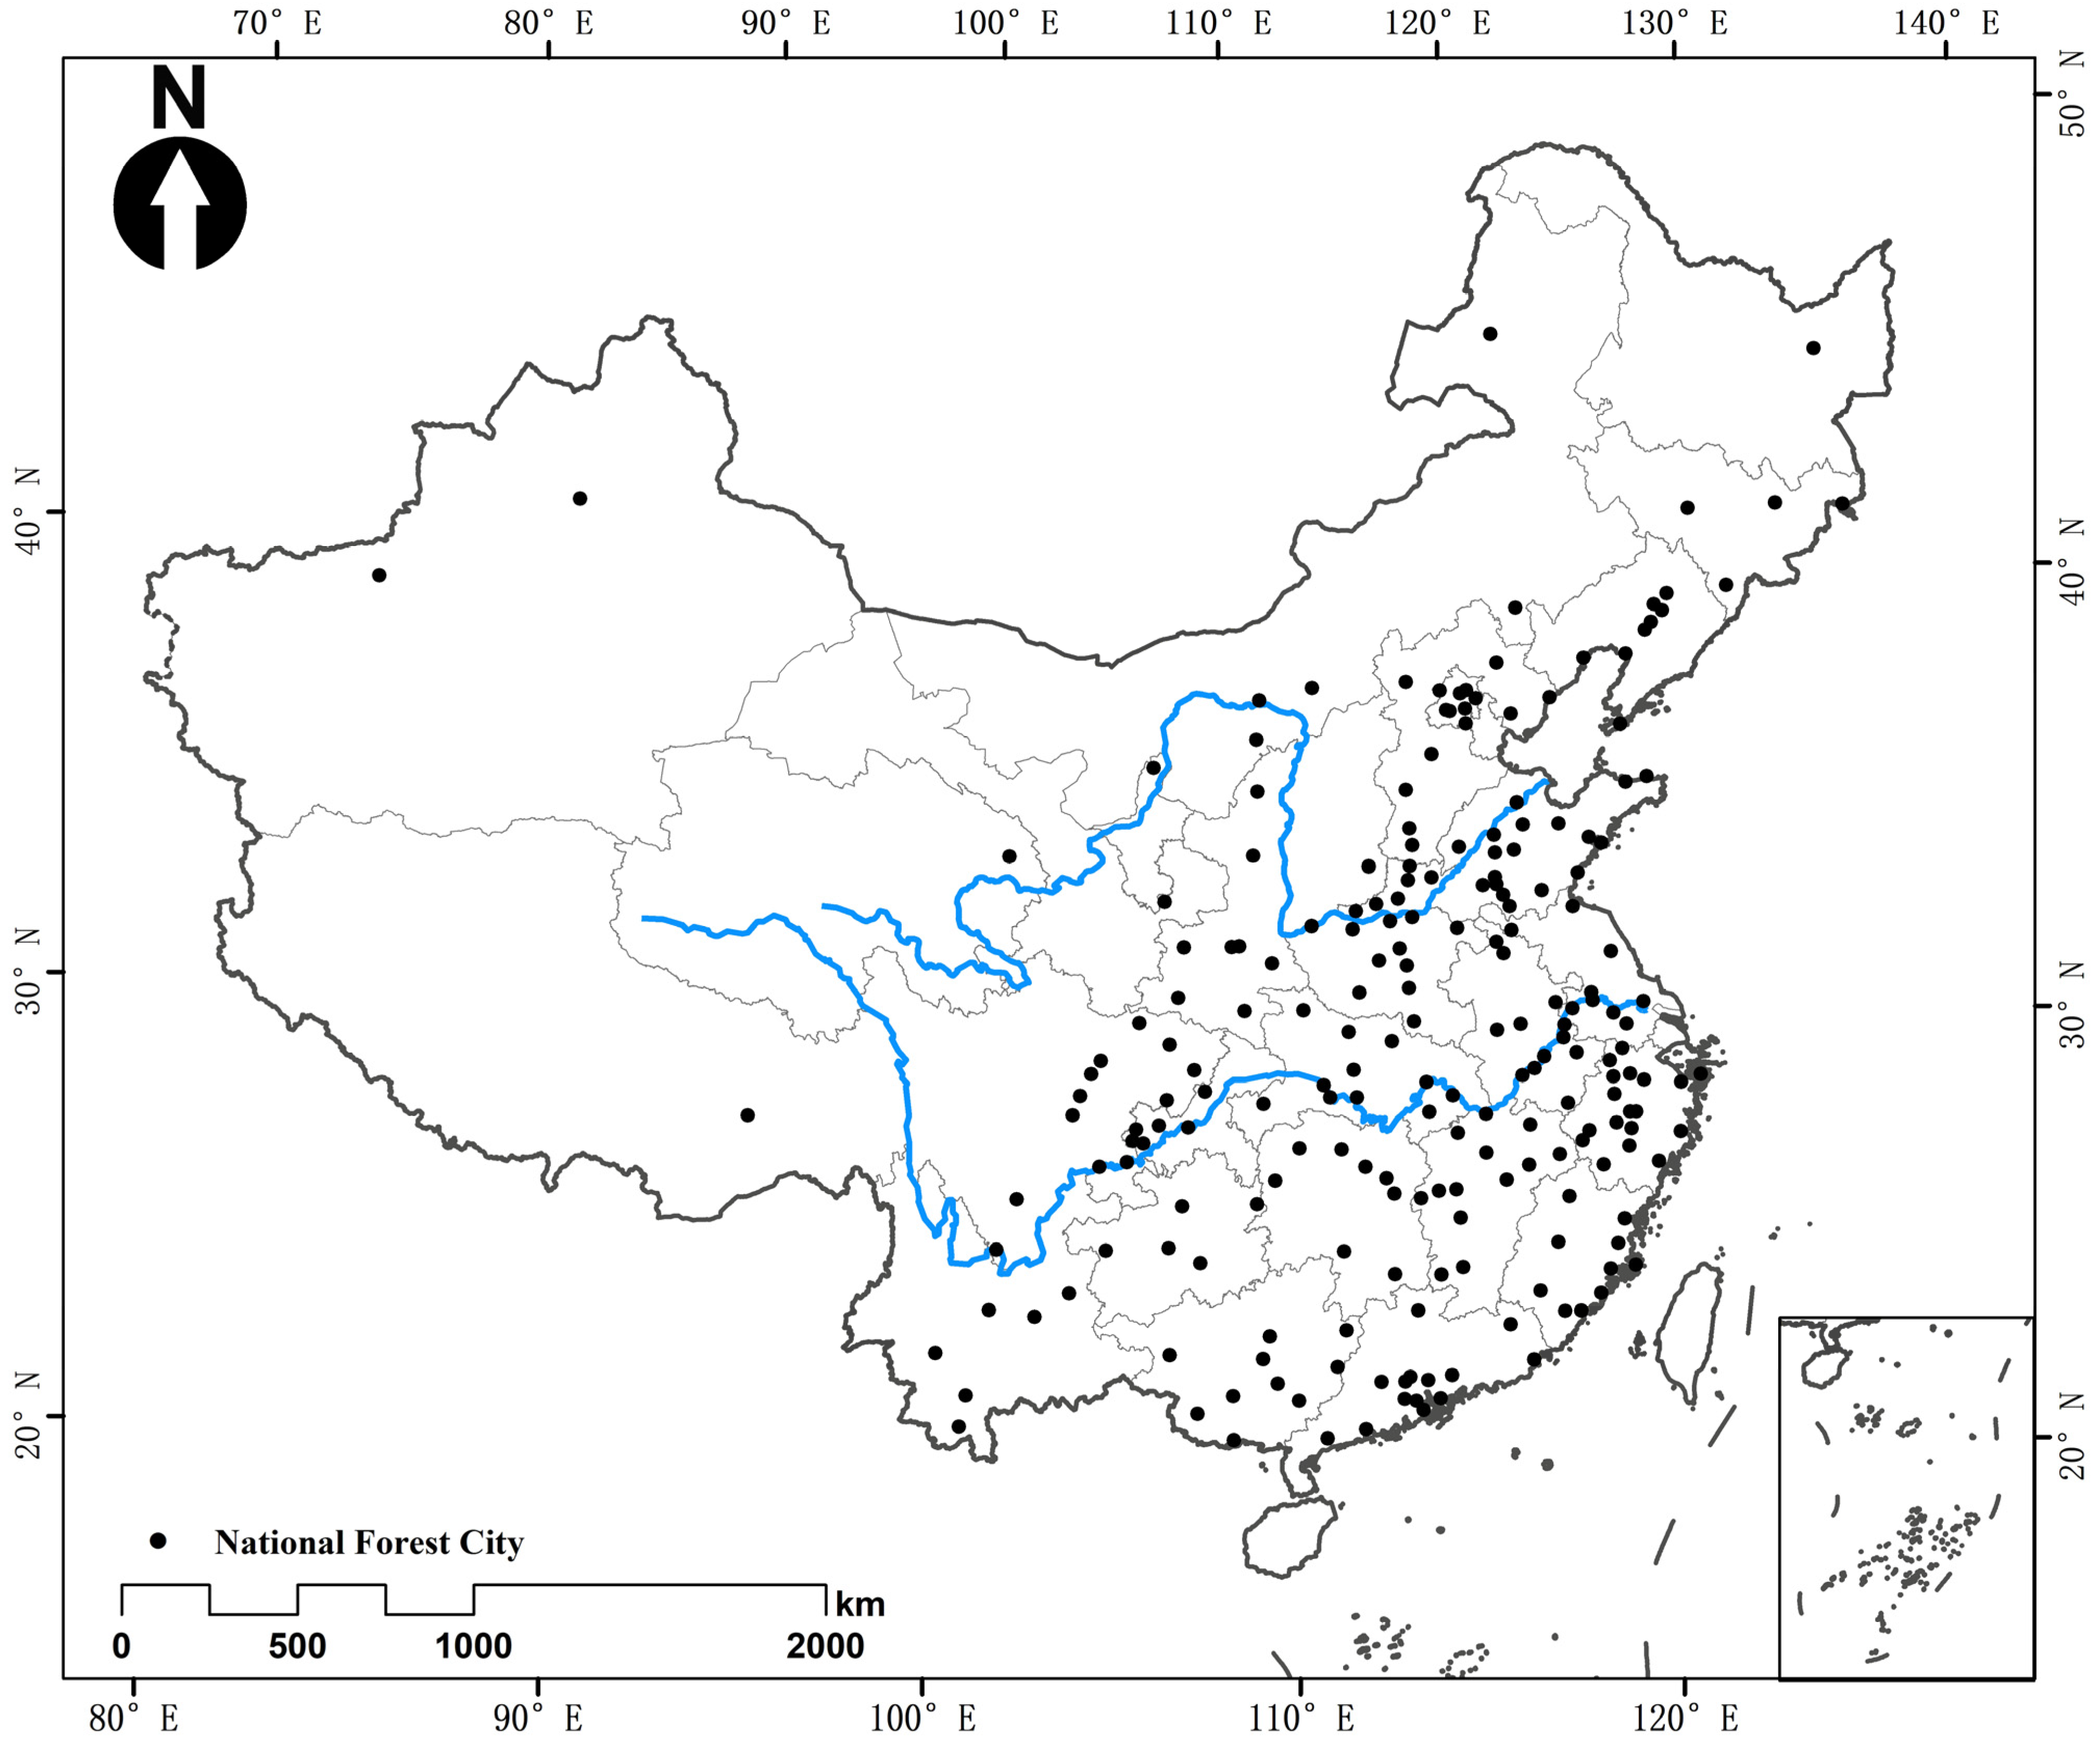
4.1. Synopsis of the Study Topics

This study extracted the spatial distribution data of NFCCs and created a geospatial database that allows for the abstraction of its distribution into point elements from a macroscopic point of view (Figure 5).
This research found that NFCCs were dispersed in 29 different administrative regions. The spatial data of NFCC distribution were obtained based on index calculation (Table 2).

4.2. Examination of NFCC Spatial Properties

4.2.1. Pattern of Spatial Dispersion

The average nearest neighbour index obtained in this research was R = 0.728825 < 1 and Z = 7.677197 < 2.58 . The findings indicate a 99% chance of a clustering distribution for the NFCC spatial distribution in the area.

4.2.2. Equitable Dispersion in Space

  • The level of spatial distribution concentration
As stated by the geographical concentration index Formula (2), the number of distributions for each region was calculated (Table 3). The NFCC overall geographic concentration index, G = 22.67066967, was able to be calculated. Theoretically, the ideal geographical concentration index would be substantially smaller than the actual geographical concentration index (=17.15), assuming the 219 NFCCS were distributed equally throughout the provincial units. In line with this, NFCC distribution was found to be concentrated at the provincial level, mostly in Shandong, Zhejiang, Henan, Guangdong, and Jiangsu.
  • The level of spatial distribution equilibrium
In academic circles, China is usually divided geographically into seven regions: Northeast, South, Southwest, Central, North, East, and Northwest (Table 4) [84]. The NFCC spatial distribution varies widely across this geographic division, being mostly found in East China, followed by Central China, together making up more than half of the nation (Figure 6).
The NFCC imbalance index S = 0.389480805 can be used to measure the balance of NFCC administrative distribution. This implies that NFCCs are dispersed differently throughout all province units. The data were used to create Lorenz curves showing the distribution of NFCCs in provincial units (Figure 7). As can be seen from the figure, half of the NFCCs were distributed in the following eight provinces: Shandong, Zhejiang, Henan, Guangdong, Jiangxi, Anhui, Sichuan, and Hubei.

4.2.3. Characteristics of Spatial Distribution Density

This study used ArcGIS 10.8’s kernel density tool to identify the NLGCC aggregation (Table 5). It presented a distribution pattern of three cores, multi-scatter, and Lamellar extension (Figure 8).
“Three cores” refers to three core density regions: one with Zhejiang (18) as the core, radiating to Jiangxi (13) and Fujian (10); one with Shandong (18) as the core, radiating to Jiangsu (9) and Anhui (12); and one with Henan (17) as the core, radiating to Shanxi (2). The kernel density index in all regions was greater than 1.00.
  • “Three centres” refers to six high-density core areas. One had Beijing (7) as the core, radiating to the Hebei (9) high-density area; another was centred on Chongqing (6), radiating to Sichuan (12) and Guizhou provinces (5); finally, the last one was a single central region with Guangdong as a single core. The kernel density index of the high-density region was in the range of 0.60 to 1.40.
  • A few medium-density and low-density zones were indicated by multiple scattered points and lamellar extension. The middle- and low-density area in the east is a continuous high-value area that displayed a lamellar distribution with a diminishing kernel density value. Middle- and low-density regions were found to be mostly dispersed over the Central, Southern, Northeastern, and Western regions.
  • In conclusion, the East had a higher concentration of NFCCs than the West, and the South had a higher concentration than the North. The northwest inland parts were found to be sparsely populated, with the majority of NFCCs being concentrated in the southeast coastal areas that are more commercially developed.

5. Factors Affecting NFCC Geographical Dispersion

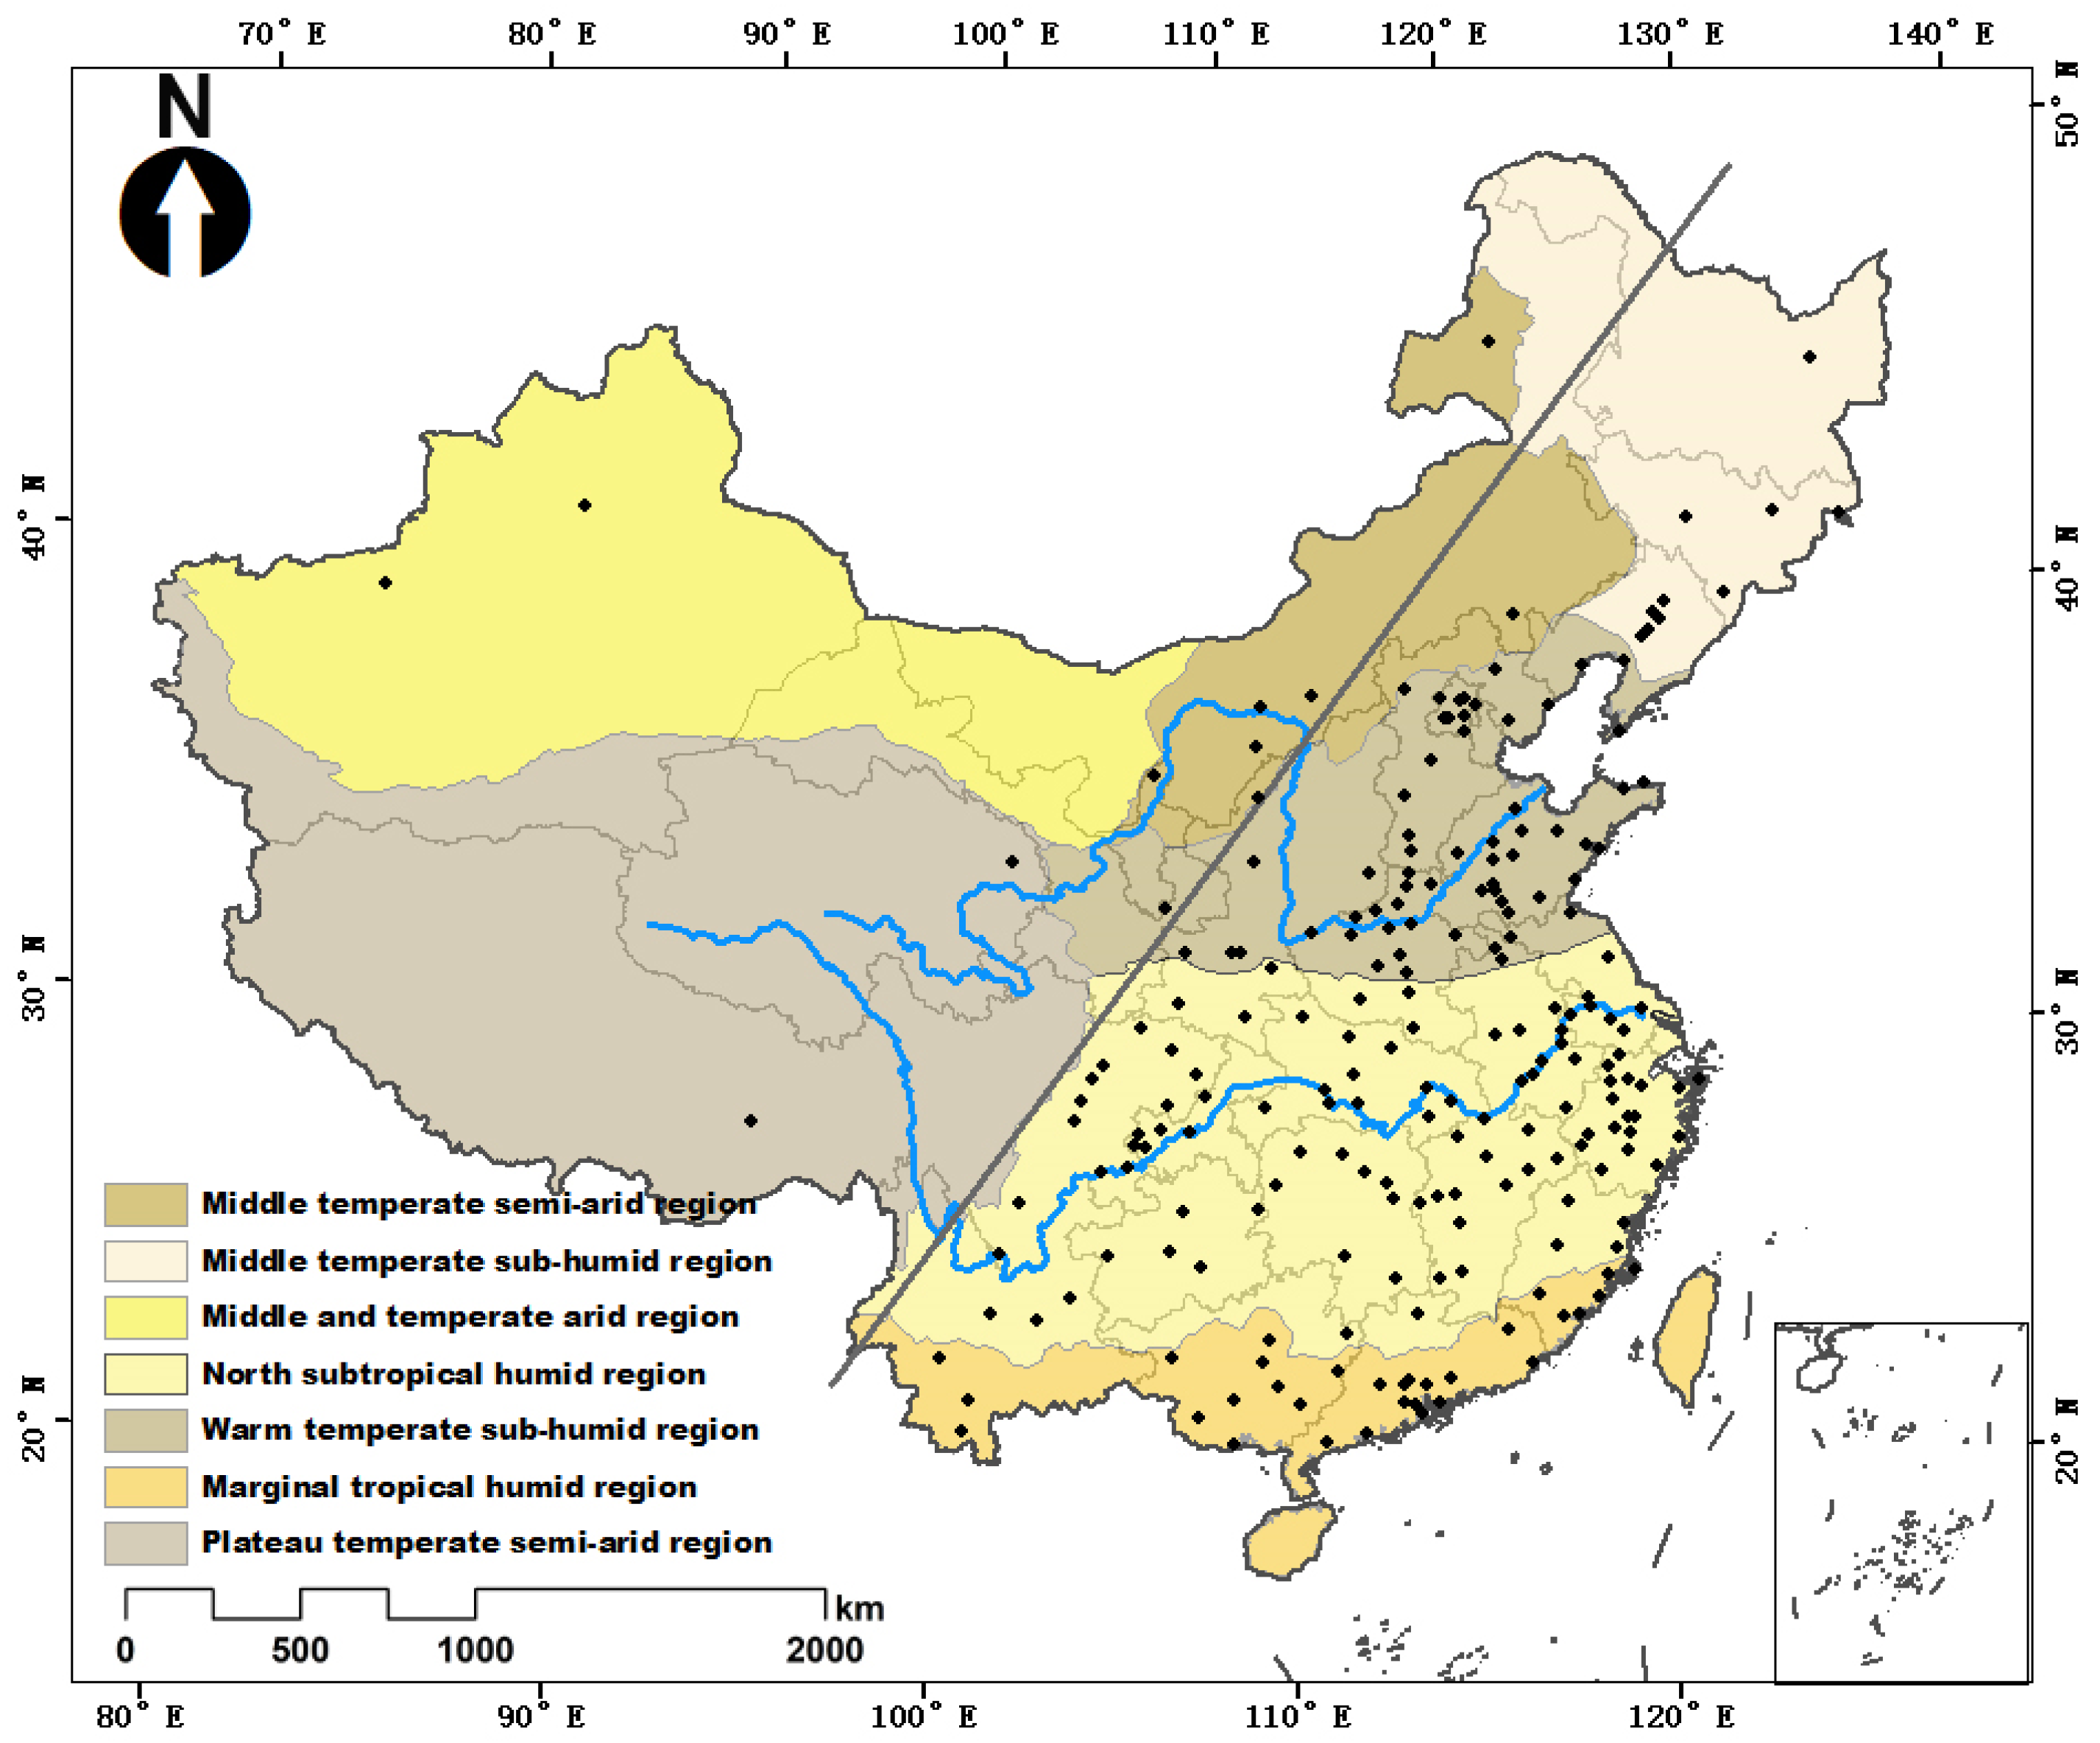
5.1. Elements of the Natural Environment

5.1.1. Place and Elevation

The topography of different areas often directly and indirectly affects the allocation of UGSs [85]. China’s landscape can be classified geographically into three primary zones: plain, basin, and plateau [86]. It can be concluded that NFCCs are mainly concentrated in the low-altitude plain area and are rarely found in areas above 4000 m (Figure 9). The findings indicate a significant inverse relationship between elevation and the spatial distribution of NFCCs. The unequal spatial distribution of NFCCs can be said to be directly caused by the elevation difference.

5.1.2. Hydroclimatic Circumstances

Climate has significantly impacted both the creation of NFCCs and the activities of human production [87]. There is a direct connection between climate and vegetation growth [88]. In order to analyse the data, this study separated China’s climate into seven main categories and connected them with the NFCC regional dispersion features (Figure 10).
The warm temperate sub-humid and North subtropical humid regions have become the main geographic areas of NFCC distribution. These regions depend on higher precipitation and comparatively better temperature conditions to provide more heat and moisture for forest growth, being favourable for afforestation and the creation of green space.
The temperate semi-arid region of the plateau is characterised by high altitude, inadequate temperature accumulation, and short plant development periods, accounting for the low NFCC distribution in such climate zones. The middle and temperate semi-arid zone and the middle and temperate sub-humid zone are characterised by drought, low rainfall, and water scarcity. In the middle and temperate arid areas, the temperature difference between day and night is large, and the precipitation is less, being particularly arid and thus not conducive to the growth of forest plants. Although the marginal tropical humid area is rich in terms of heat, resources, and precipitation, the proportion of the total land area is not large, and the number of forests is relatively small, which limits the expansion of forest space.
This pattern suggests that the primary element influencing the distribution pattern of NFCCs is the regional differentiation of heat resources and climatic circumstances, which also severely limits NFCCs’ spatial diffusion direction and global range.

5.2. Aspects of Society and Economy

5.2.1. Populace

The population geographical dividing line (Hu population dividing line) reflects the pattern of population development in China from ancient times to the present [89]. Research has found that the spatial distribution pattern of NFCCs is closely related to this population’s geographic dividing line (Figure 11). By comparing the number of NFCCs in these provinces, we found a significant positive correlation between population density and NFCCs. The population determines the pressure borne by the environment and directly determines the allocation of green space. Thus, there is a direct link between NFCCs and environmental justice.

5.2.2. National Forest Resources

NFCCs reflect the development of national green space construction in China. National forest parks are an important embodiment of forest construction and development and are also an important factor in measuring the environmental equity of a regional green space. Using the Pearson correlation coefficient ( r 1 = 0.386 , significant at the 0.04 level), it was found that there was a significant medium positive correlation between the number of national forest parks in each province and the number of NFCC variables. The scatter plot (Figure 12) also demonstrates the spatial link between national forest park and NFCC distributions. However, Heilongjiang Province is rich in national forest parks, yet only one NFCC exists there. Therefore, the number of national forest parks is not the only driving factor affecting the distribution of NFCCs. Urban green space, park green space, number of parks, park area, and the green coverage rate of built-up areas are all important driving factors that affect the distribution of NFCCs.

5.2.3. Variations in the Number of Cities across Provinces

Given that NFCC declarations are required by local municipalities, it is therefore the case that the larger the city base, the greater the number of NFCCs found in a particular region. The Pearson correlation coefficient and the number of provincial-level cities that meet the NFCC policy were calculated, yielding a result of r 2 = 0.622   (significant at the 0.01 level). This study shows that the number of provincial-level cities strongly correlated with the number of NFCCs. At the same time, the spatial consistency between the main distribution of densely populated urban areas and NFCC areas can be seen from the scatter diagram (Figure 13), as well as in the overlay of the NFCCs with the national urban population density map (Figure 10), which also shows that the current accumulation of NFCCs was affected by the uneven spatial distribution of Chinese cities. In addition, according to the National Forest Urban Agglomeration Pattern Distribution Map (Figure 14), local governments in China are establishing national forest urban agglomeration, which is promoted by the development of NFCCs.

5.2.4. Economic Development Level

Regional variations significantly influence the spatial distribution of NFCCs in terms of economic development. Gross domestic product (GDP) per capita is often used as a variable to measure the economic level of a region [90]. The NFCC and GDP percentages were used as study variables to gauge how closely the two had a linear connection (Table 6). With the aid of IBM SPSS Statistics 26 software, the Pearson correlation coefficient, r 3 = 0.582 (significant at the 0.01 level), was determined. We found a highly significant, somewhat positive association between the degree of economic development and the NFCC spatial dispersion. Because of this, the selection criteria for NFCCs shifted from strict controls involving large amounts of money invested in green space construction to integrating other relevant resources. Therefore, economically developed areas are better than less developed areas regarding financial resources. They benefit from better market mechanisms in constructing national forests when they mature and have more advantages in terms of selecting NFCCs. In addition, residents in economically developed areas tend to have higher income and consumption levels and value environmental equity more [91]. Therefore, compared with residents in economically underdeveloped areas, they can enjoy more environmental space of a higher quality. The selection index points out that social activities such as science education, publicity activities, demonstration activities, and public attitudes in the city are also included in the index system.

5.2.5. Analysis of the Explanatory Power of Social and Economic Factors

Many of the elements influencing the spatial distribution pattern of NFCCs may be connected to the causes of environmental equality. To gain a better understanding of the percentage of these components that contribute to the spatial differentiation of an NFCC, one can examine the features of spatial differentiation. This study used a geographic detector to measure the explanatory power of these factors. Considering the validity, applicability, and accessibility of the indicator data, we developed indicator systems from five dimensions that affect environmental justice (ecological environment, social economy, traffic factors, cultural factors, and public health) as influencing factors (Table 7).
According to Formula (6), the factor detection of a geographic detector can detect the extent to which its factors explain the spatial differentiation of the detection properties. The numerical value of the geographic detector should be the type of quantity. Since the independent data variable in this study was mainly the numerical quantity, it needed to be discretised. This paper used the K-means function for the discretisation processing of the separation algorithm. The results (Table 8) are as follows:
1.
Ecotope
The ecological environment largely drives the distribution difference of NFCCs. As seen from Table 8, among ecological environment factors, urban green space and the number of parks were found to have the most significant explanatory power for national forest urban parks, with a factor explanatory power of 0.62. With explanatory powers of 0.56, 0.52, 0.48, 0.43, and 0.32, respectively, the second variable with the most explanatory power was the park green area, followed by the number of national forest parks, the parking area, the forest coverage rate, and the green area coverage rate of built-up regions. From the perspective of the construction and development of NFCCs, the potential benefits of NFCCs to society are important factors affecting NFCC policy. The selection of NFCCs takes park green space, national forest parks, urban green space, and forests as important indicators to measure regional value, conducive to providing the ecological basis for the potential benefits brought about by national forest construction and playing an important role in solving the inequality of green space and realising environmental equity.
2.
Social economy
The level of economic development is closely related to the spatial differentiation of NFCCs. However, in the comparison of economic level factors, compared with GDP per capita, the urban population density and resident consumption level were found to have a greater impact on the spatial distribution of NFCCs, with explanatory powers of 0.63 and 0.35, respectively. As a driving factor for the spatial differentiation of NFCCs, the influence of urban population density was found to be even higher than that of the ecological environment. This is because urban areas with developed economies and high-quality environments can attract more of an urban population to form a larger urban system. In addition, population density determines the lower limit of UGS bearing pressure, and the direct cause of the inequality of high-density urban green space is the uneven distribution of population density. At the upper limit of urban green space allocation, residents’ consumption level indirectly affects environmental equity. Meanwhile, improving population density and residents’ consumption level leads to increasingly higher demand for a quality environment. In a sense, the level of economic development determines the scale, quality, development direction, and model of an NFCC.
3.
Traffic factor
The traffic factor is an important consideration for urban development, but it has no significant impact on the spatial distribution of an NFCC. The explanatory powers of railway and highway mileage as traffic factors were found to be only 0.12 and 0.26, respectively. Accessibility affects the city’s external communication and urban proliferation and development, but it also increases the burden on the city’s ecosystem. Therefore, compared with other driving factors, the impact of traffic factors cannot provide a significant research value for the spatial distribution of NFCCs.
4.
Cultural factors
Cultural factors are important in supporting the development of NFCCs. The evaluation index of NFCCs includes ecological industry and ecological culture in the selection index. In the cultural environment affecting the distribution of NFCCs, the explanatory power of the number of tourist attractions, the total tourism income, and the number of tourist receptions were found to be 0.56, 0.53, and 0.36, respectively. National forest resources are related to economic and social development potential. Since 2017, the Chinese government has adopted the maxim “clear water and green mountains are gold and silver mountains”. Zhejiang is the first province in the country to promote and implement this concept. Hangzhou, Jiaxing, and Huzhou in Zhejiang Province, with their beautiful green tourism resources, earned CNY 7.1 billion in 2015 during the Spring Festival. Green resources have brought about several economic benefits to Zhejiang Province. The ecological industry and ecological culture are important driving factors for realising environmental equity in high-density cities.
5.
Public health
The end of the COVID-19 pandemic has forced a renewed focus on urban public health. Studies have shown a correlation between air quality (PM2.5 concentration) and COVID-19 infection. However, regrettably, at present, air quality (PM2.5 content) and legal incidence of class A and B infectious diseases, as driving factors affecting the distribution of NFCCs, have no significant influence, and the explanatory power of these factors was found to be only 0.23 and 0.28, respectively. Although studies have proven that establishing NFCCs has a certain effect on air quality improvement, air quality is still not a selection criterion for NFCC development.

6. Discussion

Through qualitative research on the origin and evolution of NFCC policy, this study found from an empirical perspective that the establishment of NFCCs aims to improve the quality of life of urban residents through a beneficial ecological environment, equitable public goods, and a focus on the general well-being of the people. This then enhances residents’ sense of gain and happiness through the realisation of green space environment equity and brings a focus to solving the major contradictions in Chinese society.
Second, this article concludes that the coupling effect of natural binding force, socioeconomic driving force, and social administrative driving force is responsible for building urban NFCCs based on the quantitative analysis of the spatial distribution characteristics and driving elements of urban NFCCs. The NFCC structure in China is directly impacted by the underlying pattern of spatial environment imbalance in China, which is determined by regional variances under natural variables including elevation, topography, and climate. Socioeconomic factors such as forest resources, green space, number of urban agglomerations, and population size further aggravate the imbalance of this pattern. These drivers are significantly correlated with NFCCs, impact NFCCs’ spatial dispersion to differing degrees, and are impacted by one another. The formulation and determination of standards by the competent authorities and the structuring and decision making of municipal governments at the prefecture level make up the state’s administrative authority to designate an NFCC’s spatial layout. This study also provides some policy implications for building human settlements in China. The findings demonstrate that economic disparity plays a significant role in the unequal spatial distribution of NFCCs, which directly contributes to environmental injustice. China has a significant degree of regional disparity, with the eastern region being more developed than the central and western regions, with this being the reason behind the injustice at the environmental level. This research demonstrates that the economic disparity between the western and central areas has become a barrier to advancing environmental justice and the sustainable growth of human settlements. Hence, the government must address the issue of local economic imbalance and focus on the human settlements in the central and western regions. In addition, this study pointed out that a trend towards regional agglomeration of NFCCs is emerging. In this setting, the Chinese government began to guide the construction of the settlement form of national forest urban agglomerations to strengthen the connection between various cities in a settlement. The Chinese government is not only promoting the aggregation of urban agglomerations, however. In the newly released NFCC Development Plan, the Chinese government was shown to also be trying to build the “Silk Road Economic Belt”, a forest city protection belt; the “Yangtze River Economic Belt”, a forest city carrying belt; and the “Coastal Economic Belt”, a forest city carrying belt based on the NFCC policy, building ecological links to China’s key economic and urban development zones. These policy adjustments based on current trends can effectively strengthen inter-regional urban linkages, centralise the economy of various regional cities, and stimulate the coordinated development of various cities.
Regarding the NFCC construction principles and construction priorities, this study makes the following recommendations:
  • There is a need to strengthen the public service function of green resource cities. The requirement of enhancing the ecological well-being of residents is reflected in the construction of NFCCs.
  • Considering the particularity of China’s social system, urban and rural areas are part of the human settlement environment. The problem of environmental injustice is common in urban suburbs and rural areas, and thus NFCCs should optimise suburban and rural spaces, establish linkages, and provide equal ecological benefits.
  • China is a socialist country, so the central government should encourage local governments to play an active role through working with communities and encouraging the public to participate in the construction of forest cities.
  • Local authorities in the western region should be aware that although the western region has a challenging environment that is not conducive to vegetation planting, the low population density of the region allows the government to undertake higher-quality green space development and utilise landscape management in compact cities in order to address inequalities in terms of the use of green space in specific areas.
  • In the development of NFCC indicators to be used to address inequalities in urban green space, this study recommends the inclusion of public health indicators. Although current research suggests that the variable of public health has a weak impact on the development of NFCCs, health as a benefit of green space equity should not be overlooked.
  • Local governments should follow the NFCC indicators in order to enhance the coverage of green spaces and forests if they want to solve the problem of green space inequality. Moreover, this study suggests that the development of industries derived from green resources should not be neglected. Through upgrading the economy, the inequality of green space distribution can be solved.
  • In addition, attention must be paid to ensuring that the economy is not built in an uncontrolled manner to address environmental inequalities, as uncontrolled expansion of built-up areas can also deteriorate the ecology of the area and create green space inequalities.
With the further development of NFCCs, regional settlements such as national forest urban agglomeration and forest city belts will gradually be formed. Experts can study the rules or reasons for forming regional settlements in national forest urban agglomeration at the meso level. In addition, there are limitations to this study. The original data of this study come from the National Afforestation Committee of the People’s Republic of China and the State Forestry Administration, who have a certain authority and representativeness, but these data do not completely cover nor are equal to the data of a study that specifically focuses on UGS distribution and access, and thus complementary and/or similar studies can be carried out on urban green space and its allocation fairness from other perspectives on the data.

7. Conclusions

The NFCC policy is a strategic intervention of the Chinese government to improve public policy, being a key development strategy wherein China is planning, implementing, and fairly managing green space. By discussing the importance and benefits of NFCC policy at the macro level, and by using the GIS spatial analysis method, SPSS analysis tool, and geographic detector, this study studied the spatial distribution and driving factors of forest cities in 219 countries in China in order to explore the laws behind the spatial distribution of NFCCs and the policy implementation structure, providing other high-density cities with useful information for the study of environmental equity. The main findings are as follows:
  • The selection criteria for NFCC policy have evolved steadily, having a diversified development trend towards all fields of social human settlements in the future. The policy theme has also changed from an early focus on green resources and ecological restoration to the equality of social green space. This change reflects the fact that the Chinese authorities have gradually attached importance to the harmonious development of green resources in terms of society and the economy in the process of urbanisation. The Chinese government’s demand for the equality of green space reflects the uniqueness of the national political system.
  • The spatial distribution of NFCCs currently presents an uneven feature, mainly characterised by obvious spatial clustering characteristics. At the regional scale, there are three core-density regions, three high-density regions with a large radiation range, and several low-core regions, and these regional scales showed a laminar extension trend. In the whole country, NFCCs are bounded by Hu Weiyong’s population density dividing line, showing a dense distribution in the east and a sparse cohesive distribution in the west.
  • Both the natural environment and socioeconomic factors drive such policy pattern differences. For example, socioeconomic factors, ecological environment, urban population density, per capita GDP, and some cultural and tourism industries are all significant factors that affect the distribution. At the same time, natural factors such as terrain and climate also affect the spatial distribution characteristics of NFCCs to varying degrees. These important factors also significantly affect UGS equity.
  • The uneven spatial distribution brought about by such policies will also affect the direction of national strategic development. For example, the uneven spatial distribution of NFCCs has formed an urban agglomeration system. The Chinese government has found the law behind this and tried to establish a construction system based on forest urban agglomeration settlements to strengthen the ecological spatial integration among cities. Moreover, this distribution led the government to consider supporting strategies for the national development strategy, such as the current Chinese government trying to provide ecological support for the “China Silk Road Economic Belt” and “Coastal Economic Belt” through the NFCC policy in an attempt to develop a sustainable green ecological balance.
This study’s findings indicate that the spatial distribution of NFCCs highly influences the equality level of urban open green space. However, the measures used by the official sector to select the NFCC are, at best, only marginally effective in promoting the spatial equality of green space. As a pioneering study at a national scale, this study provides results that should also help inform policymakers and urban planners about other factors important for achieving equity in urban green space to propose more comprehensive policy interventions to achieve equity in urban green space nationwide.

Author Contributions

Conceptualisation, J.Z., Z.Z. and J.C.; writing—original draft preparation, Z.Z.; writing—review and editing, J.Z.; supervision, J.C.; funding acquisition, J.Z. All authors have read and agreed to the published version of the manuscript.

Funding

This research was funded by Le Fonds de la Recherche Scientifique—FNRS (Fund for Scientific Research) and Wallonie-Bruxelles International (WBI), grant number: SUB/2020/482272.

Data Availability Statement

No new data were created or analyzed in this study. Data sharing is not applicable to this article.

Conflicts of Interest

The authors declare no conflicts of interest.

References

  1. Yang, W.; Yang, R.; Zhou, S. The spatial heterogeneity of urban green space inequity from a perspective of the vulnerable: A case study of Guangzhou, China. Cities 2022, 130, 103855. [Google Scholar] [CrossRef]
  2. Rhodes, E.L. Environmental Justice in America: A New Paradigm; Indiana University Press: Bloomington, IN, USA, 2005. [Google Scholar]
  3. Yamamoto, E.K.; Lyman, J.-L.W. Racializing environmental justice. U. Colo. L. Rev. 2021, 92, 1393. [Google Scholar]
  4. Anqi, D.; Cenci, J.; Zhang, J. Links between the pandemic and urban green spaces, a perspective on spatial indices of landscape garden cities in China. Sustain. Cities Soc. 2022, 85, 104046. [Google Scholar]
  5. Kabisch, N.; Haase, D. Green justice or just green? Provision of urban green spaces in Berlin, Germany. Landsc. Urban Plan. 2014, 122, 129–139. [Google Scholar] [CrossRef]
  6. Yao, M.; Yao, B.; Cenci, J.; Liao, C.; Zhang, J. Visualisation of High-Density City Research Evolution, Trends, and Outlook in the 21st Century. Land 2023, 12, 485. [Google Scholar] [CrossRef]
  7. Frumkin, H. COVID-19, the built environment, and health. Environ. Health Perspect. 2021, 129, 075001. [Google Scholar] [CrossRef] [PubMed]
  8. Zhang, J.; Yao, M.; Cenci, J. Rethinking urban decline in post-COVID19: Bibliometric analysis and countermeasures. Buildings 2023, 13, 2009. [Google Scholar] [CrossRef]
  9. Wu, C.; Cenci, J.; Wang, W.; Zhang, J. Resilient City: Characterization, Challenges and Outlooks. Buildings 2022, 12, 516. [Google Scholar] [CrossRef]
  10. Jing, C.; Tao, H.; Jiang, T.; Wang, Y.; Zhai, J.; Cao, L.; Su, B. Population, urbanization and economic scenarios over the Belt and Road region under the Shared Socioeconomic Pathways. J. Geogr. Sci. 2020, 30, 68–84. [Google Scholar] [CrossRef]
  11. Wang, S.; Bai, X.; Zhang, X.; Reis, S.; Chen, D.; Xu, J.; Gu, B. Urbanization can benefit agricultural production with large-scale farming in China. Nat. Food 2021, 2, 183–191. [Google Scholar] [CrossRef]
  12. Zhou, Q.; van den Bosch, C.C.K.; Chen, Z.; Wang, X.; Zhu, L.; Chen, J.; Lin, Y.; Dong, J. China’s Green space system planning: Development, experiences, and characteristics. Urban For. Urban Green. 2021, 60, 127017. [Google Scholar] [CrossRef]
  13. Chen, Z.; Fu, W.; Konijnendijk van den Bosch, C.C.; Pan, H.; Huang, S.; Zhu, Z.; Qiao, Y.; Wang, N.; Dong, J. National forest parks in China: Origin, evolution, and sustainable development. Forests 2019, 10, 323. [Google Scholar] [CrossRef]
  14. Li, X.; Zhao, C. Can national forest city construction mitigate air pollution in China? Evidence from a quasi-natural experiment. Environ. Geochem. Health 2023, 45, 3003–3024. [Google Scholar] [CrossRef] [PubMed]
  15. Pei, N.; Wang, C.; Sun, R.; Xu, X.; He, Q.; Shi, X.; Gu, L.; Jin, J.; Liao, J.; Li, J. Towards an integrated research approach for urban forestry: The case of China. Urban For. Urban Green. 2019, 46, 126472. [Google Scholar] [CrossRef]
  16. Zhang, K.; Yun, G.; Song, P.; Wang, K.; Li, A.; Du, C.; Jia, X.; Feng, Y.; Wu, M.; Qu, K. Discover the Desirable Landscape Structure of Urban Parks for Mitigating Urban Heat: A High Spatial Resolution Study Using a Forest City, Luoyang, China as a Lens. Int. J. Environ. Res. Public Health 2023, 20, 3155. [Google Scholar] [CrossRef]
  17. Zhang, Y.; Zhang, T.; Zeng, Y.; Cheng, B.; Li, H. Designating National Forest Cities in China: Does the policy improve the urban living environment? For. Policy Econ. 2021, 125, 102400. [Google Scholar] [CrossRef]
  18. Park, M.S.; Youn, Y.-C. Development of urban forest policy-making toward governance in the Republic of Korea. Urban For. Urban Green. 2013, 12, 273–281. [Google Scholar] [CrossRef]
  19. Hu, C.; Chen, J.; Dong, J. Impact of City Forests on Haze Reduction—Implementation of the National Forest City Policy in China. Forests 2023, 14, 703. [Google Scholar] [CrossRef]
  20. Li, W.; Qi, J.; Huang, S.; Fu, W.; Zhong, L.; He, B.-J. A pressure-state-response framework for the sustainability analysis of water national parks in China. Ecol. Indic. 2021, 131, 108127. [Google Scholar] [CrossRef]
  21. Xu, C.; Li, Y.; Li, X.; Cheng, B. Does the National Forest City Policy Promote Haze Pollution Control? In Green Infrastructure in Chinese Cities; Springer: Berlin/Heidelberg, Germany, 2022; pp. 125–141. [Google Scholar]
  22. He, M.; Wu, Y.; Liu, X.; Wu, B.; Fu, H. Constructing a multi-functional small urban green space network for green space equity in urban built-up areas: A case study of Harbin, China. Heliyon 2023, 9, e21671. [Google Scholar] [CrossRef]
  23. Konijnendijk, C.C.; Ricard, R.M.; Kenney, A.; Randrup, T.B. Defining urban forestry—A comparative perspective of North America and Europe. Urban For. Urban Green. 2006, 4, 93–103. [Google Scholar] [CrossRef]
  24. Pauleit, S.; Jones, N.; Nyhuus, S.; Pirnat, J.; Salbitano, F. Urban forest resources in European cities. In Urban Forests and Trees: A Reference Book; Springer: Berlin/Heidelberg, Germany, 2005; pp. 49–80. [Google Scholar]
  25. McPherson, E.G.; Nowak, D.; Heisler, G.; Grimmond, S.; Souch, C.; Grant, R.; Rowntree, R. Quantifying urban forest structure, function, and value: The Chicago Urban Forest Climate Project. Urban Ecosyst. 1997, 1, 49–61. [Google Scholar] [CrossRef]
  26. Steenberg, J.W. People or place? An exploration of social and ecological drivers of urban forest species composition. Urban Ecosyst. 2018, 21, 887–901. [Google Scholar] [CrossRef]
  27. Escobedo, F.J.; Giannico, V.; Jim, C.Y.; Sanesi, G.; Lafortezza, R. Urban forests, ecosystem services, green infrastructure and nature-based solutions: Nexus or evolving metaphors? Urban For. Urban Green. 2019, 37, 3–12. [Google Scholar] [CrossRef]
  28. Miller, R.W.; Hauer, R.J.; Werner, L.P. Urban Forestry: Planning and Managing Urban Greenspaces; Waveland Press: Long Grove, IL, USA, 2015. [Google Scholar]
  29. Xie, H.; Tan, X.; Yang, C.; Li, C. Does Urban Forest Control Smog Pollution? Evidence from National Forest City Project in China. Sustainability 2022, 14, 12897. [Google Scholar] [CrossRef]
  30. Wu, Q.; Zhou, J. Need for cognitive closure, information acquisition and adoption of green prevention and control technology. Ecol. Chem. Eng. S 2021, 28, 129–143. [Google Scholar] [CrossRef]
  31. Xu, C.; Dong, L.; Yu, C.; Zhang, Y.; Cheng, B. Can forest city construction affect urban air quality? The evidence from the Beijing-Tianjin-Hebei urban agglomeration of China. J. Clean. Prod. 2020, 264, 121607. [Google Scholar] [CrossRef]
  32. Wang, C.; Jin, J.; Davies, C.; Chen, W.Y. Urban Forests as Nature-Based Solutions: A Comprehensive Overview of the National Forest City Action in China. Curr. For. Rep. 2024, 1–14. [Google Scholar] [CrossRef]
  33. Daoyang, W.; Yongqiang, Q.; Wentong, X.; Bolin, Z.; Siyuan, Z.; Yuheng, L. The Forest City Development Strategy under the “14th five-year plan” and National Territory Plan. For. Resour. Wanagement 2021, 19, 19–22. [Google Scholar]
  34. Chen, W.Y.; Wang, C.; Su, Y. Urban Forest Planning and Policy in China. In Green Infrastructure in Chinese Cities; Springer: Berlin/Heidelberg, Germany, 2022; pp. 55–68. [Google Scholar]
  35. Wan, L.; Ye, X.; Lee, J.; Lu, X.; Zheng, L.; Wu, K. Effects of urbanization on ecosystem service values in a mineral resource-based city. Habitat Int. 2015, 46, 54–63. [Google Scholar] [CrossRef]
  36. Zhang, J.; Ge, Y. Comparative study on spatial distributions and influencing factors of national forest cities and national garden cities. J. Nanjing For. Univ. 2022, 46, 41. [Google Scholar]
  37. Chen, B.; Wu, S.; Song, Y.; Webster, C.; Xu, B.; Gong, P. Contrasting inequality in human exposure to greenspace between cities of Global North and Global South. Nat. Commun. 2022, 13, 4636. [Google Scholar] [CrossRef] [PubMed]
  38. Chen, Y.; Yue, W.; La Rosa, D. Which communities have better accessibility to green space? An investigation into environmental inequality using big data. Landsc. Urban Plan. 2020, 204, 103919. [Google Scholar] [CrossRef]
  39. Zhou, N.; He, G.; Williams, C.; Fridley, D. ELITE cities: A low-carbon eco-city evaluation tool for China. Ecol. Indic. 2015, 48, 448–456. [Google Scholar] [CrossRef]
  40. Zhao, J.-W.; Peng, F.-L.; Wang, T.-Q.; Zhang, X.-Y.; Jiang, B.-N. Advances in master planning of urban underground space (UUS) in China. Tunn. Undergr. Space Technol. 2016, 55, 290–307. [Google Scholar] [CrossRef]
  41. Shao, F.; Xie, X. The master planning and construction plan of forest cities based on low carbon effect. Appl. Ecol. Environ. Res. 2019, 17, 9401–9410. [Google Scholar] [CrossRef]
  42. Duan, Q.; Tan, M.; Guo, Y.; Wang, X.; Xin, L. Understanding the spatial distribution of urban forests in China using Sentinel-2 images with Google Earth Engine. Forests 2019, 10, 729. [Google Scholar] [CrossRef]
  43. Zhu, Z.; Lang, W.; Tao, X.; Feng, J.; Liu, K. Exploring the quality of urban green spaces based on urban Neighborhood Green Index—A case study of Guangzhou City. Sustainability 2019, 11, 5507. [Google Scholar] [CrossRef]
  44. Fan, P.; Xu, L.; Yue, W.; Chen, J. Accessibility of public urban green space in an urban periphery: The case of Shanghai. Landsc. Urban Plan. 2017, 165, 177–192. [Google Scholar] [CrossRef]
  45. Chen, B.; Qi, X.; Qiu, Z. Recreational use of urban forest parks: A case study in Fuzhou National Forest Park, China. J. For. Res. 2018, 23, 183–189. [Google Scholar] [CrossRef]
  46. Chen, J. The Sustainable Development of Urban Forestry in Guangdong’s Urbanization. In China’s Economic Powerhouse: Reform in Guangdong Province; Springer: Berlin/Heidelberg, Germany, 2003; pp. 20–33. [Google Scholar]
  47. Qing, Z.; Chi, Z.; Rouxuan, H.; Dongxian, X.; Wanhui, Q.; Yuhan, W.; Honghui, T. Characteristics of the three-dimensional green quantity and recreation space for landscape-recreational forests in Zhuhai City. J. Zhejiang AF Univ. 2021, 38, 534–540. [Google Scholar]
  48. Li, Y.; Wang, G.; Chen, T.; Zhang, R.; Zhou, L.; Yan, L. Nature-Based Solutions in “Forest–Wetland” Spatial Planning Strategies to Promote Sustainable City Development in Tianjin, China. Land 2022, 11, 1227. [Google Scholar] [CrossRef]
  49. Duan, Q.; Tan, M. Using a geographical detector to identify the key factors that influence urban forest spatial differences within China. Urban For. Urban Green. 2020, 49, 126623. [Google Scholar] [CrossRef]
  50. He, W.; Cheng, Y.; Lin, Y.; Zhang, H. Microeconomic effects of designating National Forest Cities: Evidence from China’s publicly traded manufacturing companies. For. Policy Econ. 2022, 136, 102669. [Google Scholar] [CrossRef]
  51. Zhang, L.; Tan, P.Y. Associations between urban green spaces and health are dependent on the analytical scale and how urban green spaces are measured. Int. J. Environ. Res. Public Health 2019, 16, 578. [Google Scholar] [CrossRef] [PubMed]
  52. Liu, G.; Wei, L.; Gu, J.; Zhou, T.; Liu, Y. Benefit distribution in urban renewal from the perspectives of efficiency and fairness: A game theoretical model and the government’s role in China. Cities 2020, 96, 102422. [Google Scholar] [CrossRef]
  53. Goodman, D. The Forest City: Homeownership and new wealth in Shenyang. In The New Rich in China; Routledge: Oxfordshire, UK, 2008; pp. 185–200. [Google Scholar]
  54. Liu, C.; Li, X. Carbon storage and sequestration by urban forests in Shenyang, China. Urban For. Urban Green. 2012, 11, 121–128. [Google Scholar] [CrossRef]
  55. He, D.; Chen, K.; Zhang, T.; Yin, M.; Shi, X.; Xu, Z. Regional CO2 budget and abatement countermeasures for forest scenic spots: A case study of the Shenyang national forest park. Sustainability 2021, 13, 861. [Google Scholar] [CrossRef]
  56. Guo, S. Virtual Land Use in China over Time and Space. Ph.D. Thesis, The Hong Kong Polytechnic University, Hong Kong, China, 2017. [Google Scholar]
  57. Liao, L.; Zhao, C.; Li, X.; Qin, J. Towards low carbon development: The role of forest city constructions in China. Ecol. Indic. 2021, 131, 108199. [Google Scholar] [CrossRef]
  58. Li, L. Building the Rule of Law in China; Elsevier: Amsterdam, The Netherlands, 2017. [Google Scholar]
  59. Liu, Y.; Zhou, Y. Territory spatial planning and national governance system in China. Land Use Policy 2021, 102, 105288. [Google Scholar] [CrossRef]
  60. Feng, F.; Yang, X.; Jia, B.; Li, X.; Li, X.; Xu, C.; Wang, K. Variability of urban fractional vegetation cover and its driving factors in 328 cities in China. Sci. China Earth Sci. 2024, 67, 466–482. [Google Scholar] [CrossRef]
  61. Liu, C. The Selection of a Path and the Focus of Policies for the Innovation and Transformation of Resource-Based Cities in China. In Studies on China’s Special Economic Zones 5; Springer: Berlin/Heidelberg, Germany, 2023; pp. 165–179. [Google Scholar]
  62. Ren, K.; Sun, X.; Cenci, J.; Zhang, J. Assessment of Public Open Space Research Hotspots, Vitalities, and Outlook using Citespace. J. Asian Archit. Build. Eng. 2023, 22, 3799–3817. [Google Scholar] [CrossRef]
  63. Yu, Y.; Hamnett, C.; Ye, Y.; Guo, W. Top-down intergovernmental relations and power-building from below in China’s urban redevelopment: An urban political order perspective. Land Use Policy 2021, 109, 105633. [Google Scholar] [CrossRef]
  64. de Sousa Silva, C.; Viegas, I.; Panagopoulos, Τ.; Bell, S. Environmental justice in accessibility to green infrastructure in two European cities. Land 2018, 7, 134. [Google Scholar] [CrossRef]
  65. Vargas-Hernández, J.G.; Zdunek-Wielgołaska, J.A.; Pallaggst, K. The Role of Urban Green Spaces in the Transformation of Community Ecosystem in Developing Countries. In Optimizing Regional Development Through Transformative Urbanization; IGI Global: Hershey, PN, USA, 2019; pp. 204–224. [Google Scholar]
  66. Wei, Y.D.; Fan, C.C. Regional inequality in China: A case study of Jiangsu province. Prof. Geogr. 2000, 52, 455–469. [Google Scholar] [CrossRef]
  67. Zhang, J.; Cenci, J.; Becue, V.; Koutra, S. Analysis of spatial structure and influencing factors of the distribution of national industrial heritage sites in China based on mathematical calculations. Environ. Sci. Pollut. Res. 2022, 29, 46721–46736. [Google Scholar] [CrossRef] [PubMed]
  68. Huang, C.; Yang, J.; Clinton, N.; Yu, L.; Huang, H.; Dronova, I.; Jin, J. Mapping the maximum extents of urban green spaces in 1039 cities using dense satellite images. Environ. Res. Lett. 2021, 16, 064072. [Google Scholar] [CrossRef]
  69. Almohamad, H.; Knaack, A.L.; Habib, B.M. Assessing spatial equity and accessibility of public green spaces in Aleppo City, Syria. Forests 2018, 9, 706. [Google Scholar] [CrossRef]
  70. Zhan, Z.; Cenci, J.; Zhang, J. Frontier of Rural Revitalization in China: A Spatial Analysis of National Rural Tourist Towns. Land 2022, 11, 812. [Google Scholar] [CrossRef]
  71. Belcher, C.; Brown, I.; Clay, G.; Doerr, S.; Elliott, A.; Gazzard, R.; Kettridge, N.; Morison, J.; Perry, M.; Santin, C. UK Wildfires and Their Climate Challenges: Expert Led Report Prepared for the Third Climate Change Risk Assessment; The University of Manchester: Manchester, UK, 2021. [Google Scholar]
  72. Xie, Z.; Yan, J. Detecting traffic accident clusters with network kernel density estimation and local spatial statistics: An integrated approach. J. Transp. Geogr. 2013, 31, 64–71. [Google Scholar] [CrossRef]
  73. Xie, Y.; Meng, X.; Cenci, J.; Zhang, J. Spatial pattern and formation mechanism of rural tourism resources in China: Evidence from 1470 national leisure villages. ISPRS Int. J. Geo-Inf. 2022, 11, 455. [Google Scholar] [CrossRef]
  74. Puth, M.-T.; Neuhäuser, M.; Ruxton, G.D. Effective use of Pearson’s product–moment correlation coefficient. Anim. Behav. 2014, 93, 183–189. [Google Scholar] [CrossRef]
  75. Kim, Y.; Gray, S.J. Strategic factors influencing international human resource management practices: An empirical study of Australian multinational corporations. Int. J. Hum. Resour. Manag. 2005, 16, 809–830. [Google Scholar] [CrossRef]
  76. Jia, W.-J.; Wang, M.-F.; Zhou, C.-H.; Yang, Q.-H. Analysis of the spatial association of geographical detector-based landslides and environmental factors in the southeastern Tibetan Plateau, China. PLoS ONE 2021, 16, e0251776. [Google Scholar] [CrossRef]
  77. Labib, S.; Lindley, S.; Huck, J.J. Spatial dimensions of the influence of urban green-blue spaces on human health: A systematic review. Environ. Res. 2020, 180, 108869. [Google Scholar] [CrossRef] [PubMed]
  78. Li, X.; Ma, X.; Hu, Z.; Li, S. Investigation of urban green space equity at the city level and relevant strategies for improving the provisioning in China. Land Use Policy 2021, 101, 105144. [Google Scholar] [CrossRef]
  79. Huang, Y.; Lin, T.; Xue, X.; Zhang, G.; Liu, Y.; Zeng, Z.; Zhang, J.; Sui, J. Spatial patterns and inequity of urban green space supply in China. Ecol. Indic. 2021, 132, 108275. [Google Scholar] [CrossRef]
  80. Rogers, S.R.; Staub, B. Standard use of Geographic Information System (GIS) techniques in honey bee research. J. Apic. Res. 2013, 52, 1–48. [Google Scholar] [CrossRef]
  81. Zhang, J.; Cenci, J.; Becue, V.; Koutra, S. Research of the industrial heritage category and spatial density distribution in the Walloon region, Belgium, and Northeast China. In Structural Studies, Repairs and Maintenance of Heritage Architecture XVII & Earthquake Resistant Engineering Structures XIII; WIT Press: Southampton, UK, 2021; 285p. [Google Scholar]
  82. Oyana, T.J. Spatial Analysis with R: Statistics, Visualization, and Computational Methods; CRC Press: Boca Raton, FL, USA, 2020. [Google Scholar]
  83. Liu, J.; Gong, C.; Wang, S.; Wang, L.; Tan, C.; Wen, L.; Lu, H. Spatial differentiation of soil nutrients and their ecological chemometrics based on geographic detector in National Agricultural Park of Tangchang, Southwest China. PLoS ONE 2024, 19, e0294568. [Google Scholar] [CrossRef]
  84. Hao, Y.; Niu, X.; Wang, J. Impacts of haze pollution on China’s tourism industry: A system of economic loss analysis. J. Environ. Manag. 2021, 295, 113051. [Google Scholar] [CrossRef]
  85. Chen, J.; Kinoshita, T.; Li, H.; Luo, S.; Su, D. Which green is more equitable? A study of urban green space equity based on morphological spatial patterns. Urban For. Urban Green. 2024, 91, 128178. [Google Scholar] [CrossRef]
  86. Xiong, L.-Y.; Zhu, A.-X.; Zhang, L.; Tang, G.-A. Drainage basin object-based method for regional-scale landform classification: A case study of loess area in China. Phys. Geogr. 2018, 39, 523–541. [Google Scholar] [CrossRef]
  87. Xie, H.; Yang, C.; Liu, Y. Urban Ecological Culture Construction and the Formation of Residents’ Green Living: Evidence from National Forest City Construction in China. Sustainability 2023, 15, 13496. [Google Scholar] [CrossRef]
  88. Zhao, J.; Huang, S.; Huang, Q.; Wang, H.; Leng, G.; Fang, W. Time-lagged response of vegetation dynamics to climatic and teleconnection factors. Catena 2020, 189, 104474. [Google Scholar] [CrossRef]
  89. Qi, W.; Abel, G.J.; Liu, S. Geographic transformation of China’s internal population migration from 1995 to 2015: Insights from the migration centerline. Appl. Geogr. 2021, 135, 102564. [Google Scholar] [CrossRef]
  90. Rahman, M.S. Relationship among GDP, per capita GDP, literacy rate and unemployment rate. Br. J. Arts Soc. Sci. 2013, 14, 169–177. [Google Scholar]
  91. Bullard, R.D. Growing Smarter: Achieving Livable Communities, Environmental Justice, and Regional Equity; MIT Press: Cambridge, MA, USA, 2007. [Google Scholar]
Figure 1. The development period and related events of NFCCs.
Forests 15 00608 g001
Figure 2. Evolution of the NFCC evaluation system.
Forests 15 00608 g002
Figure 3. Number of NFCCs by time batch to date.
Forests 15 00608 g003
Figure 4. Flowchart of the study’s logic.
Forests 15 00608 g004
Figure 5. Spatial distribution of NFCCs.
Forests 15 00608 g005
Figure 6. Spatial distribution of NFCCs in terms of geographical divisions.
Forests 15 00608 g006
Figure 7. The Lorenz curves of the administrative areas’ NFCC distributions.
Forests 15 00608 g007
Figure 8. NFCC kernel densitometry (KDE) results.
Forests 15 00608 g008
Figure 9. The spatial distribution of NFCCs with topographic and elevation factors superimposed on the image.
Forests 15 00608 g009
Figure 10. The spatial distribution of NFCCs with climatic zone factors superimposed on the image.
Forests 15 00608 g010
Figure 11. The spatial distribution of NFCCs with population density factors superimposed on the image.
Forests 15 00608 g011
Figure 12. A scatter plot of each province’s national forest parks and NFCCs, produced by SPSS.
Forests 15 00608 g012
Figure 13. A scatter plot created using SPSS that compares the number of cities to the number of NFCCs.
Forests 15 00608 g013
Figure 14. Urban agglomeration characteristics overlaid on top of the NFCC geographical distribution.
Forests 15 00608 g014
Table 1. Evolution of the concept of an urban forest.
PublisherYearArea of AffiliationConnotation
John F. Kennedy administration1962U.S.In a survey of outdoor recreation resources, the term “urban forest” is used for the first time to link the seemingly contradictory factors of city and forest together.
Gene W. Grey1978U.S.Urban forests include street trees, parks, neighbourhood parks, and all trees in residential areas, all an important part of the urban environment.
Robert W. Miller1980U.S.Forest cities should be the sum of all vegetation in densely populated areas and around the city, covering many areas including suburbs and metropolitan areas.
Paul H. Gobster1994U.S.Urban forests are defined as all woody plants and their associated plants in cities and around densely populated areas, being the sum of a series of block stands.
Andrea L. Flack1996DEThe concept of an urban forest in a broad sense is put forward. An urban forest includes all the forests in and around a city.
Table 2. NFCC spatial distribution computed using the index.
NoOperationIndex
1Nearest neighbourR = 0.728825
2Geographic concentrationG = 22.67066967
3ImbalanceS = 0.389480805
4Kernel density estimation0.15~1.80
Table 3. Regional distribution number statistics of NFCCs.
NoAdministrative RegionNFCC AmountPercentage/%Total Percentage/%
1Shandong18.008.228.22
2Zhejiang18.008.2216.44
3Henan17.007.7624.20
4Guangdong14.006.3930.59
5Jiangxi13.005.9436.53
6Sichuan12.005.4842.01
7Anhui12.005.4847.49
8Hubei11.005.0252.51
9Guangxi10.004.5757.08
10Fujian10.004.5761.64
11Jiangsu9.004.1165.75
12Hebei9.004.1169.86
13Shaanxi8.003.6573.52
14Liaoning8.003.6577.17
15Hunan8.003.6580.82
16Beijing7.003.2084.02
17Yunnan6.002.7486.76
18Chongqing6.002.7489.50
19Inner Mongolia5.002.2891.78
20Guizhou5.002.2894.06
21Jilin4.001.8395.89
22Xinjiang2.000.9196.80
23Shanxi2.000.9197.72
24Tibet1.000.4698.17
25Qinghai1.000.4698.63
26Ningxia1.000.4699.09
27Heilongjiang1.000.4699.54
28Gansu1.000.46100.00
29Tianjin0.000.00100.00
30Shanghai0.000.00100.00
31Macao0.000.00100.00
32Hong Kong0.000.00100.00
33Hainan0.000.00100.00
34Taiwan (R.O.C.)0.000.00100.00
Table 4. Data displaying the distribution of NFCCs throughout the seven regions of China.
Division of AdministrationQuantityPercentage/%Total Percentage/%
East8036.53%36.53%
Central3616.44%52.97%
Southwest3013.70%66.67%
South2410.96%77.63%
North2310.50%88.13%
Northwest135.94%94.06%
Northeast135.94%100.00%
Table 5. Data regarding the administrative regional distribution of NFCCs.
Classification of DensityQuantityRegion of AdministrationZone of Kernel Density
Core-density18Zhejiang *1.40–1.80
13Jiangxi1.00–1.40
10Fujian1.00–1.40
18Shandong *1.40–1.80
9Jiangsu1.00–1.40
12Anhui1.00–1.40
17Henan *1.40–1.80
2Shanxi1.00–1.40
High-density7Beijing *1.00–1.40
9Hebei0.60–1.00
14Guangdong *1.00–1.40
6Chongqing *1.00–1.40
12Sichuan0.60–1.00
5Guizhou0.60–1.00
Medium-density8Hunan0.60–1.00
10Guangxi0.60–1.00
11Hubei0.60–1.00
8Liaoning0.60–1.00
Low-density8Shaanxi0.15–0.60
6Yunnan0.15–0.60
5Inner Mongolia0.15–0.60
4Jilin0.15–0.60
1Heilongjiang0.15–0.60
1Gansu0.15–0.60
1Qinghai0.15–0.60
1Ningxia0.15–0.60
2Xinjiang0.15–0.60
1Tibet0.15–0.60
* Symbolises the centre of the zone.
Table 6. GDP per capita and NLGCC share by province in 2021.
Region of AdministrationGDP per Capita (CNY)The Percentage of NFCC (%)
Shandong85,97337.50%
Zhejiang118,83051.43%
Henan62,07144.74%
Guangdong101,79625.93%
Jiangxi71,00965.00%
Sichuan67,78538.71%
Anhui73,68754.55%
Hubei92,17030.56%
Guangxi52,21552.63%
Fujian126,84543.48%
Jiangsu144,47545.00%
Hebei56,88826.47%
Shaanxi82,88561.54%
Liaoning68,51525.81%
Hunan73,49827.59%
Beijing190,091700.00%
Yunnan61,73640.00%
Chongqing90,688600.00%
Inner Mongolia96,49626.32%
Guizhou52,34838.46%
Jilin55,03314.29%
Xinjiang68,52611.11%
Shanxi73,6869.09%
Tibet58,26914.29%
Qinghai60,77633.33%
Ningxia69,9254.55%
Heilongjiang50,8833.23%
Gansu44,9867.14%
Table 7. The selection of influencing factors.
Criterion LayerFactor Layer
T1: EcotopeX1: Forestry area
X2: Urban green space
X3: Park green area
X4: Number of parks
X5: Park area
X6: Green coverage rate of built-up area
X7: Forest coverage rate
X8: Number of national forest parks
X9: Number of national nature reserves
T2: Social economyX10: Density of population
X11: GDP per capita
X12: Residents’ consumption level
T3: Traffic factorX13: Rail mileage
X14: Highway mileage
T4: Cultural factorX15: Number of tourist attractions
X16: Gross tourism income
X17: Tourist arrivals
T5: Public healthX18: Air quality (PM2.5 concentration)
X19: Category A and B statutory reporting of infectious disease incidence
Table 8. The selection of influencing factors.
Factor Layerq Statistic
X1: Forestry area0.02
X2: Urban green space0.62
X3: Park green area0.56
X4: Number of parks0.62
X5: Park area0.48
X6: Green coverage rate of built-up area0.32
X7: Forest coverage rate0.43
X8: Number of national forest parks0.52
X9: Number of national nature reserves0.09
X10: Density of population0.63
X11: GDP per capita0.21
X12: Residents’ consumption level0.35
X13: Rail mileage0.12
X14: Highway mileage0.26
X15: Number of tourist attractions0.56
X16: Gross tourism income0.53
X17: Tourist arrivals0.36
X18: Air quality (PM2.5 concentration)0.23
X19: Category A and B statutory reporting of infectious disease incidence0.28
Disclaimer/Publisher’s Note: The statements, opinions and data contained in all publications are solely those of the individual author(s) and contributor(s) and not of MDPI and/or the editor(s). MDPI and/or the editor(s) disclaim responsibility for any injury to people or property resulting from any ideas, methods, instructions or products referred to in the content.

