Article

Emerging Microplastics Alter the Influences of Soil Animals on the Fungal Community Structure in Determining the Litter Decomposition of a Deciduous Tree

1
Henan Field Observation and Research Station of Headwork Wetland Ecosystem of the Central Route of South-to-North Water Diversion Project, School of Life Sciences and Agricultural Engineering, Nanyang Normal University, Nanyang 473061, China
2
Department of Botany and Plant Sciences, University of California, Riverside, CA 92521, USA
3
Henan International Joint Laboratory of Watershed Ecological Security in the Water Source Area of the Middle Route of South-to-North Water Diversion Project, Nanyang 473061, China
*
Author to whom correspondence should be addressed.
Forests 2024, 15(3), 488; https://doi.org/10.3390/f15030488
Submission received: 31 January 2024 / Revised: 24 February 2024 / Accepted: 1 March 2024 / Published: 6 March 2024
(This article belongs to the Special Issue The Relationship between Tree Litter Decomposition and Global Change)

Abstract

:
Microplastics enter forest ecosystems in a variety of ways, including through atmospheric deposition, anthropogenic waste, and leaching. There is growing evidence of the ecotoxicity of microplastics to soil decomposers. Soil animals and microorganisms are the main decomposers of plant litter, and their interactions play important roles in determining the terrestrial biochemical cycle. However, how emerging microplastics in forests affect the influence of soil animals on the fungal community in decomposed litter is still unclear. Here, by constructing a rigorous mesocosm experiment, we investigated soil enzyme activities and the variation in fungal community characteristics in the leaf litter of a deciduous tree, Lindera glauca, which was decomposed by contrasting decomposer structures (with or without soil animals) under different contamination conditions (with or without microplastic contamination), aiming to determine the impacts of these factors on litter decomposition. We found that soil animals can significantly depress the litter decomposition rate by reducing fungal diversity and largely changing the community structure in the litter. However, these critical changes caused by soil animals were inhibited in the mesocosms contaminated with high-density polyethylene microplastics (HDPE−MPs), during which soil animal activities were significantly reduced. These findings represent a step forward in illustrating the potential effect of emerging contamination stress on forest litter decomposition and biogeochemical cycles under global environmental change.

1. Introduction

In terrestrial ecosystems, plant residues inject a large amount of organic matter into the soil every year, initiating nutrient transfer among the soil “brown food webs”. Plant litter decomposition plays a crucial role in providing important ecosystems through the cycling of nutrients in forest ecosystems governed by soil decomposers [1]. Bacteria and fungi collectively constitute more than 90% of the soil microbial biomass and are the primary decomposers of litter [2]. Through a complex process of bio-decomposition, plant litter could be transferred or integrated into kinds of soil organic matter (SOM). The breakdown and circulation of SOMs, which are fundamental processes of nutrient cycling, are also conducted by soil microorganisms and fauna [3]. The activity of soil microorganisms is strongly affected by the soil fauna that live alongside them [4]. Soil animals usually interact with the soil microbial community (especially fungi) to regulate the procession of plant litter into soil organic matter (SOM) [5,6]. They can not only selectively consume fungi and other microbes to influence the biomass and activity of the microbial community but also ingest and mechanically fragment litter to increase the surface area available for microbial colonization and decomposition [7,8]. In addition, variations in soil fauna can affect microbial community structure [9]. To date, there has been no consensus on the influence of soil animals on litter mass loss through their influence of litter microbial community structure. Nevertheless, in the wake of human activities and worsening environmental pollution, microplastics (MPs, sizes with diameters less than 5 mm) can enter ecosystems via multiple pathways; in particular, forest ecosystems are easily overlooked. MPs are transported via runoff, atmospheric deposition, and plant canopy capture to the forest soil layer when litter falls [10,11]. To date, most related studies have focused on aquatic ecosystems, but studies of forest ecosystems have been limited [12]. Notably, the Lindera glauca plant’s leaves stand during autumn and winter and shed after the plants germinate new leaves in the spring, possibly enabling them to capture more MPs than other fallen leaves before they enter the soil. Moreover, after supplementing the soil with fresh litter in the following spring, the microplastics captured by the Lindera glauca litter canopy may further increase the burden on forest soil ecosystems. In particular, soil animals and microbes use leaf litter as a carbon source. Microplastic pollution may affect the conversion process of SOM by soil decomposers, especially litter decomposition in a deciduous forests system, but there is still a knowledge gap.
Recent studies have reported the ecotoxic effects of microplastics on soil microbes and various groups of soil fauna, such as earthworms and springtails [13,14], and these toxic effects could further impact the carbon cycle in forest ecosystems. This is because microplastics can change the composition of the fungal microbial community in soil; for example, polyethylene can alter the relative abundance of Basidiomycetes and Ascomycetes [15]. Moreover, fungi have been proven to dominate leaf litter decomposition and are more sensitive to soil environmental change than bacteria [16,17]. Interestingly, microplastics are proposed to constitute the “plastisphere” because they act as substrates for microbial colonization and enrichment, and the composition of the microbial community structure is different from that of the surrounding microbes [18,19] and may affect the decomposition of forest litter. In addition, previous studies have indicated that there is a strong interaction between MPs and soil animals [20]. Microplastics can be ingested and can induce toxic effects on soil animals such as earthworms by affecting their normal feeding activities and biomass [21]. For example, exposure to 0.1% w/w high-density polyethylene microplastics (HDPE−MPs) significantly decreased biomass and reproduction [22]. MPs may also affect the gut microbiome of earthworms and springtails [20,23], reduce the amount of soil microbes consumed, and slow animal activity, potentially affecting the ability of these organisms to regulate microbial community structure and further litter decomposition. In conclusion, several studies have demonstrated that MPs can inhibit soil animal growth and reproduction and negatively affect the diversity and community of decomposing fungi in plant litter. Although concerns about the potential impacts of MPs or soil animals on microbial community structure have long been known, the combined effects of MPs and soil animals on leaf litter decomposition and associated fungal communities in forest ecosystems remain difficult to predict. Therefore, because the interaction effect of microplastics and soil animals on litter community structure during litter decomposition remains unclear, this may hinder our ability to develop a theoretical understanding of the ecological risk of microplastic pollution in terrestrial biogeochemical cycling.
Although numerous studies have shown that microplastics negatively affect soil fauna, few studies have focused on how MPs affect forest litter decomposition processes mediated by soil decomposers. In this study, our aim was to assess whether microplastic pollution and soil animal disturbance conditions could modify the structure and function of Lindera glauca litter microbes. Specifically, through high-throughput sequencing, we studied the changes in the community structures of litter microbes in different mesocosms (with litter decomposition in mesocosms with or without MPs and in soil animals). We synthesized two hypotheses: (1) compared with soil microbial decomposition alone, the addition of soil animals (earthworms and springtails) may increase litter mass loss by increasing microbial alpha diversity and changing community composition; (2) because of the disturbance caused by HDPE−MPs on soil animal activity, the impact of soil animals on the community structure of litter fungi was reduced, and the litter mass loss was less than that without microplastic addition.

2. Materials and Methods

2.1. Sample Collection and Pretreatment

For this experiment, Lindera glauca litter was chosen as the decomposition species because it is one of the most important marcescences in temperate and subthermal deciduous forests. Litter and soil samples were collected from the Baotianman Nature Reserve, Neixiang County, Nanyang, China (111°47′~112°04′ E, 33°20′~33°36′ N). Lindera glauca litter was naturally air-dried and sterilized with γ-rays to eliminate the interference of phyllosphere microorganisms during the experiment. Eisenia foetida (soil macroanimals) and Folsomia candida (soil microanimals) were chosen as model species because they play important roles in litter decomposition and are naturally abundant in forest ecosystems [24,25]. The earthworms were purchased from Hunan Yiyang Dazu Biological Company (Yiyang, China) and preadapted for the experiment. Specifically, Eisenia foetida adults were rinsed with distilled water, subjected to a 24 h depuration period on culture dishes with moist paper towels, and allowed to acclimatize for 30 days in experimental soil before commencement. Folsomia candida was collected from the forest, cultivated, and propagated in the laboratory. High-density polyethylene microplastics (HDPE−MPs) have been established to be ecotoxic to soil animals such as earthworms [26]. As such, HDPE−MPs particles (Suzhou win before new material Co., Ltd., Suzhou, China) with a mean diameter of 100 mesh (ranging from 100 to 150 μm) were used as a microplastic addition treatment for this experiment.

2.2. Mesocosm Design and Setup

The type of soil was yellow cinnamon soil. The soil was retrieved from 5cm below the litter of Baotianman Nature Reserve Forest and naturally air-dried, sieved at 2 mm to eliminate visible impurities, and then mixed to uniformity. Determination of the initial pH and nutrient content (organic carbon, nitrogen, and phosphorus) of soil before mesocosm systems setup (Table 1) was undertaken. Every mesocosm was created using clean, opaque polypropylene pots (height = 10.0 cm; top diameter = 15.0 cm; bottom diameter = 8.5 cm, purchased from Nanyang Shierli River comprehensive market, Henan, China). Each mesocosm was filled with 400 g of pretreated air-dried soil. Half of the mesocosm soils were uniformly mixed with HDPE−MPs (1 g kg−1 dry soil, 0.1% w/w) [21]. The soil moisture in each mesocosm was maintained at approximately 60% water holding capacity (WHC). After 30 days of acclimatized culture in experimental soil, 32 adults Eisenia foetida were rinsed with distilled water and left to depurate for 24 h to remove the contents of their guts; then, we recorded their initial weights. Eisenia foetida (2 individuals for each mesocosm) and Folsomia candida (150 individuals for each mesocosm) were assigned to half of the mesocosms (with or without HDPE−MPs added) and stabilized for 7 days. Finally, 1 g of sterilized litter was buried 5 cm below the topsoil of each mesocosm and incubated for 90 days. Overall, 32 mesocosms were constructed and four treatments were included: L (litter), LH (litter + HDPE−MPs), LA (litter + soil animals), and LHA (litter + HDPE−MPs + soil animals), with eight replicates for each treatment. During the 90 days of cultivation, all mesocosms were kept under consistent hydrothermal conditions.

2.3. Experimental Sampling, Determination of Litter Mass Loss, Soil Extracellular Enzyme Activity, Soil Aggregates and Earthworms Weight Growth Rate

After three months of decomposition, the litter and its underlying soil samples were collected using sterile gloves and centrifuge tubes. The litter sample was taken out of each mesocosm and we removed the soil attached to the litter surface; then, 0.1–0.2 g of a wet-weight subsample of litter from each litter sample was preserved at −80 °C (recorded each subsample litter wet weight) for subsequent analysis of the microbial community. The remaining leaf litter samples were cleaned from debris using distilled water. The wet weight of the remaining litter from each mesocosm sample was recorded and cleaned with distilled water. Finally, rinsed litter was air-dried to record the dry weight. Hence, the ratio between each remaining dry litter weight and wet weight was used to determine the dry weight of each subsample at −80 °C. The sum of the dry weight of the subsample and the remaining sample is the final dry weight of litter. Litter mass loss was calculated as follows (Formula (1)):
M   % = ( M t M 0 ) / M 0 × 100 ,
where M represents litter mass loss, and M0 and Mt are the initial and final (after 90 days of decomposition) litter dry masses.
The soil sample is divided into two parts. Partial samples were stored at 4 °C in a refrigerator, after which the soil extracellular enzyme activity (correlated to soil carbon, nitrogen, and phosphorus cycle) was measured following the colorimetric method within 7 days. These include phenol peroxidase (Perox), cellobiohydrolase (CBH1), and β-1,4-xylosidase (BX) for carbon cycling; urease (Ure) for nitrogen cycling; and acid phosphatase (ACP) for phosphorus cycling [27] (see Appendix A for detailed assay procedures). The remaining soil was subsequently air-dried and used for the determination of soil aggregates. A column of four sieves was used to separate the soil aggregates: 2.00, 1.00, 0.25, 0.25, and less than 0.25 mm. Each treatment was repeated eight times, and the proportion of the weight of each level to the total dry weight (50 g) was calculated as the proportion of the aggregate of each level.
Earthworms (Eisenia foetida) were recovered from each mesocosm, rinsed with distilled water, and depurated for 24 h on petri a dish with wet tissue, and we recorded their final weight. Springtails (Folsomia candida) were used only as a soil micro-animal addition treatment, and their biomass was not measured. Earthworm activity was measured by the weight growth rate (W%) in each mesocosm (Formula (2)):
W % = ( W t W 0 ) / W 0 × 100
where W represents earthworms weight growth rate, and W0 and Wt are the initial and final (after 90 days incubation) earthworm weights.

2.4. Litter DNA Extraction and ITS rDNA Sequencing

Illumina MiSeq sequencing technology was used to evaluate changes in the fungal community structure associated with litter decomposition. Total genomic DNA was extracted from the litter samples using the CTAB method (Norbolide Technology Co., Ltd., Beijing, China) [28]. The ITS regions of the fungal IT rDNA genes were amplified using the specific primers ITS1-1F-F (5′-CTTGGTCATTTAGAGGAAGTAA-3′) and ITS1-1F-R (5′-GCTGCGTTCTTCATCGATGC-3′) with barcodes. PCR analysis was performed in the following sequence: 98 °C for 1 min; 30 cycles of denaturation at 98 °C for 10 s, annealing at 50 °C for 30 s, and elongation at 72 °C for 30 s; and a final extension at 72 °C for 5 min. The same volume of 1X TAE buffer (New England Biolabs, MA, USA) was mixed with the PCR products, and electrophoresis was performed on a 2% agarose gel (biowest, Spain) for detection. The PCR products were mixed in equal ratios. Then, the mixed PCR products were purified with universal DNA (TianGen, Beijing, China). Sequencing was conducted on an Illumina HiSeq platform 2500 platform (Illumina, Inc., San Diego, CA, USA). The QIIME2 feature-classifier plugin (https://qiime2.org/, Version 2023.7, USA) was subsequently used to align ASV sequences to a pretrained UNITE 99% database (trimmed to the region bound by the ITS1-1F-F/ITS1-1F-R primer pair) to generate the taxonomy Table [29]. Finally, the complete dataset was sent to the Sequence Read Archive (SRA) database of the National Center for Biotechnology Information (NCBI) under the submission number SUB14186102 for fungi.

2.5. Statistical Analysis

The statistical analysis was conducted in R version 4.3.2 (R Development Core Team, https://www.r-project.org). Shapiro–Wilk and Levene tests were performed on the data, and one-way ANOVA was used for significance testing among the various treatments for mass loss. Alpha diversity was calculated using the core-diversity plugin within QIIME2. For feature-level alpha diversity indices (Chao1, Simpson diversity, and Shannon diversity indices), the package “car” was used for the Mann–Whitney U test between groups. Using the Bray–Curtis distance algorithm for nonmetric multidimensional scaling (NMDS) to investigate microbial community dissimilarities between treatments, nonparametric multivariate analysis of variance (Permanova) was used to determine the significance of distances between groups, and the data were filtered out of ASVs, whose total abundance was lower than the threshold (20%). The package “vegan” was used for NMDS and Adonis. In addition, co-occurrence networks were constructed to compare the effects of all treatment groups on network stability within fungal communities by using the R package “igraph”. Spearman correlation was used to calculate the paired correlation between microbial ASVs, and Spearman’s correlations at r > 0.6 and p < 0.05 were used for network construction. The co-occurrence network was visualized using Gephi (version 0.9.2). Linear discriminant analysis (LDA) effect size (LEfSe) was used (the threshold of the logarithmic LDA score was set at 3.0) to identify soil fungal biomarkers in the community, and LDA and FUNGuild analyses were completed using Wekemo Bioincloud (https://www.bioincloud.tech, accessed on 1 December 2023). Random forest analysis was performed using the Biozeron Cloud Platform (http://www.cloud.biomicroclass.com/CloudPlatform, accessed on 14 December 2023) to identify key species that distinguish differences between two groups of samples.

3. Results

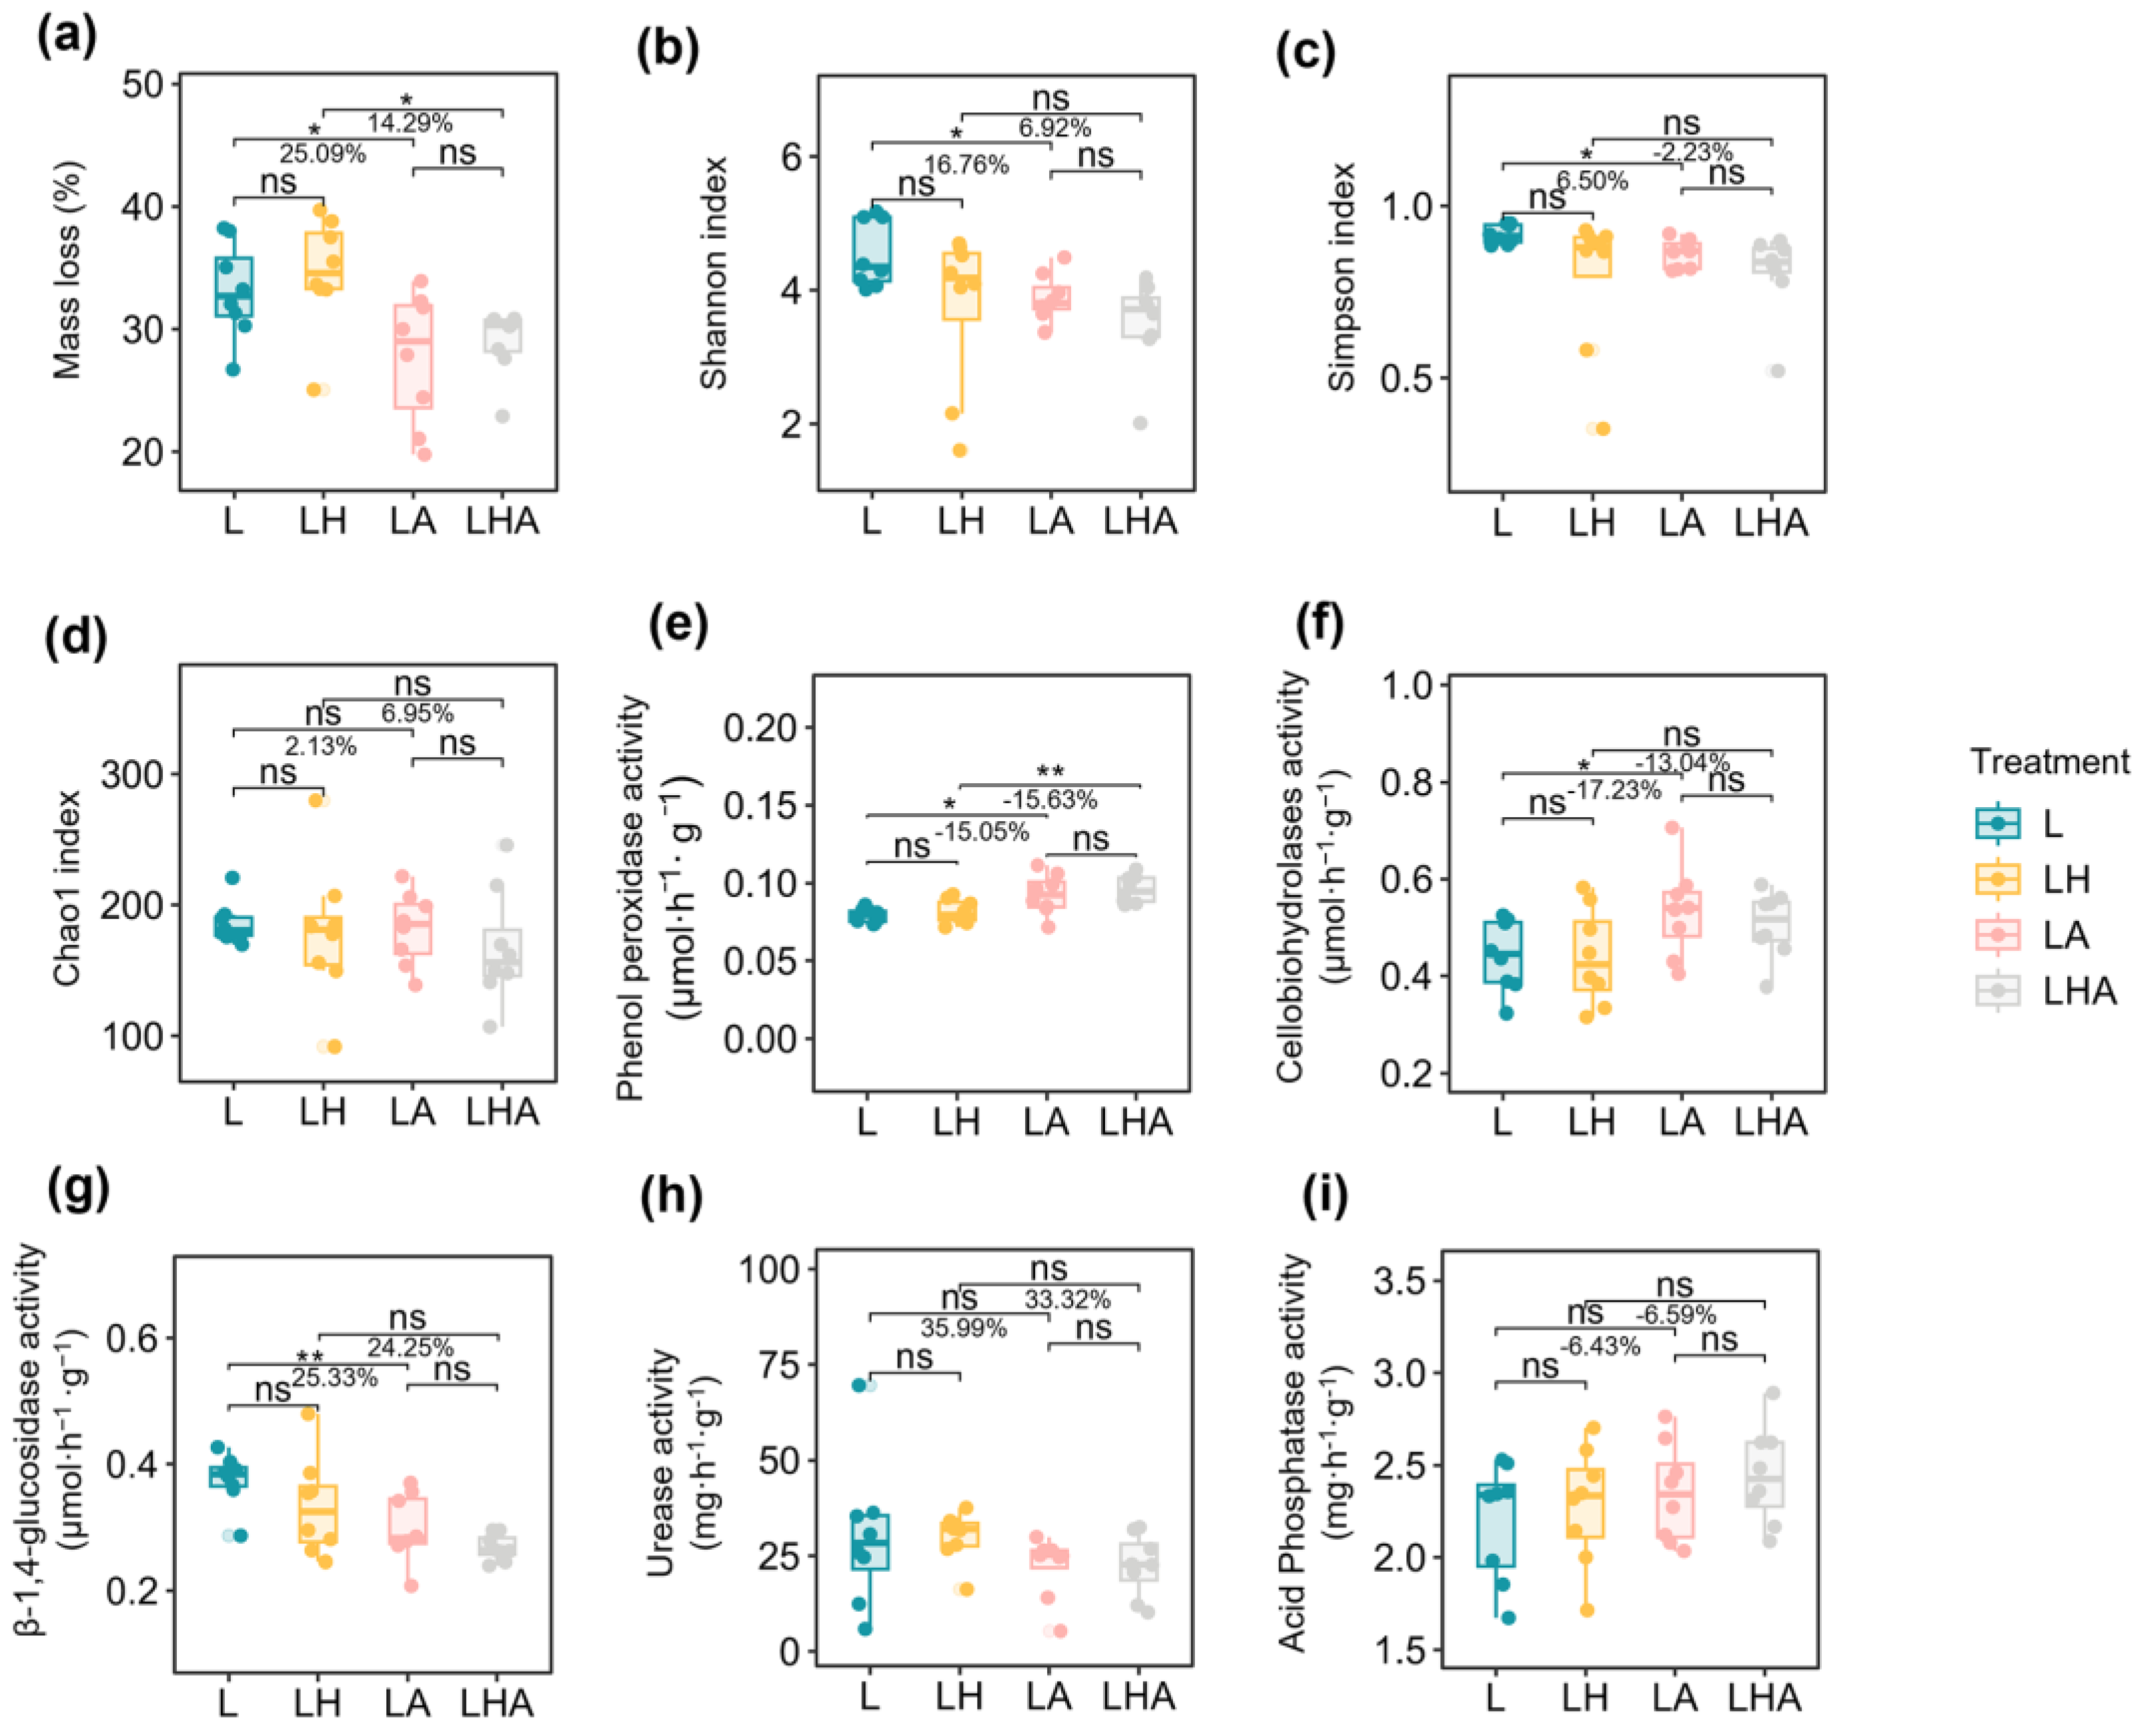
3.1. Litter Mass Loss

Overall, compared with only soil microbe decomposition (L; Figure 1a), soil animals significantly decreased the mass loss of Lindera glauca litter (LA; Figure 1a). Specifically, litter mass loss decreased by 25.09% (L vs. LA) and 14.29% (LH vs. LHA). These results indicated that soil animals could decrease the microbial decomposition of litter. Moreover, HDPE−MPs weakened the decreasing effect of soil animals on the microbial litter decomposition (L and LA vs. LH and LHA, 25.09% > 14.29%; Figure 1a). However, compared with only soil microbe decomposition (L; Figure 1a), HDPE−MPs decrease litter mass loss by 4.47% (L vs. LH), although this result was not statistically significant (p > 0.05). In addition, HDPE−MPs did not significantly affect litter mass loss with or without the addition of soil animals but compared with the effects of no HDPE−MPs, the addition of soil animals and HDPE−MPs (LHA) treatment increased litter mass loss by 4.55% (LA vs. LHA) (Figure 1a).

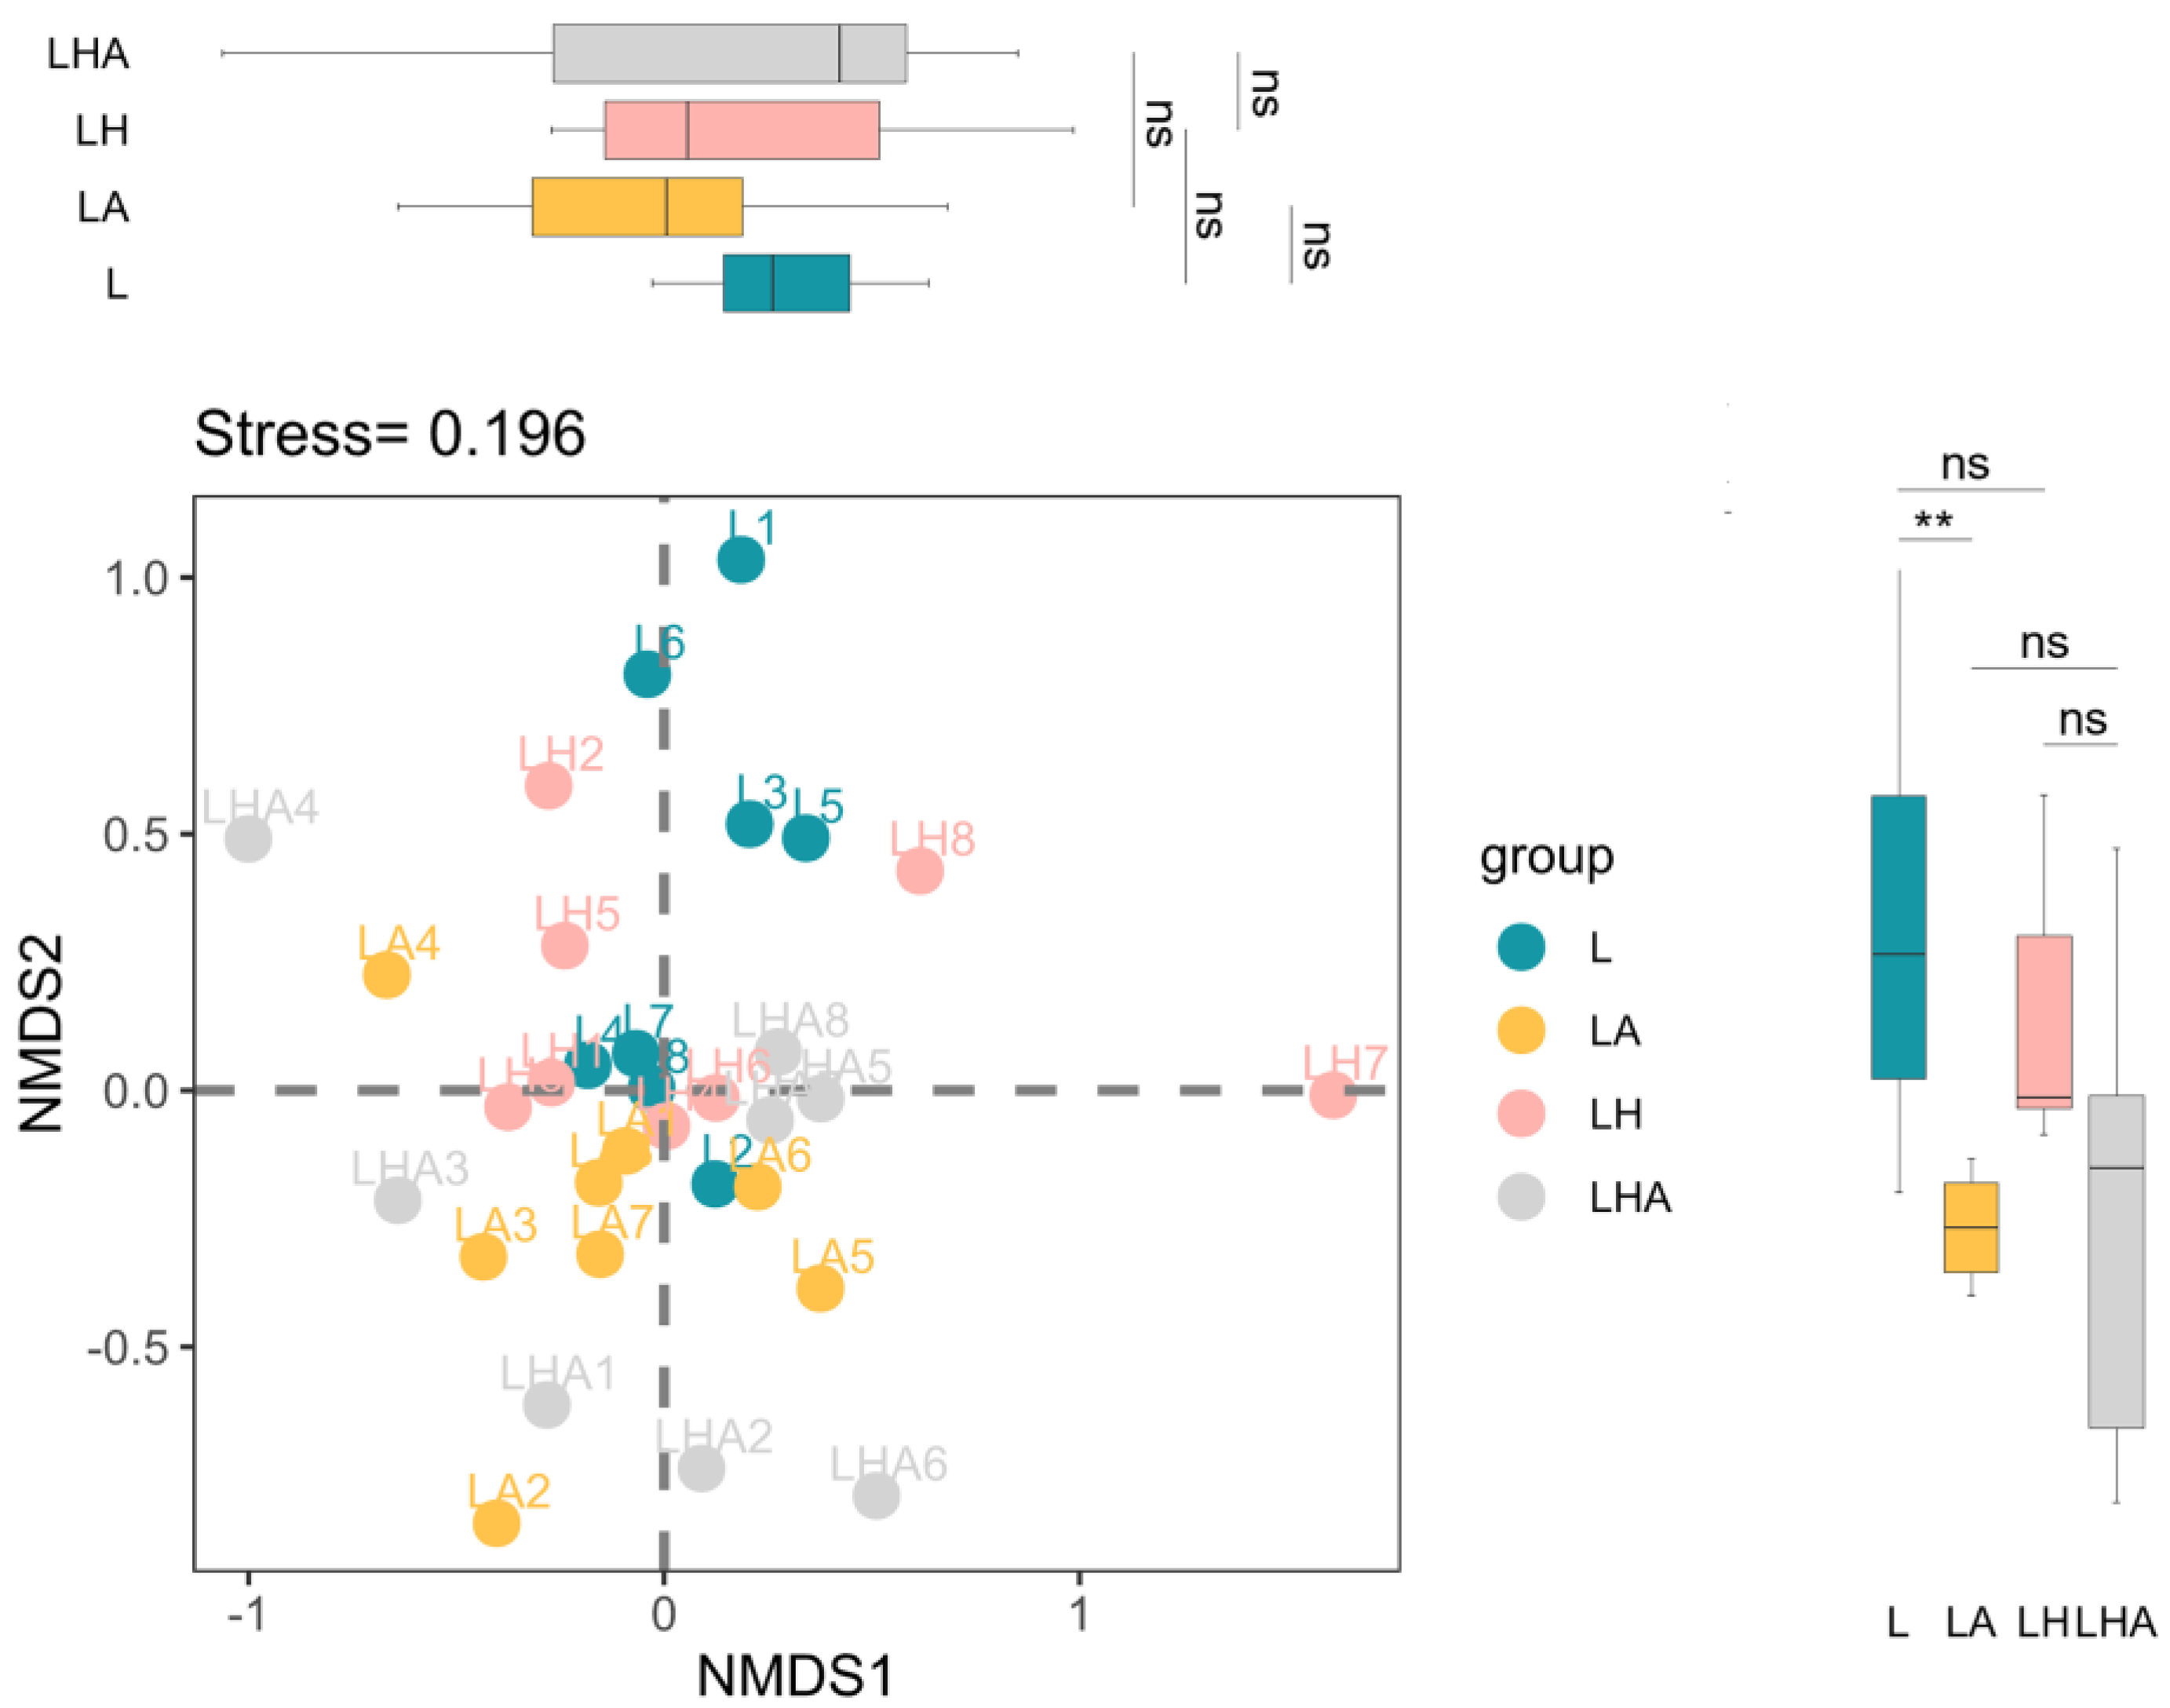
3.2. Litter Fungal α- and β-Diversities

Analysis of fungal α diversity showed that compared to litter with only soil microbe decomposition, soil animals significantly decreased the litter Shannon diversity index by 16.76% and the Simpson diversity index by 6.50% according to alpha diversity metrics (L vs. LA, p < 0.05; Figure 1b,c). The Chao1 index did not show significant differences, but it did decrease by 2.13% (L vs. LA, p > 0.05; Figure 1d). Compared to LH treatment, LHA treatment decreased the Shannon diversity index by 6.92% and the Chao1 index by 6.95% but increased the Simpson diversity index by 2.23%, indicating that HDPE−MPs alleviated the decrease in the Shannon, Simpson, and Chao1 diversity indices caused by soil animals (Figure 1b–d). Moreover, compared to litter decomposed with soil microbes, HDPE−MPs decreased the diversity of the fungal community (L vs. LH), although the results were not significantly different (p > 0.05).
Multidimensional scaling (NMDS) analysis revealed that the fungal communities from the L, LH, LA, and LHA treatments were not clearly separated, but PERMANOVA analysis indicated that the four treatments made marginally significant differences (p < 0.1) to community structure overall (Figure 2). In addition, the scores of only Group L and LA on the NMDS2 axis were significantly different (p < 0.05; Figure 2). Notably, pairwise grouped Adonis analysis indicated that the community structures of the L vs. LH, LH vs. LA, and LH vs. LHA groups were significantly different (p < 0.1; Table 2).

3.3. Differences in Soil Extracellular Enzyme Activities

After 90 days of incubation, compared with the soil microbial decomposition treatment alone, the soil-animal-only treatment increased the soil activities of Perox (15.05%), CBH1 (17.23%), and ACP (6.43%) and decreased the activities of BX (25.33%) and Ure (35.99%) (L vs. LA; Figure 1e–i). However, compared with those in the LH treatment, the soil activities of Perox (15.63%), CBH1 (13.04%), and ACP (6.59%) were greater, and the activities of BX (24.25%) and Ure (33.32%) were lower (LH vs. LHA; Figure 1e–i). Overall, with the addition of HDPE−MPs, the activity of Perox and ACP increased more than that without HDPE−MPs addition, and the activity of BX and Ure decreased less than that without HDPE−MPs addition (L and LA vs. LH and LHA; Figure 1e–i).

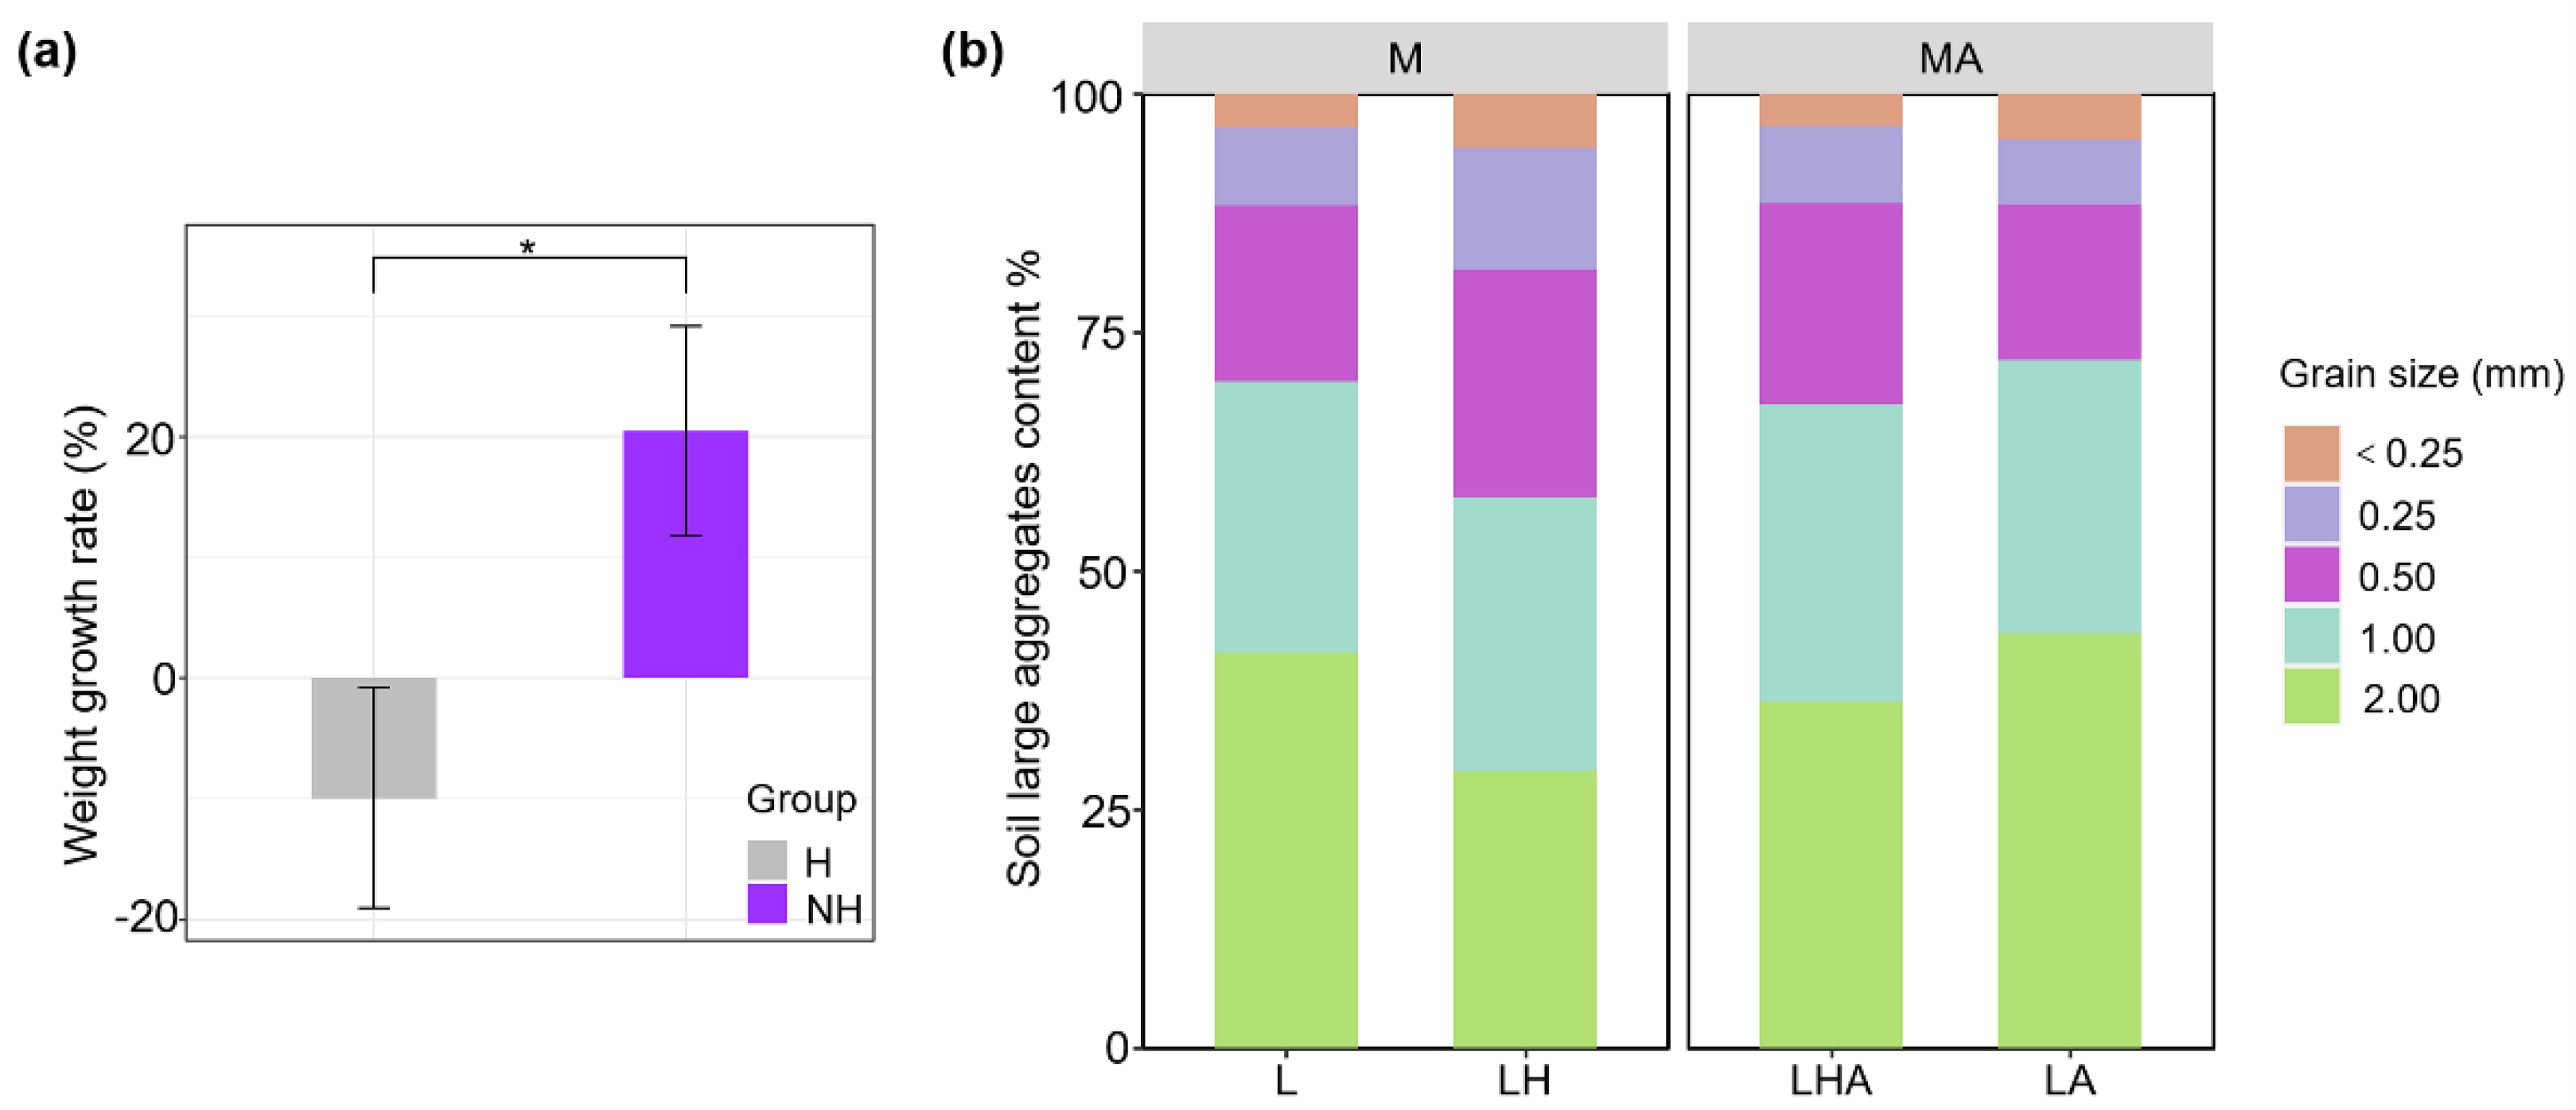
3.4. Earthworm Weight Growth Rate and Soil Aggregate Structure

After 90 days of incubation, earthworms in soil without the added HDPE−MPs gained weight, but those with the added HDPE−MPs lost weight (Figure 3a). Compared to those in the control treatment (L), the content of soil macroaggregates (above 2 mm) in the HDPE−MPs treatment was lower. After the addition of soil from animals, the soil macroaggregates in the LHA and LA treatments were significantly greater than those in the absence of soil from animals but reduced the 0.25–0.5 mm soil aggregate content (Figure 3b).

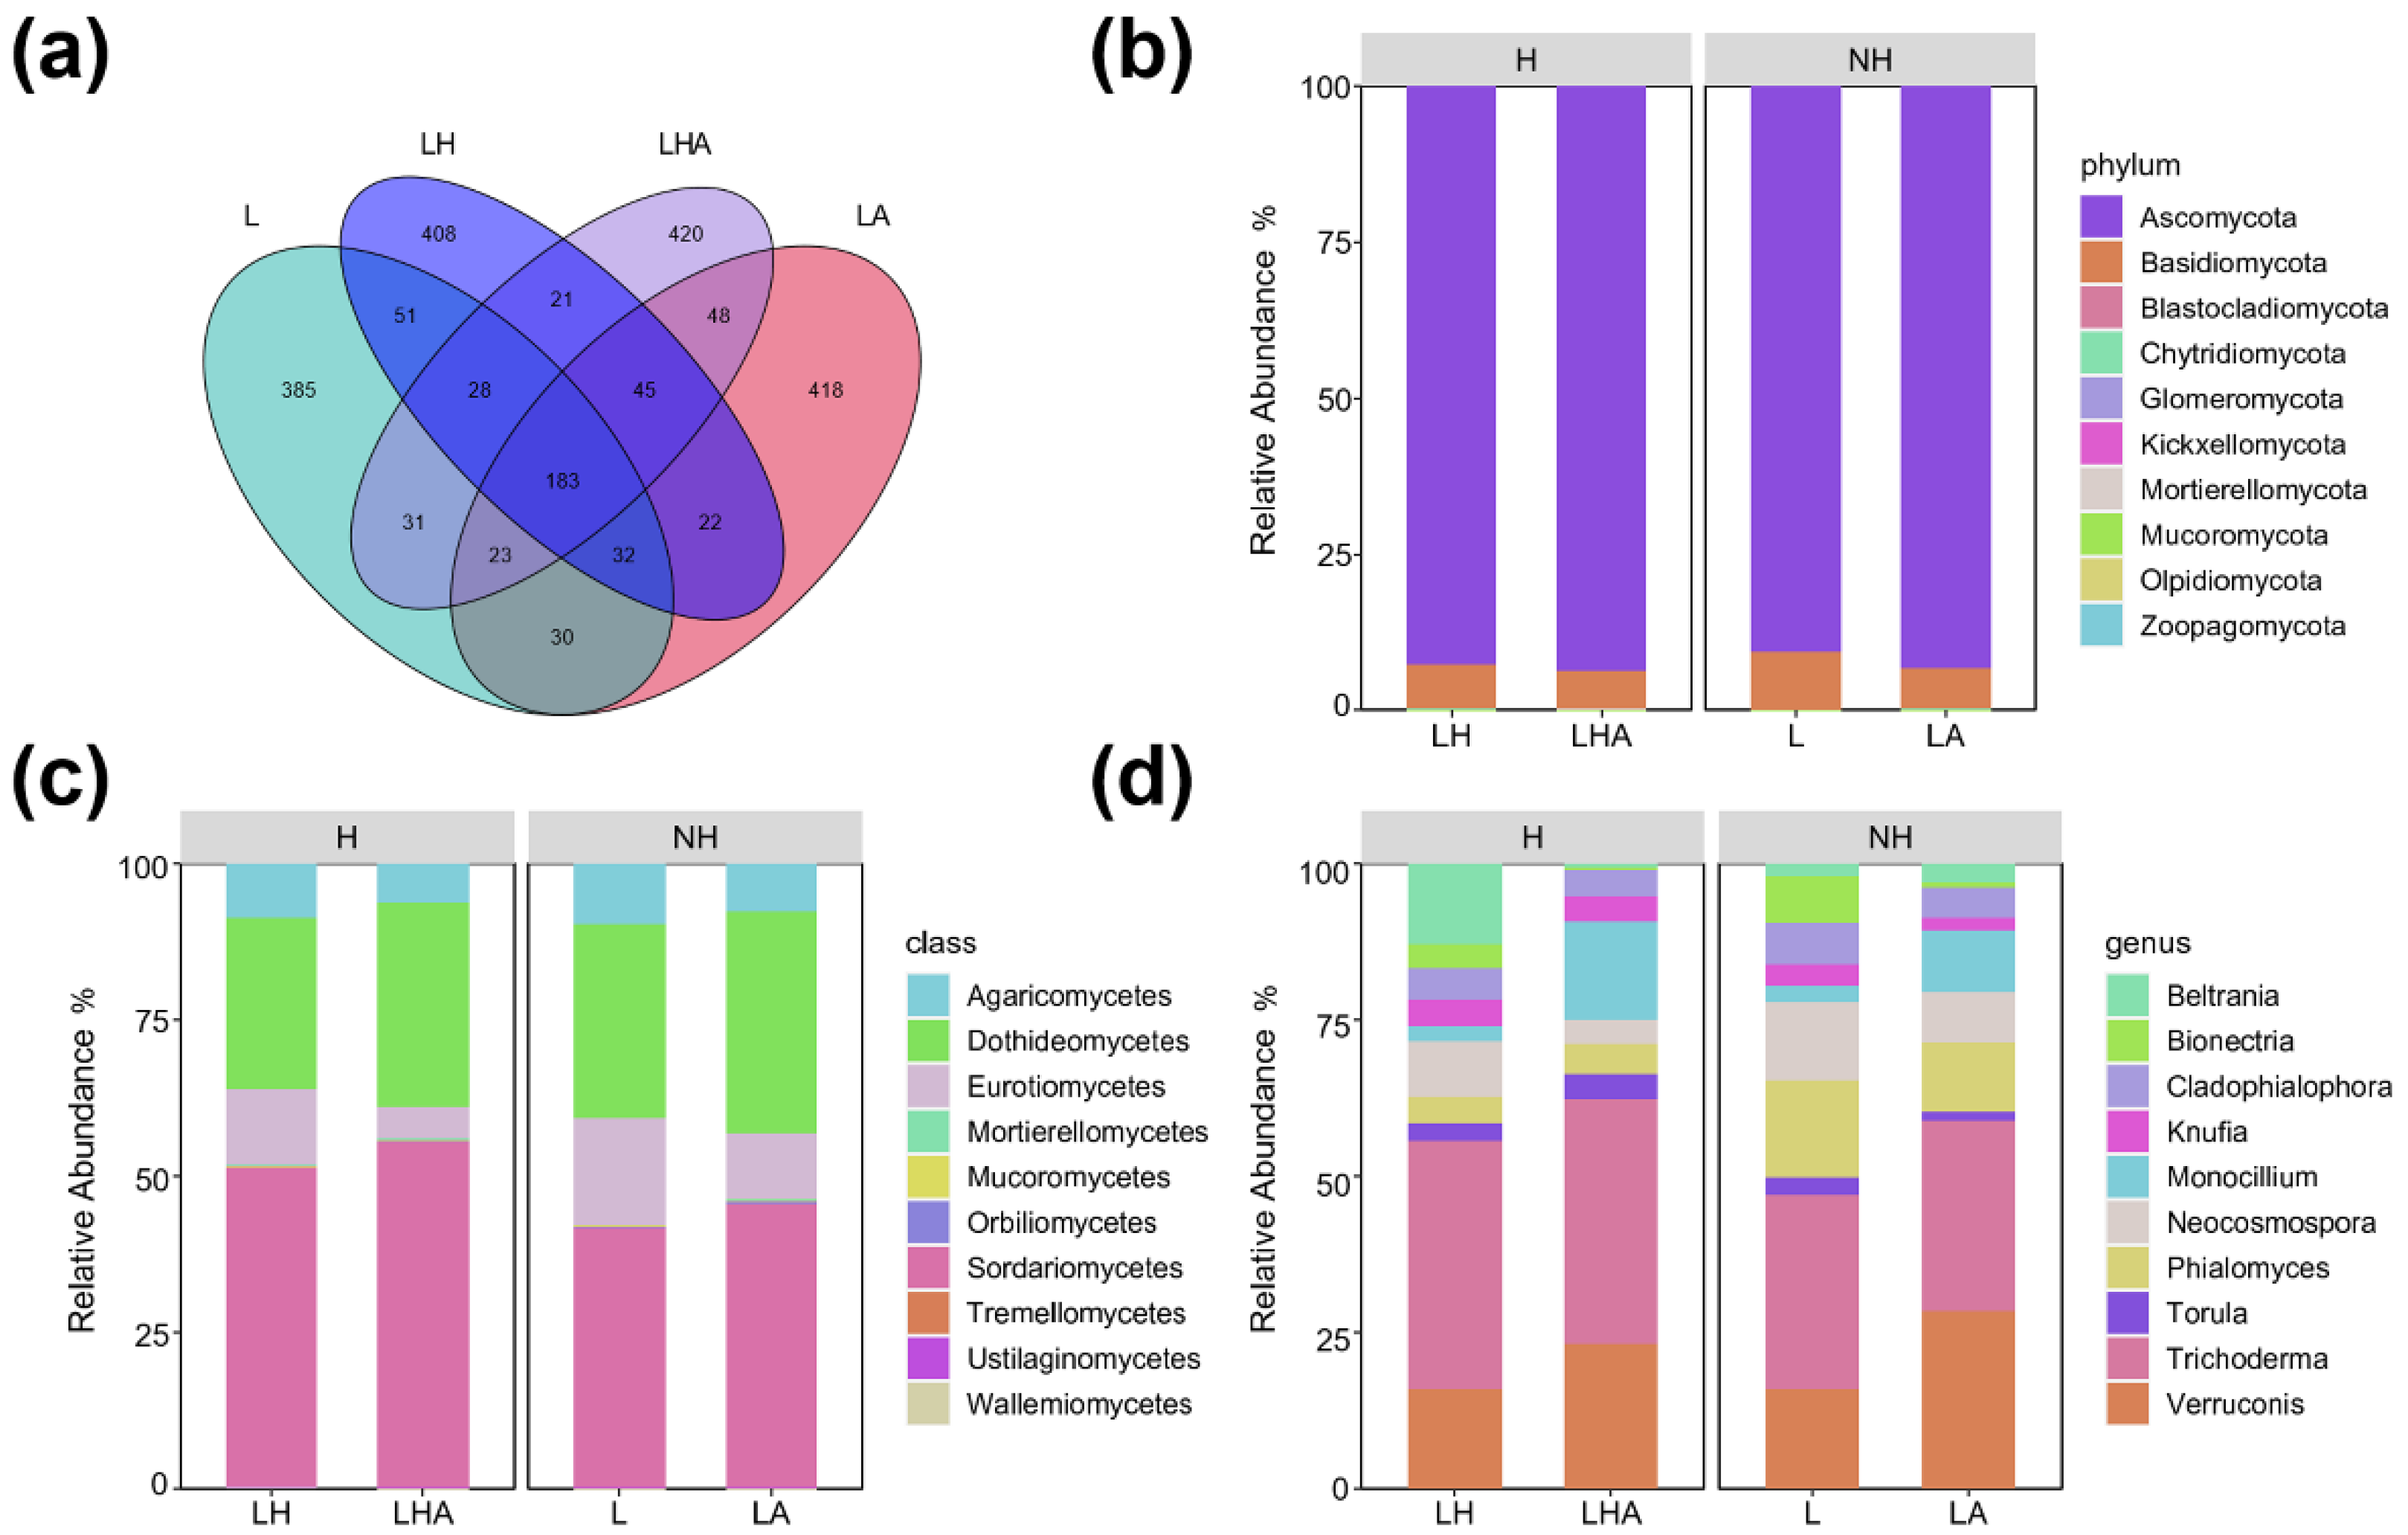
3.5. Litter Fungal Community Composition

In the fungal community, all the sequences were classified into fungal domains and assigned to 2145 ASVs across all the samples; these included 10 phyla, 33 classes, 71 orders, 144 families, 267 genera, and 356 species. A Venn diagram was constructed to show shared and typical ASVs between the different treatment groups. Specifically, there were 385, 408, 418, and 420 unshared ASVs with the L, LH, LA, and LHA, respectively (Figure 4a).
Figure 4b–d show the relative abundances of the top 10 fungal phyla, classes, and genera in the four litter treatments. The microbial compositions at all treatment phylum levels were consistent, and the major classes included Ascomycota (90%–94%) and Basidiomycota (5%–10%). Moreover, compared to those in the L treatment, the relative abundance of Basidiomycota in the LA treatment decreased by 2.81%, but the relative abundance of Ascomycota increased by 2.63%. In addition, the LH treatment decreased the relative abundance of Basidiomycota but increased the relative abundance of Ascomycota. Compared to that in the LH treatment, the relative abundance of Basidiomycota in the LHA treatment decreased by 1.25%, but the relative abundance of Ascomycota increased by 1.13%. In addition, compared to those in the L, LA, and LH treatments, the LHA treatment had the highest abundance of Ascomycota but had the lowest abundance of Basidiomycota (Figure 4b).
The microbial compositions at all treatment class levels were also consistent, and the major classes included Sordariomycetes (41%–56%), Dothideomycetes (27%–36%), Eurotiomycetes (4%–18%), and Agaricomycetes (6%–10%). Moreover, compared to those in the L treatment, the relative abundances of Dothideomycetes, Eurotiomycetes, and Agaricomycetes were lower, but the relative abundance of Sordariomycetes was greater (L vs. LH). Moreover, LA treatment decreased the relative abundance of Eurotiomycetes by 6.57% and Agaricomycetes by 2.11% but increased the relative abundance of Dothideomycetes by 4.49% and Sordariomycetes by 3.84% (L vs. LA). Compared to those in the LH treatment, the relative abundances of Eurotiomycetes and Agaricomycetes were 7.20% and 2.26%, respectively, while the relative abundances of Dothideomycetes and Sordariomycetes were 5.17% and 4.24%, respectively (LH vs. LHA). In addition, in the LHA treatment, Eurotiomycetes and Agaricomycetes had the lowest relative abundances, but Sordariomycetes had the highest relative abundance among the four groups (Figure 4c).
At the genus level, the microbial community was consistent and included Trichoderma (30%–40%), Verruconis (15%–30%), Phialomyces (4%–16%), Monocillium (2%–16%), Neocosmospora (3%–13%), Cladophialophora (4%–7%), Beltrania (0%–13%), Bionectria (0%–8%), Torula (1%–5%), and Knufia (2%–5%). Specifically, compared to those in the L treatment, the relative abundances of Torula were 1.36%, Cladophialophora was 1.79%, Knufia was 1.33%, Phialomyces was 4.67%, and Bionectria was 6.77%.
Similarly, the abundance of Trichoderma (0.58%) and Neocosmospora (4.27%) decreased in the LA treatment, but the relative abundances of Verruconis (12.48%), Monocillium (7.24%), and Beltrania (1.04%) increased in the LA treatment. Moreover, compared to those in the LH treatment, the relative abundances of Cladophialophora (1.02%), Knufia (0.10%), Bionectria (3.28%), Trichoderma (0.75%), Neocosmospora (5.06%), and Beltrania (12.31%) decreased in the LHA treatment group, but the relative abundances of Torula (1.41%), Verruconis (7.31%), and Phialomyces (0.49%) increased in the LHA treatment group. Notably, the LHA treatment had the lowest relative abundances of Cladophialophora, Bionectria, Neocosmospora, and Beltrania but had the highest relative abundance of Monocillium among the four treatments (Figure 4d).

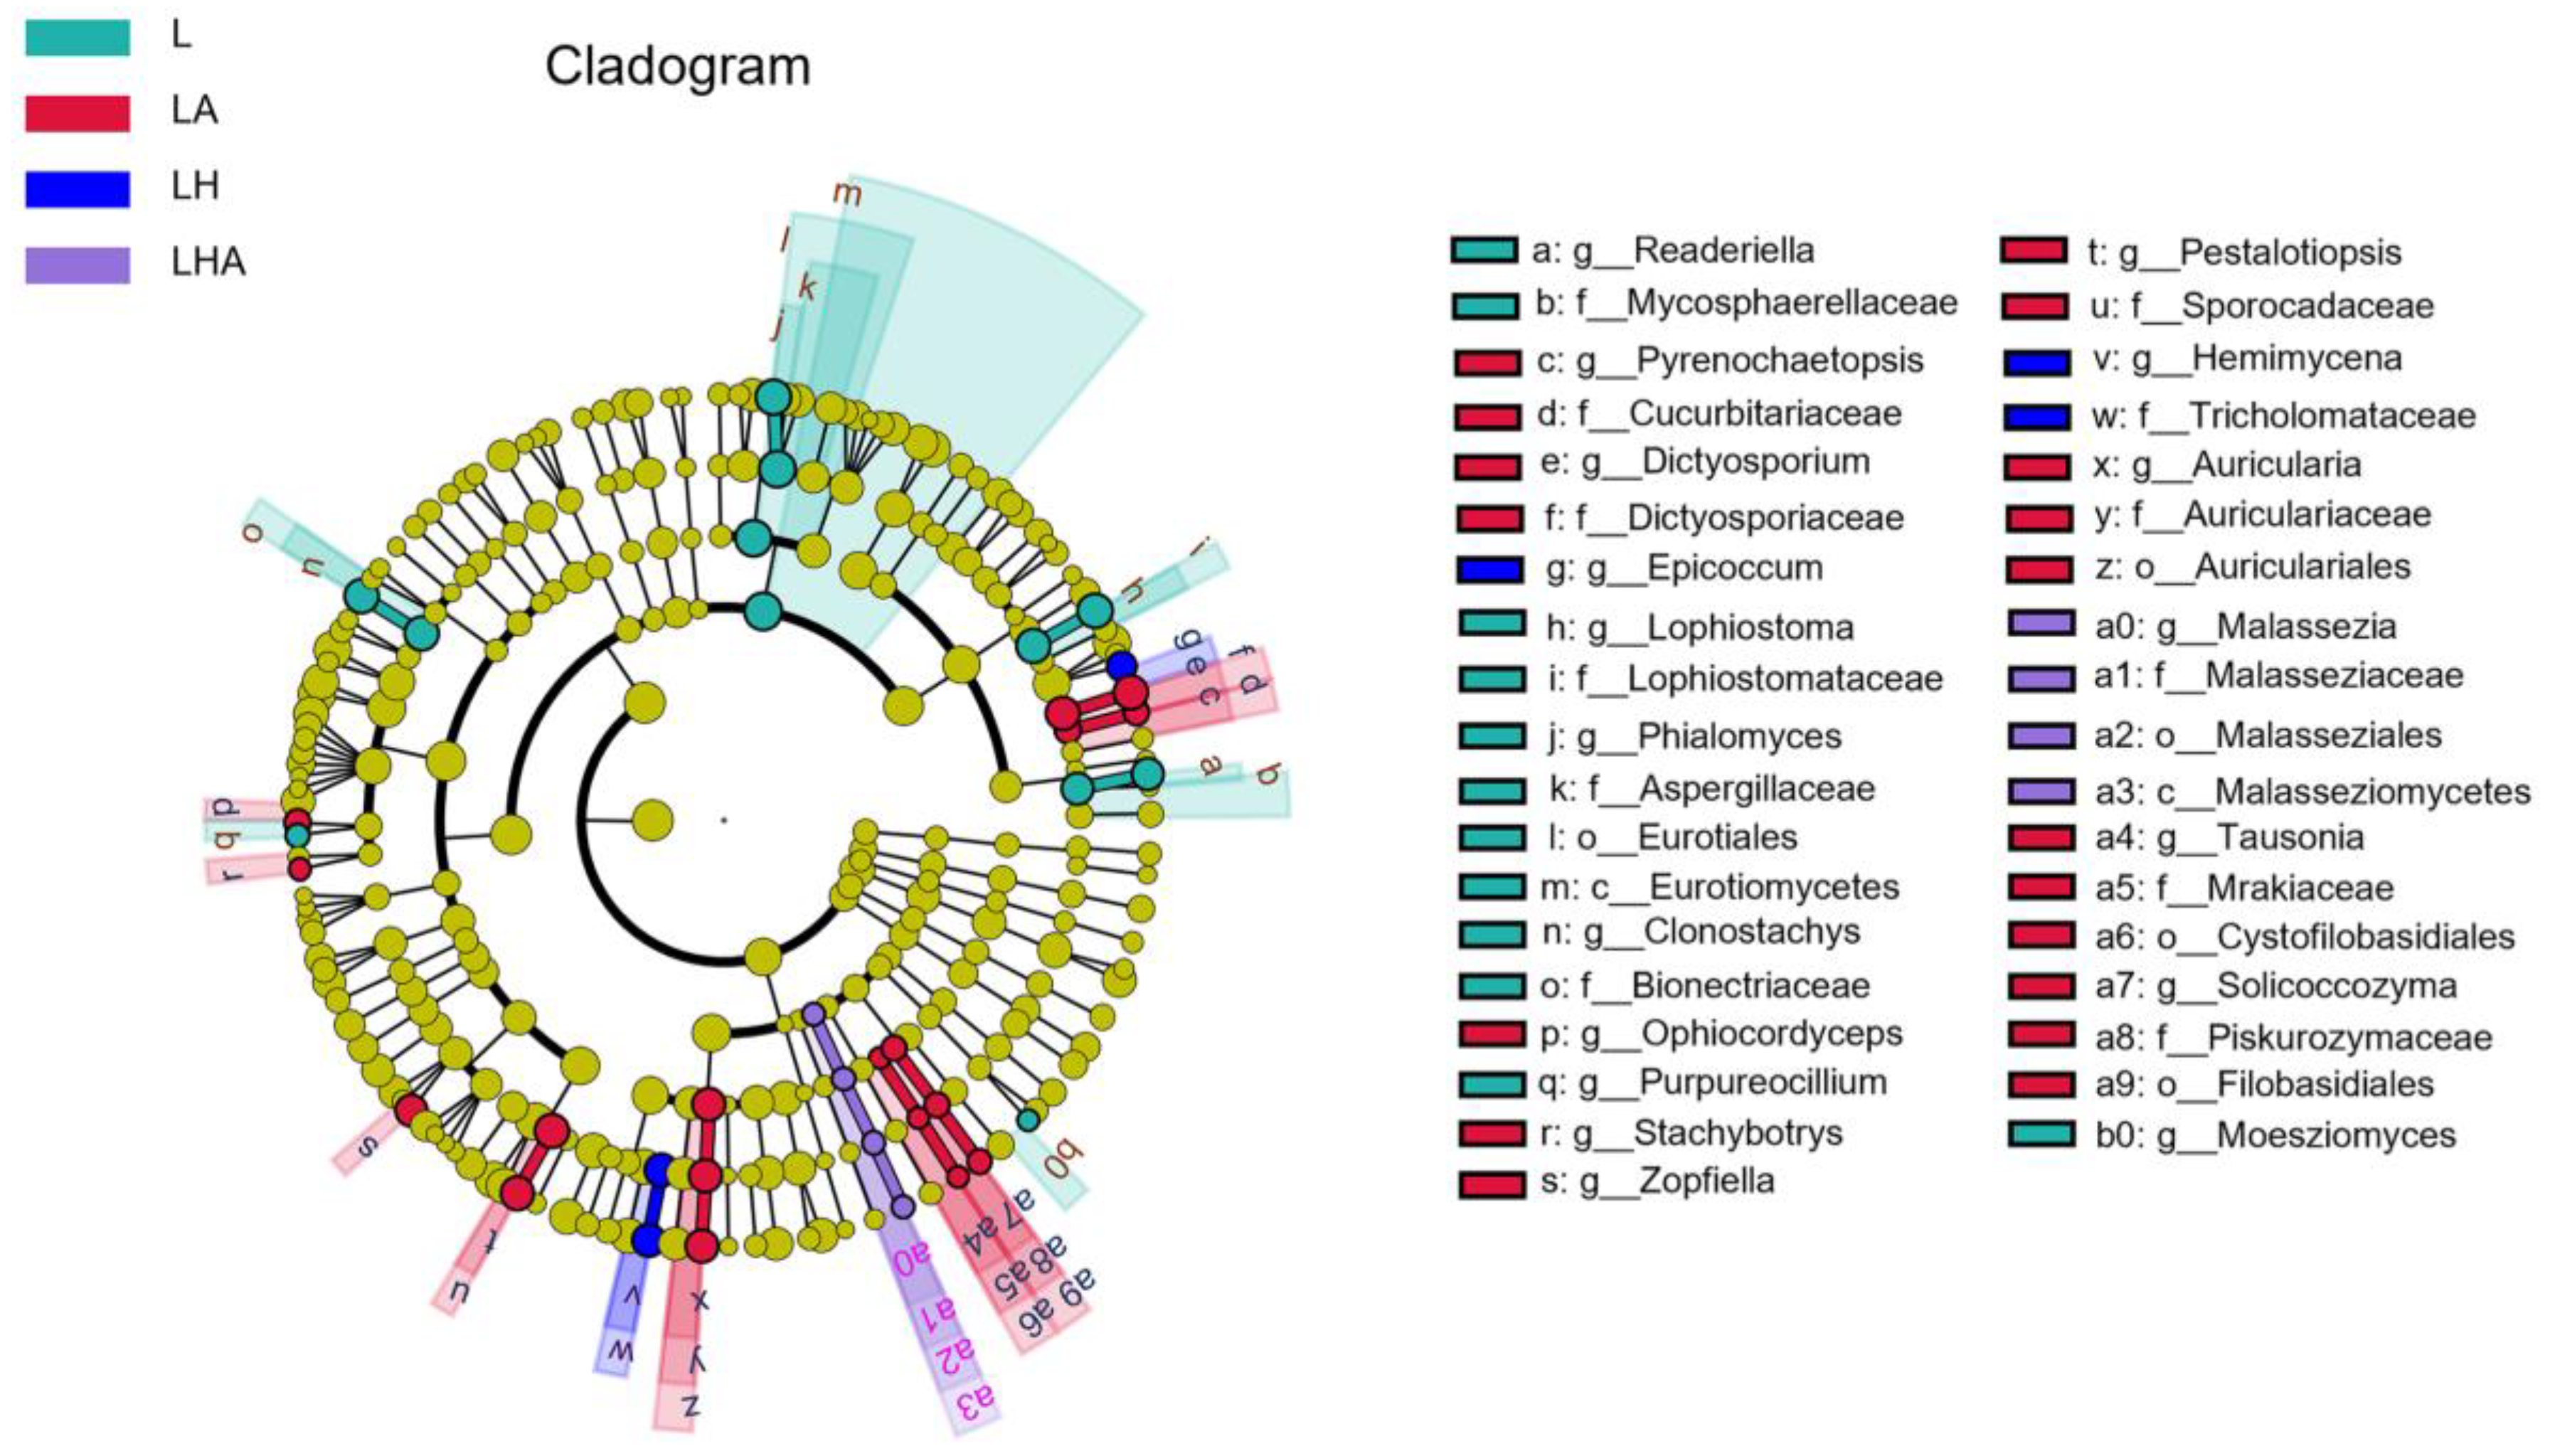
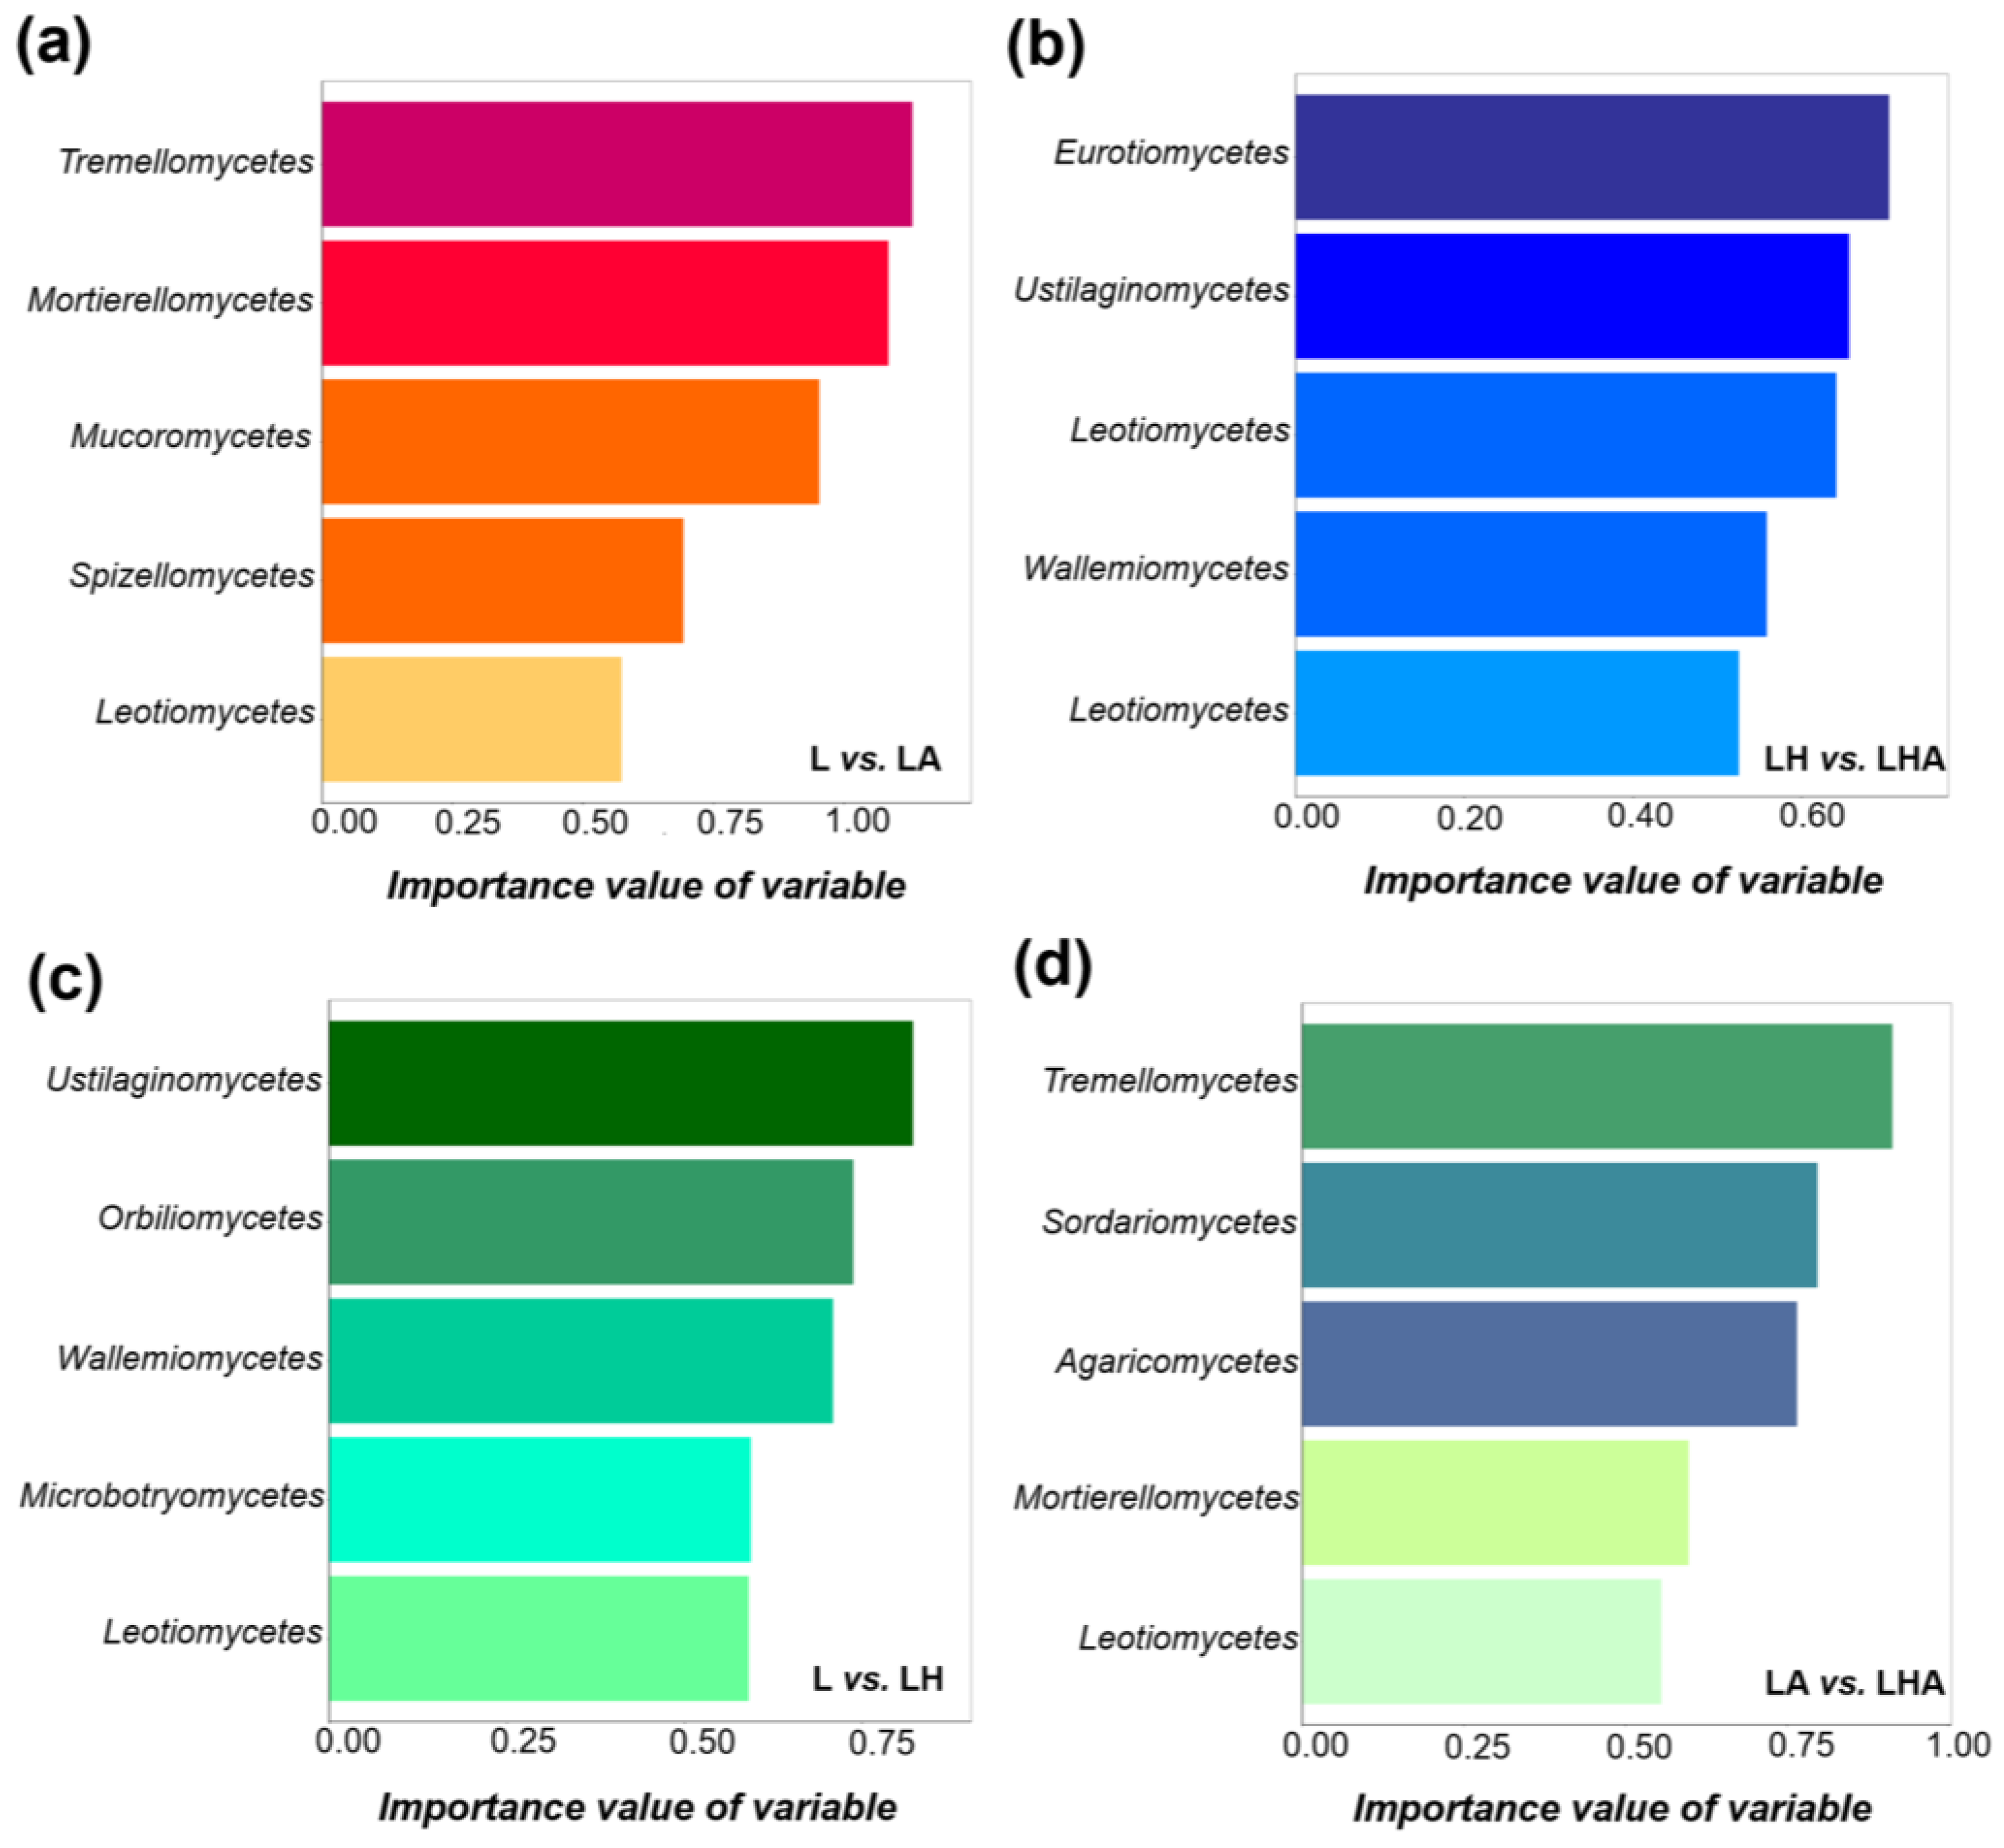
3.6. Biomarkers Idification

LDA effect size (LEfSe) analysis revealed different biomarkers in Lindera glauca litter from the four treatment groups (LDA > 3.0, p < 0.05). In all the categories, 12, 3, 18, and 4 taxa exhibited significantly different abundances in the L, LH, LA, and LHA treatments, respectively. At the genus level, readeriella, Lophiostoma, Phialemonium, Clonostachys Purpureocillium, and Moesziomyces showed an abundance advantage modified with L treatment, while enrichment of Pyrenochaetopsis, Dictyosporium, Ophiocordyceps, Stachybotrys, Zopfiella, Pestalotiopsis, Auricularia, Tausonia and Solicoccozyma were significant in LA treatment. Epicoccum and Hemimycena were more abundant in the LH treatment. The biomarkers of LHA treatment belonged to only Malassezia (Figure 5).
Random forest analysis further indicated that Tremellomycetes were the key species in the L vs. LA group, Eurotiomycetes were the key species in the LH vs. LHA group, Ustilaginomycetes were the key species in the L vs. LH group, and Tremellomycetes were the key species in the LA vs. LHA group. In addition, after the addition of HDPE−MPs (Figure 6a), the importance value of variable (Tremellomycetes) decreased compared with the treatment without HDPE−MPs treatment (Figure 6d) in total (at the class level; Figure 6).

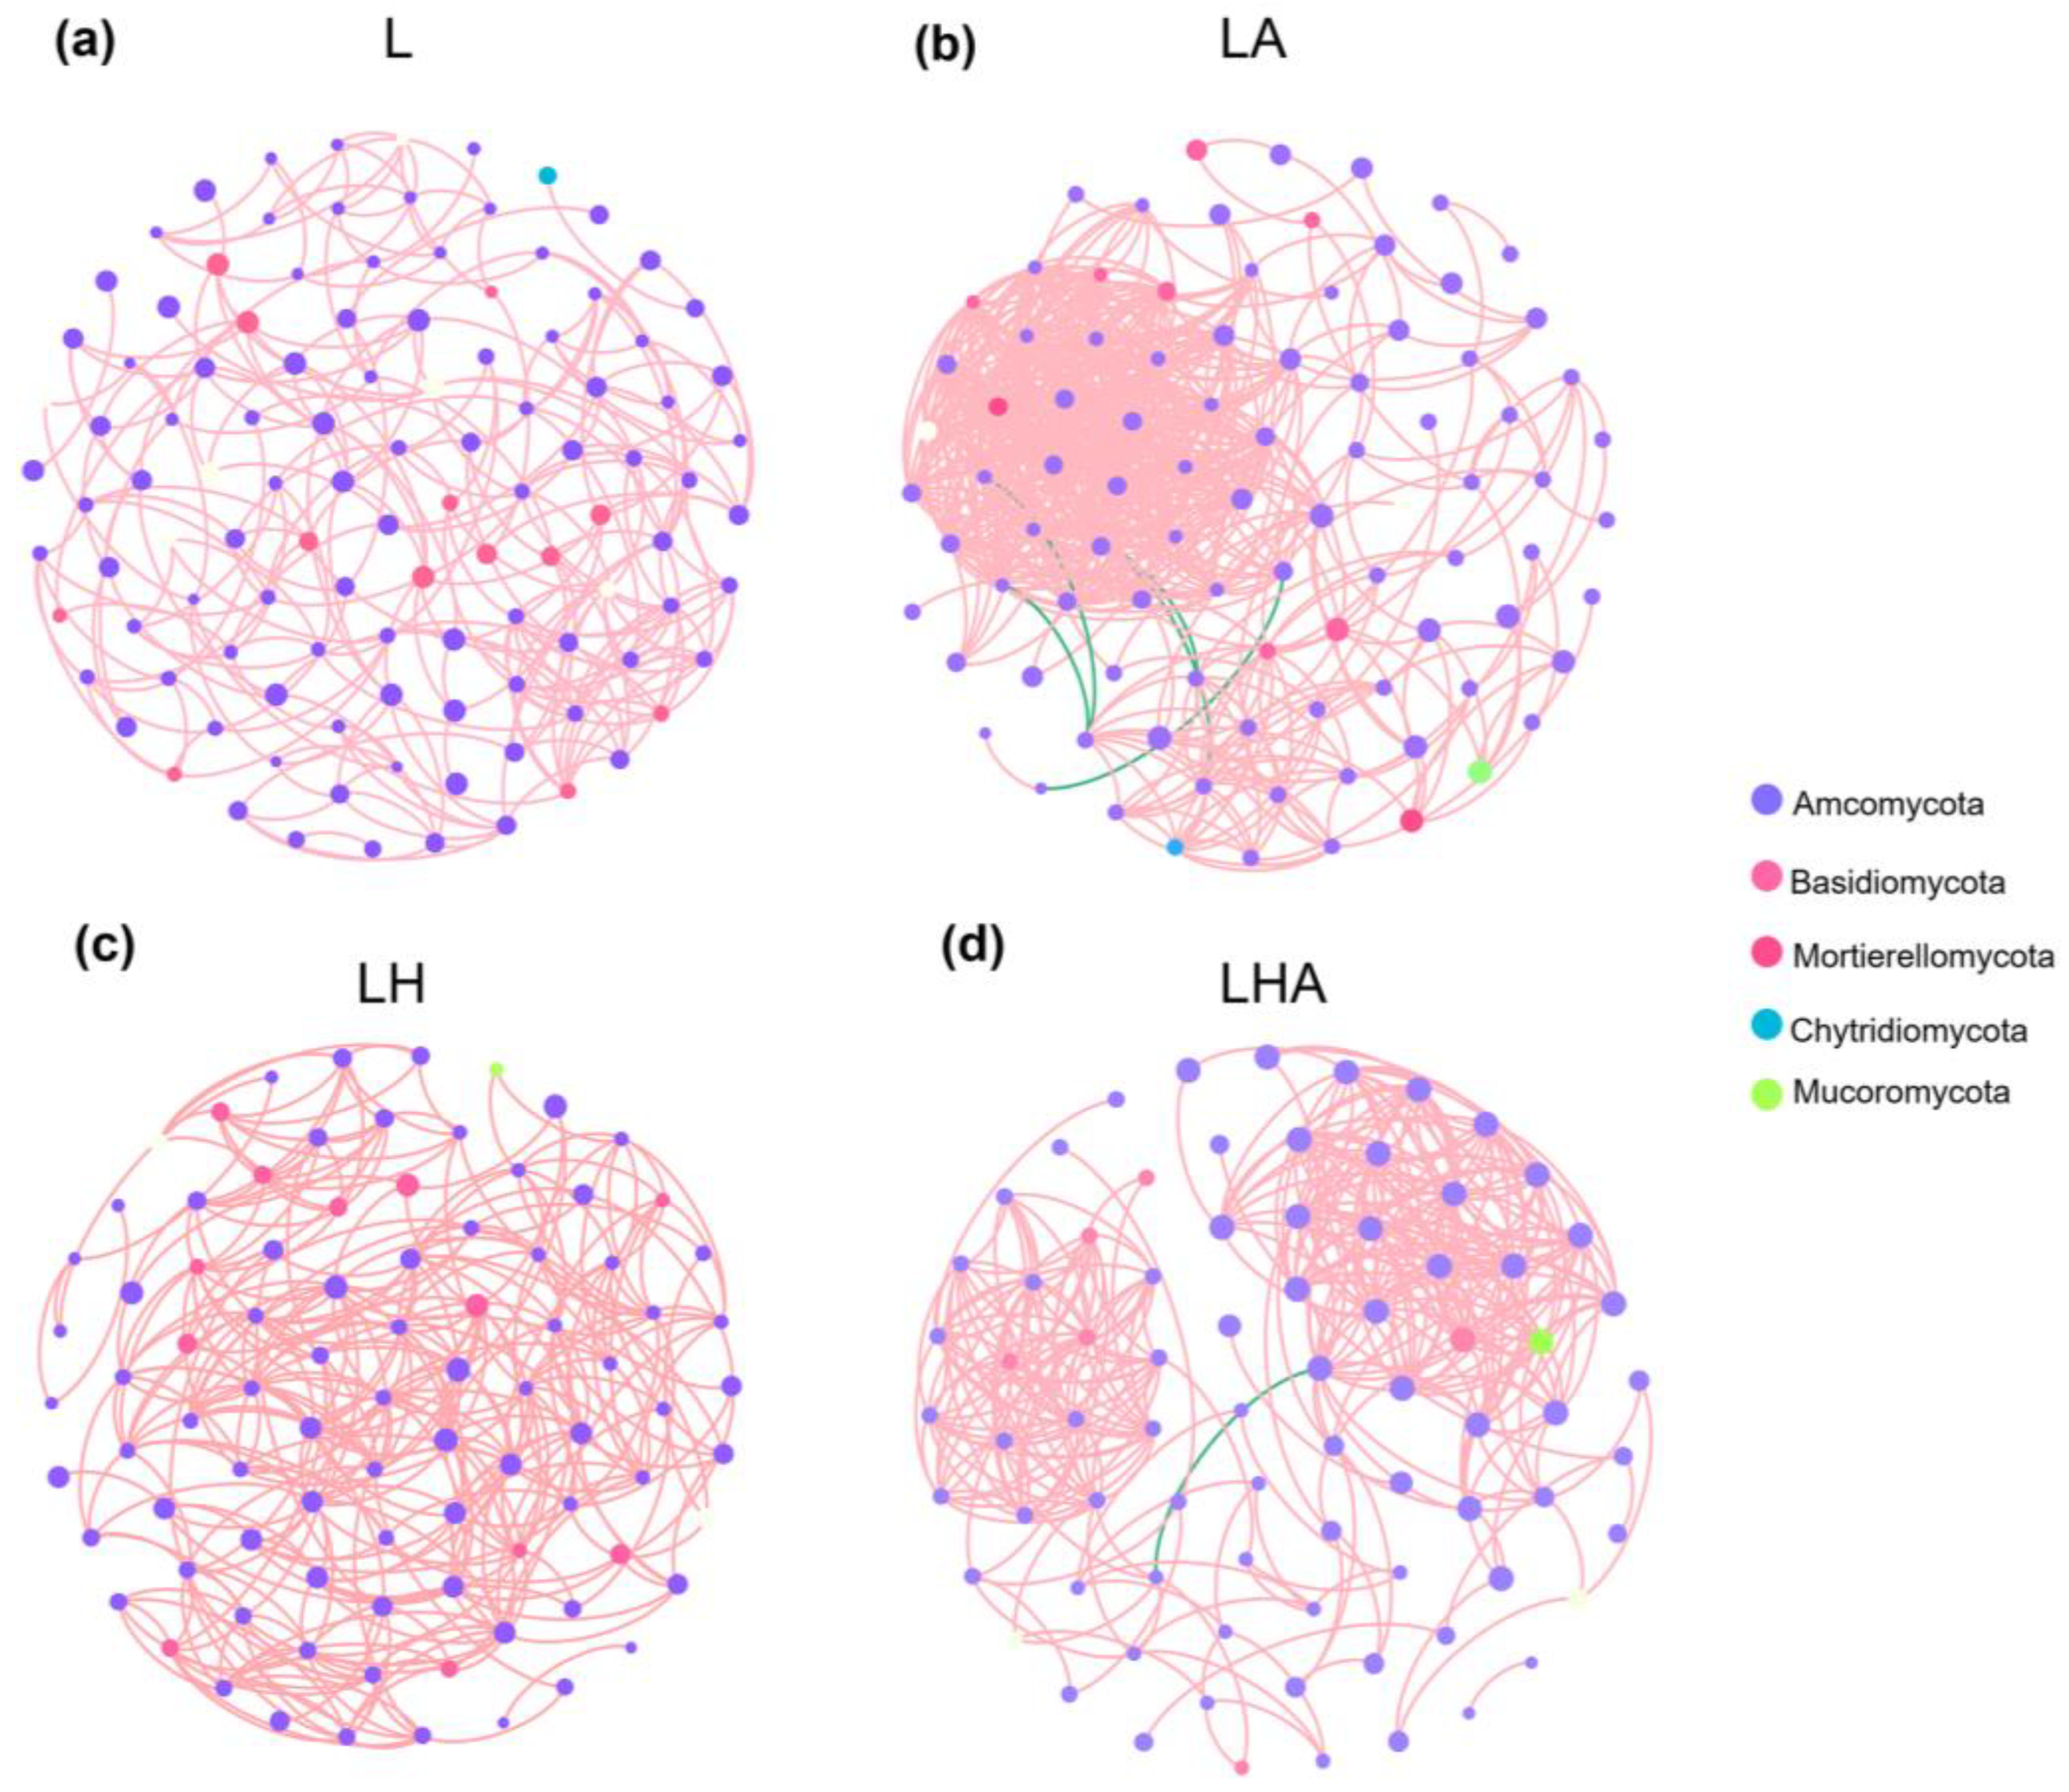
3.7. Cooccurrence Network Structures of Fungal Communities under Different Decomposition Conditions

Cooccurrence networks based on Spearman correlations between ASVs were constructed to evaluate the differences in fungal interactions in the litter between the different treatment groups (R ≥ 0.6, p < 0.05). The topological properties of the soil microbial co-occurrence networks indicated that the fungal networks were characterized by modularity (Table 3). Overall, the network structures of all the treatments were less complex. Moreover, the parameters of the co-occurrence network influenced the conditions of litter decomposition (Table 3). Moreover, there were 110 and 274 nodes and edges, respectively, in the fungal network of the L treatment group; there were 91 nodes and 596 edges in the LA treatment group; 88 nodes and 352 edges, respectively, in the LH treatment; and 78 nodes and 363 edges, respectively, in the LHA treatment group. In summary, these results indicate a clear difference in the microbial webs among the L, LA, LH, and LHA treatments and an increase in the complexity of the microbial webs following the addition of soil animals. Compared with litter decomposition with soil animals (LA), LHA treatment decreased the complexity of the network. All these nodes represented the key species that contributed significantly to the structure of the network. Furthermore, Ascomycota and Basidiomycota were the key nodes in all the treatment group networks (Figure 7, Table 3).

3.8. Functional Comparations

FUNGuild provided more comprehensive information on the trophic modes of fungal communities received from the selected litters. Compared with those in the L treatment, the trait abundances of blue rot, staining, nematode, trapping fungus, white rot, brown rot, and hypogeous were lower, but the abundance of soft rot was greater in the LA treatment. Compared with those in the LH treatment, the abundances of white rot, brown rot, and hypogeous were lower, but the abundances of soft rot, blue rot, staining, nematode, and trapping fungi were greater in the LHA treatment (Table 4).

4. Discussion

This study evaluated the effects of an emerging pollutant (HDPE−MPs) and soil animal activity on the community structure of plant litter fungi in a forest ecosystem. An important result shown by this research is that soil animals slow litter decomposition by reducing fungal microbial diversity and changing the microbial community structure in marcescent (Lindera glauca) litter, but HDPE−MPs pollution reduces fungal microbial diversity by affecting soil animal activity. Our results also provide strong theoretical support for the importance of considering emerging environmental parameters when assessing the potential risks of HDPE−MPs to forest biota and ecosystem biochemical cycle processes.

4.1. Soil Animals Regulate the Litter Fungal Community

In our study, soil animals (earthworms and springtails) significantly decreased litter mass loss by decreasing microbial alpha diversity and changing community composition (Figure 1); these findings contradicted our first hypothesis. Previous studies have reported that soil animals have a consistent positive effect on litter decomposition on a global scale [30,31], but the impact of interactions between soil animals and microorganisms on the biochemical cycle is often more important. The effects of soil animals on the activities and community structure of litter fungi have multiple dimensions; because soil fauna mechanically break litter through their mouthparts, the surface area of the microbial colonization in litter is increased, and the synergistic effect of soil animals and microorganisms in the soil can accelerate the decomposition of litter and the release of mineral nutrients [32,33]. Furthermore, the feeding effect (mainly fungal) of soil animals on microbes can directly change their community composition and influence microbial colonization on litter [34,35], and it may also retard litter decomposition. It is worth noting that in a wide range of field studies, the synergistic effects of soil animals and microorganisms on the accelerated decomposition of litter often involve complex weathering, leaching, different physical and chemical environments for soil decomposition, and the combined effects of a variety of soil animals. Under the controlled experiment [36], we only studied the influence of relatively representative macro (earthworms) and micro (springtails) soil animals in the ecosystem on the microbial decomposition of litters so as to more accurately study the contribution of soil animals to the microbial decomposition and community structure of litters without the interference of the external environment. Previous studies have found that earthworms may destroy the structure of fungal mycelia through activities such as drilling, and in some cases, the springtails would feed on fungal mycelia [37,38,39].Meanwhile, we found that the presence of soil animals reduced the microbial diversity of the Shannon, Simpson, and Chao1 indices (Figure 1), decreased the relative abundance of Basidiomycota, and increased the abundance of Ascomycetes (Figure 4b), suggesting that soil animals may be feeding selectively on Basidiomycetes [40]. In addition, soil animals exhibit decreased trait functional abundance in white rot and brown rot (Table 3), while white rot (Basidiomycota) plays an important role in litter lignin degradation [41,42], suggesting that soil animals, through selectivity, feed on Basidiomycota to decrease the decomposition of litter. In addition, we also found that soft rot had the highest trait abundance among the treatments. This may be due to the disturbance of the microbial community structure by soil animals (earthworms and springtails), which increases the competition among microbes [34]. Moreover, Pyrenochaetopsis, Dictyosporium, Ophiocordyceps, Stachybotrys, Zopfiella, Pestalotiopsis, Auricularia, Tausonia, and Solicoccozyma were used as biomarkers of bacteria in the LA treatment (Figure 5). All the fungi, except for Auricularia (Basidiomycota), were found to be Ascomycota, indicating that these nine fungi have strong adaptability to the environment after the introduction of soil animals and play important roles in the biodegradation of litter with soil animals [43]. Among them, Ophiocordyceps is mainly parasitic and an Ascomycete that can cause the death of the host [44]. We also found that the presence of a large number of pathogenic fungi in the litter may be the main cause of the decline in microbial diversity. Crowther et al. (2012), in contrast to our results, reported that soil animal grazing may increase Basidiomycota activity [45], along with soil invertebrate grazing, such as that of isopods (P. laevis Latreille 1804), which could significantly increase fungal biomass (white rot fungi) and enzyme activity [46]. These differences could be the result of differences in soil type or decomposition substrate. Notably, this mesocosm used forest cinnamon soil, which has a rich organic content (27.15 g/kg), and compared with fresh litter, which has poor palatability, it is easier for soil animals to use. Recent studies have shown that the presence of soil animals (especially earthworms) could also cause changes in the physical structure of the soil [47], which may also affect the abundance and diversity of fungi in litter. We previously proposed that soil animals increase the proportion of soil macroaggregate structures (Figure 3b). The complex pore network in soil aggregates provides a favorable microenvironment for soil microflora, promotes the formation of microaggregates in large aggregates, and has a certain regulatory effect on the microbial community [48], enabling more microorganisms to gather in the soil and reducing microbial colonization on leaf litter. Although soil animals reduce soil microbial richness and diversity, co-occurrence network analysis has shown that the addition of soil animals results in significantly more complex network relationships (Figure 7; LA), possibly because soil animals not only affect microbial community structure through drilling and feeding activities but also cause feces to be excreted after digestion by intestinal microorganisms to indirectly affect the structure of leaf litter fungi [49]. This leads to more complex and unexplained microbial interactions that slow litter decomposition.

4.2. HDPE−MPs Changes the Soil Animals’ Influences in Determining the Decomposition Process

New environmental contaminants, represented by microplastics, enter forest ecosystems through atmospheric sedimentation, overland runoff, and human activities and interfere with the physiological functions of soil organisms [50,51]. At present, the impact of microplastics on soil animals has mostly been evaluated in terms of ecotoxicology [52]. Exposure to high-density polyethylene microplastics significantly reduces the biomass of earthworms [26]. Moreover, soil microplastics inhibit the movement of springtails [23]. We also reached the conclusion that the addition of microplastics significantly reduces the weight of the earthworms, which showed negative growth in our study (Figure 3a). However, we did not find any effect of HDPE−MPs on springtails, possibly because the microplastics we selected had larger particle sizes and were not swallowed by springtails. Previous research supports our conclusions; by feeding springtails polyethylene microplastics of three different sizes (2, 3, 4, and 66 μm) and using fluorescence microscopy, the edible size of the microplastics was observed to be less than 66.0 ± 10.9 μm in the gut [14]. Therefore, in future studies, we should pay attention to the effects of the type, particle size, and concentration of microplastics on the biochemical cycles of soil decomposers. Studies have shown that MPs can decrease the relative abundance of soil microorganisms and affect the diversity and richness of the microbial community structure [53]. Consistent with our findings, HDPE−MPs decreased the fungal Shannon, Simpson, and Chao1 diversity indices of litter (Figure 1), possibly because microplastics can compete with soil microbes for niches in which microbes can grow and move and reduce the abundance of dominant species; however, our results indicate no significant effects of interactions between MPs and microorganisms on litter fungal diversity (Figure 1). Notably, due to the influence of microplastics on soil animals, the inhibitory effect of soil animals on the microbial decomposition of litter decreased, and the mass loss decreased by 10.8% (Figure 1a; L and LA vs. LH and LHA). Moreover, the Shannon index increased by 9.84% (Figure 1b), the Simpson index increased by 8.84% (Figure 1c), and the Chao 1 index decreased by 4.82% (Figure 1d). However, earlier reports have been mixed; for example, microplastics may affect the feeding activities of soil animals, causing digestive tract damage [13]. This ecotoxicity may affect the bio-decomposition of litter by soil animals, thereby reducing mass loss. This finding contradicts our conclusion and contradicts our second hypothesis. Microplastics affect feeding activities and result in weight loss in earthworms, weakening the regulatory effect of soil animals on microbial community structure. We also found that the relative abundance of Ascomycetes increased by 1.13% and that the abundance of Basidiomycetes decreased by 1.24% after microplastics were added (Figure 4b). However, compared with those in the absence of microplastics, both the increase and decrease in soluble protein levels slowed, which also indicates that the feeding of Basidiomycetes was reduced due to the effect of microplastics on the feeding activities of soil animals. In addition, the reduction in white rot fungi was also lower in the presence of microplastics than in the absence of microplastics (Table 3). We also found that Epicoccum, Hemimycena, and Malassezia were the biomarkers associated with HDPE−MPs treatment and played important roles in litter decomposition (Figure 5). We also found that the Sordariomycetes fungus was differentially expressed in HDPE−MPs treatment and may be resistant to microplastic stress. Recently, results have confirmed that plastic-degrading fungi are found in eleven classes of the fungal phylum Ascomycota. Sordariomycetes also supported our findings [54]. In addition, HDPE−MPs decreased the proportion of soil macroaggregate structures (Figure 2). The strong surface tension of microplastics may increase the accumulation of organic matter and microflora, which affects the stability of soil aggregates [55]. Moreover, the negative charge of microplastics may repel soil particles, reduce the stability of aggregates, and increase the ease with which microorganisms gather on the litter surface [56], thus increasing the decomposition of litter. When microplastics are added, the complexity of the co-occurrence networks decreases (Figure 7; LHA). In conclusion, we can conclude that HDPE−MPs exposure not only altered soil animal activities but also further changed the fungal community and fungal function. In conclusion, our study showed that compared with soil-animal-regulated microbial degradation, HDPE can reduce the inhibition of microbial community complexity and litter decomposition by soil animals. Nevertheless, in our study, only representative soil animals and microplastics were selected for preliminary exploration. Although the influence of new environmental pollutants represented by microplastics on nutrient cycling in forest ecosystems has been revealed, future studies should increase the research on different concentrations, different types of microplastics, and more complex soil animal types. Improving the understanding of the impact of microplastics on the biochemical cycle in the context of global pollution will provide theoretical support.

5. Conclusions

In summary, our study provides a better understanding of the effects of HDPE−MPs and soil animals on the diversity, composition, and network structure of fungal communities during the forest litter decomposition process. We concluded (1) that the presence of soil animals decreased fungal diversity and changed the community composition and structure, which, in turn, reduced the decomposition of litter; (2) that HDPE−MPs contaminants affect the activities of soil animals, especially by reducing the feeding effect of soil animals on fungi, thus changing the complex structure of the microbial community and facilitating the inhibitory effect of soil animals on the microbial decomposition of litter; and (3) that forest ecosystems are a hidden reservoir of microplastics, and their response to an emerging contamination is an important issue that cannot be ignored.

Author Contributions

Conceptualization, Methodology, Investigation, Data curation, Formal analysis, Visualization, Writing—original draft: X.W.; Conceptualization, Methodology, Investigation, Data curation, Writing—Review and Editing, Supervision, Resources, Funding acquisition: K.T.; Resources: R.Y.; Writing—Review and Editing: B.-L.L. All authors have read and agreed to the published version of the manuscript.

Funding

This study was financially supported by the National Natural Science Foundation of China (32001300), the key specialized research and development breakthrough program in Henan province (222102320289), the overseas expertise introduction center for discipline innovation of watershed ecological security in the water source area of the Middle Route of South-to-North Water Diversion Project (D23015), and the Henan Province Central Leading Local Science and Technology Development Fund (Z20221343035).

Data Availability Statement

Raw sequence data for microbial community are available in the Sequence Read Achieve (SRA) database of the National Centre for Biotechnology Information (NCBI) with accession number SRP487015. The data presented in the study are included in the article, data analysis and R code are available upon request to correspondence author.

Acknowledgments

We would like to thank Baotianman Forest Ecosystem Research Station for their assistance in previous research related to the ideas in this paper.

Conflicts of Interest

The authors declare no conflicts of interest.

Appendix A

Activities of cellobiohydrolase and β-1,4-xylosidase were determined using 1.2 mM 4-nitrophenyl-β-d-linked (PNPX, Macklin Biochemical Technology Co., Ltd., Shanghai, China) substrates (cellobioside, xylopyranoside) with incubation in the dark at 40 °C for 1.5 h (pH 5.0, 0.2 M Na2CO3 was used to stop the reaction). 4-nitrophenyl (PNP) concentrations were quantified by measuring absorbance at 400 nm using a microplate spectrophotometer (Tecan Safire2, Männendorf, Switzerland) in 96-well plates. Enzymatic activities are expressed in μ mol PNP h−1 g−1 soil.
Phenol peroxidase activities were measured spectrophotometrically using 100 μL of 25 mM l-3,4-dihydroxyphenylalanine (L-DOPA, Macklin Biochemical Technology Co., Ltd., Shanghai, China) as the substrate with incubation at 26.5 °C for 1 h then adding 0.3% hydrogen peroxide (pH 5.5, Macklin Biochemical Technology Co., Ltd., Shanghai, China), quantified by measuring absorbance at 450 nm using the microplate spectrophotometer (Tecan Safire2, Männendorf, Switzerland) in 96-well plates. Enzymatic activities are expressed in μ mol L-DOPA h−1 g−1 soil.
Urease activity was determined with urea as a substrate, incubated at pH 6.7 (0.2 M phosphate buffer, Macklin Biochemical Technology Co., Ltd., Shanghai, China) and 37 °C for 24 h, and absorbance was measured at 578 nm using the spectrophotometer (UV-1900i, Shimadzu Corporation, Japan). Enzymatic activity is expressed in mg NH3-N h−1 g−1 soil.
Acid phosphatase activities were determined using 0.5% disodium phenyl phosphate solution (Macklin Biochemical Technology Co., Ltd., Shanghai, China) as a substrate with incubation at 37 °C for 24 h (pH 5.0 for acid phosphatase). Phenol concentration was determined with the spectrophotometer(UV-1900i, Shimadzu Corporation, Japan) at 570 nm. Enzymatic activities were quantified by reference to a calibration curve incubated with soil under the same conditions described and are expressed in mg phenol h−1 g−1 soil.

References

  1. Hättenschwiler, S.; Tiunov, A.V.; Scheu, S. Biodiversity and Litter Decomposition in Terrestrial Ecosystems. Annu. Rev. Ecol. Evol. Syst. 2005, 36, 191–218. [Google Scholar] [CrossRef]
  2. Condron, L.; Stark, C.; O’Callaghan, M.; Clinton, P.; Huang, Z. The Role of Microbial Communities in the Formation and Decomposition of Soil Organic Matter. In Soil Microbiology and Sustainable Crop Production; Dixon, G.R., Tilston, E.L., Eds.; Springer: Dordrecht, The Netherlands, 2010; pp. 81–118. ISBN 978-90-481-9478-0. [Google Scholar]
  3. Berg, B.; Laskowski, R. Decomposers: Soil Microorganisms and Animals. In Advances in Ecological Research; Elsevier: Amsterdam, The Netherlands, 2005; Volume 38, pp. 73–100. ISBN 978-0-12-013938-5. [Google Scholar]
  4. Wardle, D.A. The Influence of Biotic Interactions on Soil Biodiversity. Ecol. Lett. 2006, 9, 870–886. [Google Scholar] [CrossRef]
  5. Bradford, M.A.; Jones, T.H.; Bardgett, R.D.; Black, H.I.J.; Boag, B.; Bonkowski, M.; Cook, R.; Eggers, T.; Gange, A.C.; Grayston, S.J.; et al. Impacts of Soil Faunal Community Composition on Model Grassland Ecosystems. Science 2002, 298, 615–618. [Google Scholar] [CrossRef]
  6. Handa, I.T.; Aerts, R.; Berendse, F.; Berg, M.P.; Bruder, A.; Butenschoen, O.; Chauvet, E.; Gessner, M.O.; Jabiol, J.; Makkonen, M.; et al. Consequences of Biodiversity Loss for Litter Decomposition across Biomes. Nature 2014, 509, 218–221. [Google Scholar] [CrossRef]
  7. Maraun, M.; Martens, H.; Migge, S.; Theenhaus, A.; Scheu, S. Adding to ‘the Enigma of Soil Animal Diversity’: Fungal Feeders and Saprophagous Soil Invertebrates Prefer Similar Food Substrates. Eur. J. Soil Biol. 2003, 39, 85–95. [Google Scholar] [CrossRef]
  8. Yang, X.; Yang, Z.; Warren, M.W.; Chen, J. Mechanical Fragmentation Enhances the Contribution of Collembola to Leaf Litter Decomposition. Eur. J. Soil Biol. 2012, 53, 23–31. [Google Scholar] [CrossRef]
  9. Bradford, M.A.; Tordoff, G.M.; Eggers, T.; Jones, T.H.; Newington, J.E. Microbiota, Fauna, and Mesh Size Interactions in Litter Decomposition. Oikos 2002, 99, 317–323. [Google Scholar] [CrossRef]
  10. Rillig, M.C.; Lehmann, A. Microplastic in Terrestrial Ecosystems. Science 2020, 368, 1430–1431. [Google Scholar] [CrossRef] [PubMed]
  11. Büks, F.; Kaupenjohann, M. Global Concentrations of Microplastics in Soils—A Review. Soil 2020, 6, 649–662. [Google Scholar] [CrossRef]
  12. Luo, W.; Su, L.; Craig, N.J.; Du, F.; Wu, C.; Shi, H. Comparison of Microplastic Pollution in Different Water Bodies from Urban Creeks to Coastal Waters. Environ. Pollut. 2019, 246, 174–182. [Google Scholar] [CrossRef] [PubMed]
  13. Kim, S.W.; An, Y.-J. Edible Size of Polyethylene Microplastics and Their Effects on Springtail Behavior. Environ. Pollut. 2020, 266, 115255. [Google Scholar] [CrossRef]
  14. Jiang, X.; Chang, Y.; Zhang, T.; Qiao, Y.; Klobučar, G.; Li, M. Toxicological Effects of Polystyrene Microplastics on Earthworm (Eisenia fetida). Environ. Pollut. 2020, 259, 113896. [Google Scholar] [CrossRef]
  15. Li, K.; Zhang, M.; Jia, W.; Xu, L.; Huang, Y. Deciphering the Effects of LDPE Microplastic Films on Diversity, Composition and Co-Occurrence Network of Soil Fungal Community. Appl. Soil Ecol. 2023, 182, 104716. [Google Scholar] [CrossRef]
  16. Bani, A.; Pioli, S.; Ventura, M.; Panzacchi, P.; Borruso, L.; Tognetti, R.; Tonon, G.; Brusetti, L. The Role of Microbial Community in the Decomposition of Leaf Litter and Deadwood. Appl. Soil Ecol. 2018, 126, 75–84. [Google Scholar] [CrossRef]
  17. Fan, P.; Tan, W.; Yu, H. Effects of Different Concentrations and Types of Microplastics on Bacteria and Fungi in Alkaline Soil. Ecotoxicol. Environ. Saf. 2022, 229, 113045. [Google Scholar] [CrossRef]
  18. Zettler, E.R.; Mincer, T.J.; Amaral-Zettler, L.A. Life in the “Plastisphere”: Microbial Communities on Plastic Marine Debris. Environ. Sci. Technol. 2013, 47, 7137–7146. [Google Scholar] [CrossRef]
  19. Ya, H.; Xing, Y.; Zhang, T.; Lv, M.; Jiang, B. LDPE Microplastics Affect Soil Microbial Community and Form a Unique Plastisphere on Microplastics. Appl. Soil Ecol. 2022, 180, 104623. [Google Scholar] [CrossRef]
  20. Wang, Q.; Adams, C.A.; Wang, F.; Sun, Y.; Zhang, S. Interactions between Microplastics and Soil Fauna: A Critical Review. Crit. Rev. Environ. Sci. Technol. 2022, 52, 3211–3243. [Google Scholar] [CrossRef]
  21. Li, B.; Song, W.; Cheng, Y.; Zhang, K.; Tian, H.; Du, Z.; Wang, J.; Wang, J.; Zhang, W.; Zhu, L. Ecotoxicological Effects of Different Size Ranges of Industrial-Grade Polyethylene and Polypropylene Microplastics on Earthworms Eisenia fetida. Sci. Total Environ. 2021, 783, 147007. [Google Scholar] [CrossRef] [PubMed]
  22. Cheng, Y.; Song, W.; Tian, H.; Zhang, K.; Li, B.; Du, Z.; Zhang, W.; Wang, J.; Wang, J.; Zhu, L. The Effects of High-Density Polyethylene and Polypropylene Microplastics on the Soil and Earthworm Metaphire guillelmi Gut Microbiota. Chemosphere 2021, 267, 129219. [Google Scholar] [CrossRef] [PubMed]
  23. Ju, H.; Zhu, D.; Qiao, M. Effects of Polyethylene Microplastics on the Gut Microbial Community, Reproduction and Avoidance Behaviors of the Soil Springtail, Folsomia candida. Environ. Pollut. 2019, 247, 890–897. [Google Scholar] [CrossRef]
  24. Klironomos, J.N.; Widden, P.; Deslandes, I. Feeding Preferences of the Collembolan Folsomia candida in Relation to Microfungal Successions on Decaying Litter. Soil Biol. Biochem. 1992, 24, 685–692. [Google Scholar] [CrossRef]
  25. Rillig, M.C.; Ziersch, L.; Hempel, S. Microplastic Transport in Soil by Earthworms. Sci. Rep. 2017, 7, 1362. [Google Scholar] [CrossRef] [PubMed]
  26. Boots, B.; Russell, C.W.; Green, D.S. Effects of Microplastics in Soil Ecosystems: Above and Below Ground. Environ. Sci. Technol. 2019, 53, 11496–11506. [Google Scholar] [CrossRef] [PubMed]
  27. Vepsäläinen, M.; Kukkonen, S.; Vestberg, M.; Sirviö, H.; Maarit Niemi, R. Application of Soil Enzyme Activity Test Kit in a Field Experiment. Soil Biol. Biochem. 2001, 33, 1665–1672. [Google Scholar] [CrossRef]
  28. Liu, Y.-X.; Qin, Y.; Chen, T.; Lu, M.; Qian, X.; Guo, X.; Bai, Y. A Practical Guide to Amplicon and Metagenomic Analysis of Microbiome Data. Protein Cell 2021, 12, 315–330. [Google Scholar] [CrossRef] [PubMed]
  29. Bokulich, N.A.; Kaehler, B.D.; Rideout, J.R.; Dillon, M.; Bolyen, E.; Knight, R.; Huttley, G.A.; Gregory Caporaso, J. Optimizing Taxonomic Classification of Marker-Gene Amplicon Sequences with QIIME 2’s Q2-Feature-Classifier Plugin. Microbiome 2018, 6, 90. [Google Scholar] [CrossRef]
  30. García-Palacios, P.; Maestre, F.T.; Kattge, J.; Wall, D.H. Climate and Litter Quality Differently Modulate the Effects of Soil Fauna on Litter Decomposition across Biomes. Ecol. Lett. 2013, 16, 1045–1053. [Google Scholar] [CrossRef]
  31. Njoroge, D.M.; Chen, S.; Zuo, J.; Dossa, G.G.O.; Cornelissen, J.H.C. Soil Fauna Accelerate Litter Mixture Decomposition Globally, Especially in Dry Environments. J. Ecol. 2022, 110, 659–672. [Google Scholar] [CrossRef]
  32. Coleman, D.C.; Geisen, S.; Wall, D.H. Soil Fauna: Occurrence, Biodiversity, and Roles in Ecosystem Function. In Soil Microbiology, Ecology and Biochemistry, 5th ed.; Elsevier: Amsterdam, The Netherlands, 2023; pp. 131–159. ISBN 978-0-12-822941-5. [Google Scholar]
  33. Coleman, D.C.; Wall, D.H. Soil Fauna: Occurrence, Biodiversity, and Roles in Ecosystem Function. In Soil Microbiology, Ecology and Biochemistry, 4th ed.; Elsevier: Amsterdam, The Netherlands, 2014; pp. 111–149. ISBN 978-0-12-415955-6. [Google Scholar]
  34. Gómez-Brandón, M.; Aira, M.; Lores, M.; Domínguez, J. Epigeic Earthworms Exert a Bottleneck Effect on Microbial Communities through Gut Associated Processes. PLoS ONE 2011, 6, e24786. [Google Scholar] [CrossRef]
  35. Scheu, S.; Ruess, L.; Bonkowski, M. Interactions between Microorganisms and Soil Micro- and Mesofauna. In Microorganisms in Soils: Roles in Genesis and Functions; Varma, A., Buscot, F., Eds.; Soil Biology; Springer: Berlin/Heidelberg, Germany, 2005; Volume 3, pp. 253–275. ISBN 978-3-540-22220-0. [Google Scholar]
  36. Stewart, R.I.A.; Dossena, M.; Bohan, D.A.; Jeppesen, E.; Kordas, R.L.; Ledger, M.E.; Meerhoff, M.; Moss, B.; Mulder, C.; Shurin, J.B.; et al. Mesocosm Experiments as a Tool for Ecological Climate-Change Research. In Advances in Ecological Research; Elsevier: Amsterdam, The Netherlands, 2013; Volume 48, pp. 71–181. ISBN 978-0-12-417199-2. [Google Scholar]
  37. Lavelle, P. Earthworm Activities and the Soil System. Biol. Fertil. Soils 1988, 6, 237–251. [Google Scholar] [CrossRef]
  38. Zhang, W.; Chen, D.; Zhao, C. Functions of Earthworm in Ecosystem. Biodivers. Sci. 2007, 15, 142. [Google Scholar] [CrossRef]
  39. Klironomos, J.N.; Bednarczuk, E.M.; Neville, J. Reproductive Significance of Feeding on Saprobic and Arbuscular Mycorrhizal Fungi by the Collembolan, Folsomia candida. Funct. Ecol. 1999, 13, 756–761. [Google Scholar] [CrossRef]
  40. Crowther, T.W.; Boddy, L.; Jones, T.H. Species-Specific Effects of Soil Fauna on Fungal Foraging and Decomposition. Oecologia 2011, 167, 535–545. [Google Scholar] [CrossRef] [PubMed]
  41. Ten Have, R.; Teunissen, P.J.M. Oxidative Mechanisms Involved in Lignin Degradation by White-Rot Fungi. Chem. Rev. 2001, 101, 3397–3414. [Google Scholar] [CrossRef] [PubMed]
  42. Aust, S.D. Mechanisms of Degradation by White Rot fungi. Environ. Health Perspect. 1995, 103, 59–61. [Google Scholar] [CrossRef]
  43. Voříšková, J.; Baldrian, P. Fungal Community on Decomposing Leaf Litter Undergoes Rapid Successional Changes. ISME J. 2013, 7, 477–486. [Google Scholar] [CrossRef]
  44. Bhardwaj, N.; Rajaura, S.; Chauhan, P.; Singh, A. Metabolomics and Therapeutic Potential of Ophiocordyceps Sinensis. In Phytochemical Genomics; Swamy, M.K., Kumar, A., Eds.; Springer Nature: Singapore, 2022; pp. 319–342. ISBN 978-981-19577-8-9. [Google Scholar]
  45. Crowther, T.W.; Boddy, L.; Hefin Jones, T. Functional and Ecological Consequences of Saprotrophic Fungus–Grazer Interactions. ISME J. 2012, 6, 1992–2001. [Google Scholar] [CrossRef]
  46. Chen, Y.; Cao, T.; Lv, M.; Fang, Y.; Liu, R.; Luo, Y.; Xu, C.; Tian, X. Grazing Effects of Soil Fauna on White-Rot Fungi: Biomass, Enzyme Production and Litter Decomposition Ability. J. Fungi 2022, 8, 348. [Google Scholar] [CrossRef]
  47. Sharma, D.K.; Tomar, S.; Chakraborty, D. Role of Earthworm in Improving Soil Structure and Functioning. Curr. Sci. 2017, 113, 1064. [Google Scholar] [CrossRef]
  48. Zhang, Q.; Liu, H.; Liang, Y.; Liang, Y.; Zhao, Y.; Wang, Z.; Li, Y.; Liu, W.; Wang, X.; Yang, G.; et al. The Multifunctionality of Soil Aggregates Is Related to the Complexity of Aggregate Microbial Community during Afforestation. CATENA 2024, 236, 107737. [Google Scholar] [CrossRef]
  49. Gómez-Brandón, M.; Lores, M.; Domínguez, J. Species-Specific Effects of Epigeic Earthworms on Microbial Community Structure during First Stages of Decomposition of Organic Matter. PLoS ONE 2012, 7, e31895. [Google Scholar] [CrossRef]
  50. Zhou, Y.; Wang, J.; Zou, M.; Jia, Z.; Zhou, S.; Li, Y. Microplastics in Soils: A Review of Methods, Occurrence, Fate, Transport, Ecological and Environmental Risks. Sci. Total Environ. 2020, 748, 141368. [Google Scholar] [CrossRef]
  51. Weber, C.J.; Rillig, M.C.; Bigalke, M. Mind the Gap: Forest Soils as a Hidden Hub for Global Micro- and Nanoplastic Pollution. Microplast. Nanoplast. 2023, 3, 19. [Google Scholar] [CrossRef]
  52. Anbumani, S.; Kakkar, P. Ecotoxicological Effects of Microplastics on Biota: A Review. Env. Sci. Pollut. Res. 2018, 25, 14373–14396. [Google Scholar] [CrossRef]
  53. Hou, J.; Xu, X.; Yu, H.; Xi, B.; Tan, W. Comparing the Long-Term Responses of Soil Microbial Structures and Diversities to Polyethylene Microplastics in Different Aggregate Fractions. Environ. Int. 2021, 149, 106398. [Google Scholar] [CrossRef]
  54. Ekanayaka, A.H.; Tibpromma, S.; Dai, D.; Xu, R.; Suwannarach, N.; Stephenson, S.L.; Dao, C.; Karunarathna, S.C. A Review of the Fungi That Degrade Plastic. J. Fungi 2022, 8, 772. [Google Scholar] [CrossRef] [PubMed]
  55. Lu, S.; Hao, J.; Yang, H.; Chen, M.; Lian, J.; Chen, Y.; Brown, R.W.; Jones, D.L.; Wan, Z.; Wang, W.; et al. Earthworms Mediate the Influence of Polyethylene (PE) and Polylactic Acid (PLA) Microplastics on Soil Bacterial Communities. Sci. Total Environ. 2023, 905, 166959. [Google Scholar] [CrossRef]
  56. Zhang, G.S.; Liu, Y.F. The Distribution of Microplastics in Soil Aggregate Fractions in Southwestern China. Sci. Total Environ. 2018, 642, 12–20. [Google Scholar] [CrossRef] [PubMed]
Figure 1. Effects of the presence or absence of soil animals and HDPE−MPs on litter mass loss (a), the litter microbial Shannon index (b), the Simpson index (c) and the Chao1 index (d), soil phenol peroxidase activity (Perox) (e), cellobiohydrolase activity (CBH1) (f), β−1,4−xylosidase fungal activity (BX) (g), urease activity (Ure) (h), and acid phosphatase activity (ACP) (i). Asterisks indicate significant differences (* p ≤ 0.05, ** p ≤ 0.01, “ns” p > 0.05) between treatments. The data are presented as the mean values (n = 8). L, litter + soil microbe; LH, litter + soil microbe + HDPE−MPs; LA, litter + soil microbe + soil animals; LHA, litter + soil microbe + HDPE−MPs + soil animals.
Forests 15 00488 g001
Figure 2. Fungal community composition in the four treatment groups. Nonmetric multidimensional scaling (NMDS) ordination of fungal community composition. Asterisks indicate the differences in the NMDS1 and NMDS2 values between different groups and significant differences (** p ≤ 0.01, “ns” p > 0.05). L, litter + soil microbe; LH, litter + soil microbe + HDPE−MPs; LA, litter + soil microbe + soil animals; LHA, litter + soil microbe + HDPE−MPs + soil animals.
Forests 15 00488 g002
Figure 3. Difference in earthworm weight growth rate in the presence (H) or absence (NH) of HDPE−MPs (a). The values represent the means ± SDs (n = 8), and the asterisks indicate significant differences (p < 0.05) between treatments. Litter decomposition in the presence or absence of soil animals and HDPE−MPs treatment soil had an effect on the large aggregate content (b), the values represent the means (n = 8).
Forests 15 00488 g003
Figure 4. Fungal taxonomic composition by amplicon sequence variant (ASV) (a) and the relative abundance of the top 10 fungal phyla (b), classes (c), and genera (d) (%) of the total absolute abundance) among the different treatments. L, litter + soil microbe; LH, litter + soil microbe + HDPE−MPs; LA, litter + soil microbe + soil animals; LHA, litter + soil microbe + HDPE−MPs + soil animals.
Forests 15 00488 g004
Figure 5. LEfSe analysis of fungal biomarkers in the four treatment groups. Linear discriminant analysis (LDA) effect size (LEfSe) algorithm of the fungal community and fungal class according to the original sterilized litter treatment and treatment with or without soil decomposer and HDPE−MPs added during soil decomposition. The different colored regions represent the different treatments. Circles indicate phylogenetic levels from kingdom to genus. The diameter of each circle is proportional to the abundance of the group. LDA scores have a threshold of 3.0. L, litter + soil microbe; LH, litter + soil microbe + HDPE−MPs; LA, litter + soil microbe + soil animals; LHA, litter + soil microbe + HDPE−MPs + soil animals.
Forests 15 00488 g005
Figure 6. Random forest analysis in identifying key class level species between the two groups of samples by their importance value. The names of the two groups are compared in the lower right corner of each picture: L vs. LA (a); LH vs. LHA (b); L vs. LH (c); LA vs. LHA (d). L, litter + soil microbe; LH, litter + soil microbe + HDPE−MPs; LA, litter + soil microbe + soil animals; LHA, litter + soil microbe + HDPE−MPs + soil animals.
Forests 15 00488 g006
Figure 7. Differences in fungal co-occurrence networks among the four litter decomposition treatments. L, litter + soil microbe (a); LH, litter + soil microbe + HDPE−MPs (b); LA, litter + soil microbe + soil animals (c); LHA, litter + soil microbe + HDPE−MPs + soil animals (d).
Forests 15 00488 g007
Table 1. Initial pH and nutrient content of soil. Values are means ± SDs (n = 4).
Initial Soil IndexValues
pH6.49 ± 0.17
Organic carbon (g/kg)27.15 ± 0.86
Total N (g/kg)4.79 ± 0.25
Total P (g/kg)1.08 ± 0.18
Table 2. Pairwise grouped Adonis analyses and p value estimation were performed by employing 999 permutations of the Bray–Curtis distance. Significant (p < 0.05) and marginally significant relationships (italic, p < 0.1) are highlighted in bold. L, litter + soil microbe; LH, litter + soil microbe + HDPE−MPs; LA, litter + soil microbe + soil animals; LHA, litter + soil microbe + HDPE−MPs + soil animals.
PairsdfR2P
L vs. LA10.050.75
L vs. LH10.080.10
L vs. LHA10.070.24
LA vs. LH10.100.04
LA vs. LHA10.090.10
LH vs. LHA10.060.72
Table 3. Co-occurrence network parameters in the four treatments.
Network ParameterLLALHLHA
Node110918878
Edge274596352363
Positive correlation (pink color line)274591352362
Negative relationship (green color line)0501
Mean degree4.98213.09989.308
Network diameter11878
Map density0.0460.1460.0920.121
Modularization0.6850.3810.4640.542
Average clustering coefficient0.450.5940.5230.628
Average path length4.5283.1832.8023.458
Table 4. Trait abundance of litter fungal functions in the four treatments. Values are means (n = 8).
LLALHLHA
Soft Rot0.9788590.9909360.9766110.944328
Blue Rot0.0024790.0017450.0079400.020795
Staining0.0024790.0017450.0079400.020795
Nematode0.0072220.0023610.0025310.006394
trapping fungus0.0072220.0023610.0025310.006394
White Rot0.0015670.0007600.0014210.000741
Brown Rot0.0001710.0000910.0009260.000546
Hypogeous0.0000000.0000000.0001000.000006
Disclaimer/Publisher’s Note: The statements, opinions and data contained in all publications are solely those of the individual author(s) and contributor(s) and not of MDPI and/or the editor(s). MDPI and/or the editor(s) disclaim responsibility for any injury to people or property resulting from any ideas, methods, instructions or products referred to in the content.

