Abstract
The sustainable management of urban green areas requires clear and efficient protocols for measuring the biometric properties of tree vegetation. Specifically, operational in situ sampling solutions are essential to inventory forked (multi-stemmed) trees. This study aimed to assess the efficiency of two different sampling protocols for mean tree diameter at breast height (DBH) measurement of forked urban trees. The protocols were tested on a dataset of 76 forked trees, each having more than three stems and sampled in urban areas of Kyiv, Ukraine. First, we tested the efficiency of mean tree DBH estimations using measurements of randomly selected one, two, or three stems (random sampling, or RSM). Second, we examined different combinations of the thinnest, thickest, and average stems (identified visually) for each tree to estimate mean tree DBH (targeted sampling, or TSM). The distributions of mean tree DBH and root mean square errors (RMSE) were utilized to compare the utility of the two approaches. The TSM of three stems (the thinnest, thickest, and average) provided the highest accuracy of mean tree DBH estimation (RMSE% = 6.3% of the mean), compared to the RSM (RMSE% = 12.1%). The TSM of the four thickest stems demonstrated the overestimation of mean tree DBH for forked trees with five or more stems. Accurate mean tree DBH estimates can be derived with negligible systematic errors applying the RSM over a large number of measured trees. However, these estimates will not likely match the measurements from previous inventories due to random stem selection. We recommend using the TSM with measuring three specific stems as a balanced solution in terms of estimation accuracy, bias, and time costs.
1. Introduction
Urban green infrastructure is a primary source of city ecological capacity and ecosystem services provisioning [1,2]. Ecosystem services provided by urban trees are essential for mitigating city heat islands [3,4], water regulation [5,6,7], carbon sequestration [8,9], and sustaining social and aesthetical benefits for citizens [10,11,12]. The growing human population with the related lack of free land within the urban interface and climate change risks are reasons to manage urban green areas sustainably [13,14,15,16]. Efficient spatial planning and reliable data flows to capture ecosystem service provision need accurate and timely information on urban tree attributes [17,18,19]. Comprehensive tree inventory routines are thus of paramount importance and must be formalized as specific sampling protocols [15,20,21].
Tree inventories in urban settings often include measuring the diameter at breast height (DBH), height, and crown parameters [22]. The DBH is the primary and the most useful biometric tree parameter [23]. This attribute is crucial to deriving growing stock [24], timber volume [25], economic value [10,26], and estimates of provided ecosystem services [5,6,15,27] for individual trees or urban green areas [28] (e.g., parks). Measured DBH values are preferred over indirect estimations [29] since these data are frequently used to approximate other tree parameters [30] (e.g., height [31]). Additionally, the allometric relationships between DBH and tree crown parameters can be used for planning pest control [32] and supporting planting activities [17,33].
Inventorying the tree DBH in urban settings may seem straightforward, but measurement errors are not a rare case [34]. Special equipment is required to gauge trees with large stems [29], and DBH can be overestimated for trees with cracked bark [35]. Additionally, the value of breast height varies among countries and site-specific measurement protocols may be preferred [36]. Another challenge in deriving accurate DBH data is that the workers involved in tree inventories do not possess relevant training or education [37,38]. However, DBH in situ measurement errors are usually ignored and not considered in subsequent estimates [39]. Statistical sampling methods are capable of both reducing the inventory cost and providing more accurate DBH estimates over large green areas [20,21].
Forked, or multi-stemmed trees are a significant component of urban green areas due to their aesthetic appeal and ecosystem functions [36]. Counting and measuring forked trees has always been a subject of debate among researchers and practitioners [37,40]. From a biological perspective, forked trees are considered individual, single-plant organisms. However, aiming to derive mean stem DBH and its derivatives (tree volume, biomass) it is necessary to measure each stem separately. Specifically in Ukraine, forked trees are counted separately if their stems bifurcate below 1.3 m (breast height) [22]. However, official regulations do not clarify in which cases tree stems should be treated as large branches and thus ignored when calculating the mean stem DBH. Importantly, measurements of all stems in forked trees over vast urban green areas are time-consuming and costly. This issue becomes increasingly problematic due to the lack of specific regulations regarding which tree biometric properties are essential for reporting the ecosystem services of urban green areas in Ukraine. Importantly, vast forest park areas, although nominally situated within the administrative boundaries of cities, are inventoried as forests. This practice results in notable discrepancies in the data reported on urban health and sustainability, underscoring the urgent need for clarity and standardization in these measurements. Sampling stems while measuring forked trees has the potential to reduce the cost of urban tree inventories by up to 50% compared to classic routines (measuring all stems) [41]. Stem selection can be either random or targeted [42,43]. The latter will require sampling stems using specific criteria, e.g., the thickest or average stems based on visual examination, and therefore, additional time for training and inventory itself. In this study, we hypothesize that random stem sampling can provide sufficient mean stem DBH estimation for forked trees compared to both targeted sampling and measuring all stems. We inventoried urban forked trees in Kyiv, Ukraine, and predicted the mean stem DBH using different stem number combinations in random sampling and number and visual appearance sets in targeted sampling. Our goal was to establish a transparent and efficient sampling protocol of forked tree inventories in urban settings.
2. Materials and Methods
2.1. Study Location and Collected Data
We have used the dataset of green area inventory carried out within the National University of Life and Environmental Sciences of Ukraine (NUBIP) campus (Kyiv, Ukraine) from 2021 to 2022. This dataset of tree measurements included only plants growing around university buildings in open spaces and did not encompass dense tree cover areas within the campus. In total, 76 forked trees were selected for this study in six sites (Table 1, Figure 1).

Table 1.
Site characteristics in study area.
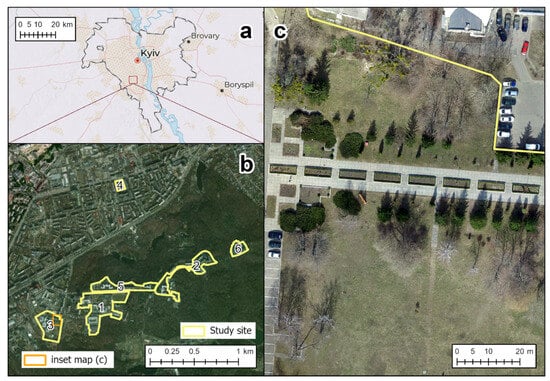
Figure 1.
Study area: (a) location in Kyiv City, Ukraine; (b) six study sites within the university campus; (c) true-color image acquired by unmanned aerial vehicle during the inventory of university green areas in 2021.
The DBH of each tree stem was derived by two perpendicular measurements using a Haglof Mantax Precision Blue 800 mm caliper. We measured the diameters of all stems and main branches (considered as stems) that split below breast height level (1.3 m). Only visually vital branches with a minimum diameter of 1 cm were measured. The mean tree DBH was estimated using Equation (1) based on all measured stem diameters.
where is the mean DBH of a forked tree, cm; is the DBH of each tree stem, cm; is the number of tree stems.
In situ, we have identified 15 tree species of multi-stemmed individuals, including two forms of Northern White Cedar (Thuja occidentalis L.). The latter comprises 68% (52 individuals) of all trees in the study dataset. Their mean and median numbers of stems were 5, and the mode was 4. (Table 2). The average values of DBH equals 13.1 cm and 15.1 cm, respectively (Figure 2).

Table 2.
Description statistics of study dataset.
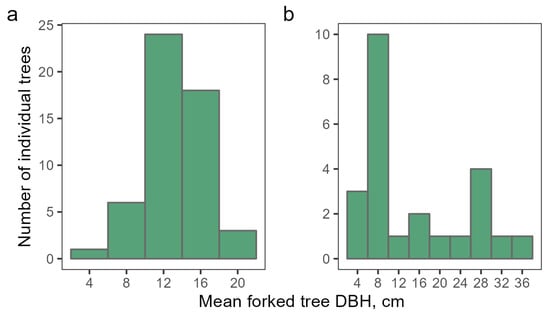
Figure 2.
Mean DBH of measured trees (a—Northern White Cedar; b—other tree species).
2.2. Random Sampling Measurement
We assessed the utility of two different sampling approaches to estimate mean tree DBH, not measuring the DBH for all stems of forked trees. In the first approach, random sampling measurement (RSM), we tested several stem number combinations. We randomly selected one, two, and three stems from each tree, and determined the number of unique random combinations using the factorial function of the binomial coefficient in Equation (2) [44]. Thus, the number of possible combinations depended on the number of tree stems and the number of potentially measured stems of each forked tree (Table 3). We calculated the mean tree DBH separately depending on the number (n = 1, 2, or 3) of randomly selected tree stems.
where is the number of unique combinations; is the number of stems in the forked tree; is the number of stems in the forked tree utilized for calculating the mean tree DBH.

Table 3.
The number of unique combinations for RSM method.
2.3. Targeted Sampling Measurement
In contrast to the RSM approach, in targeted sampling measurement (TSM) we used three different combinations of forked tree stems based on their visual appearance. In the first two options, we considered either only the thickest and thinnest tree stems or added the average tree stem to this set (visually identified). The mean tree DBH of forked trees was computed using Equations (3) and (4).
where is the mean tree DBH of forked tree (cm); is the DBH of the thinnest stem (cm); is the average stem DBH (cm); is the thickest stem DBH (cm).
The third option in the TSM protocol was to estimate mean tree DBH using measurements of the four thickest stems. Here, we justify this option by referring to guidelines provided by the ‘European Consulting Standards in Treework’ working group [29]. This method assumed measuring only the four largest stems of forked trees if the authority, which manages urban green areas, does not require all stems to be measured.
2.4. Statistical Analysis
We calculated standard deviations and absolute errors for each tree in the dataset and every method (three stem number combinations in the RSM approach and three options in the TSM protocol). Empirical distributions of tree mean diameter measurements and estimates derived by both sampling protocols were compared using the two-sample Kolmogorov–Smirnov test [45]. We constructed histograms for visual examination of mean tree DBH distributions. Additionally, we constructed ridge plots to evaluate the distributions of absolute deviations in estimating mean tree DBH by different methods.
The comparison between observed and estimated mean tree DBH was carried out using Equations (5)–(7): coefficient of determination R2, root mean square error (RMSE), and its ratio to mean value in the dataset (RMSE%). We also calculated the descriptive statistics of the distributions obtained, such as standard deviation and percentage accuracy (confidence level = 95%). The number of observations varied depending on the simulation method used, with different numbers of observations for the RSM and TSM protocols.
where is estimated mean tree DBH of forked tree (cm); is observed mean tree DBH of forked tree (cm); represent the mean of observed tree DBH measurements (cm).
All computations and statistical analysis were conducted using the programming language R [46].
3. Results
3.1. Distributions of Estimated Mean Forked Tree DBH
Estimated mean DBH values of forked trees on average were close to observed (measured) data for all sampling methods (Table 4). Statistically estimated distributions were not different from observed mean tree DBH data: p-values (at 95% significance level) varied from 0.19 (RSP, one random stem measured) and 0.46 (RSP, three stems measured) to 0.90 (TSP, the thickest and thinnest stems) and 0.97 (adding the average stem measured). The visual analysis also suggested that estimated distributions were close to those measured in situ for all stems of forked trees (Figure 3). More overestimations could be detected for mean tree DBH data provided by TSP data utilizing the four thickest stems (Figure 4). However, this distribution also did not significantly differ from the field observations (p-value = 0.66). The largest absolute deviations were delivered by RSM methods (Table 4 and Figure 4) due to extreme stem DBH values presented in the study data (Table 2).

Table 4.
Results of estimating mean tree DBH by different protocols.
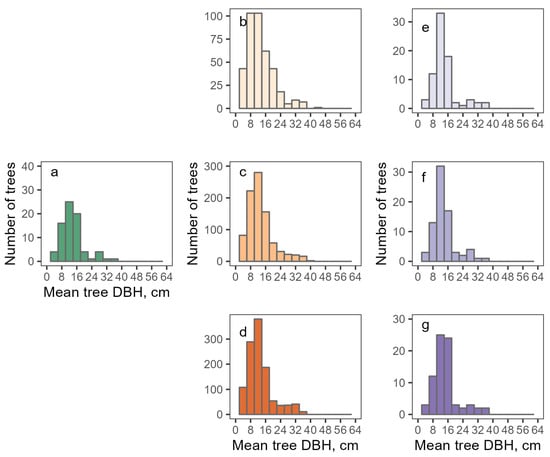
Figure 3.
The distribution of mean forked tree DBH derived by observed data (a) and estimated by (b) the RSM protocol (one stem), (c) the RSM (two stems), (d) the RSM protocol (three stems), (e) the TSM protocol (the thinnest and the thickets stems), (f) the TSM protocol (the thinnest, thickest, and average stems), (g) the TSM protocol (four thickest stems).
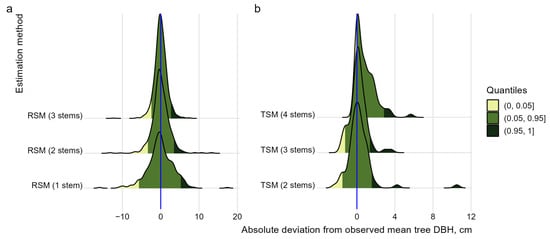
Figure 4.
Ridgeline plots depict densities of mean tree DBH absolute deviations from observed data: (a) RSM estimations, (b) TSM estimations. Blue lines show zero deviation. Maximum positive deviation is limited by 20 cm for RSM approach.
3.2. Accuracy of Estimating Mean Forked Tree DBH
The most accurate results were delivered by the TSM protocol measuring the thickest, thinnest, and average stems of a forked tree (Table 4). Although RMSE% for Northern White Cedar was similar considering this method (5.3% of the mean) and selecting only the thickest and thinnest stems (6.2%), the first method was superior for other tree species (7.7% vs. 16.2%). The values of mean tree DBH estimated by RSM methods had the highest variation (Figure 5). Specifically, the selection of only one stem resulted in an RMSE% of 24.7% of the mean for Northern White Cedar and 33.7% for other tree species (Table 4). However, the increase in selected randomly measured stems to three resulted in an RMSE% = 12.8% for tree species except Northern White Cedar, which is comparable to TSM methods (Figure 6).
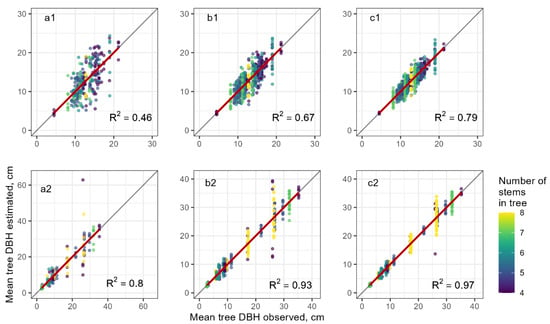
Figure 5.
Scatterplot of estimated vs. observed mean forked tree DBH: (a) RSM (one stem), (b) RSM (two stems), and (c) RSM three stems. Black line corresponds to 1:1 agreement, red line is linear regression. Top (a1—c1)—Northern White Cedar trees, bottom (a2—c2)—other tree species.
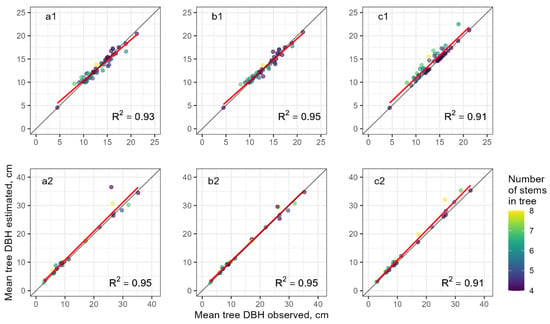
Figure 6.
Scatterplot of estimated vs. observed mean forked tree DBH: (a) the TSM (thickest and thinnest stems), (b) the TSM (thickest, thinnest, and average stems), and (c) TSM (four thickest stems). Black line corresponds to 1:1 agreement, red line is linear regression. Top (a1—c1)—Northern White Cedar trees, bottom (a2—c2)—other tree species.
When selecting one or two random stems (Figure 5a,b), RSP methods could deliver high errors in estimating mean DBH for forked trees with any number of stems. This pattern was softened in the case of measuring three random stems (Figure 5c), but rather for forked trees with four to five stems (purple and dark-blue dots). This RSP method was not sufficient to avoid high errors while measuring forked trees with seven to eight stems (light-green and yellow dots on the graph).
Among the TSP methods, measuring the four thickest stems always led to overestimating the mean tree DBH for forked trees with five or more stems (Figure 6c). On the other hand, methods harnessing the measurement of the thickest and thinnest stems (with optionally adding the average stem) were similar in this regard (Figure 6a,b). Specifically, errors were distributed evenly across the forked trees with any number of stems.
4. Discussion
4.1. Distributions and Accuracy of Estimated Mean Forked Tree DBH
We revealed that the empirical distributions of estimated mean forked DBH delivered by all methods do not significantly change from field observations. No bias was observed except for targeted sampling that assumed measuring the four thickest stems, a method proposed by the ‘European Tree Assessment Standard’ [20]. Based on our field data collection experience, this approach seems to be intuitively clear and simple when working in situ. In contrast, the most accurate sampling method (selecting visually the thickest, thinnest, and average stems) can be compromised in the working environment due to biased choices (what stems to select) of the inventory crew. Targeted sampling proposed by [20] can be less affected by these human biases but will overestimate the mean tree DBH for any forked tree with six or more stems.
The targeted sampling (the thickest, thinnest, and average stems) was the most accurate method for both Northern White Cedar (RMSE% = 5.3%) and other tree species (RMSE% = 7.7%). We obtained similar results for Northern White Cedar trees using only the thickest and thinnest stem DBH measurements, but not for other tree species. In fact, it can be explained by a small intra-tree DBH variability in Northern White Cedar trees. Their stems are rather similar to each other in terms of thickness, which cannot be true for different tree species that we combined into the second group in the study dataset.
Published studies on sampling stems for measuring the mean DBH in forked trees are absent in the literature search. The importance of optimizing inventory costs through stem sampling was recognized in some classic works, but no quantitative results were delivered [40]. In contrast, researchers focused on selecting the best fork height to replace breast height in measuring stem diameters [36]. Existing protocols adopted in the USA were not comprehensively tested in research, e.g., measuring the six thickest stems according to the i-Tree approach [47]. Another option (UFIA Field Guide, [48]) required measuring each stem in the forked tree. However, this protocol specified that stems could be measured only if their individual diameters constituted one-third of the main stem DBH. The ambiguity in defining that ‘main’ stem may lead to both human-induced measurement errors and additional time needed to process one tree.
We revealed that random sampling accuracy was clearly linked to the interaction between the number of stems in a forked tree and the number of stems to be selected. It means that the mean DBH of forked trees with six or more stems will never be correctly measured by applying random sampling. This fact should be considered during urban green area inventories, since practical priority may be given over the targeted sampling due to higher time costs and possible human-induced measurement errors in the latter. However, the random sampling will pose difficulties in the case of repeated forked tree measurements. Roman et al. [37] found out that it is almost impossible to assure adequate estimations of mean tree DBH when stems are randomly selected in two inventories. Based on our findings, this problem will be critical for estimating the mean DBH of trees with a high number of stems even if selecting three random stems.
4.2. Inventory Implications
The variability in the stem diameters of forked trees is a source of uncertainty when sampling methods aiming to reduce inventory costs are applied. However, all methods applying specific stem sampling strategies can deliver human-induced measurement errors. This issue corresponds to selecting both targeted (e.g., visually the thickest and thinnest stems) or random (when carrying out the repetition inventory) stems of forked trees. Additional uncertainty occurs when inventory crews with limited or no training in measuring the tree biometrical parameters work in urban green areas, e.g., when volunteers are involved in urban forest research [49], measurement errors error in the value of inventory parameters should be expected. For example, Cozad [50] showed that the agreement between non-professional foresters and experts can be 76% for diameter measurements, with difficulties arising when measuring inclined, large, or multi-stemmed (forked) trees. A review of other studies confirms that the accuracy of volunteers in determining the diameter of a tree can be ambiguous [51,52,53,54]. In contrast, Roman et al. [37] revealed that the DBH of trees with single stems was measured fairly accurately (by inventory crews consisting of volunteers), but that systematic bias occurred in forked trees.
Meanwhile, our findings suggest that targeted sampling conducted by trained staff accurately replicates the empirical distribution of urban forked trees and delivers high accuracy. Notably, we revealed that applying stem sampling reduced the time costs of individual forked tree inventory from 25% to 40% compared to measuring all stems. Time economy was apparently higher when forked trees had six or more stems, as no more than three stems were sampled for any tree. When random sampling can be faster, larger errors and the impossibility of replicating the measurements during the next inventory only contribute to favoring targeted stem sampling.
5. Conclusions
In this research, we have evaluated six protocols for sampling measurement of the mean DBH of forked trees growing in an urban environment. All the proposed methods were able to replicate empirical mean tree DBH distributions. The targeted stem sampling showed better accuracy than random sampling techniques, and the best results are achieved by selecting the thickest, thinnest, and average stems for both Northern White Cedar and other tree species. However, we did not find specific advantages of the method applied by the ‘European Tree Assessment Standard’ to measure the four thickest stems, but lower DBH estimation accuracy and some systematic bias. We recommend targeted sampling (measuring three specific stems) as an in situ solution, providing up to 40% time economy compared to measuring all the stems in forked trees. However, urban tree inventory managers need to consider the importance of training the inventory staff with the aim of avoiding human-induced measurement errors.
Author Contributions
Conceptualization, A.B. and V.M.; investigation, A.M., M.B. and A.L.; methodology, A.B., A.M., V.M., M.M. and V.S.; formal analysis, A.M., R.Z. and V.M.; validation, R.Z. and A.M.; writing—original draft preparation, R.Z. and A.M.; writing—review and editing, A.B., A.M., V.M. and M.M.; visualization—M.M., R.Z. and A.M.; funding acquisition—M.M., A.B. and V.M.; project administration, A.B. All authors have read and agreed to the published version of the manuscript.
Funding
This research was supported from the Ministry of Science and Education of Ukraine.
Data Availability Statement
Data used in this study and R code are available upon request.
Conflicts of Interest
The authors declare no conflicts of interest.
References
- Pincetl, S. From the Sanitary City to the Sustainable City: Challenges to Institutionalising Biogenic (Nature’s Services) Infrastructure. Local Environ. 2010, 15, 43–58. [Google Scholar] [CrossRef]
- Babí Almenar, J.; Petucco, C.; Sonnemann, G.; Geneletti, D.; Elliot, T.; Rugani, B. Modelling the Net Environmental and Economic Impacts of Urban Nature-Based Solutions by Combining Ecosystem Services, System Dynamics and Life Cycle Thinking: An Application to Urban Forests. Ecosyst. Serv. 2023, 60, 101506. [Google Scholar] [CrossRef]
- Akbari, H.; Pomerantz, M.; Taha, H. Cool Surfaces and Shade Trees to Reduce Energy Use and Improve Air Quality in Urban Areas. Sol. Energy 2001, 70, 295–310. [Google Scholar] [CrossRef]
- Lee, S.; Moon, H.; Choi, Y.; Yoon, D.K. Analyzing Thermal Characteristics of Urban Streets Using a Thermal Imaging Camera: A Case Study on Commercial Streets in Seoul, Korea. Sustainability 2018, 10, 519. [Google Scholar] [CrossRef]
- Pataki, D.E.; Carreiro, M.M.; Cherrier, J.; Grulke, N.E.; Jennings, V.; Pincetl, S.; Pouyat, R.V.; Whitlow, T.H.; Zipperer, W.C. Coupling Biogeochemical Cycles in Urban Environments: Ecosystem Services, Green Solutions, and Misconceptions. Front. Ecol. Environ. 2011, 9, 27–36. [Google Scholar] [CrossRef]
- Haase, D.; Larondelle, N.; Andersson, E.; Artmann, M.; Borgström, S.; Breuste, J.; Gomez-Baggethun, E.; Gren, Å.; Hamstead, Z.; Hansen, R.; et al. A Quantitative Review of Urban Ecosystem Service Assessments: Concepts, Models, and Implementation. AMBIO 2014, 43, 413–433. [Google Scholar] [CrossRef] [PubMed]
- Livesley, S.J.; McPherson, E.G.; Calfapietra, C. The Urban Forest and Ecosystem Services: Impacts on Urban Water, Heat, and Pollution Cycles at the Tree, Street, and City Scale. J. Environ. Qual. 2016, 45, 119–124. [Google Scholar] [CrossRef] [PubMed]
- Feshchenko, R.; Kovbasa, Y.; Matashuk, R.; Bilous, S.; Naumovska, O.; Bilous, A. Current Increment of Ecosystem Services in Permanent Sample Plots within the Forest Stands of the Feofania Park-Monument. Ukr. J. For. Wood Sci. 2023, 14, 88–102. [Google Scholar] [CrossRef]
- Bilous, A.; Matsala, M.; Radchenko, V.; Matiashuk, R.; Boiko, S.; Bilous, S. Coarse Woody Debris in Mature Oak Stands of Ukraine: Carbon Stock and Decomposition Features. For. Ideas 2019, 25, 196–219. [Google Scholar]
- Fruth, E.; Kvistad, M.; Marshall, J.; Pfeifer, L.; Rau, L.; Sagebiel, J.; Soto, D.; Tarpey, J.; Weir, J.; Winiarski, B. Economic Valuation of Street-Level Urban Greening: A Case Study from an Evolving Mixed-Use Area in Berlin. Land Use Policy 2019, 89, 104237. [Google Scholar] [CrossRef]
- Mundher, R.; Abu Bakar, S.; Al-Helli, M.; Gao, H.; Al-Sharaa, A.; Mohd Yusof, M.J.; Maulan, S.; Aziz, A. Visual Aesthetic Quality Assessment of Urban Forests: A Conceptual Framework. Urban Sci. 2022, 6, 79. [Google Scholar] [CrossRef]
- Gatalska, N.; Oleksiichenko, N. Methodological Approaches to Assess the Aesthetics of Park Environment. For. Ideas 2018, 24, 141–162. [Google Scholar]
- Escobedo, F.J.; Wagner, J.E.; Nowak, D.J.; De La Maza, C.L.; Rodriguez, M.; Crane, D.E. Analyzing the Cost Effectiveness of Santiago, Chile’s Policy of Using Urban Forests to Improve Air Quality. J. Environ. Manag. 2008, 86, 148–157. [Google Scholar] [CrossRef] [PubMed]
- Silvera Seamans, G. Mainstreaming the Environmental Benefits of Street Trees. Urban For. Urban Green. 2013, 12, 2–11. [Google Scholar] [CrossRef]
- Matsala, M.; Bilous, A.; Feshchenko, R.; Matiashuk, R.; Bilous, S.; Kovbasa, Y. Spatial and Compositional Structure of European Oak Urban Forests in Kyiv City, Ukraine. J. For. Sci. 2021, 67, 143–153. [Google Scholar] [CrossRef]
- Elbakidze, M.; Dawson, L.; Van Ermel, L.K.; Mikusiński, G.; Hedblom, M.; Korohoda, N.; Kruhlov, I.; Smaliychuk, A.; Kurdadze, T.; Ugrekhelidze, K.; et al. Understanding People’s Interactions with Urban Greenspace: Case Studies in Eastern Europe. Urban For. Urban Green. 2023, 89, 128117. [Google Scholar] [CrossRef]
- Young, R.F. Planting the Living City: Best Practices in Planning Green Infrastructure—Results From Major U.S. Cities. J. Am. Plann. Assoc. 2011, 77, 368–381. [Google Scholar] [CrossRef]
- Marissa Matsler, A. Making ‘Green’ Fit in a ‘Grey’ Accounting System: The Institutional Knowledge System Challenges of Valuing Urban Nature as Infrastructural Assets. Environ. Sci. Policy 2019, 99, 160–168. [Google Scholar] [CrossRef]
- Browning, M.H.E.M.; Locke, D.H.; Konijnendijk, C.; Labib, S.M.; Rigolon, A.; Yeager, R.; Bardhan, M.; Berland, A.; Dadvand, P.; Helbich, M.; et al. Measuring the 3-30-300 Rule to Help Cities Meet Nature Access Thresholds. Sci. Total Environ. 2024, 907, 167739. [Google Scholar] [CrossRef]
- Jaenson, R.; Bassuk, N.; Schwager, S.; Headley, D. A Statistical Method for the Accurate and Rapid Sampling of Urban Street Tree Populations. J. Arboric. 1992, 18, 171–183. [Google Scholar] [CrossRef]
- Maco, S.; McPherson, E.G. A Practical Approach to Assessing Structure, Function, and Value of Street Tree Populations in Small Communities. Arboric. Urban For. 2003, 29, 84–97. [Google Scholar] [CrossRef]
- Bidolakh, D.; Lakyda, P.; Myroniuk, V.; Hayda, Y.; Pidkhovna, S. Assessment and Representation of Urban Trees Ecosystem Services: A Case Study in Pryzamkovyi Park. Folia For. Pol. 2023, 65, 104–116. [Google Scholar] [CrossRef]
- Mäkinen, A.; Holopainen, M.; Kangas, A.; Rasinmäki, J. Propagating the Errors of Initial Forest Variables through Stand- and Tree-Level Growth Simulators. Eur. J. For. Res. 2010, 129, 887–897. [Google Scholar] [CrossRef]
- Tomppo, E.; Gschwantner, T.; Lawrence, M.; McRoberts, R.E. (Eds.) National Forest Inventories: Pathways for Common Reporting; Springer: Berlin/Heidelberg, Germany, 2010; ISBN 978-90-481-3232-4. [Google Scholar]
- Panagiotidis, D.; Abdollahnejad, A. Reliable Estimates of Merchantable Timber Volume from Terrestrial Laser Scanning. Remote Sens. 2021, 13, 3610. [Google Scholar] [CrossRef]
- Myroniuk, V.; Bilous, A.; Lakyda, P.; Lesnik, O.; Burianchuk, M.; Svynchuk, V.; Bychenko, V.; Tyshchenko, O.; Zadorozhniuk, R.; Soshenskyi, O.; et al. Taper Equations for Eight Major Forest Tree Species in Flat Land Ukraine. For. Int. J. For. Res. 2023, 96, 498–508. [Google Scholar] [CrossRef]
- Aulia, R.; Kaswanto; Arifin, H.; Mosyaftiani, A.; Syasita, N.; Wahyu, A.; Wiyoga, H. Assessing the Benefits and Management of Urban Forest in Supporting Low Carbon City in Jakarta, Indonesia. Biodiversitas 2023, 24, 6151–6159. [Google Scholar] [CrossRef]
- Morgenroth, J.; Nowak, D.; Koeser, A. DBH Distributions in America’s Urban Forests—An Overview of Structural Diversity. Forests 2020, 11, 135. [Google Scholar] [CrossRef]
- Working group “European Consulting Standards in Treework—ECoST”. 2023. European Tree Assessment Standard (First Draft). Available online: https://files.site.forpsi.com/a6/49/a649b734-7d2d-423e-a5a1-3b2e9f8c0604.pdf (accessed on 17 January 2024).
- McHale, M.R.; Burke, I.C.; Lefsky, M.A.; Peper, P.J.; McPherson, E.G. Urban Forest Biomass Estimates: Is It Important to Use Allometric Relationships Developed Specifically for Urban Trees? Urban Ecosyst. 2009, 12, 95–113. [Google Scholar] [CrossRef]
- Vaz Monteiro, M.; Doick, K.J.; Handley, P. Allometric Relationships for Urban Trees in Great Britain. Urban For. Urban Green. 2016, 19, 223–236. [Google Scholar] [CrossRef]
- Scarmana, G.; McDougall, K. Assessing the relationship between tree dimensions in an urban environment. Int. Arch. Photogramm. Remote Sens. Spat. Inf. Sci. 2023, XLVIII-1/W1-2023, 437–442. [Google Scholar] [CrossRef]
- Burghardt, K.T.; Avolio, M.L.; Locke, D.H.; Grove, J.M.; Sonti, N.F.; Swan, C.M. Current Street Tree Communities Reflect Race-based Housing Policy and Modern Attempts to Remedy Environmental Injustice. Ecology 2023, 104, e3881. [Google Scholar] [CrossRef]
- Luoma, V.; Saarinen, N.; Wulder, M.; White, J.; Vastaranta, M.; Holopainen, M.; Hyyppä, J. Assessing Precision in Conventional Field Measurements of Individual Tree Attributes. Forests 2017, 8, 38. [Google Scholar] [CrossRef]
- Zadorozhniuk, R.M.; Bilous, A.M. Aboveground live biomass of ancient common oak trees. For. Landsc. Gard. 2019, 15. Available online: http://journals.nubip.edu.ua/index.php/Lis/article/view/13103 (accessed on 18 January 2024).
- Magarik, Y.A.S.; Roman, L.A.; Henning, J.G. How Should We Measure the DBH of Multi-Stemmed Urban Trees? Urban For. Urban Green. 2020, 47, 126481. [Google Scholar] [CrossRef]
- Roman, L.A.; Scharenbroch, B.C.; Östberg, J.P.A.; Mueller, L.S.; Henning, J.G.; Koeser, A.K.; Sanders, J.R.; Betz, D.R.; Jordan, R.C. Data Quality in Citizen Science Urban Tree Inventories. Urban For. Urban Green. 2017, 22, 124–135. [Google Scholar] [CrossRef]
- Klein, R.W.; McLean, D.C.; Koeser, A.K.; Hauer, R.J.; Miesbauer, J.W.; Salisbury, A.B. Visual Estimation Accuracy of Tree Part Diameter and Fall Distance. J. For. 2022, 120, 483–490. [Google Scholar] [CrossRef]
- Haara, A. Comparing Simulation Methods for Modelling the Errors of Stand Inventory Data. Silva Fenn. 2003, 37, 477–491. [Google Scholar] [CrossRef]
- Stewart, J.L.; Salazar, R. A Review of Measurement Options for Multipurpose Trees. Agrofor. Syst. 1992, 19, 173–183. [Google Scholar] [CrossRef]
- Holmström, H.; Kallur, H.; Ståhl, G. Cost-plus-Loss Analyses of Forest Inventory Strategies Based on kNN-Assigned Reference Sample Plot Data. Silva Fenn. 2003, 37, 381–398. [Google Scholar] [CrossRef]
- Motz, K.; Sterba, H.; Pommerening, A. Sampling Measures of Tree Diversity. For. Ecol. Manag. 2010, 260, 1985–1996. [Google Scholar] [CrossRef]
- Xu, K.; Wang, X.; Liang, P.; Wu, Y.; An, H.; Sun, H.; Wu, P.; Wu, X.; Li, Q.; Guo, X.; et al. A New Tree-Ring Sampling Method to Estimate Forest Productivity and Its Temporal Variation Accurately in Natural Forests. For. Ecol. Manag. 2019, 433, 217–227. [Google Scholar] [CrossRef]
- Algorithmic Combinatorics: Enumerative Combinatorics, Special Functions and Computer Algebra: In Honour of Peter Paule on His 60th Birthday; Pillwein, V., Schneider, C., Eds.; Texts & Monographs in Symbolic Computation; Springer International Publishing: Cham, Switzerland, 2020; ISBN 978-3-030-44558-4. [Google Scholar]
- Schröer, G.; Trenkler, D. Exact and Randomization Distributions of Kolmogorov-Smirnov Tests Two or Three Samples. Comput. Stat. Data Anal. 1995, 20, 185–202. [Google Scholar] [CrossRef]
- R Core Team. R: A Language and Environment for Statistical Computing; R Foundation for Statistical Computing: Vienna, Austria, 2018. [Google Scholar]
- Tree Manuals, Guides & Workbooks. Available online: https://www.itreetools.org/support/resources-overview/i-tree-manuals-workbooks (accessed on 6 February 2024).
- Urban Forest Inventory and Analysis Program. Available online: https://www.fs.usda.gov/research/programs/urbanfia (accessed on 7 February 2024).
- Kitahara, F.; Mizoue, N.; Yoshida, S. Effects of Training for Inexperienced Surveyors on Data Quality of Tree Diameter and Height Measurements. Silva Fenn. 2010, 44, 657–667. [Google Scholar] [CrossRef]
- Cozad, S.K. STRATUM Case Study Evaluation in Minneapolis, Minnesota; University of California: Davis, CA, USA, 2006. [Google Scholar]
- Bloniarz, D.V.; Ryan, D.P. The Use of Volunteer Initiatives in Conducting Urban Forest Resource Inventories. J. Arboric. 1996, 22, 75–82. [Google Scholar]
- Bancks, N.; North, E.; Johnson, G. An Analysis of Agreement Between Volunteer- and Researcher-Collected Urban Tree Inventory Data. Arboric. Urban For. 2018, 44, 73–86. [Google Scholar] [CrossRef]
- Hallett, R.; Hallett, T. Citizen Science and Tree Health Assessment: How Useful Are the Data? Arboric. Urban For. 2018, 44, 236–247. [Google Scholar] [CrossRef]
- Hamilton, K.; Koeser, A.; Landry, S. Accuracy of Volunteer-Derived Data from a Single-Day Inventory Event Built Around a Crowdsourced Tree Mapping Application. Arboric. Urban For. 2018, 44, 248–254. [Google Scholar] [CrossRef]
Disclaimer/Publisher’s Note: The statements, opinions and data contained in all publications are solely those of the individual author(s) and contributor(s) and not of MDPI and/or the editor(s). MDPI and/or the editor(s) disclaim responsibility for any injury to people or property resulting from any ideas, methods, instructions or products referred to in the content. |
© 2024 by the authors. Licensee MDPI, Basel, Switzerland. This article is an open access article distributed under the terms and conditions of the Creative Commons Attribution (CC BY) license (https://creativecommons.org/licenses/by/4.0/).