Article

Geographical Differences Weaken the Convergence Effect of the Rhizosphere Bacteria of Rubber Trees

1
Rubber Research Institute, Chinese Academy of Tropical Agricultural Sciences, Xueyuan Road, Haikou 571737, China
2
School of Tropical Agriculture and Forestry, Hainan University, Haikou 570228, China
3
Hainan Danzhou Tropical Agro-Ecosystem National Observation and Research Station, Danzhou 571737, China
*
Author to whom correspondence should be addressed.
These authors contributed equally to this work.
Forests 2024, 15(3), 415; https://doi.org/10.3390/f15030415
Submission received: 18 January 2024 / Revised: 12 February 2024 / Accepted: 19 February 2024 / Published: 22 February 2024
(This article belongs to the Section Forest Soil)

Abstract

:
The rhizosphere has been observed to both enrich and deplete soil microorganisms, but it remains unclear whether rhizosphere microorganisms of the same species exhibit convergence in different climatic regions. This study employed high-throughput sequencing technology to analyze the bacterial communities in the soil, rhizosphere, and rhizoplane of rubber trees across varying climatic regions. The findings revealed the following: Firstly, the rhizoplane bacteria demonstrated a convergent effect. In Hainan and Xishuangbanna, two core operational classification units (OTUs) were enriched from the soil, while four core OTUs were depleted, indicating that the rhizoplane bacteria were influenced by host regulation and exhibited a certain degree of convergence due to the rhizosphere effect. Secondly, the rhizoplane bacteria exhibited a geographic distribution pattern, with significant differences observed in different climatic regions. Notably, there were significant variations in α- and β-diversity, with Xishuangbanna displaying significantly higher diversity compared to Hainan. Moreover, significant differences were observed at the phylum level in terms of composition. Temperature, soil organic matter, soil total nitrogen, and total phosphorus were identified as the primary factors contributing to these differences. In conclusion, although some convergence was observed in the rhizoplane bacteria, the influence of geographic differences weakened this effect.

1. Introduction

The rhizoplane, which refers to the root surface, is recognized as a crucial microbial hotspot in terrestrial ecosystems, playing a significant role in driving ecological processes in soil microbiology [1]. Previous research has demonstrated that geographic distance is a notable factor in shaping microbial communities [2,3]. However, most studies have primarily focused on soil microbial ecology and diversity, with soil microbial communities exhibiting distinct biogeographic patterns [4]. The composition of soil biological communities at a large spatial scale is influenced by variations in soil and climate conditions, with bacterial communities primarily shaped by the combined effects of spatial distance and environmental factors [5,6,7]. Rhizoplane microorganisms encompass rhizosphere microorganisms that come into contact with the external soil, rhizoplane microorganisms located on the root surface, and endophytic bacteria residing within the root system. Previous studies have indicated that soil and rhizosphere bacteria exhibit geographic variations due to environmental factors [5,8]. Some studies have also suggested that root-associated microorganisms are acquired through both vertical transmission from parent plants and horizontal transmission from the surrounding environment, such as soil and air [9]. While most rhizoplane bacteria originate from the soil and rhizosphere [10,11], research on rhizoplane bacteria has been relatively neglected and rarely reported. Thus, it remains unclear whether rhizoplane bacteria also exhibit large-scale spatial variation.
There is a growing consensus among researchers that host plants and their associated microbial communities form a symbiotic holobiont [12,13,14]. The evolutionary selection between plants and microbes contributes to the overall stability of the host plant system. Root exudates play a crucial role in recruiting both beneficial bacteria and pathogens for microenvironment competition [15,16]. The colonization process of microorganisms is influenced by various plant processes, which act as screening mechanisms. Different microbial groups exhibit varying degrees of enrichment during this process [17]. This phenomenon is referred to as the initial recruitment of soil microorganisms by roots [18]. The rhizoplane, which serves as a critical interface connecting the soil and the internal microbial communities of the root, plays a significant role during the transition from the rhizosphere to the root interior. The composition of the rhizoplane microbial community is affected by the host genotype and root activity, leading to the selection of specific microbial groups from the surrounding soil [19]. While the structure of soil and rhizosphere microbial communities is primarily determined by soil physicochemical properties and climate conditions, which do not vary significantly with changes in species and genotype [20,21], the structure of the rhizoplane microbial community is significantly influenced by species and genotype [22]. Considering these factors, it remains unclear whether single-species rhizoplane microbes exhibit more similar community compositions than soil microbes, even under different geographic locations and climate conditions.
Most studies investigating soil and root microorganisms have primarily focused on temperate trees, deserts, or other plant species [23], thereby limiting our understanding of tropical forests, particularly rubber plantations. Rubber plantations have experienced rapid expansion throughout Southeast Asia in the past two decades [24]. Currently, rubber forests constitute the largest tropical economic forest planted in China and serve as a significant contributor to the agroforestry economy in hot regions [25]. The establishment of rubber plantations has had a profound impact on regional ecosystems. Given the context of ecosystem degradation and global climate change, studying soil and root microorganisms in rubber forests across different climatic regions holds great significance for ecological restoration, preservation, and the enhancement of soil fertility, as well as the biological control of pests and diseases. To the best of our knowledge, existing research has mainly focused on large-scale soil and rhizosphere microorganisms in rubber forests [4,26]. However, limited knowledge exists regarding large-scale investigations of the rhizoplane microbial community. Therefore, it is essential to explore the differences in rhizoplane bacteria in rubber forests across various climatic regions. Previously, we conducted small-scale research on four microenvironments related to rubber tree roots (soil, rhizosphere, rhizoplane, and endosphere), providing fundamental insights into the microbial community of root-associated bacteria and fungi, revealing the plant-soil-driven microbial composition, diversity, and community assemblage in rubber trees. The study confirmed the theoretical concept of bidirectional microbial flow within different compartments of plant root systems, highlighting the filtering effect of plant roots. However, whether there are differences in the large-scale distribution of root-associated microorganisms, especially in the rhizoplane, remains unclear [10].
Therefore, we have formulated the following specific research questions: (i) How do environmental factors affect rubber tree rhizoplane bacteria, leading to variations in the composition of rhizoplane bacteria in different climatic regions? (ii) Considering the monoculture nature of rubber tree plantations, is the rhizoplane regulated by the host’s filtering effect, resulting in similar bacterial community compositions on the rhizoplane of rubber plantations across different climatic regions? To address these hypotheses and research questions, we will employ high-throughput sequencing techniques to investigate the impacts of soil bacteria and the rhizosphere on the composition and diversity of the rhizoplane. Field samples will be collected during both the dry and rainy seasons from rubber tree plantations in Hainan and Xishuangbanna (referred to as Banna). The primary objectives of this research are as follows: (i) To assess the taxonomic composition and diversity variations among bacterial communities in the soil, rhizosphere, and rhizoplane of rubber trees across different climatic regions; (ii) To confirm that rubber tree rhizoplane bacteria are regulated by the host; and (iii) To identify the main factors causing differences in rubber tree rhizoplane bacteria in different climatic regions.

2. Methods

2.1. Study Site

Hainan and Banna are the primary rubber planting regions in China, encompassing more than 90% of the total rubber planting area in the country. These regions exhibit different climatic types. Banna is located in Yunnan province, which experiences a continental monsoon climate and is situated in a calm wind zone with fertile soil. Banna experiences abundant rainfall and sunshine, with an annual precipitation ranging from 1136 to 1513 mm. The average annual temperature in Banna ranges from 18.9 °C to 22.6 °C. The climate in Banna is warm and humid throughout the year, with distinct dry and rainy seasons. On the other hand, Hainan Island specifically has a tropical maritime monsoon climate. Typhoons frequently affect Hainan Island throughout the year. The average annual rainfall on Hainan Island is approximately 1815 mm, with around 84% of the rainfall concentrated during the rainy season. The average annual temperature in this region is approximately 23.5 °C.
Rubber plantations cover approximately 1/4 of the total vegetation area in Hainan and are characterized by their low latitude, low elevation, and tropical island-type characteristics [27]. For this study, we selected rubber plantation samples from the study areas of Danzhou, Ledong, and Wanning in Hainan. Banna’s rubber plantations account for 40% of the total vegetation area in the region. These plantations are characterized by high latitude, high elevation, a tropical inland static wind plantation area type, and fertile soil. For this study, we selected rubber plantation sample plots from the study areas of Jinghong, Mengla County, and Menglun Township in Banna. The three sampling sites in Hainan Island have a tropical maritime monsoon climate with typhoons all year round. The three sampling sites in Banna have to a subtropical continental monsoon climate in a calm wind zone. From Table 1, it can be seen that the annual average atmospheric temperature in Hainan is significantly higher than in Banna. The soil organic matter (SOM), ammonium nitrogen (AN), total nitrogen (TN), and total phosphorus (TP) in Banna are significantly higher than in Hainan.

2.2. Soil Sampling

Our previous research [10] focused on the correlation and assembly mechanisms of root-associated microorganisms in different microenvironments at a small scale with samples collected from four ecological microenvironments (soil, rhizosphere, rhizoplane, and endosphere). In order to illustrate the spatial variations in bacterial communities within the three microenvironments of rubber trees at a large scale, we selected a subset of samples collected by our team from 2019 to 2020 for analysis. The sampling method employed in this study is consistent with the approach described in our team’s previously published articles. We selected soil, rhizosphere, and rhizoplane samples from the collected samples, as described by previous research, for analysis. We separated and compared samples from different climate zones (Hainan and Banna) for analysis. The sampling was conducted across six rubber tree forest sites located in Hainan Island and Banna. Within each region, three specific plots were employed as collection sites for sampling, with samples being taken at intervals of 5–15 km. In Hainan Island, our study sites included Danzhou, Wanning, and Ledong. Similarly, in Banna, our study sites were located in Jinghong, Menglun, and Mengla. These six locations were chosen to cover the primary rubber planting areas in both Hainan and Banna, with three sampling points per location; thus, a total of eighteen sampling points were included (Figure S1). In order to control for the influence of other unrelated factors, all the samples we collected were from the PR107 variety in rubber plantations of the same age.
We selected samples from the soil, rhizosphere, and rhizoplane. Sampling was conducted during both the dry and rainy seasons, specifically in September 2019 and December 2020. At each of these eighteen sampling points, three microenvironmental samples were collected—once during the dry season and once during the rainy season, resulting in a total of 108 samples (18 × 3 × 2 = 108) for analysis. We recorded the latitude, longitude, and elevation of each site. Temperature and rainfall are climate factors, and the information provided in this table is based on the data of annual average rainfall and air average temperature provided by the National Meteorological Center (https://data.cma.cn/). In order to better illustrate our scientific question, we will divide the samples from different seasons and sampling points into two regions: Hainan and Banna. Samples from the same climate zone and microenvironment are considered repeated samples (n = 18), with 54 samples in each climate region, totaling 108 samples, for subsequent sequencing and data analysis (Table S3).

2.3. DNA Extraction and Illumina Sequencing

To extract microbial DNA from 0.5 g of soil, we utilized the E.Z.N.A.® Soil DNA Kit (Omega Bio-tek, Norcross, GA, USA) following the manufacturer’s instructions. For bacterial DNA, PCR primers 515FmodF (5’-GTGYCAGCMGCCGCGGTAA-3’) and 806RmodR (5’-GGACTACNVGGGTWTCTAAT-3’) were used to amplify the V4 hypervariable region of the 16S rRNA gene [28]. The PCR protocol was comprised of an initial denaturation at 95 °C for 3 min, followed by 27 cycles of denaturation at 95 °C for 30 s, annealing at 55 °C for 30 s, and elongation at 72 °C for 45 s, with a final extension at 72 °C for 10 min. The purified amplicons were pooled in equimolar ratios and subjected to paired-end sequencing (2 × 250) on the Illumina MiSeq platform at Shanghai Majorbio Bio-pharm Biotechnology Co., Ltd. (Shanghai, China) using standard protocols. The raw reads were deposited in the National Center for Biotechnology Information Sequence Read Archive Database under Accession Number SRP342019 [10,29].

2.4. Soil Physical and Chemical Property Determination

Samples were analyzed using the standard soil test method proposed by Ru-Kun Lu (1999) [30]. Nitrate nitrogen (NN) was measured by water distillation; ammonium nitrogen (AN) was determined by the indophenol blue colorimetric method; soil total nitrogen (TN) was measured by the semi-micro Kjeldahl method; soil water content (WC) was determined by weight method; total phosphorus (TP) and total potassium (TK) values were determined by the NaOH digestion method; soil samples were extracted with NaHCO3; soil available phosphorus (AP) was determined by the molybdenum blue colorimetric method; soil organic matter (SOM) was determined by the potassium dichromate volumetric method; soil pH was measured in a 1:1 soil/water mixture; and soil available potassium (AK) was determined by first extracting the soil with ammonium acetate and then loading the extract onto an atomic absorption spectrometer using ascorbic acid as a reducing agent [10,29,31].

2.5. Data Analysis

The original fastq files were separated and underwent quality filtering using QIIME [32] (version 1.17). Operational classification units (OTUs) were clustered using UPARSE [33] (version 7.1) with a similarity threshold of 97%, and chimeric sequences were detected and eliminated using UCHIME. Each OTU representative sequence was evaluated for classification by RDP classifier version 2.2 [34] against the SILVA (https://www.arb-silva.de/) 16S rRNA databases, utilizing a certainty threshold of 0.7 [35].
The soil physical and chemical properties data were presented as “mean ± standard deviation”, and the experimental data were subjected to a Levene’s test using SPSS 26.0 software (New York, NY, USA) and a T-test for homogeneity of variance, which was not consistent with the nonparametric test. Most data analyses were performed on the R software platform (version 4.3.0). Fold change (FC) was defined as the ratio of microbial abundance in specific microenvironments in Banna to microbial abundance in specific microenvironments in Hainan. Those with an FC greater than 1 and p < 0.05 were considered enriched OTUs, while those with an FC below 1 and p < 0.05 were considered depleted OTUs. Then, using the ggplot2 package in the R, volcano plots were used to illustrate the enrichment of each microenvironment in Banna compared to Hainan and depletion patterns. We evaluated the diversity of soil bacterial communities in three microenvironments within the rubber tree community. The Sobs index was utilized to assess the α-diversity. The Bray–Curtis distance matrix was used in principal coordinate analysis (PCoA) to visualize variations in the composition of bacterial communities. Additionally, the “Vegan” package in the R environment’s ANOSIM function was used to perform similarity analysis. An additional 999 permutations were used to evaluate ANOSIM. The number of cumulative OTUs of all samples was used to estimate the γ-diversity of soil rhizosphere and rhizoplane bacteria of rubber trees in different climatic regions [18]. We established the definition of a core bacterial OTU as follows: (i) it must be present in all samples from each microenvironment and (ii) its relative abundance must be greater than 0.1% [36,37]. Ultimately, we constructed a phylogenetic tree for all core bacterial OTUs of Hainan and Banna within each microenvironment using the Majorbio I-Sanger cloud platform (i-sanger.com) and subsequently visualized it through ITOL [38]. By calculating the correlation coefficients (Spearman rank correlation coefficients) between the environmental factors and the selected species, the obtained numerical matrix was visualized by Heatmap plots. To unravel the origins of intricate microbial communities, we employed fast expectation-maximization microbial source tracking (FEAST) within R [10,39]. Prior to distance calculations, environmental data were standardized using z-scores. For compositional and environmental data, we employed Euclidean distances, while Haversine distances were used for geographic data. Using these distance matrices, we conducted partial Mantel correlations (9999 permutations) between compositional and environmental data, considering the geographic distance, using the Vegan R (4.3.0) software package [40]. In addition, we computed Spearman correlations between the relative abundance of the main phyla and soil properties. To assess the significance of soil physicochemical properties in explaining dissimilarities in microbial communities and the relative abundance of selected phyla, we utilized the multiple regression model (lm function in the “Stats” package in R) along with variance decomposition analysis (calc.relimp function in the “Relaimpo” package in R) [41]. Supplemental analysis using RDA was conducted to elucidate the relationship between bacterial communities and environmental factors.

3. Results

3.1. Community Composition

At the OTU level, there was overlap of OTUs between rhizoplane bacteria and both soil and rhizosphere bacteria. This overlap was consistent across different climatic regions. In Hainan, 66.76% of the OTUs in the soil were shared with the rhizosphere bacteria, while in Banna, this shared OTU percentage was 73.39%. Similarly, in Hainan, the rhizoplane bacteria shared 61.51% of the OTUs with the soil bacteria, while in Banna, this shared OTU percentage was 68.44% (Figure 1A). These findings confirm that rhizosphere bacteria are a subset of soil bacteria, and the microbial composition of rhizosphere bacteria is highly similar to that of soil, indirectly indicating the presence of rhizosphere effects in different climatic regions.
There are 2114 unique operational taxonomic units (OTUs) in the rhizosphere of Hainan, accounting for 12.22% of the total. There are 4480 unique OTUs in the rhizosphere of Banna, accounting for 25.89% of the total. There are 10,707 rhizosphere OTUs shared by both Hainan and Banna, accounting for 61.89% of the total. In the rhizoplane of Hainan, there are 2166 unique OTUs, accounting for 13.22% of the total. In the rhizoplane of Banna, there are 4509 unique OTUs, accounting for 27.29% of the total. There are 9845 rhizoplane OTUs shared by both Hainan and Banna, accounting for 59.60% of the total. This indicates that there are differences in the presence of rhizoplane bacteria across different climatic regions (Figure S2A).
At the phylum level, the relative abundance ratios of soil, rhizosphere, and rhizoplane bacteria in the dominant bacterial phyla are similar within the same climatic region, which also suggests that rhizoplane bacteria may be influenced by soil and rhizosphere bacteria (Figure 1B). Significant differences in abundance (p < 0.05) were observed for Acidobacteria (Soil: 95%CI, 1.83–7.53; Rhizosphere: 95%CI, 1.16–6.18; Rhizoplane: 95%CI, 2.76–7.95) and Firmicutes (Soil: 95%CI, −16.34–−5.16; Rhizosphere: 95%CI, −19.89–−3.82; Rhizoplane:95%CI, −21.23–−5.16) among the three microenvironments in different climatic regions. The difference in Chloroflexi between Hainan and Banna in soils and rhizospheres was not significant. Additionally, Chloroflexi also exhibited significant differences in abundance among rhizoplane bacteria from different climatic regions (95%CI, 1.02–5.92) (Figure S2B), which indicates a significant diversity of rhizoplane bacteria in different climatic regions at the phylum level.
The FEAST analysis results reveal obvious species exchange among the three microenvironments of rubber tree roots. Over 50% of bacteria in the soil microenvironment are derived from the rhizosphere and rhizoplane microenvironments, while more than 50% of bacteria in the rhizosphere microenvironment originate from the soil and rhizoplane. Notably, the rhizosphere microenvironment contains a higher proportion of soil bacteria compared to the rhizoplane, suggesting that soil bacteria undergo filtering and screening processes in the rhizosphere and rhizoplane microenvironment, thus contributing to the formation of rhizoplane bacteria. This assembly pattern of rhizoplane bacteria is observed in both Hainan and Banna—two distinct climatic regions. Approximately 30% and 28% of rhizoplane bacteria in Hainan and Banna, respectively, originate from rhizosphere bacteria, while 18% and 19% come from soil bacteria, which confirms that a large proportion of rhizoplane bacteria indeed originate from the soil and rhizosphere microenvironment. This also indirectly indicates that rhizoplane bacteria may be influenced by soil and rhizosphere bacteria (Figure 1C).

3.2. Community Diversity

This study uncovered significant differences in the richness of OTUs within all three microenvironments (soil, rhizosphere, and rhizoplane) across different climatic regions, as indicated by the Sobs index (Figure 2A). Significant differences were observed in the beta-diversity of samples from bacterial communities in all three microenvironments (soil, rhizosphere, and rhizoplane) in different climatic regions. All difference results were significant (p < 0.05) (Figure 2B). Furthermore, the results showed that the γ-diversity of Banna was higher than that of Hainan in all three microenvironments (Figure 2C).

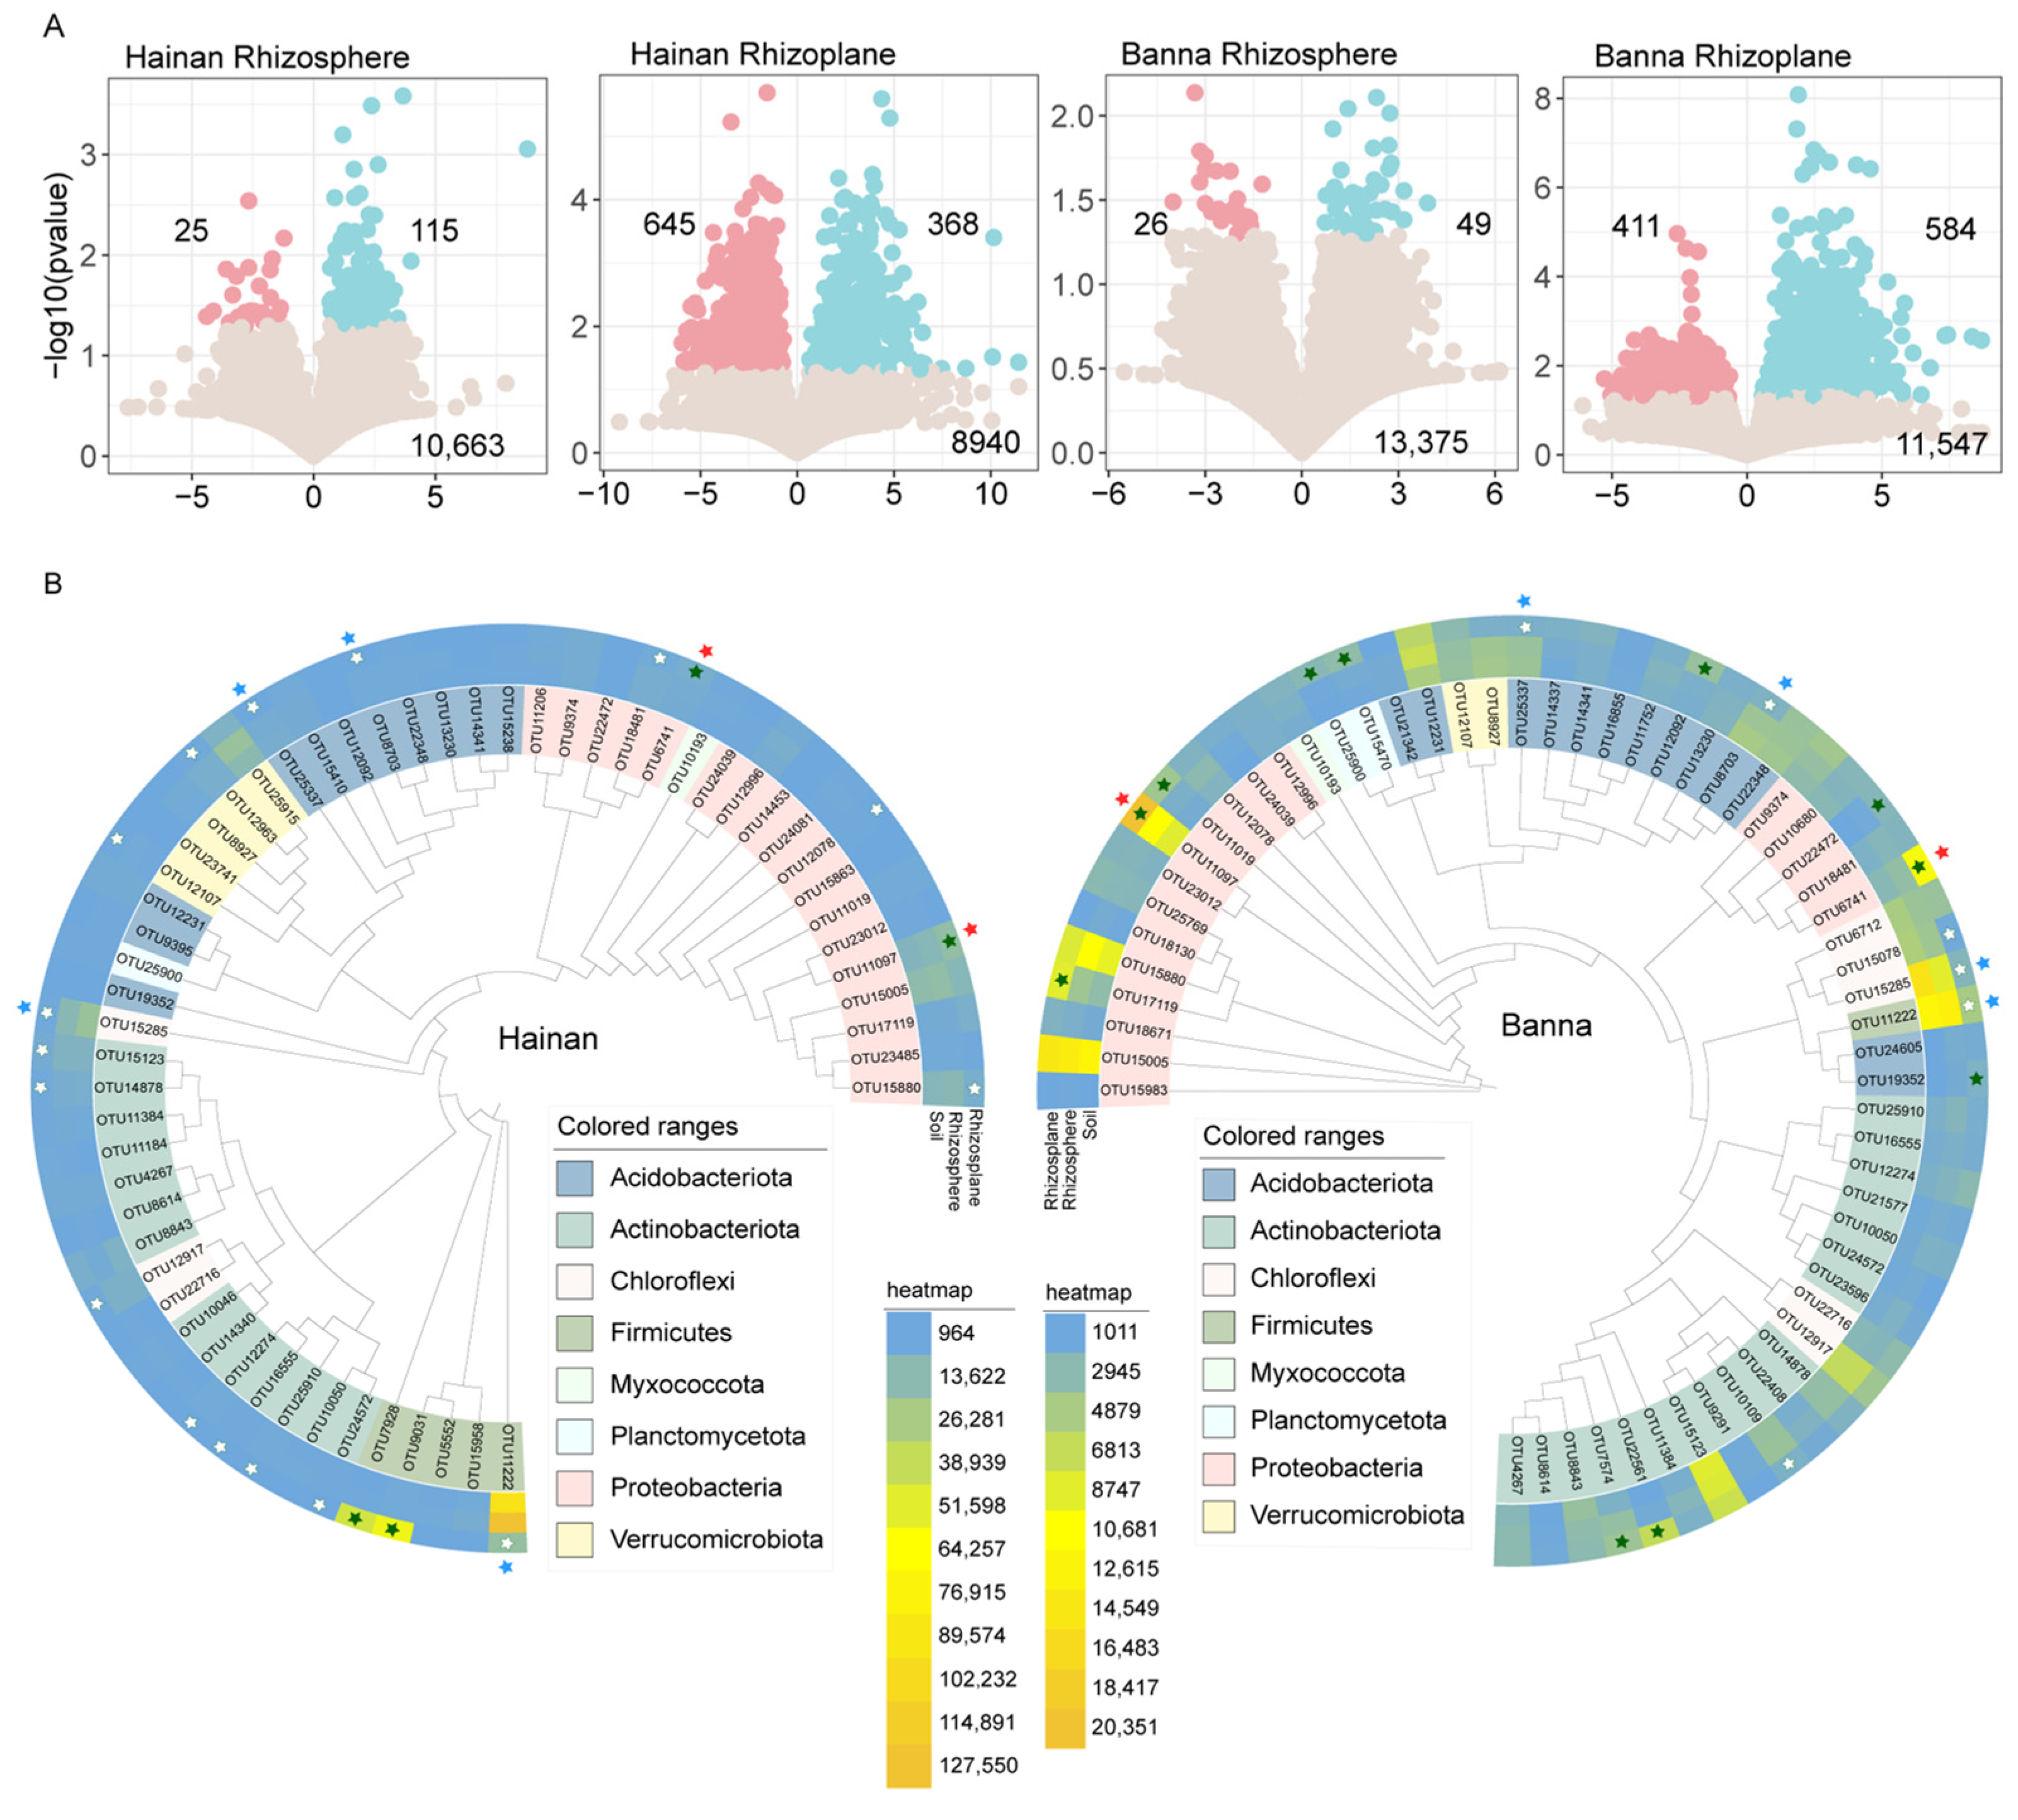
3.3. Enriched and Depleted OTUs

This study revealed that the rhizoplane had more enriched and depleted soil bacteria than the rhizosphere, and the plant rhizoplane showed strong enriched and depleted bacteria in different climatic regions. In Hainan, 115 OTUs were enriched and 25 OTUs were filtered from the soil in the rhizosphere of rubber trees, while 368 OTUs were enriched and 645 OTUs were depleted from the soil in the rhizoplane. In Banna, 49 OTUs were enriched and 26 OTUs were depleted from the soil in the rhizosphere of rubber trees, while 584 OTUs were enriched and 411 OTUs were depleted from the soil on the rhizoplane (Figure 3A).
The enriched and depleted core OTUs showed relatively close clustering within the phylogenetic tree (Figure 3B). Bacteria were screened for core OTUs with a relative abundance >0.1% and occurring in every sample. In Hainan, 58 OTUs were screened, with 4 rhizoplane-enriched OTUs in Proteobacteria (2 OTUs) and Firmicutes (2 OTUs), while the depleted OTUs belonged to Proteobacteria (3 OTUs), Actinobacteriota (6 OTUs), Chloroflexi (2 OTUs), Acidobacteriota (2 OTUs), Verrucomicrobiota (2 OTUs), and Firmicutes (1 OTU) from soil. In Banna, 60 OTUs were screened, with Banna’s 11 rhizoplane-enriched OTUs belonging to Proteobacteria (5 OTUs), Planctomycetota (2 OTUs), Acidobacteriota (2 OTUs), and Actinobacteria (2 OTUs), while the 6 depleted OTUs belonged to Acidobacteriota (2 OTUs), Chloroflexi (2 OTUs), Actinobacteria (1 OTU), and Firmicutes (1 OTU) from soil.
There were two common OTUs (OTU11097 and OTU6741) enriched from soil and four common OTUs (OTU8703, OTU25337, OTU15285, and OTU11222) depleted from soil in the rhizoplane core bacteria of Hainan and Banna. The two OTUs that are co-enriched are both Proteobacteria—one is Bradyrhizobium and the other is Acidibacter. The four OTUs that are co-depleted are Acidobacteriota, Chloroflexi, and Firmicutes (Table S2).

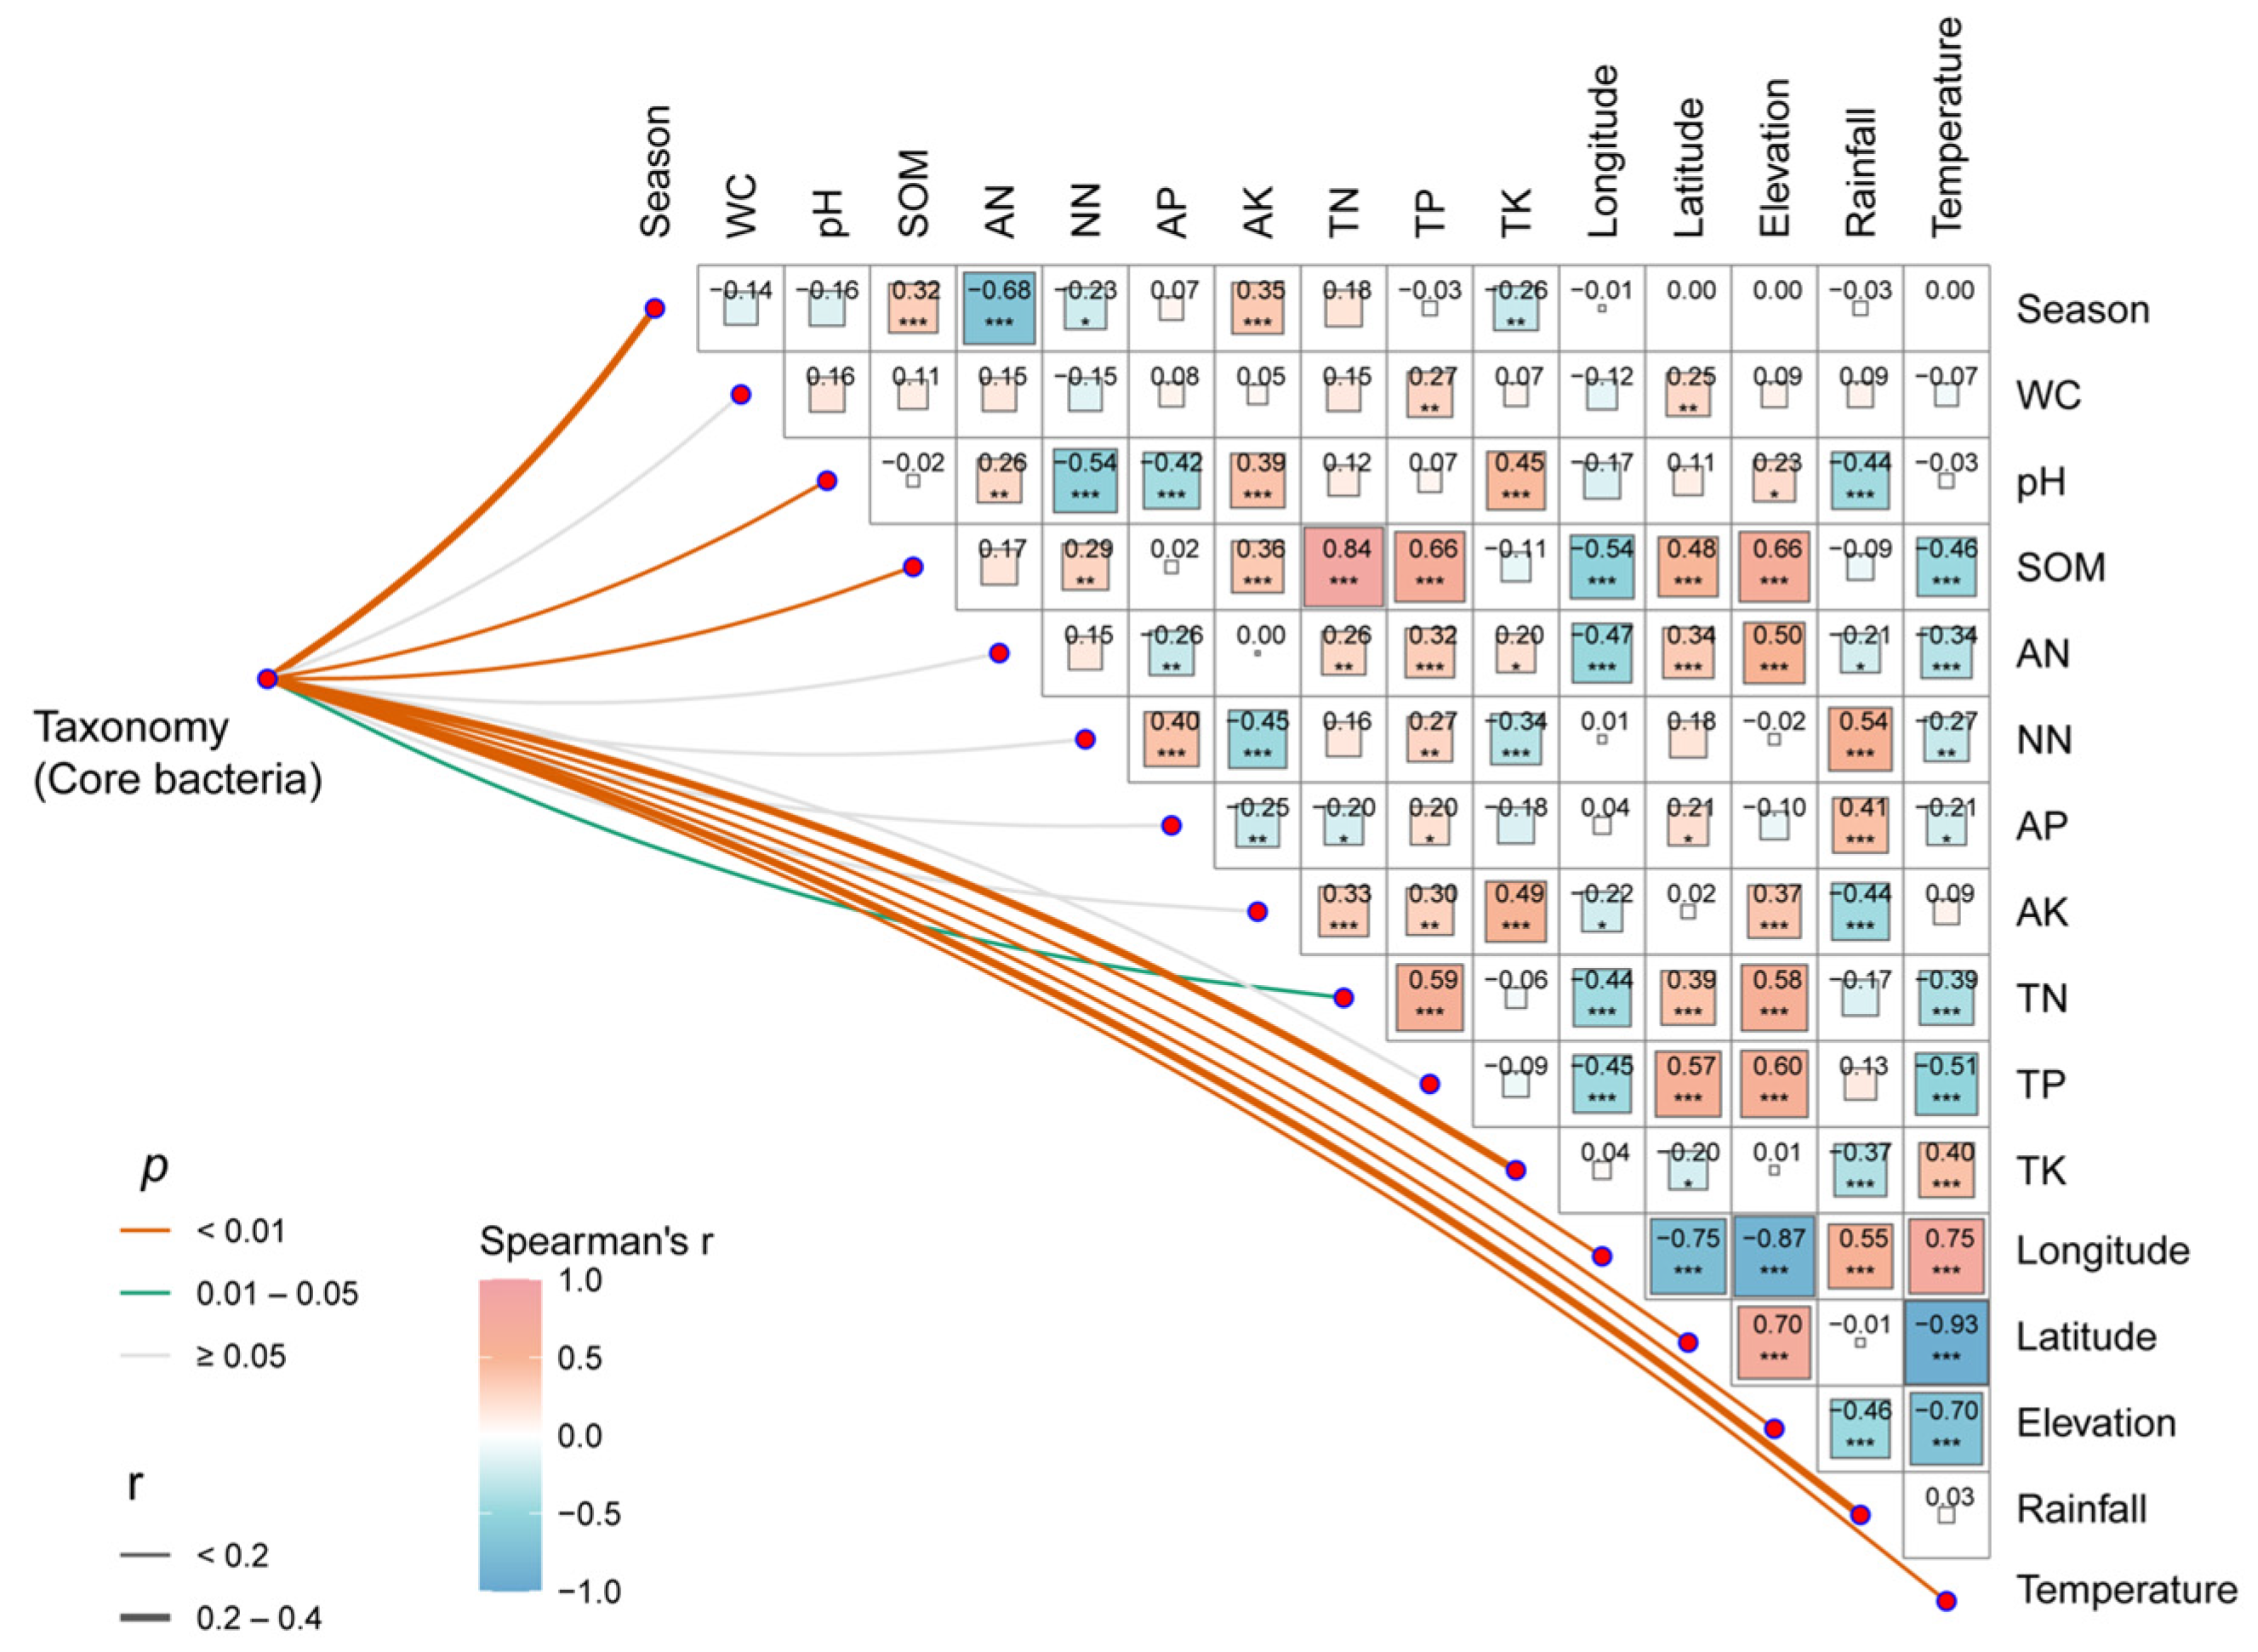
3.4. Correlation of Bacterial Communities with Environmental Factors

This research uncovered significant correlations (p < 0.05) between the abundance of core bacteria and pH, SOM, TN, TK, elevation, rainfall, and temperature (Figure 4). The results of the RDA analysis of the total community also demonstrated a significant correlation between SOM, temperature, TK, TN, TP, elevation, longitude, latitude, and the rhizosphere bacterial community of rubber trees. Of these factors, SOM was found to have the highest correlation (r2 = 0.229, p < 0.001), followed by temperature (r2 = 0.178, p < 0.001) (Figure S4, Table S1).
The results showed a significant negative correlation between alpha-diversity and temperature, AP, and NN, while a significant positive correlation was observed with AK and pH in Hainan and Banna (Figure S5).
Additionally, it was observed that Proteobacteria and Actinobacteriota did not exhibit any significant correlations with environmental factors. However, Acidobacteria, Chloroflexi, Firmicutes, and Planctomycetota demonstrated significant associations with environmental factors. Specifically, Acidobacteria and Firmicutes were influenced to the greatest extent by environmental factors. Acidobacteria showed a high contribution from season and TN, exhibiting a significant positive correlation with TN and season. Firmicutes displayed a high contribution from season, SOM, and temperature, exhibiting a notable positive association with temperature while displaying a significant negative association with SOM. Chloroflexi exhibited a high contribution from TP and showed a significant positive correlation with TN (Figure S6).

4. Discussion

4.1. Convergent Effect of Rhizoplane Bacterial Community

Through the collection of soil, rhizosphere, and rhizoplane samples from rubber tree plantations in Banna and Hainan during both dry and rainy seasons, and subsequent high-throughput sequencing analysis, our findings reveal an overlap of operational taxonomic units (OTUs) between rhizoplane bacteria and soil bacteria in both locations (Figure 1A). This suggests a substantial similarity between rhizoplane and soil bacteria. The relative abundance ratios of soil, rhizosphere, and rhizoplane bacteria in the dominant bacterial phyla are similar within the same climatic region, which also suggests that rhizoplane bacteria may be influenced by soil and rhizosphere bacteria (Figure 1B). Rhizosphere microorganisms represent a subset of soil microorganisms, and previous research has suggested that rhizoplane communities are a random subset of rhizosphere communities [10,11,42]. Our results support these conclusions. Previous studies also have indicated the presence of shared bacterial taxa among diverse plant species and soil types, indicating a level of convergence among bacterial groups in different rhizospheres [12,18]. Soil microorganisms can be transported to plants either directly or indirectly, such as through root systems or via raindrop splashing [9]. The results of the FEAST model tracing analysis confirm that a large proportion of rhizoplane bacteria indeed originate from the soil and rhizosphere microenvironment. While the unknown sources may include vertical transmission from parental inheritance and horizontal transmission from aboveground parts [9,10,31] (Figure 1C). This point is further supported by the results of the subsequent analysis, shown in Figure 3. Interestingly, we observed that the filtering effect of the rubber tree rhizoplane on soil bacteria is stronger than that of the rhizosphere (Figure 3A). This finding suggests that soil and rhizosphere bacteria undergo a layered filtering and screening process within the microenvironment, resulting in the assembly of a portion of these bacteria as part of the rhizoplane microbiota. Importantly, this phenomenon is consistent across different climatic regions. Thus, this assembly mechanism is not influenced by climatic regions. In Figure 3B, the results of core bacteria analysis reveal that in different climatic regions, the rhizoplane bacteria have two shared OTUs enriched from the soil and four shared depleted OTUs, indicating a convergence of rhizoplane bacteria influenced by the rhizosphere effect. This validates previous research showing that rhizosphere microorganisms are selected from the local rhizoplane species pool based on their preferences for specific microenvironments [34]. We postulate that this may be attributed to the strong regulation of the rhizosphere species pool by genetic factors and root secretions specific to rubber trees as a single plant species, selectively enriching certain “preferred” bacteria and leading to a degree of homogeneity in rhizoplane bacterial communities. These findings further validate the theory that host plants exert selective effects on rhizosphere and rhizoplane bacteria [43,44]. Based on the above analysis, it can be concluded that the composition of the rubber tree rhizoplane bacterial community is influenced to some extent by the rhizosphere effect.

4.2. Geographical Effect of Rhizoplane Bacterial Community

However, in contrast to studies conducted on Arabidopsis root microbes [45], our findings regarding the composition and diversity of rubber tree rhizoplane bacteria did not exhibit a significant convergence effect [44,46,47,48]. Instead, similar to other research [49], we observed notable differences in both composition and diversity between rhizoplane bacterial communities in Hainan and Banna. These two regions represent distinct climatic regions (Figure S1), characterized by significant geographic distances, contrasting soil characteristics, and divergent microbial communities in the surrounding soils. In the rhizoplane of Hainan, there are 2166 unique OTUs, accounting for 13.22% of the total. In the rhizoplane of Banna, there are 4509 unique OTUs, accounting for 27.29% of the total. This indicates that there are differences in the presence of rhizoplane bacteria across different climatic regions (Figure S2A). Furthermore, Figure S2B further compares the relative abundance of bacterial taxa belonging to dominant phyla in three microenvironments within different climatic regions, and the results show significant differences, which, together with Figure 2, indicate the significant diversity of rhizoplane bacteria in different climatic regions. Therefore, even though the rhizosphere effect exists, the rhizoplane bacteria in different climatic regions are still significantly different.
Multiple studies have indicated that environmental factors can impact soil microbial communities [4,5,8,26], thus indirectly influencing the composition of rhizoplane bacteria. Our findings validate the significant correlation between these environmental factors and the composition of rhizoplane bacteria. Figure S2 illustrates the significant differences in the abundance of soil and rhizoplane bacteria between climatic regions, particularly for Acidobacteria and Firmicutes. Acidobacteria are typically associated with oligotrophic organisms [2], while Firmicutes are known for their rapid growth and symbiotic relationships [50]. In all three microenvironments, the abundance of Acidobacteria in Banna is significantly higher than that in Hainan, which could be attributed to the higher total nitrogen (TN) content in Banna soil (Table 1, Figure S6). Conversely, the abundance of Firmicutes in Hainan is significantly higher than that in Banna, and the abundance of Firmicutes is significantly positively correlated with temperature and significantly negatively correlated with soil organic matter (SOM). Physicochemical analysis reveals that Banna has higher SOM and a lower temperature. The abundance of Chloroflexi is influenced by total phosphorus (TP), with Banna having a higher TP content than Hainan. Therefore, TN, SOM, temperature, and TP are the primary factors driving the interregional differences at the phylum level of rhizoplane bacteria in different climatic regions.
The abundance of core bacteria is significantly correlated with pH, soil organic matter (SOM), total nitrogen (TN), total potassium (TK), elevation, rainfall, and temperature. SOM, TN, and temperature exhibit significant differences across different climatic regions (Figure 4), indicating that SOM and TN are the primary factors influencing the abundance of core bacteria. Redundancy analysis (RDA) of the overall community also revealed significant correlations between SOM, temperature, total potassium (TK), total nitrogen (TN), total phosphorus (TP), elevation, longitude, latitude, and bacterial communities, with SOM showing the highest correlation, followed by temperature (Figure S4, Table S1). Lan et al. (2019) concluded that total nitrogen (TN) is the primary factor influencing the composition of rubber tree soil bacteria, but their study only focused on the soil microenvironment and had a small sample size [4]. In comparison, our study provides a more comprehensive understanding. The observed Sobs index is significantly negatively correlated with temperature, which also explains why the Sobs index of rubber trees in Hainan is significantly lower than that in Banna (Figure 2 and Figure S5). Therefore, the temperature is the primary factor influencing the differences in alpha-diversity among different climatic regions.
In conclusion, our study highlights the significant influence of air temperature, soil organic matter (SOM), total nitrogen (TN), and total phosphorus (TP) on the variation in rhizoplane bacterial communities in rubber tree plantations across different climatic regions. Previous research has demonstrated the influence of plant hosts and soil properties on rhizosphere bacteria [50,51,52,53]. However, we observed notable differences in the composition and diversity of rhizoplane bacterial communities between Hainan and Banna, indicating that while the presence of rubber tree roots enriches and depletes certain bacterial groups, the effects of temperature, SOM, TN, and TP on the rhizosphere community dilute the host regulation effect and mask the convergence effect of rhizoplane bacteria due to the influence of environmental factors on a large spatial scale.

5. Conclusions

In summary, our study emphasizes the intricate interaction between host regulation and environmental factors in shaping rhizoplane bacterial communities. While the host plant exerts selective effects on these communities, large-scale environmental factors also have a significant influence. This understanding is essential for the sustainable management of rubber plantations and the promotion of beneficial plant–microbe interactions in agricultural ecosystems.

Supplementary Materials

The following supporting information can be downloaded at: https://www.mdpi.com/article/10.3390/f15030415/s1. Table S1. Redundancy analysis of the soil, rhizosphere, and rhizoplane samples based on the bacterial community composition (OTU level). Table S2. Abundance of core bacterial taxa in Hainan and Banna. Table S3. Information about 108 samples. Table S4. Environment factors of rubber trees of different sites. Different lowercase letters in the same column indicate significant differences (p < 0.05). Figure S1. Study sites in Hainan and Banna. Figure S2. Differences in bacterial composition in three microenvironments of rubber trees in Hainan and Banna (A) Venn diagrams of shared bacterial OTUs, (B) Analysis of significant differences of dominance clades between Hainan and Banna at phylum levels of soil, rhizosphere, and rhizoplane bacteria. Figure S3. Abundance of dominant bacterial phyla in three microenvironments of rubber plantations in Hainan and Banna. Figure S4. Redundancy analysis of root-associated bacteria of Hainan and Banna rubber plantations’ community composition with environmental factors. Figure S5. Linear relationships between alpha-diversity and environmental factors. Figure S6. Contribution of environmental indicator to dominant bacterial phylum relative abundance based on correlation and optimal multiple regression modeling.

Author Contributions

G.L. planned and designed research; Y.W. and X.X. performed experiments; G.L. and Y.W. conducted fieldwork; X.X. analyzed the data and wrote the manuscript; Y.W. revised and polished the manuscript. All authors have read and agreed to the published version of the manuscript.

Funding

This work was supported by the National Natural Science Foundation of China (32271603), the Hainan Province Science and Technology Special Fund (ZDYF2024SHFZ096), the Hainan Provincial Natural Science Foundation of China (320RC733), and the Earmarked Fund for Chinese Agricultural Research Systems (CARS-33-ZP3).

Data Availability Statement

The raw reads were deposited into the NCBI Sequence Read Archive (SRA) database (Accession Number: SRP342019).

Acknowledgments

We would also like to thank the Tropical Forestry Ecology Research Group for their assistance in sampling work.

Conflicts of Interest

The authors declare no conflicts of interest.

References

  1. Kuzyakov, Y.; Razavi, B.S. Rhizosphere size and shape: Temporal dynamics and spatial stationarity. Soil Biol. Biochem. 2019, 135, 343–360. [Google Scholar] [CrossRef]
  2. Fierer, N.; Jackson, R.B. The diversity and biogeography of soil bacterial communities. Proc. Natl. Acad. Sci. USA 2006, 103, 626–631. [Google Scholar] [CrossRef] [PubMed]
  3. Ge, Y.; He, J.Z.; Zhu, Y.G.; Zhang, J.B.; Xu, Z.; Zhang, L.M.; Zheng, Y.M. Differences in soil bacterial diversity: Driven by contemporary disturbances or historical contingencies? ISME J. 2008, 2, 254–264. [Google Scholar] [CrossRef] [PubMed]
  4. Lan, G.Y.; Wu, Z.X.; Li, Y.W.; Chen, B.Q. The drivers of soil bacterial communities in rubber plantation at local and geographic scales. Arch. Agron. Soil Sci. 2019, 66, 358–369. [Google Scholar] [CrossRef]
  5. Bahram, M.; Hildebrand, F.; Forslund, S.K.; Anderson, J.L.; Soudzilovskaia, N.A.; Bodegom, P.M.; Bengtsson-Palme, J.; Anslan, S.; Coelho, L.P.; Harend, H.; et al. Structure and function of the global topsoil microbiome. Nature 2018, 560, 233–237. [Google Scholar] [CrossRef]
  6. Karimi, B.; Terrat, S.; Dequiedt, S.; Saby, N.P.A.; Horriguel, W.; Lelievre, M.; Nowak, V.; Jolivet, C.; Arrouays, D.; Wincker, P.; et al. Biogeography of soil bacteria and archaea across France. Sci. Adv. 2018, 4, eaat1808. [Google Scholar] [CrossRef]
  7. Wang, J.; Zhang, T.; Li, L.; Li, J.; Feng, Y.; Lu, Q. The Patterns and Drivers of Bacterial and Fungal β-Diversity in a Typical Dryland Ecosystem of Northwest China. Front. Microbiol. 2017, 8, 2126. [Google Scholar] [CrossRef]
  8. Zhang, Y.; Cong, J.; Lu, H.; Li, G.; Xue, Y.; Deng, Y.; Li, H.; Zhou, J.; Li, D. Soil bacterial diversity patterns and drivers along an elevational gradient on Shennongjia Mountain, China. Microb. Biotechnol. 2015, 8, 739–746. [Google Scholar] [CrossRef]
  9. Chi, F.; Shen, S.H.; Cheng, H.P.; Jing, Y.X.; Yanni, Y.G.; Dazzo, F.B. Ascending migration of endophytic Rhizobia from roots to leaves inside rice plants and assessment of their benefits to the growth physiology of rice. Appl. Environ. Microbiol. 2005, 71, 7271–7278. [Google Scholar] [CrossRef]
  10. Lan, G.Y.; Wei, Y.Q.; Li, Y.W.; Wu, Z.X. Diversity and assembly of root-associated microbiomes of rubber trees. Front. Plant Sci. 2023, 14, 1136418. [Google Scholar] [CrossRef]
  11. Ofek-Lalzar, M.; Sela, N.; Goldman-Voronov, M.; Green, S.J.; Hadar, Y.; Minz, D. Niche and host-associated functional signatures of the root surface microbiome. Nat. Commun. 2014, 5, 4950. [Google Scholar] [CrossRef]
  12. Bulgarelli, D.; Schlaeppi, K.; Spaepen, S.; van Themaat, E.V.L.; Schulze-Lefert, P. Structure and Functions of the Bacterial Microbiota of Plants. Annu. Rev. Plant Biol. 2013, 64, 807–838. [Google Scholar] [CrossRef]
  13. Guttman, D.S.; McHardy, A.C.; Schulze-Lefert, P. Microbial genome-enabled insights into plant–microorganism interactions. Nat. Rev. Genet. 2014, 15, 797–813. [Google Scholar] [CrossRef]
  14. Korenblum, E.; Dong, Y.; Szymanski, J.; Panda, S.; Jozwiak, A.; Massalha, H.; Meir, S.; Rogachev, I.; Aharoni, A. Rhizosphere microbiome mediates systemic root metabolite exudation by root-to-root signaling. Proc. Natl. Acad. Sci. USA 2020, 117, 3874–3883. [Google Scholar] [CrossRef]
  15. Bakker, P.A.H.M.; Berendsen, R.L.; Doornbos, R.F.; Wintermans, P.C.A.; Pieterse, C.M.J. The rhizosphere revisited: Root microbiomics. Front. Plant Sci. 2013, 4, 165. [Google Scholar] [CrossRef]
  16. Lareen, A.; Burton, F.; Schafer, P. Plant root-microbe communication in shaping root microbiomes. Plant Mol. Biol. 2016, 90, 575–587. [Google Scholar] [CrossRef]
  17. Reinhold-Hurek, B.; Bünger, W.; Burbano, C.S.; Sabale, M.; Hurek, T. Roots Shaping Their Microbiome: Global Hotspots for Microbial Activity. Annu. Rev. Phytopathol. 2015, 53, 403–424. [Google Scholar] [CrossRef] [PubMed]
  18. Edwards, J.; Johnson, C.; Santos-Medellin, C.; Lurie, E.; Podishetty, N.K.; Bhatnagar, S.; Eisen, J.A.; Sundaresan, V. Structure, variation, and assembly of the root-associated microbiomes of rice. Proc. Natl. Acad. Sci. USA 2015, 112, E911–E920. [Google Scholar] [CrossRef] [PubMed]
  19. López, J.L.; Fourie, A.; Poppeliers, S.W.M.; Pappas, N.; Sánchez-Gil, J.J.; de Jonge, R.; Dutilh, B.E. Growth rate is a dominant factor predicting the rhizosphere effect. ISME J. 2023, 17, 1396–1405. [Google Scholar] [CrossRef] [PubMed]
  20. Turner, T.R.; Ramakrishnan, K.; Walshaw, J.; Heavens, D.; Alston, M.; Swarbreck, D.; Osbourn, A.; Grant, A.; Poole, P.S. Comparative metatranscriptomics reveals kingdom level changes in the rhizosphere microbiome of plants. ISME J 2013, 7, 2248–2258. [Google Scholar] [CrossRef] [PubMed]
  21. Walters, W.A.; Jin, Z.; Youngblut, N.; Wallace, J.G.; Sutter, J.; Zhang, W.; Gonzalez-Pena, A.; Peiffer, J.; Koren, O.; Shi, Q.J.; et al. Large-scale replicated field study of maize rhizosphere identifies heritable microbes. Proc. Natl. Acad. Sci. USA 2018, 115, 7368–7373. [Google Scholar] [CrossRef]
  22. Oh, Y.M.; Kim, M.; Lee-Cruz, L.; Lai-Hoe, A.; Go, R.; Ainuddin, N.; Rahim, R.A.; Shukor, N.; Adams, J.M. Distinctive Bacterial Communities in the Rhizoplane of Four Tropical Tree Species. Microb. Ecol. 2012, 64, 1018–1027. [Google Scholar] [CrossRef]
  23. Fan, M.; Li, J.; Luan, X.; Yang, L.; Chen, W.; Ma, X.; Yang, Z.; Shangguan, Z. Biogeographical patterns of rhizosphere microbial communities in Robinia pseudoacacia forests along a north–south transect in the Loess Plateau. Geoderma 2023, 435, 116516. [Google Scholar] [CrossRef]
  24. Li, Y.M.; Yang, Y.; Wu, T.E.; Zhang, H.; Wei, G.H.; Li, Z.F. Rhizosphere bacterial and fungal spatial distribution and network pattern of Astragalus mongholicus in representative planting sites differ the bulk soil. Appl. Soil Ecol. 2021, 168, 104114. [Google Scholar] [CrossRef]
  25. Xiao, C.; Li, P.; Feng, Z. Monitoring annual dynamics of mature rubber plantations in Banna during 1987–2018 using Landsat time series data: A multiple normalization approach. Int. J. Appl. Earth Obs. Geoinf. 2019, 77, 30–41. [Google Scholar] [CrossRef]
  26. Xu, X.; Fei, Q.; Wei, Y.; Yang, C.; Zhang, H.; Lan, G. Diversity analysis of rhizosphere fungal communities of rubber trees in rubber plantation area of Hainan and Banna. J. South Agric. 2022, 53, 2392–2402. [Google Scholar] [CrossRef]
  27. Zhai, D.L.; Cannon, C.H.; Slik, J.W.F.; Zhang, C.P.; Dai, Z.C. Rubber and pulp plantations represent a double threat to Hainan’s natural tropical forests. J. Environ. Manag. 2012, 96, 64–73. [Google Scholar] [CrossRef] [PubMed]
  28. Walters, W.; Hyde, E.R.; Berg-Lyons, D.; Ackermann, G.; Humphrey, G.; Parada, A.; Gilbert, J.A.; Jansson, J.K.; Caporaso, J.G.; Fuhrman, J.A.; et al. Improved bacterial 16S rRNA gene (V4 and V4-5) and fungal internal transcribed spacer marker gene primers for microbial community surveys. mSystems 2016, 1, e00009-15. [Google Scholar] [CrossRef]
  29. Wei, Y.Q.; Lan, G.Y.; Wu, Z.X.; Chen, B.Q.; Quan, F.; Li, M.M.; Sun, S.Q.; Du, H.N. Phyllosphere fungal communities of rubber trees exhibited biogeographical patterns, but not bacteria. Environ. Microbiol. 2022, 24, 3777–3790. [Google Scholar] [CrossRef] [PubMed]
  30. Lu, R.K. Methods for Soil and Agriculture Chemistry Analysis; Chinese Agricultural Science and Technology Press: Beijing, China, 1999; pp. 20–35. [Google Scholar]
  31. Ji, N.; Liang, D.; Clark, L.V.; Sacks, E.J.; Kent, A.D. Host genetic variation drives the differentiation in the ecological role of the native Miscanthus root-associated microbiome. Microbiome 2023, 11, 216. [Google Scholar] [CrossRef] [PubMed]
  32. Caporaso, J.G.; Kuczynski, J.; Stombaugh, J.; Bittinger, K.; Bushman, F.D.; Costello, E.K.; Fierer, N.; Pena, A.G.; Goodrich, J.K.; Gordon, J.I.; et al. QIIME allows analysis of high-throughput community sequencing data. Nat. Methods 2010, 7, 335–336. [Google Scholar] [CrossRef] [PubMed]
  33. Edgar, R.C. UPARSE: Highly accurate OTU sequences from microbial amplicon reads. Nat. Methods 2013, 10, 996–998. [Google Scholar] [CrossRef] [PubMed]
  34. Wang, Q.; Garrity, G.M.; Tiedje, J.M.; Cole, J.R. Naive Bayesian Classifier for Rapid Assignment of rRNA Sequences into the New Bacterial Taxonomy. Appl. Environ. Microbiol. 2007, 73, 5261–5267. [Google Scholar] [CrossRef] [PubMed]
  35. Abdelfattah, A.; Wisniewski, M.; Schena, L.; Tack, A.J.M. Experimental evidence of microbial inheritance in plants and transmission routes from seed to phyllosphere and root. Environ. Microbiol. 2021, 23, 2199–2214. [Google Scholar] [CrossRef] [PubMed]
  36. He, R.; Zeng, J.; Zhao, D.; Wang, S.; Wu, Q.L. Decreased spatial variation and deterministic processes of bacterial community assembly in the rhizosphere of Phragmites australis across the Middle–Lower Yangtze plain. Mol. Ecol. 2021, 31, 1180–1195. [Google Scholar] [CrossRef] [PubMed]
  37. Xiong, C.; Zhu, Y.G.; Wang, J.T.; Singh, B.; Han, L.L.; Shen, J.P.; Li, P.P.; Wang, G.B.; Wu, C.F.; Ge, A.H.; et al. Host selection shapes crop microbiome assembly and network complexity. New Phytol. 2020, 229, 1091–1104. [Google Scholar] [CrossRef]
  38. Letunic, I.; Bork, P. Interactive tree of life (iTOL) v3: An online tool for the display and annotation of phylogenetic and other trees. Nucleic Acids Res. 2016, 44, W242–W245. [Google Scholar] [CrossRef]
  39. Shenhav, L.; Thompson, M.; Joseph, T.A.; Briscoe, L.; Furman, O.; Bogumil, D.; Mizrahi, I.; Pe’er, I.; Halperin, E. FEAST: Fast expectation-maximization for microbial source tracking. Nat. Methods 2019, 16, 627–632. [Google Scholar] [CrossRef]
  40. Jiao, S.; Yang, Y.; Xu, Y.; Zhang, J.; Lu, Y. Balance between community assembly processes mediates species coexistence in agricultural soil microbiomes across eastern China. ISME J. 2020, 14, 202–216. [Google Scholar] [CrossRef]
  41. Attia, S.; Russel, J.; Mortensen, M.S.; Madsen, J.S.; Sørensen, S.J. Unexpected diversity among small-scale sample replicates of defined plant root compartments. ISME J. 2021, 16, 997–1003. [Google Scholar] [CrossRef]
  42. Walker, T.S.; Bais, H.P.; Grotewold, E.; Vivanco, J.M. Root Exudation and Rhizosphere Biology. Plant Physiol. 2003, 132, 44–51. [Google Scholar] [CrossRef]
  43. Bai, Y.; Muller, D.B.; Srinivas, G.; Garrido-Oter, R.; Potthoff, E.; Rott, M.; Dombrowski, N.; Munch, P.C.; Spaepen, S.; Remus-Emsermann, M.; et al. Functional overlap of the Arabidopsis leaf and root microbiota. Nature 2015, 528, 364–369. [Google Scholar] [CrossRef]
  44. Lundberg, D.S.; Lebeis, S.L.; Paredes, S.H.; Yourstone, S.; Gehring, J.; Malfatti, S.; Tremblay, J.; Engelbrektson, A.; Kunin, V.; del Rio, T.G.; et al. Defining the core Arabidopsis thaliana root microbiome. Nature 2012, 488, 86–90. [Google Scholar] [CrossRef]
  45. Thiergart, T.; Durán, P.; Ellis, T.; Vannier, N.; Garrido-Oter, R.; Kemen, E.; Roux, F.; Alonso-Blanco, C.; Ågren, J.; Schulze-Lefert, P.; et al. Root microbiota assembly and adaptive differentiation among European Arabidopsis populations. Nat. Ecol. Evol. 2019, 4, 122–131. [Google Scholar] [CrossRef]
  46. Perez-Jaramillo, J.E.; Carrion, V.J.; Bosse, M.; Ferrao, L.F.V.; de Hollander, M.; Garcia, A.A.F.; Ramirez, C.A.; Mendes, R.; Raaijmakers, J.M. Linking rhizosphere microbiome composition of wild and domesticated Phaseolus vulgaris to genotypic and root phenotypic traits. ISME J. 2017, 11, 2244–2257. [Google Scholar] [CrossRef] [PubMed]
  47. Agler, M.T.; Ruhe, J.; Kroll, S.; Morhenn, C.; Kim, S.T.; Weigel, D.; Kemen, E.M. Microbial Hub Taxa Link Host and Abiotic Factors to Plant Microbiome Variation. PLoS Biol. 2016, 14, e1002352. [Google Scholar] [CrossRef] [PubMed]
  48. Liu, J.; Sui, Y.; Yu, Z.; Shi, Y.; Chu, H.; Jin, J.; Liu, X.; Wang, G. High throughput sequencing analysis of biogeographical distribution of bacterial communities in the black soils of northeast China. Soil Biol. Biochem. 2014, 70, 113–122. [Google Scholar] [CrossRef]
  49. Mueller, R.C.; Belnap, J.; Kuske, C.R. Soil bacterial and fungal community responses to nitrogen addition across soil depth and microhabitat in an arid shrubland. Front. Microbiol. 2015, 6, 891. [Google Scholar] [CrossRef] [PubMed]
  50. Berg, G.; Smalla, K. Plant species and soil type cooperatively shape the structure and function of microbial communities in the rhizosphere. FEMS Microbiol. Ecol. 2009, 68, 1–13. [Google Scholar] [CrossRef] [PubMed]
  51. Gottel, N.R.; Castro, H.F.; Kerley, M.; Yang, Z.; Pelletier, D.A.; Podar, M.; Karpinets, T.; Uberbacher, E.; Tuskan, G.A.; Vilgalys, R.; et al. Distinct microbial communities within the endosphere and rhizosphere of Populus deltoides roots across contrasting soil types. Appl. Environ. Microbiol. 2011, 77, 5934–5944. [Google Scholar] [CrossRef] [PubMed]
  52. Shi, S.; Nuccio, E.E.; Shi, Z.J.; He, Z.; Zhou, J.; Firestone, M.K. The interconnected rhizosphere: High network complexity dominates rhizosphere assemblages. Ecol. Lett. 2016, 19, 926–936. [Google Scholar] [CrossRef] [PubMed]
  53. Berhongaray, G.; Janssens, I.A.; King, J.S.; Ceulemans, R. Fine root biomass and turnover of two fast-growing poplar genotypes in a short-rotation coppice culture. Plant Soil 2013, 373, 269–283. [Google Scholar] [CrossRef] [PubMed]
Figure 1. Bacterial composition of different microenvironments of rubber tree roots in Hainan and Banna. (A) Venn diagrams illustrating the shared numbers of bacterial operational taxonomic units (OTUs) among sample types and climatic regions. (B) Composition of soil, rhizosphere, and rhizoplane bacterial communities in rubber plantations in Hainan and Banna at the phylum level. (C) Estimation of potential sources for bacterial communities in different microenvironments of rubber plantations in Hainan and Banna using FEAST. Hainan includes samples collected from Ledong, Wanning, and Danzhou; Banna includes samples collected from Menglun, Mengla, and Jinghong. The same applies to the following text.
Forests 15 00415 g001
Figure 2. Microbial diversity of different microenvironments (soil, rhizosphere, and rhizoplane) of rubber tree roots in Hainan and Banna. (A) The OTU richness of bacterial communities of different microenvironments (* p < 0.05, ** p < 0.01). (B) Principal coordinates analysis (PCoA) of taxonomic similarity based on Bray–Curtis distances (OTU level). (C) Cumulative numbers of OTUs across all samples (γ-diversity) in different microenvironments of rubber tree roots. The y-axis represents number of total OTUs.
Forests 15 00415 g002
Figure 3. Enrichment and depletion patterns of bacterial OTUs. (A) Enrichment and depletion patterns of bacterial microbiomes associated with rubber tree roots in different microenvironments of Hainan and Banna rubber plantations compared to soil. Blue point represents an enriched OTU, while a red point represents a depleted OTU. The x-axis shows the fold change (FC) in the abundance of a specific microenvironment compared to soil, and the y-axis displays −log10 of the p-value. Numbers in the top-left corner indicate depleted OTUs, numbers in the top-right corner indicate enriched OTUs, and numbers at the bottom indicate non-significant OTUs. (B) Core microbial composition and phylogenetic tree in the roots of rubber trees in Hainan and Banna. Enriched OTUs from the soil are represented by the solid star, while depleted OTUs from the soil are represented by the open star. The green color indicates OTUs in the rhizoplane that are either enriched or depleted. Hainan and Banna’s co-enriched OTUs are indicated by red stars, while co-depleted OTUs are indicated by blue stars.
Forests 15 00415 g003
Figure 4. Correlation analysis of environmental factors and microbial communities in rubber plantations. The pairwise comparisons of environmental factors are displayed, showcasing Spearman’s correlation coefficients with a color gradient. Partial Mantel tests were utilized to establish the relationship between taxonomy (core bacterial OTU abundance) and each environmental factor. The width of the edges represents Mantel’s r statistic for the respective distance correlations, while the color of the edges indicates the statistical significance (* p < 0.05, ** p < 0.01, *** p < 0.001). (WC: water content; SOM: soil organic matter; AN: ammonia nitrogen; AK: available potassium; AP: available phosphorus; NN: nitrate nitrogen; TN: total nitrogen; TP: total phosphorus; TK: total potassium).
Forests 15 00415 g004
Table 1. Environment factors of rubber trees of Hainan and Banna. Different lowercase letters in the same column indicate significant differences (p < 0.05).
Environment VariableHainanBanna
Water content (%)19.58 ± 6.0720.53 ± 8.27
pH4.08 ± 0.374.31 ± 0.69
Organic matter (%)1.5 ± 0.74 a2.62 ± 0.97 b
Ammonia nitrogen (mg·kg−1)7.82 ± 7.87 a14.73 ± 8.5 b
Nitrate nitrogen (mg·kg−1)9.06 ± 4.9111.13 ± 8.25
Available phosphorus (mg·kg−1)4.43 ± 4.353.7 ± 2.71
Available potassium (mg·kg−1)44.85 ± 25.3556.78 ± 50.53
Total nitrogen (g·kg−1)0.15 ± 0.06 a0.26 ± 0.11 b
Total phosphorus (g·kg−1)0.06 ± 0.03 a0.1 ± 0.04 b
Total potassium (g·kg−1)1.71 ± 1.560.94 ± 0.65
Elevation (m)155.89 ± 20.16 a665.11 ± 149.53 b
Rainfall (mm)1634.66 ± 324.181513.75
Air temperature (°C)24.56 ± 0.69 a21.58 b
Disclaimer/Publisher’s Note: The statements, opinions and data contained in all publications are solely those of the individual author(s) and contributor(s) and not of MDPI and/or the editor(s). MDPI and/or the editor(s) disclaim responsibility for any injury to people or property resulting from any ideas, methods, instructions or products referred to in the content.

