Article

Identifying and Predicting the Responses of Multi-Altitude Vegetation to Climate Change in the Alpine Zone

1
School of Civil Engineering, Tianjin University, Tianjin 300072, China
2
Nanjing Hydraulic Research Institute, Nanjing 210098, China
3
Yangtze Institute for Conservation and Development, Nanjing 210098, China
4
Research Center for Climate Change of Ministry of Water Resources, Nanjing 210029, China
*
Author to whom correspondence should be addressed.
Forests 2024, 15(2), 308; https://doi.org/10.3390/f15020308
Submission received: 26 December 2023 / Revised: 11 January 2024 / Accepted: 3 February 2024 / Published: 6 February 2024
(This article belongs to the Special Issue Application of Remote Sensing in Vegetation Dynamic and Ecology)

Abstract

:
Global climate change has affected vegetation cover in alpine areas. In this paper, we analyzed the correlation between Leaf Area Index (LAI) and climate factors of the Yarlung Tsangpo River basin, and identified their contributions using the quantitative analysis method. The results show that the vegetation cover in the study area generally exhibited an increasing trend. Grassland in the middle- and high-altitude areas was the main contributing area. Temperature is the dominant climatic factor affecting the change, the effect of which increases with the rise in elevation. The influences of precipitation and radiation had obvious seasonality and regionality. The vegetation illustrated a lag response to climate drivers. With the change in the elevation band, the response time to precipitation was significantly less than that to air temperature in the low-elevation area, while the opposite trend was observed in the high-elevation area. In the future, the LAI of the watershed will show different characteristics at different time points, with the increases in the LAI in autumn and winter becoming the main factors for the future increase in the LAI. This provides a crucial basis upon which to explore hydrological and ecological processes as important components of the Third Pole region.

1. Introduction

Vegetation stands as the fundamental bedrock of terrestrial ecosystems, playing a crucial role in signaling the condition and productivity of regional plant life [1,2,3]. Functioning as a vital intermediary, it establishes connections between the atmosphere, soil, and water systems [4,5]. In the 20th century, global climate patterns underwent significant transformations, primarily characterized by a pronounced warming trend, which has exerted far-reaching impacts on both the natural world and human society [6,7,8]. Vegetation, being highly sensitive to these climatic shifts [9,10,11], has witnessed pronounced alterations in recent years due to climate change [12,13,14]. Therefore, comprehending the long-term evolution of regional vegetation and identifying the driving forces behind its transformations is of paramount importance for addressing climate change, safeguarding ecological integrity, and informing future research and policy initiatives related to the water–carbon cycle.
Numerous scholars have extensively explored the impact of climate change on vegetation at both regional and global scales. For instance, Chu conducted a comprehensive investigation into the effects of climate change on vegetation within the Amur–Heilongjiang River basin, employing various scales such as pixel-level analysis, biome-level assessment, and regional-scale evaluation. Additionally, Chu’s study delved into the influence of human activities on these vegetation changes [15]. Another noteworthy contribution comes from Svenning [16], who examined vegetation transformations resulting from contemporary and prospective climate shifts and evaluated potential ecological imbalances between vegetation and climate. In a separate investigation, Jiao [17] analyzed alterations in water limitations affecting vegetation growth in the Northern Hemisphere tropics and investigated how climate change might modify this process. Pearson [18], on the other hand, scrutinized the distribution of vegetation in the Arctic region under projected future climate scenarios, investigating the associated changes. Lastly, Gan [19] employed the Budyko model to investigate the repercussions of vegetation changes on interannual fluctuations in the water balance. Although these studies primarily focused on overall regional changes, particularly in low- and mid-altitude regions, there remains a notable gap in research concerning alpine mountain ecosystems, and further refinement is needed to address the variability in elevation zones.
China is a region highly sensitive to and profoundly impacted by global climate change [20,21,22]. The Qinghai–Tibet Plateau, located within China, stands as the world’s loftiest and most intricate plateau region [23], renowned for harboring the most representative and extensively distributed alpine vegetation ecosystems globally [24,25,26]. Against the backdrop of global warming, the Qinghai–Tibet Plateau has exhibited a pronounced warming trend, with future projections indicating a notable upswing in both temperature and precipitation [27,28]. Consequently, vegetation growth within the Tibetan Plateau now enjoys more favorable hydrothermal conditions than in previous eras. Furthermore, the thawing of snow and glaciers due to rising temperatures has expanded the available space for vegetation expansion. Concurrently, there have been discernible shifts in the biological population characteristics of the vegetation, demonstrating increasingly distinct regional patterns [29]. Gao [30] analyzed the future vegetation distribution and net primary productivity (NPP) of the Tibetan Plateau using the cmip6 dataset and explored the possible changes in vegetation types; Deng [31] combined terrestrial water storage anomalies data and vegetation indices to analyze their interactions; Jiao [32] analyzed the spatial response pattern of NDVI data and seasonal variation characteristics based on station meteorological data; and Dong [33] studied the response of alpine vegetation on the Tibetan Plateau to heat waves and the change pattern of heat waves over the past 20 years. It can be seen that these current studies mainly focused on the response of vegetation to environmental factors, but the quantitative study of the factors and the analysis of different elevation zones are still lacking. Therefore, a quantitative study of the patterns of vegetation change and its drivers on the Tibetan Plateau by elevation is crucial for an in-depth understanding of regional climate dynamics and plateau ecology.
The Leaf Area Index (LAI) stands as a pivotal vegetation parameter and a versatile tool for studying alterations in regional vegetation. Specifically, the LAI is defined as half of the total green leaf surface area per unit surface area [34]. Remote-sensing-based LAI measurement has gained prominence due to its distinct advantages, including wide geographical coverage, accessibility, and timely data acquisition. It finds extensive applications in the realms of ecosystems, vegetation–atmosphere interactions, surface water dynamics, and the carbon cycle. Currently, some of the more widely used satellite remote sensing LAI data products include MODIS [35], GlobMap, GIMMS [36], and GLASS [37]. These products provide a reliable data source for ecological and water–carbon cycle research at regional and global scales, leading to significant research achievements. For instance, Hu [38] employed GLASS data products to estimate the actual evapotranspiration in the Mekong River basin, while Xiao [39] utilized GLASS Leaf Area Index data products to calculate global FAPAR data, thereby enhancing the spatial comprehensiveness of existing datasets. Chávez [40] conducted an analysis of the impacts of mining and anthropogenic water use on Prosopis tamarugo Phil in Chile, leveraging Leaf Area Index data. Reygadas [41] provided insight into the intra-annual and intraseasonal correlations between the LAI and surface temperature. Currently, with the escalation of climate and environmental changes, scholars have progressively directed their attention to the examination of vegetation alterations in high-altitude mountainous regions. The analysis of fluctuations in alpine vegetation and their reactions to changes in the LAI can reveal distinctions in how various vegetation types respond to climate change. This exploration contributes to a better understanding of regional carbon cycle processes. In this study, the Yarlung Tsangpo River basin on the Tibetan Plateau served as the focal point for analyzing variations in the LAI and its responsiveness to environmental changes across different altitude zones from 1981 to 2017. The objectives of this paper are to characterize the spatial and temporal variability of the LAI in the watershed, the contribution of the main climatic factors, the impact of altitudinal differences on vegetation changes, and the projections of the interannual and intra-annual variability of the LAI in the future.

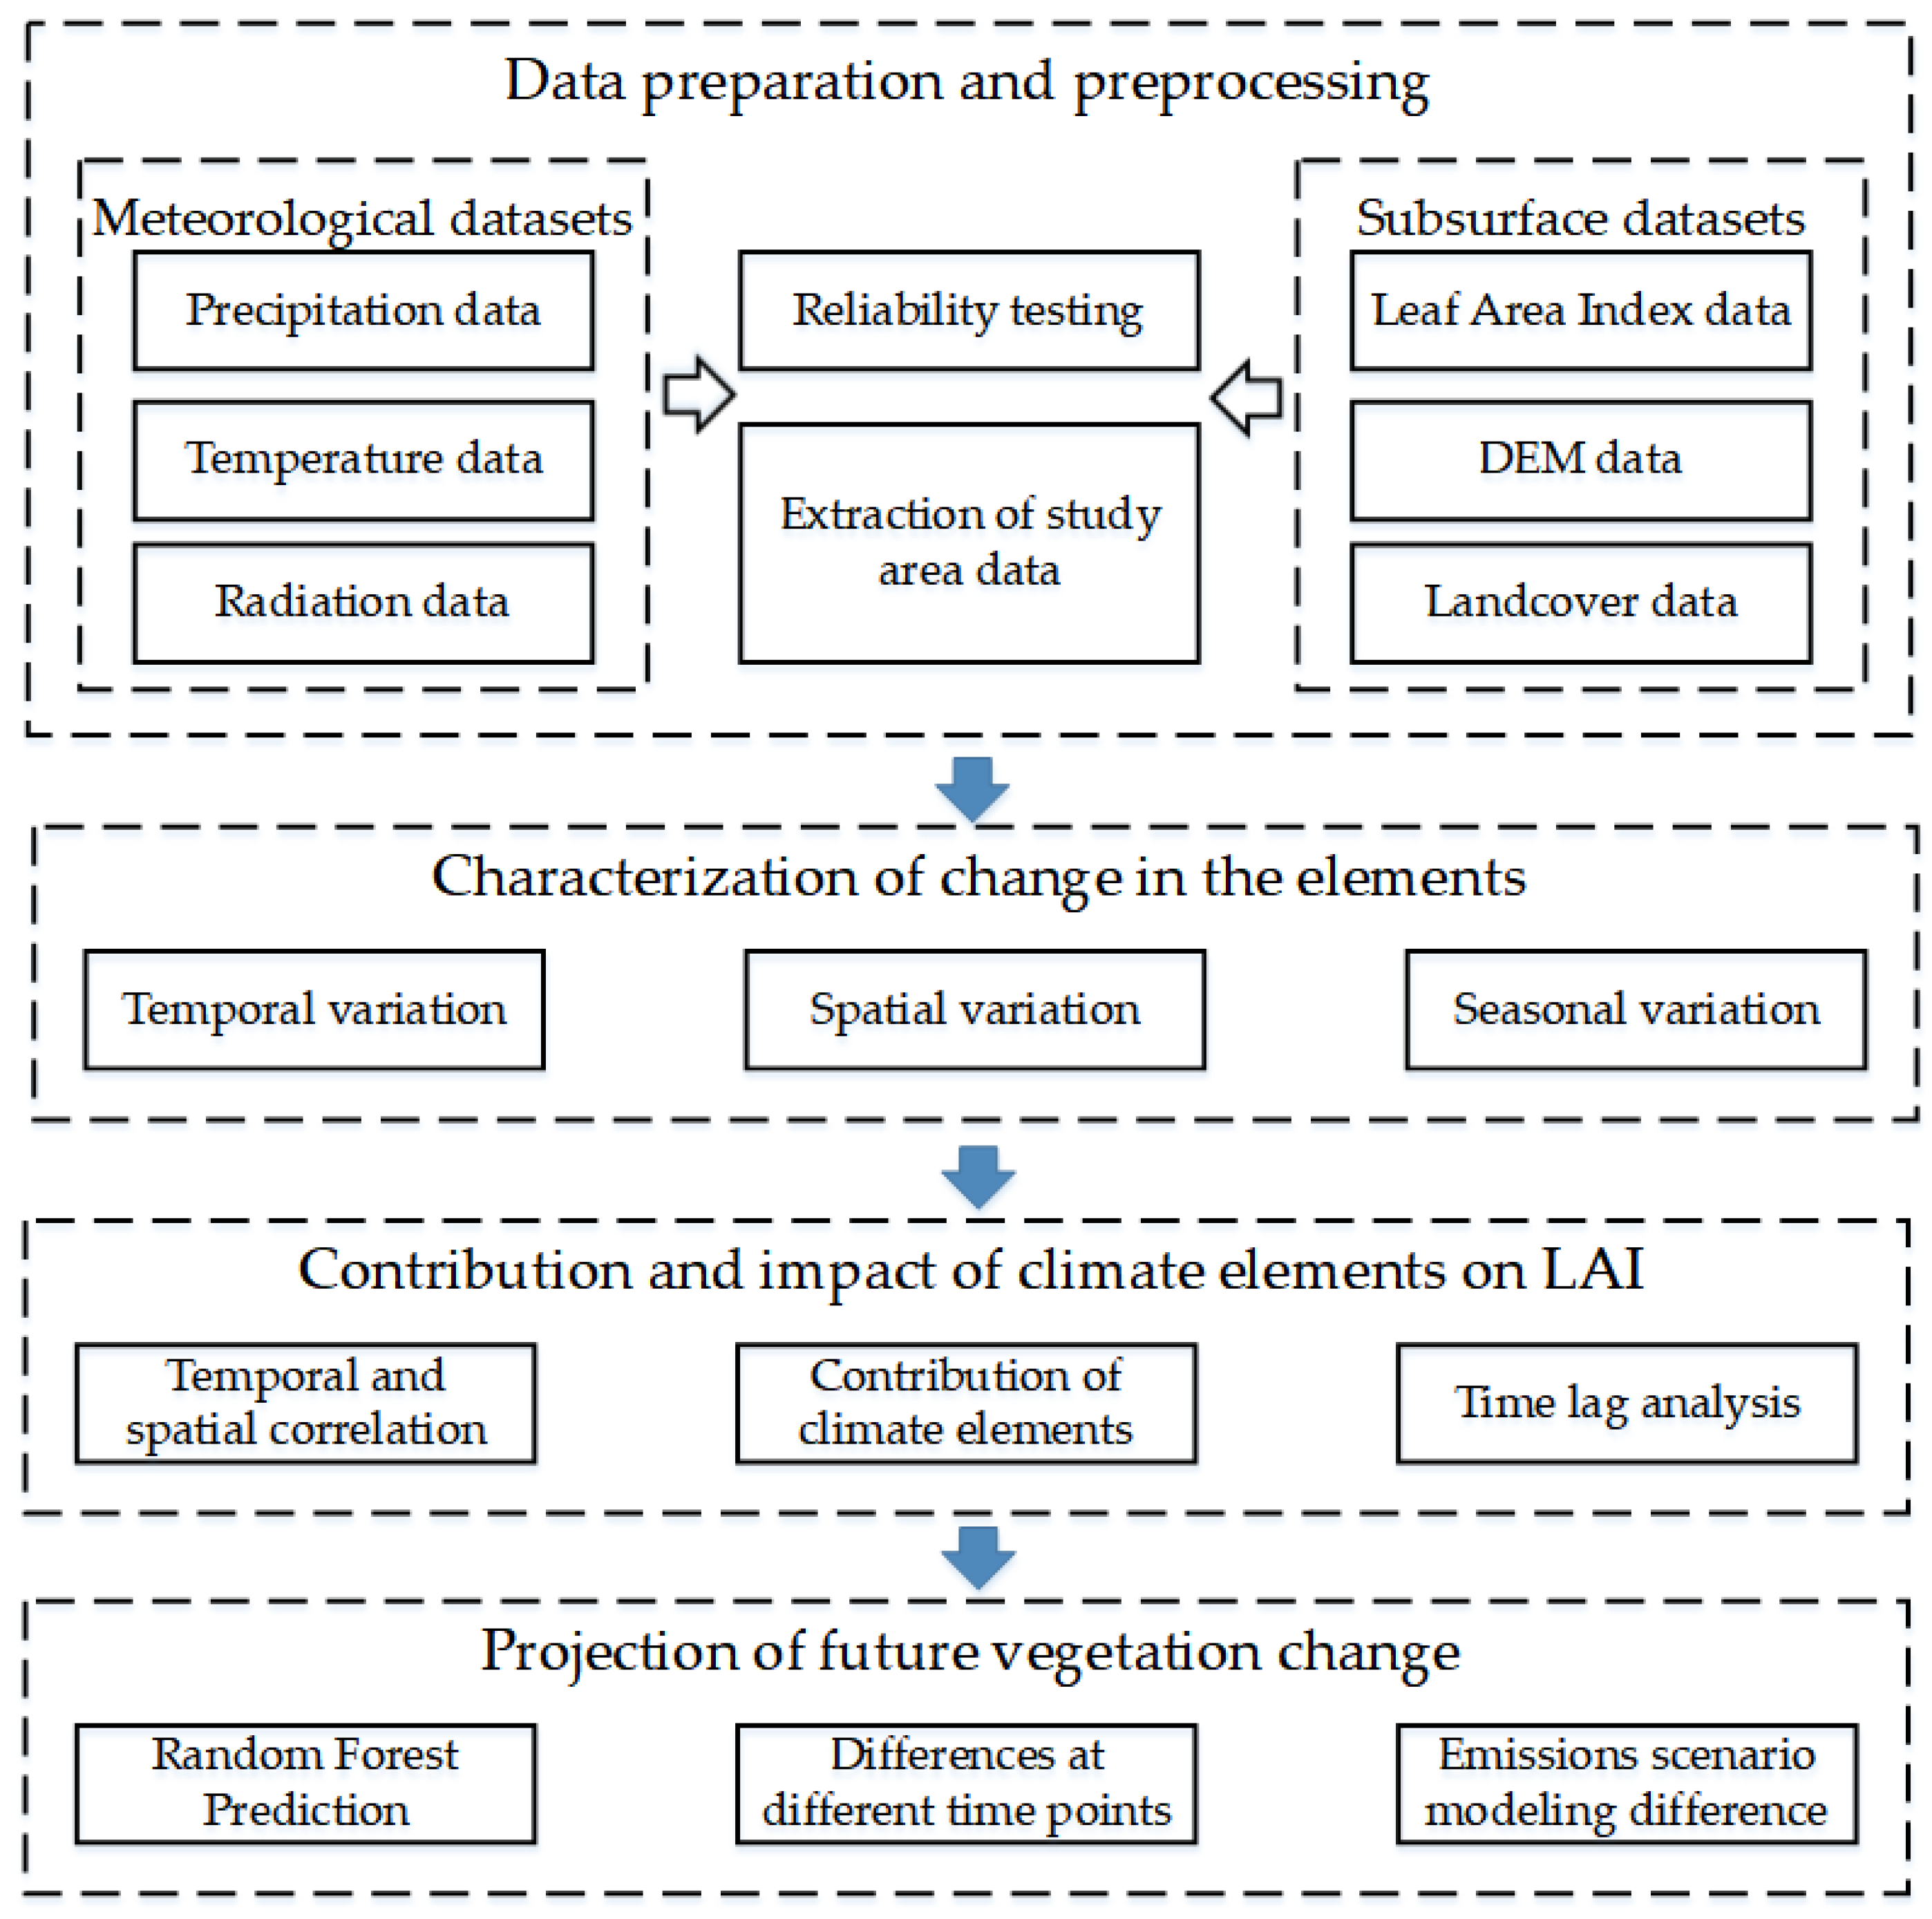
2. Materials and Methods
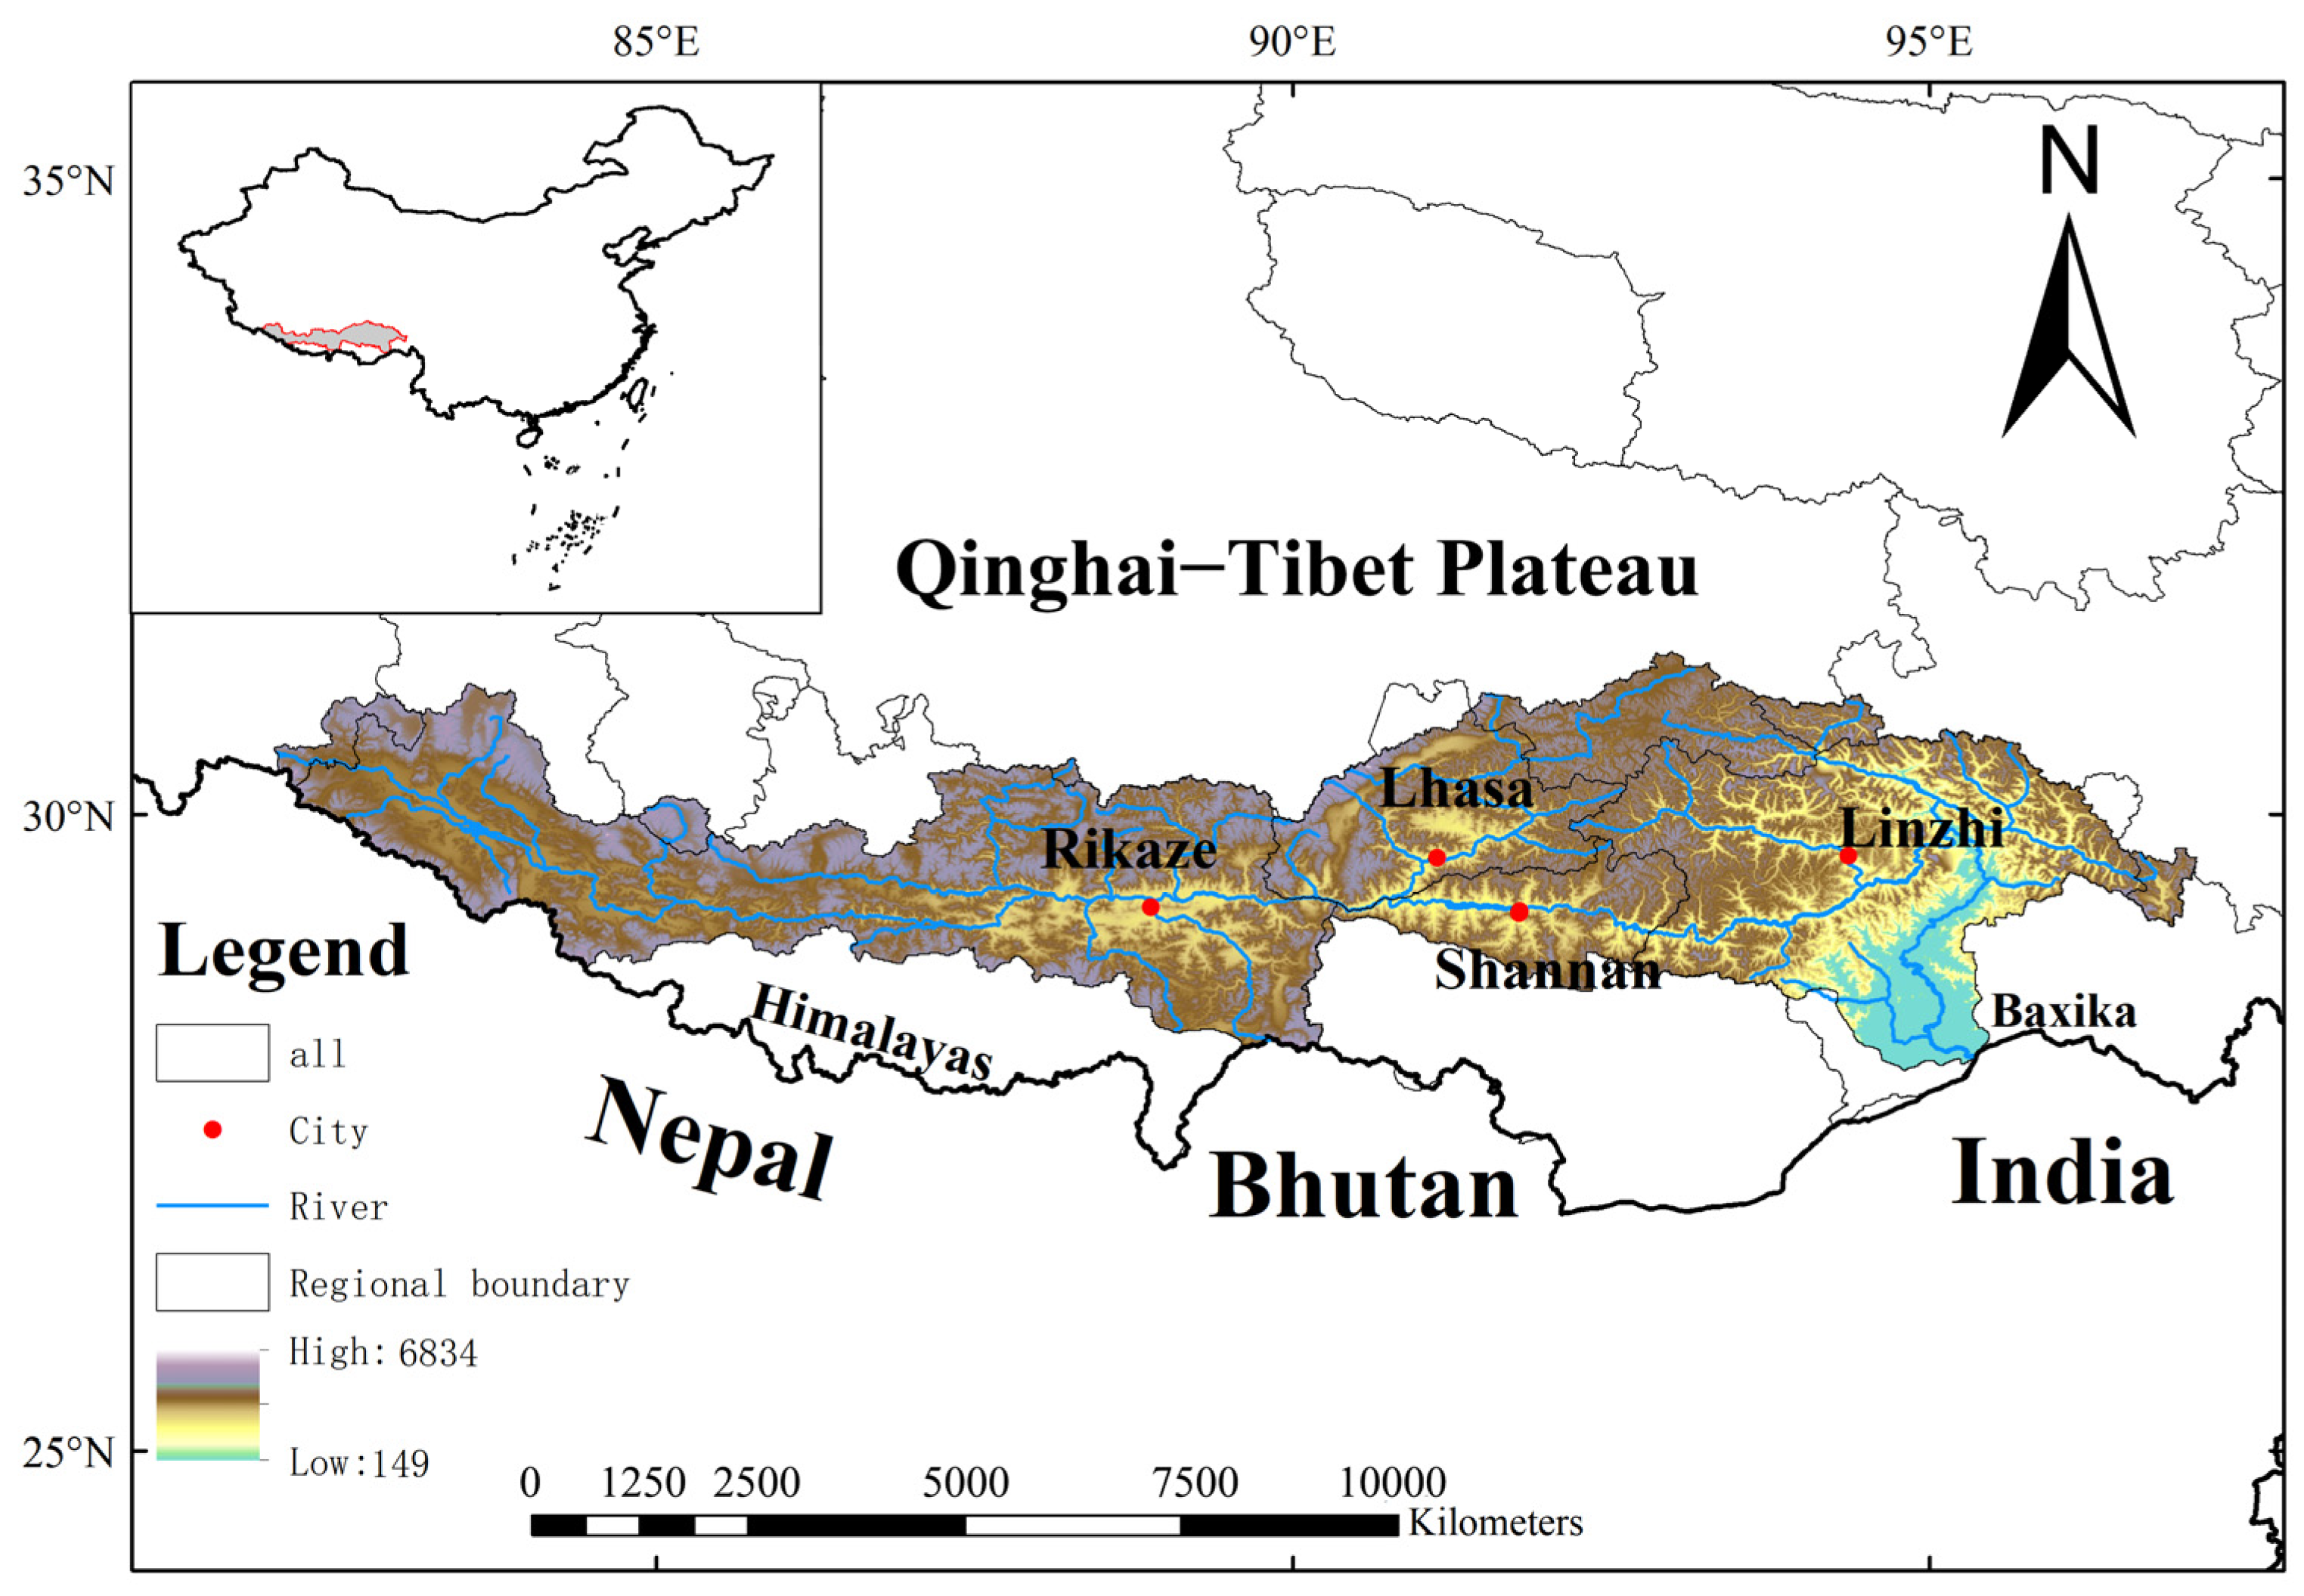
2.1. Study Area

The Yarlung Tsangpo River basin is situated between the southern part of the Qinghai–Tibetan Plateau and the northern foothills of the Himalayas (27° N–32° N, 82° E–97° E) (Figure 1). Spanning an average altitude of over 4000 m above sea level, it covers an area of approximately 240,000 km2 in China, boasting an annual runoff exceeding 160 billion m3. Flowing through regions such as Rikaze, Lhasa, Shannan, and Linzhi, and eventually exiting China through Baxika, the Yarlung Tsangpo River basin holds significant geographical importance. Because of its location in the plateau area, the basin exhibits distinct stratification characteristics in its underground composition. Moreover, it is less influenced by human activities compared to other regions. Therefore, this study selected the Yarlung Tsangpo River basin as the research focus for investigating climate and vegetation changes in the alpine region.

2.2. Data Collection

Meteorological data for this study were obtained from the China Meteorological Forcing Dataset (CMFD), available on the Big Earth Data Platform for Three Poles (http://poles.tpdc.ac.cn/en/, accessed on 1 June 2023). The CMFD is a high-resolution meteorological dataset developed for investigating land-surface processes in China [42,43]. It provides the temperature, precipitation, evapotranspiration, relative humidity, wind speed, and short- and longwave radiations at regional daily scales in China for the years 1979–2018, with a spatial resolution of 0.1°. To assess the reliability of the CMFD data, site data were used as a reference, and a comparative analysis of the correlation between CMFD, CRU, and CN05.1 data and the site data was conducted (Table 1). The results indicate that the CMFD data exhibit satisfactory performance in the Yarlung Tsangpo River basin.
Leaf Area Index is defined as the area of green leaves on one side per unit of horizontal ground area. It is intricately linked to vegetation density, structure, tree biometrics, and environmental conditions [44,45]. This paper utilized the Global Land Surface Satellite Data (GLASS, http://www.glass.umd.edu/, accessed on 1 June 2023) dataset [46] to investigate changes in the LAI. The dataset encompasses global 0.05° LAI data from 1981 to 2017, offering valuable support for vegetation dynamics monitoring at various scales worldwide [47]. It has been widely utilized by scholars in ecological environment monitoring and related research [48,49,50,51]. Acknowledging the higher spatial and temporal resolutions of the GLASS and considering the findings of other researchers [49,52,53], this paper contends that the GLASS data provide a more accurate reflection of the LAI changes in southwest China. The LAI field of grid data in the original HDF-EOS data was initially extracted, and then the vector layer of the Yarlung Tsangpo River was employed for cropping to obtain the necessary data range for the study.
The land use data used in this study were obtained from the China Land Cover Dataset [54], released by Wuhan University. This dataset provides a comprehensive land cover map for China, spanning from 1985 to 2019. Its creation involved the analysis of an extensive collection of 335,709 Landsat images available through Google Earth Engine (GEE). These images were used to construct spatio-temporal features, and a random forest classifier was applied to generate the classification results. Additionally, a postprocessing methodology, including spatio-temporal filtering and logical inference techniques, was employed to enhance the spatio-temporal consistency of the China Land Cover Dataset.

2.3. Method

2.3.1. Mann–Kendall Trend Testing Method

The Mann–Kendall trend analysis method, a nonparametric statistical test method [55,56], is characterized by several advantages, including not necessitating the measured values to adhere to a normal distribution, not mandating the trend to be linear, and being unaffected by missing values and outliers. Widely applied in the significant trend analysis of long time series data, the Mann–Kendall method has become a prominent tool in the field. The calculation method is outlined as follows:
Z = S V a r ( S ) , S > 0 0 , S = 0 S + 1 V a r ( S ) , S < 0
S = i = 1 n 1 j = i + 1 n s i g n ( x j x i )
s i g n ( θ ) = 1 , θ > 0 0 , θ = 0 1 , θ < 0
V a r ( S ) = [ n ( n 1 ) ( 2 n + 5 ) p = 1 g t p ( t p 1 ) ( 2 t p + 5 ) ] 18
In the equation, Var represents the variance of S, p denotes the number of duplicate data, g is the number of unique values, and tp signifies the frequency of each duplicate number. When the absolute value of Z is equal to or exceeds 1.645, 1.96, and 2.576, this signifies the successful completion of significance tests with confidence levels of 90%, 95%, and 99%. This, in turn, indicates a noteworthy upward or downward trend in the time series.

2.3.2. Hurst Exponent

The Hurst exponent is a statistical measure used to quantify the long-term memory or persistence in a time series or dataset. It was first introduced to analyze the water flow of the Nile River and has since found applications in various fields, such as hydrology, finance, telecommunications, and image processing.
The Hurst exponent, denoted as H, is a dimensionless value within the range of 0 to 1. When H < 0.5, this indicates that the future of the time series demonstrates an opposite trend compared to the past, displaying antipersistence. The closer H is to 0, the stronger the antipersistence. When H = 0.5, this suggests that the future trend of the time series is independent of the past, constituting an independent random series. On the other hand, when H > 0.5, this signifies that the future of the time series aligns with the past trend, exhibiting persistence. The closer H is to 1, the stronger the persistence.

2.3.3. Sensitivity Analysis and Contribution Rate Calculation

Existing research results indicate that precipitation, temperature, and solar radiation are the climatic factors that have the greatest impact on the LAI [57,58,59,60]. In general, temperature exerts a significant impact on high-latitude and high-altitude areas, whereas precipitation plays a noticeable role in arid and semi-arid regions, and solar radiation is a crucial source for plant growth. Therefore, this study primarily focuses on these three indicators as the research objects for investigating changes in the LAI. The sensitivity and contribution of each meteorological factor to vegetation changes were assessed using the following methods:
(1)
Constructing a multiple linear regression relationship between LAI and temperature, precipitation, and shortwave radiation.
L A I = a p P r e + a t T m p + a s S d a r + b
where ap, at, and as represent the regression coefficients of precipitation, temperature, and solar radiation on the LAI and also represent the sensitivity of the LAI to these three meteorological factors; and b is the constant term in the linear regression equation.
(2)
Decompose the change rate of LAI
Since the change rate of the dependent variable is equal to the partial derivative of the dependent variable with respect to the independent variable multiplied by the change rate of the independent variable, by calculating the change rate of the LAI and decomposing it, the following can be obtained:
d L A I d t = L A I P r e P r e d t + L A I T m p T m p d t + L A I S d a r S d a r d t   = a p P r e d t + a t T m p d t + a s S d a r d t   = C p r e + C t m p + C s d a r
where dLAI/dt represents the change rate of the LAI, which can be solved by the least squares method. Cpre, Ctmp, and Csdar represent their contributions to the growth rate of the LAI. The partial correlation coefficient can be used to analyze the impact of a single factor on the LAI change. To facilitate the calculation of the relative contributions among the three, they can be integrated and calculated as a value between 0 and 1. The specific calculation formula is as follows:
C = C i i = 1 3 C i
where Ci represents the relative long-term trend contributions of the three climate driving factors to LAI, and C is their contribution value.

2.3.4. Gray Relation Analysis

Gray Relation Analysis (GRA) is a method based on the geometric approximation of the sequence of behavioral factors and the primary sequence of behaviors. It is utilized to analyze and determine the degree of influence among factors or the contribution of factors to primary behaviors [61]. GRA is designed to handle finite data and information to study uncertainty, and it is not constrained by the type of samples and probability distributions [62] and is computed by the following formula:
The expression for the comparison factor is:
x 0 = [ x 0 ( 1 ) , x 0 ( 2 ) , , x 0 ( n ) ]
The reference factor series is expressed as:
X i = [ X i ( 1 ) , X i ( 2 ) , , X i ( n ) ]
The gray correlation coefficient, γ, between Xi and x0 is:
γ ( x 0 , X i ) = 1 n k = 1 n x ( m i n ) + ζ x ( m a x ) Δ 0 i ( k ) + ζ x ( m a x )
Δ 0 i ( k ) = x 0 ( k ) X i ( k )
x ( m i n ) = m i n i   m i n i Δ 0 i ( k )
x ( m a x ) = m a x i   m a x i Δ 0 i ( k )
Using the LAI as the comparison factor and air temperature, precipitation, and radiation as the reference factors, the corresponding gray correlation coefficients were calculated, and the closer γ is to 1, the higher the degree of correlation.

2.3.5. Random Forest

The random forest algorithm, initially proposed by Breiman, is a classifier that leverages multiple decision trees for training and predicting samples. One of its key advantages is its resilience against overfitting, and it possesses the capability to assess the relative importance of each feature.
The primary steps of the algorithm are as follows:
(1) Bootstrapping: K different sample datasets are extracted from the original dataset using the bootstrap method, creating subtraining sets for each decision tree. The sample sizes are identical to the original dataset.
(2) Training Decision Trees: Each sample training set is used to generate K different sample datasets, serving as subtraining sets for each decision tree. Each sample size is the same as the original dataset.
(3) Testing: for the test data, each decision tree is utilized separately to test and obtain the prediction value of the corresponding single decision tree.
(4) Aggregation: the forecast results of K decision trees are averaged to derive the final forecast results.
With the help of the above research data and methodology, the main conceptual framework of this research is as follows (Figure 2):

3. Results

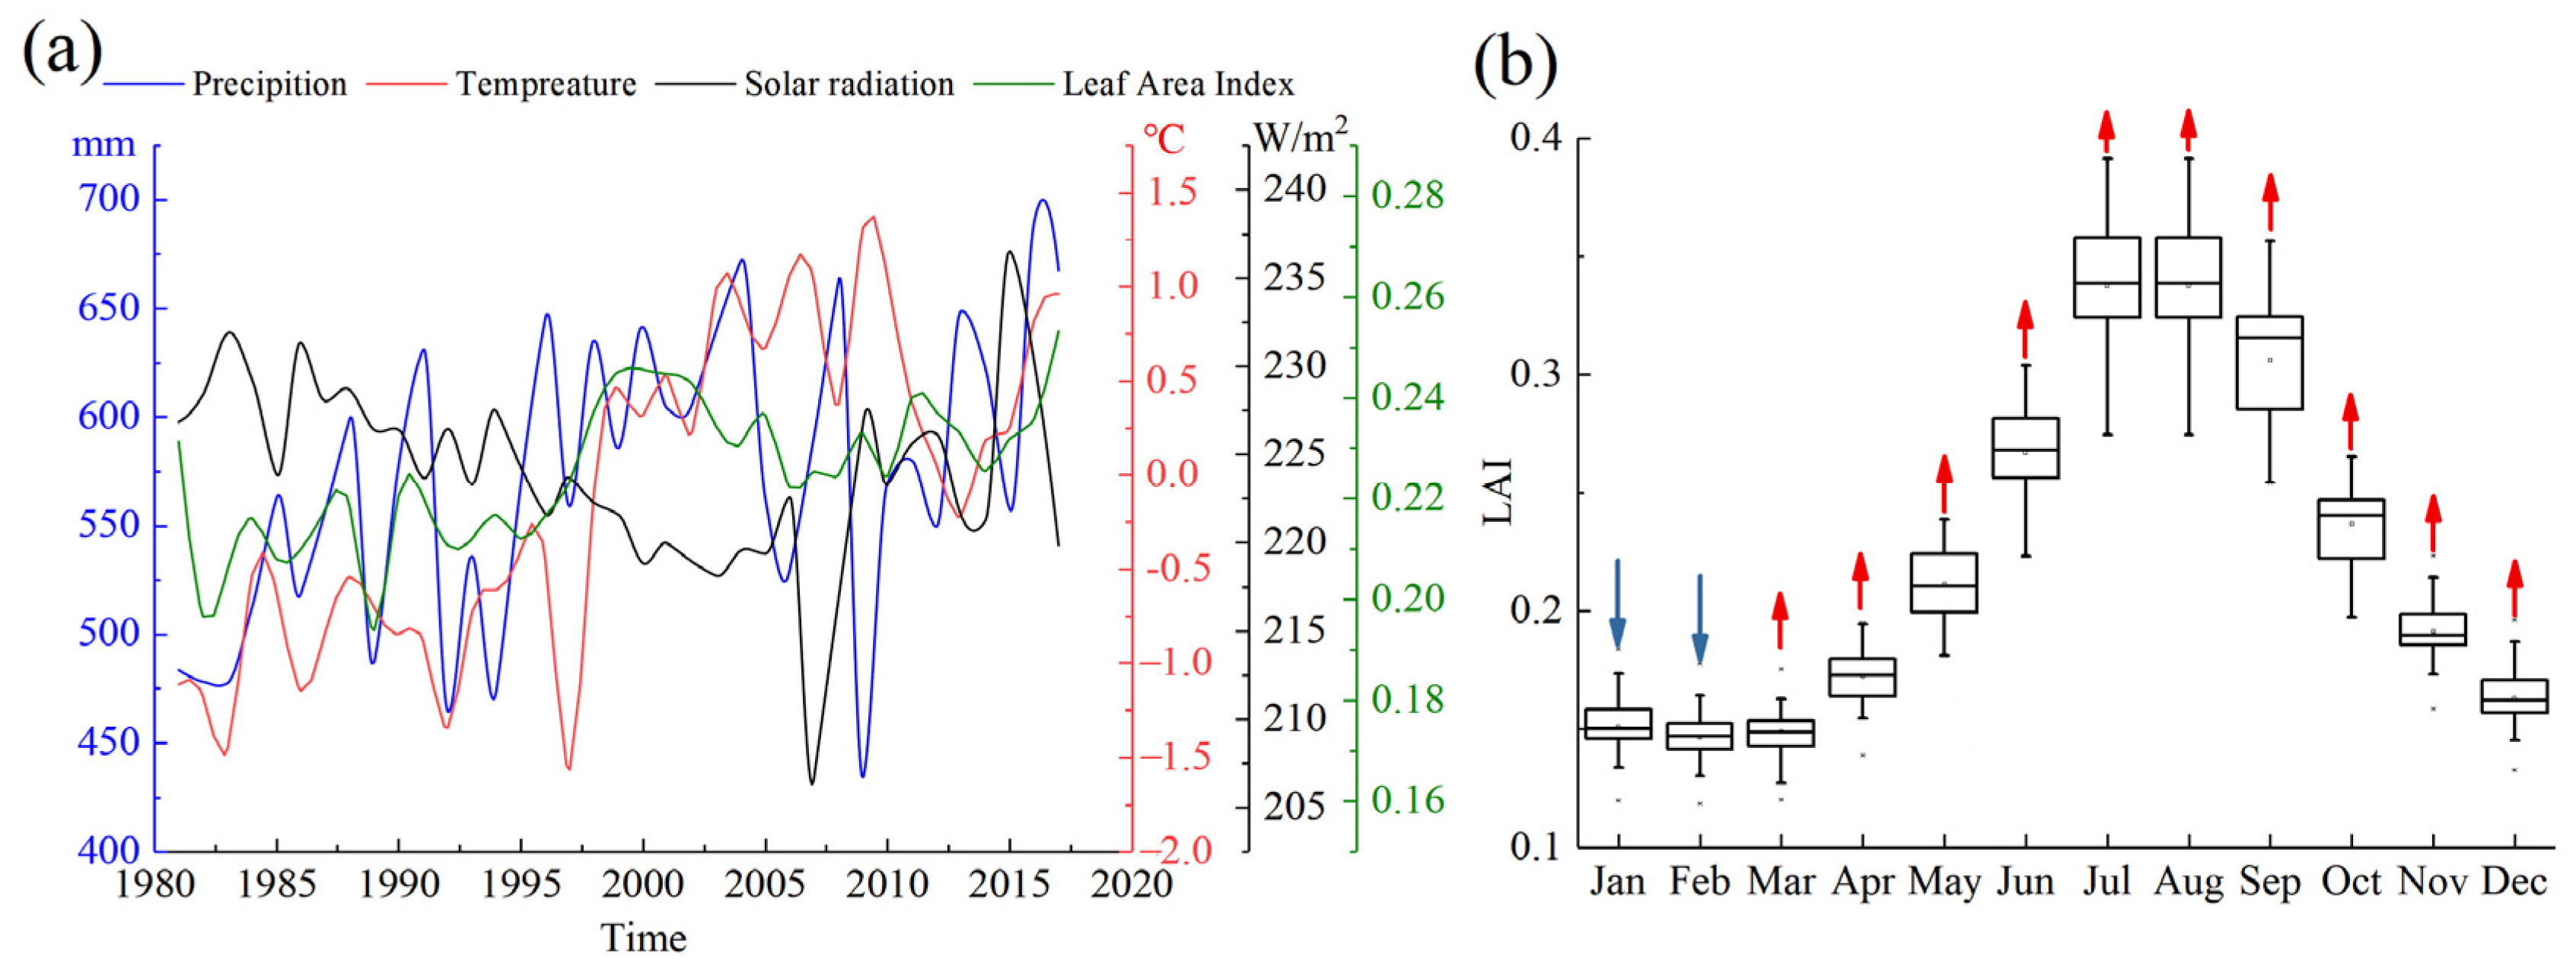
3.1. Spatial and Temporal Variation Characteristics of LAI

The one-dimensional data on the time scale can reflect the average change in the LAI in the basin over the past 37 years, and the results are shown in Figure 3. From the temporal changes in the LAI and climate factors, it can be seen that the annual average LAI in the Yarlung Tsangpo River basin had a certain upward trend, and this pattern of change is consistent with the pattern of change in the temperature and precipitation in the basin. From the distribution within a year, spring and summer are the main seasons in which the basin’s LAI rises, and the LAI increased by 0.28–0.35 on average in these two seasons and then began to fall in September, basically falling back to the beginning of the year in December. From the point of view of the change in the LAI within a year, except for January and February, the LAI in other months increased to different degrees over the past 37 years.
A spatial variation analysis revealed the spatial heterogeneity of the LAI’s change process over the past 37 years in the Yarlung Tsangpo River basin. The distribution of the LAI’s spatial variation in the basin, as illustrated in Figure 4, displays a noticeable gradient difference. Considering the land use distribution and slope distribution map within the watershed, it becomes apparent that downstream forested areas with steeper slopes exhibited a significant reduction in the LAI. Conversely, forested areas near the river channel emerge as the primary zones in which the LAI experiences a substantial increase. Concurrently, there is a discernible elevation in the annual average LAI within grassland areas in the middle and upper reaches of the watershed.
The annual-scale distribution of the Hurst Index reveals distinctive patterns. In the mountainous and glacier-covered areas of the lower basin, the Hurst Index consistently hovered around 0.5. This suggests that the LAI in this region exhibits a certain degree of randomness. In contrast, across other areas, the Hurst Index tended to be greater than 0.5, indicating a degree of continuity in the change pattern. Specifically, the increase in vegetation in the upper reaches of the basin and the decrease in vegetation in the lower reaches both persisted over an extended period. This implies that the observed vegetation changes in the upper and lower parts of the watershed will endure for a prolonged duration.
The results of the MK trend test z-values for the variation in the LAI in each elevation zone are shown in Table 2, where the elements with significant changes are shown in bold. It can be seen that there are significant differences in the trends of the LAI in the different elevation zones, with the significant differences in the changes basically using 3000 m as the dividing line. Although the LAI of the lower elevation zone had a relatively large amount of change, the change was not significant because the lower bedding surface is woodland, while the change in the LAI of the higher elevation zone was not significant, but because it is mostly barren land and snow-covered areas, the change in the higher elevation zone was more obvious in terms of the significance of the change. In terms of seasonal trends, the LAI increased significantly in spring, summer, and autumn, with the dominant areas being the higher elevations above 3000 m, while in winter the LAI decreased to some extent and the dominant areas changed to lower elevations. This indicates that although the LAI is generally increasing in the watershed, there are significant regional and seasonal trends, which is similar to the phenomenon shown in the Hurst Index in the previous section.

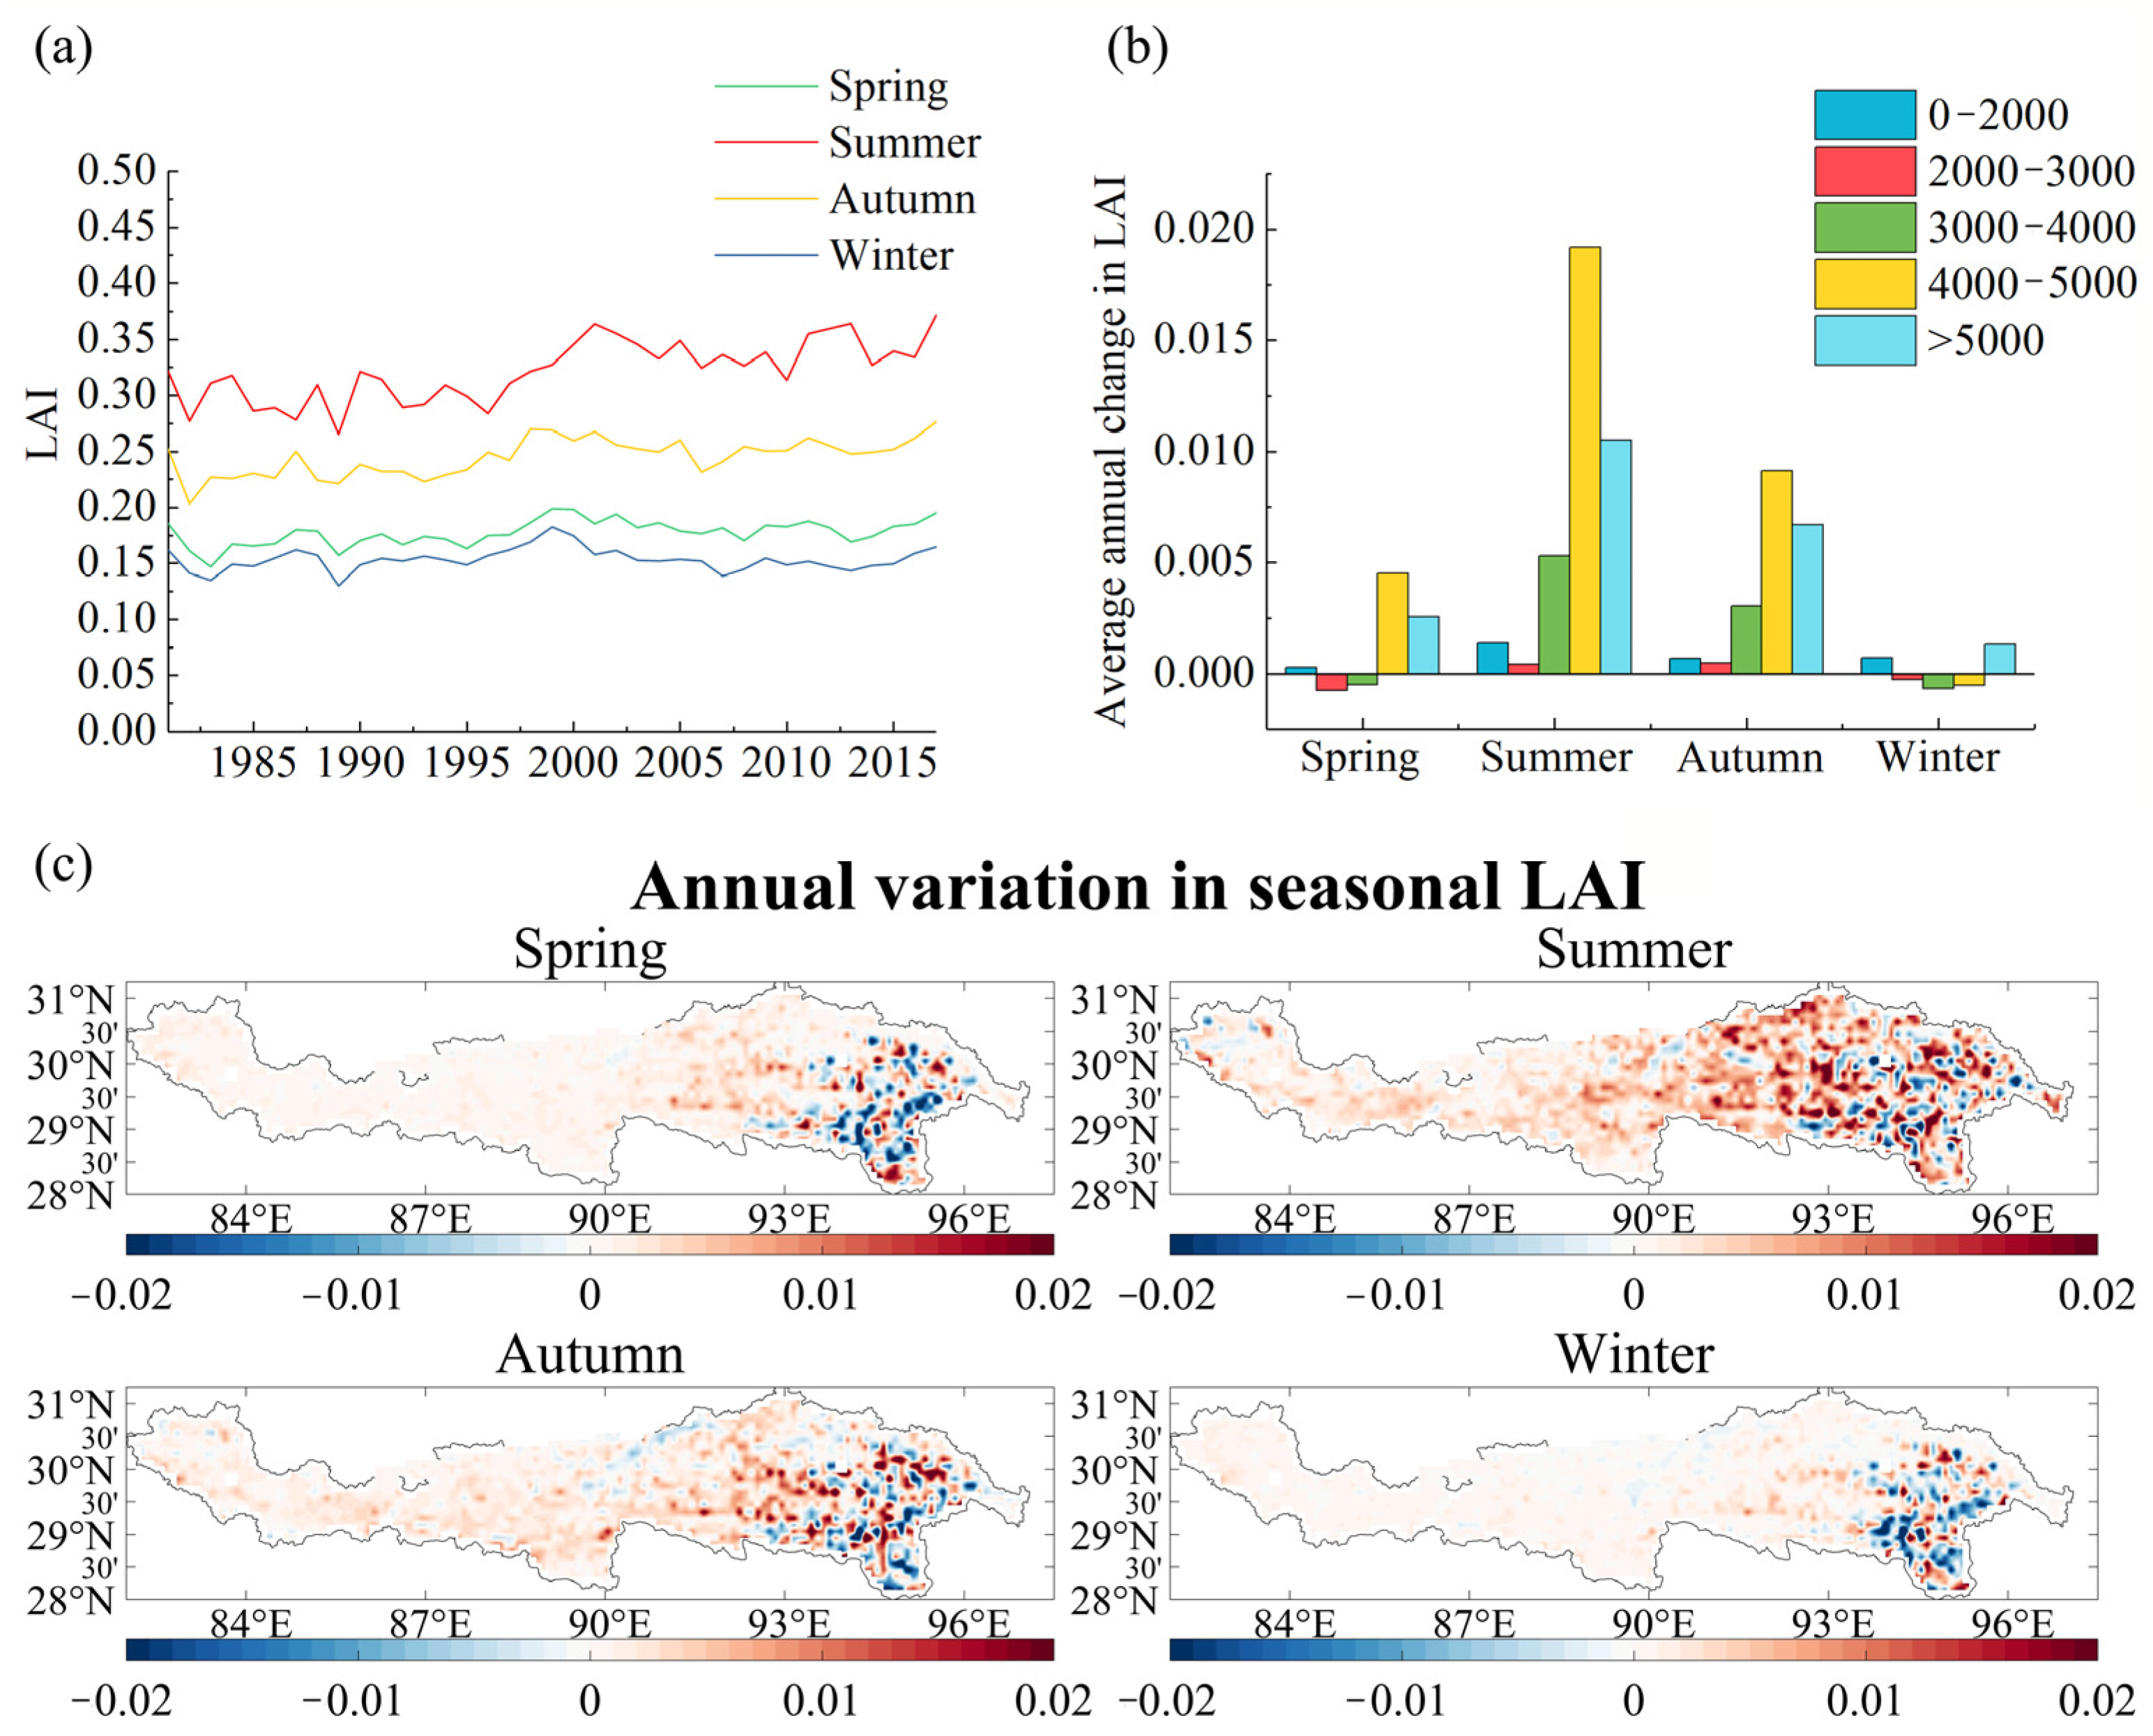
3.2. Seasonal Spatial and Temporal Dynamics of LAI

To examine the seasonal variation in the LAI in the study area, the LAI values for four seasons were averaged. This allowed for an assessment of the LAI’s changes across each season, exploring variations over time, space, and different elevation zones. The results are presented in Figure 5.
It can be seen that autumn and summer are the main seasons for LAI growth, and the overall fluctuation in the LAI during summer is the largest, while the overall changes in spring and winter are smaller, which have limited influence on the interannual changes of the LAI in the basin as a whole. The elevation variation results indicate a positive correlation between the LAI and elevation. In the low-elevation area (0–3000 m), there is a certain magnitude of decrease in the LAI during spring and winter, with less noticeable growth in the summer and autumn. Conversely, the high-elevation area exhibits a varied degree of increase in the LAI during spring, summer, and autumn, particularly in the summer and autumn seasons. Combining the seasonal and spatial distribution disparities, it becomes evident that the primary contributor to the LAI’s increase in the watershed is the grassland in the high-altitude areas. In terms of spatial distribution, the augmentation of the LAI in the grassland during the summer and autumn emerges as the most significant factor influencing the seasonal changes in the LAI across the entire basin. In terms of the mean difference in the interannual variation, April to October is the main growing season for vegetation in the watershed, and in terms of the monthly contribution to the seasonal variation in the LAI, the highest contributing changes are in May in the spring, June in the summer, September in the fall, and December in the winter; this variation characterizes most elevation zones in the watershed.

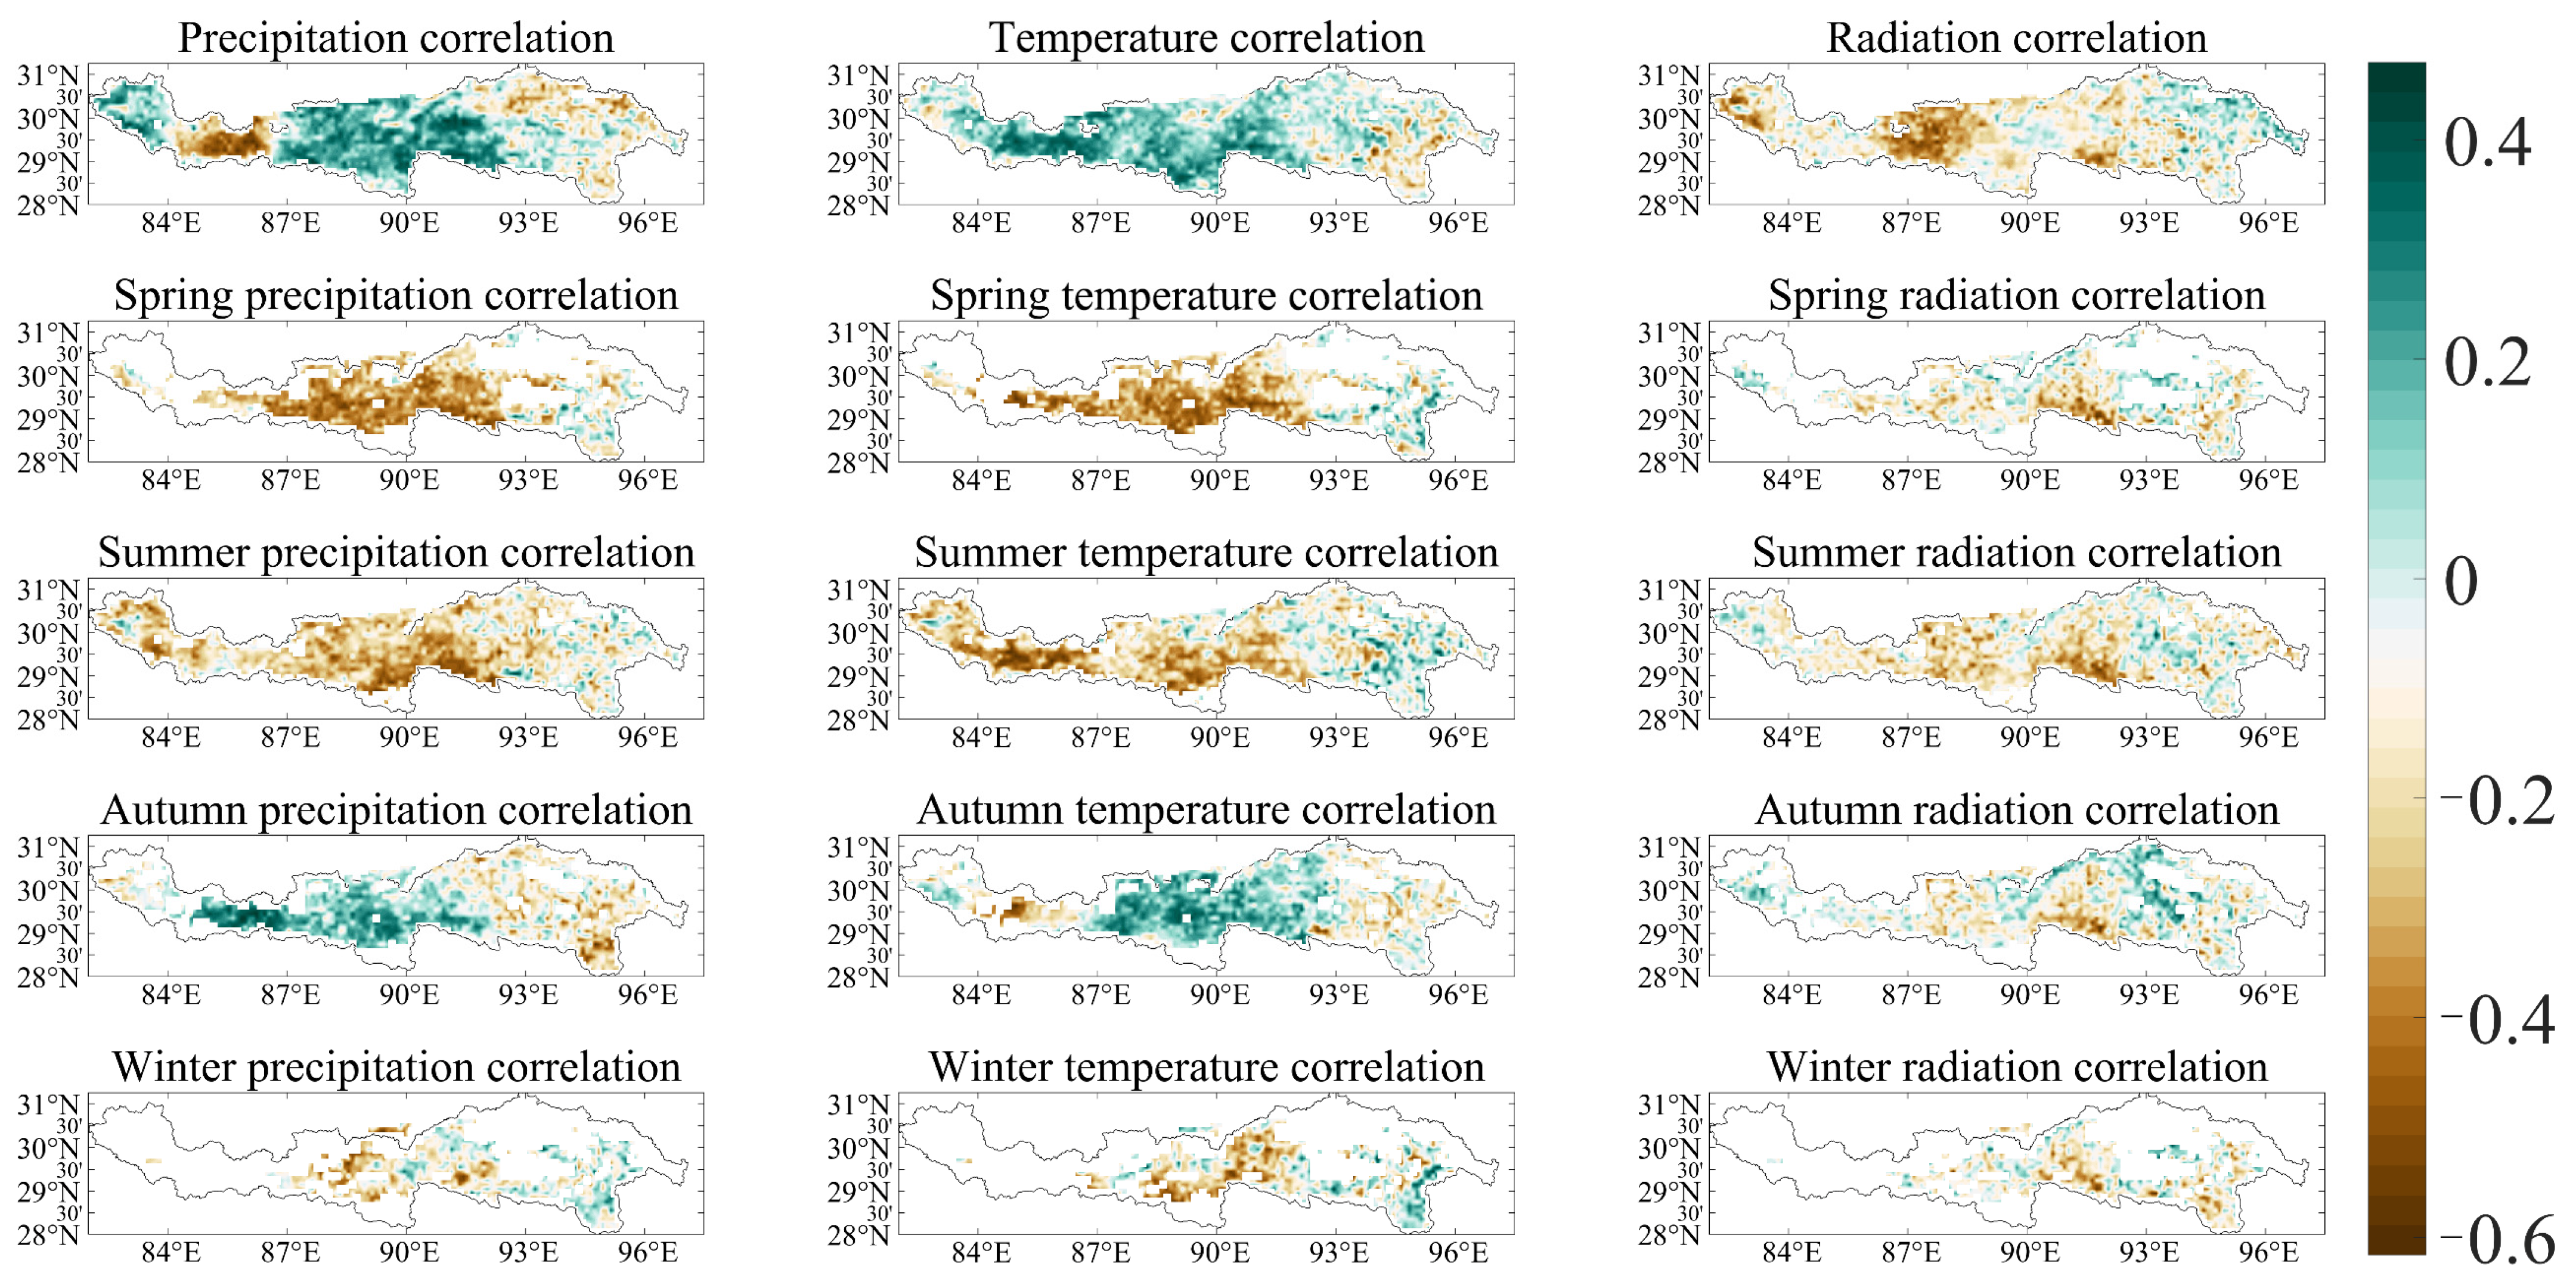
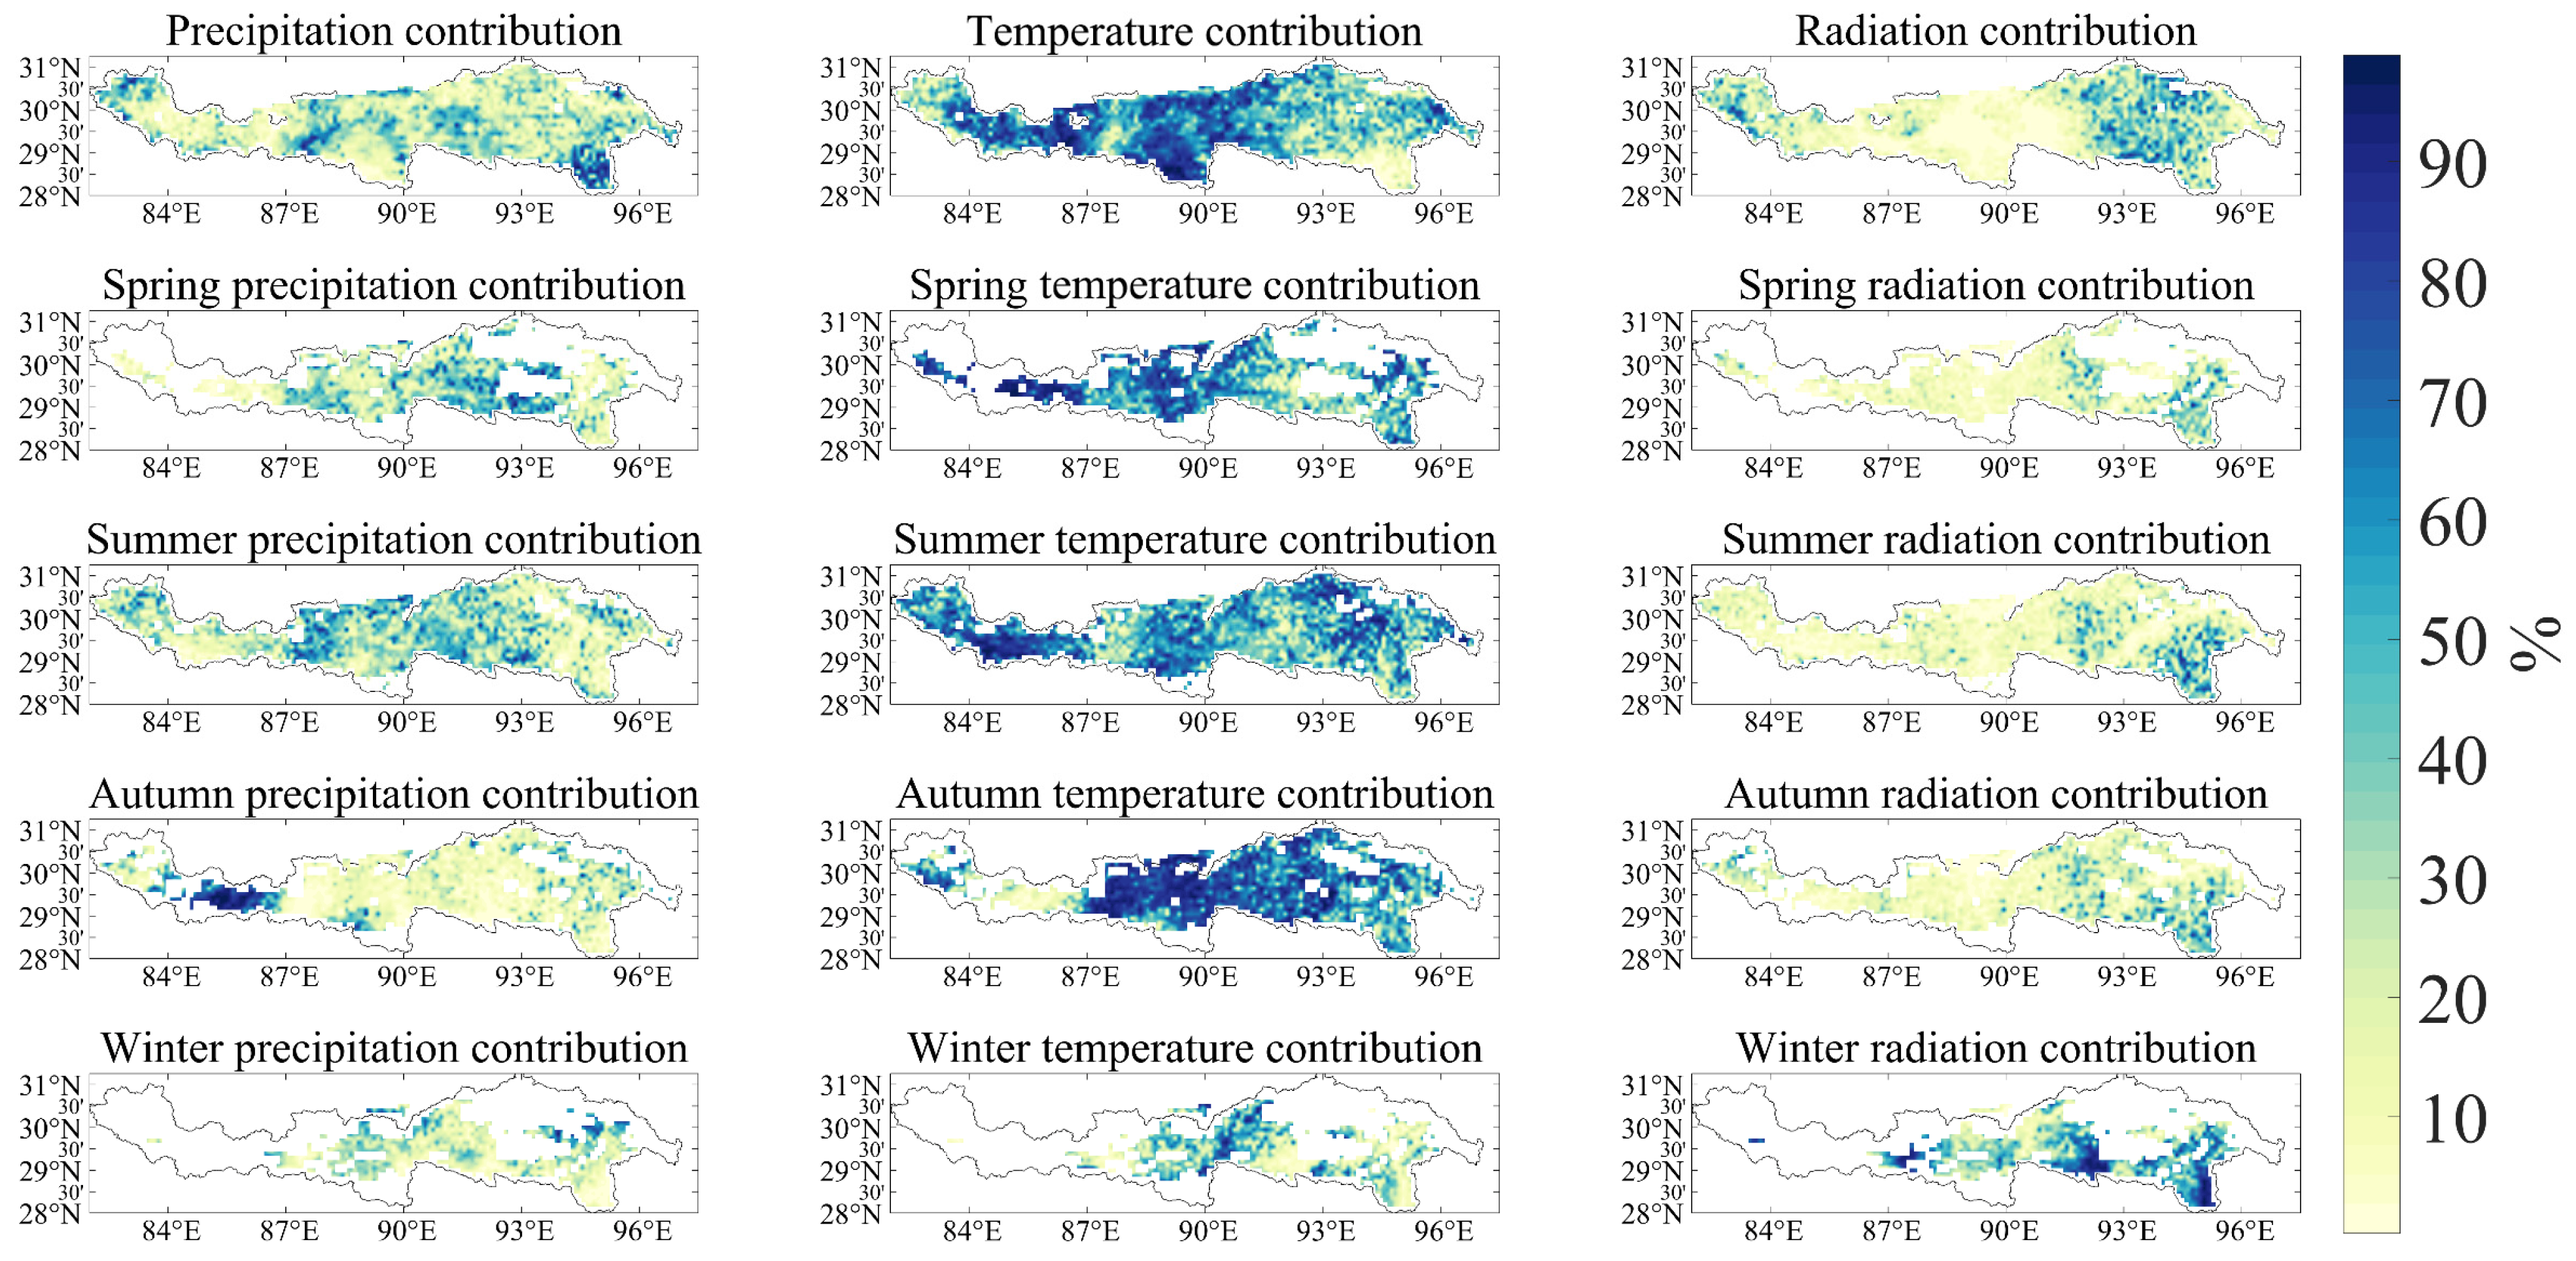
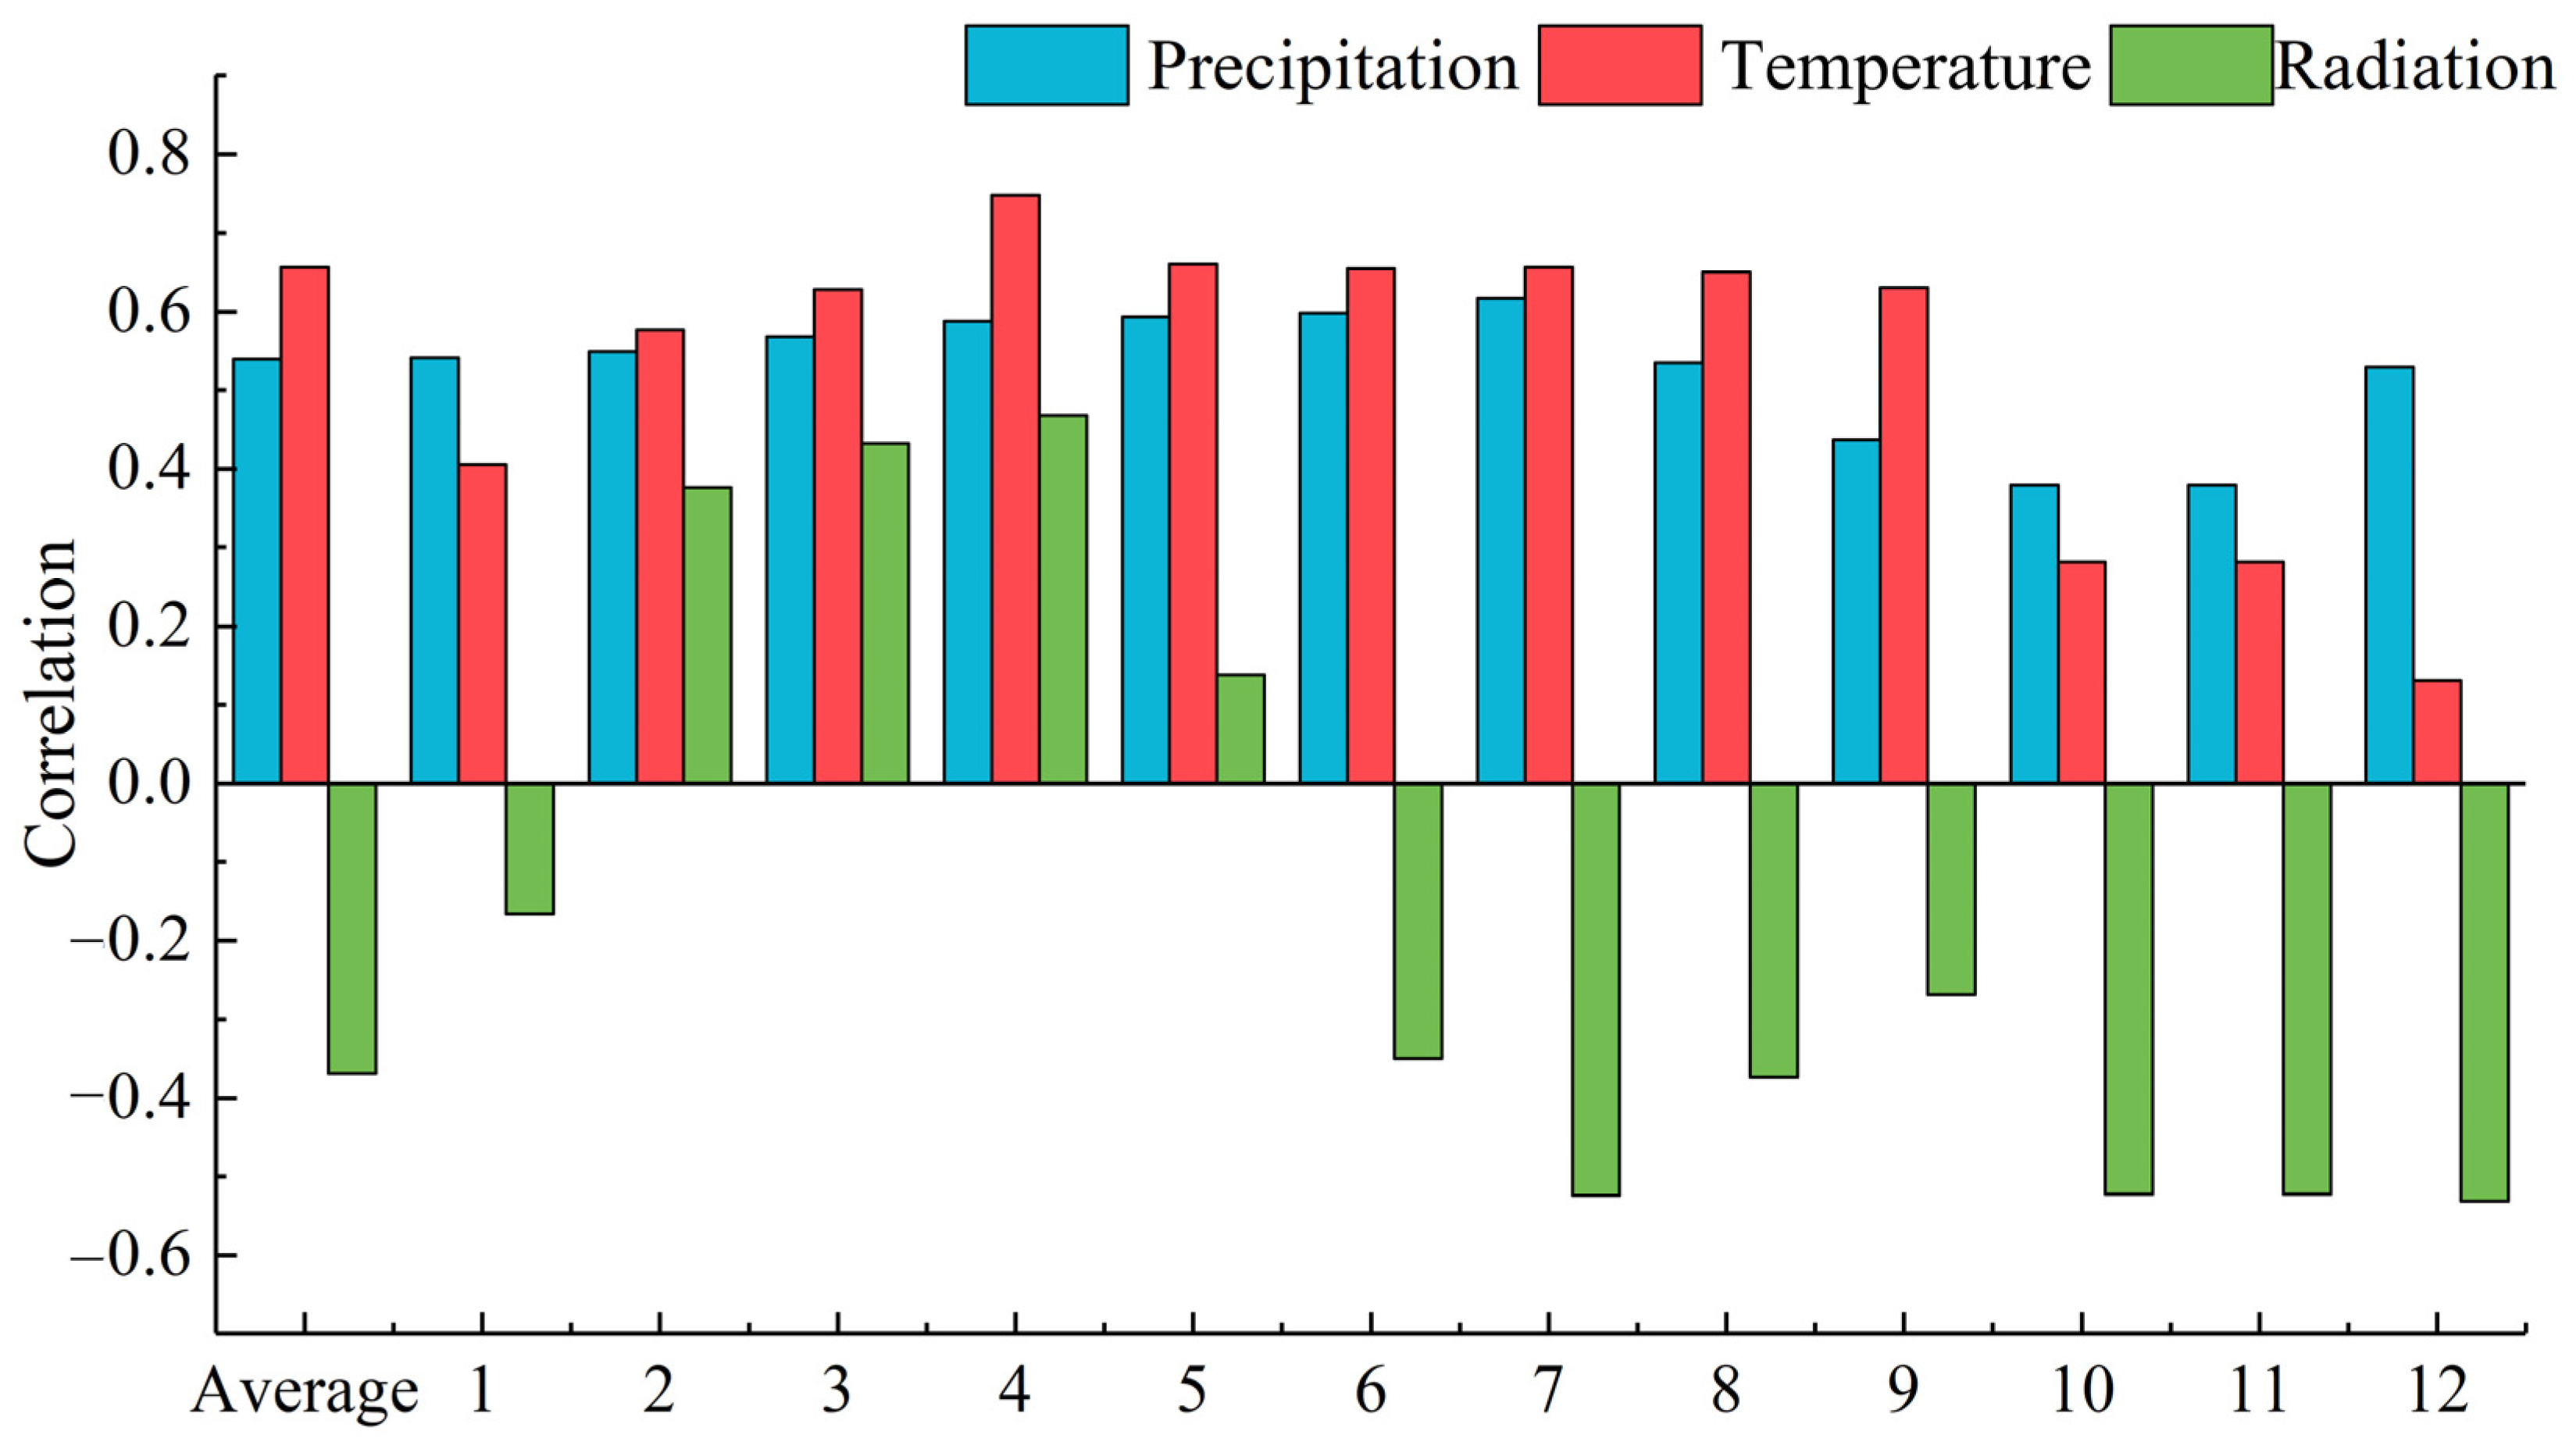
3.3. Spatial Correlation and Contribution of Climate Elements to LAI

In order to systematically analyze the correlations and contributions between the three climate factors and LAI, the correlation coefficients and contributions were calculated from the perspectives of the annual and seasonal averages, and the results are shown in Figure 6 and Figure 7, respectively. Because the study area is located in the alpine region and the vegetation types are mostly grasslands, considering the special characteristics of the study area, the vegetation with an LAI mean value of less than 0.1 was excluded from the seasonal variation study in this paper to more accurately depict the effect of climate on the LAI.
It can be seen that the correlations of the three climate factors have more obvious regional and seasonal characteristics. The correlation of rainfall and LAI at the interannual scale shows an obvious positive correlation, and this relationship is most concentrated in the grassland in the central part of the basin. Seasonally, there was a negative correlation observed between precipitation, including snowfall, and the LAI during the spring and summer, as well as in winter, particularly in the middle and upper reaches of the basin. Conversely, autumn exhibited a more evident positive correlation. The regions with relatively high correlation coefficients were predominantly concentrated in the middle and upper reaches of the basin. In most downstream areas, a nonsignificant negative correlation was noted, except during winter. The correlation coefficient between the air temperature and LAI was found to be the highest among the three climate factors. On an annual scale, the overall changes in the air temperature and LAI demonstrated a more pronounced positive correlation. Specifically, the correlation between the temperature and LAI was prominent in the middle reaches of the watershed. In the spring and summer, there was a negative correlation between the temperature and LAI, whereas the opposite held true in the autumn and winter. This could be attributed to environmental changes that are unfavorable to grassland growth due to increased temperatures in the autumn and winter, leading to a shift in the seasonal vegetation conditions in the region. The association between the solar radiation and LAI was found to be the most stable among the three environmental factors. It exhibited a positive correlation In the middle and lower reaches of the watershed, where the vegetation cover is more prevalent. Conversely, a negative correlation was observed in the middle and upper reaches, and this correlation did not change with the seasons. It can be seen that the correlation between the LAI and climate factors in woodland areas shows another state, which may be more closely related to the growth cycle of woodland; compared with the annual growth of grassland areas, the multiyear growth of woodland areas have a more complex response mechanism to climate factors.
In the context of regional relationships, the most notable correlation between the LAI changes and climate change is observed in the grassland areas in the middle reaches of the basin. However, the correlation with climate change is limited in the wildland, glacier, and permafrost areas in the upper reaches of the basin, as well as the woodland areas in the lower reaches of the basin. Positive correlations are concentrated in the grassland and woodland areas in the middle and upper reaches of the watershed, whereas negative correlations are observed in the lower reaches. The changes in the LAI indicate that temperature and precipitation play a significant role in the development of grassland in the Yarlung Tsangpo River basin, while reduced radiation negatively impacts the vegetation cover in the woodland areas. In terms of the different vegetation types, the grassland LAI has a higher correlation with precipitation, while the other vegetation types have a higher correlation with temperature, and radiation has a higher correlation basically only with the more densely vegetated downstream woodland areas.
Figure 7 illustrates the contribution of the three climatic factors to the change in the LAI from 1981 to 2017 at both interannual and seasonal scales. The results show that of the three climate factors, temperature contributed significantly to the change in the LAI in most parts of the basin. Especially noteworthy is the grassland-covered areas in the upper and middle reaches of the basin. The contribution of precipitation to the change in the LAI is primarily concentrated in the woodland-covered areas in the lower part of the basin and in certain grassland areas in the upper and middle reaches of the basin; the contribution of radiation to the change in LAI is more concentrated, with a more significant effect only in the woodland areas in the lower reaches of the basin. From a seasonal perspective, the contribution of temperature was significant in spring, summer, and autumn, covering most of the basin. In winter, this contribution decreases and is only sustained in the middle reaches of the basin. During the spring and summer, precipitation contributes to vegetation changes in the grassland areas in the central part of the basin. In the autumn and winter, this contribution is concentrated in the upper and lower parts of the basin, with a diminishing impact on grassland areas. Radiation maintains the same distribution and contribution as the interannual contribution in the spring, summer and autumn, but in the winter the influence of solar radiation starts to increase significantly, exceeding the contribution of precipitation and temperature in most parts of the basin, and the more south, the more pronounced this phenomenon becomes. Analyzed from the point of view of the type of vegetation, the closer to the lower reaches of the area with more woodland cover, the higher the contribution of the solar radiation, and vice versa, the higher the contribution of the temperature, which is due to the different perspectives of the two types of vegetation in terms of the demand for climatic factors in the process of growth, with woodland having a much higher demand for solar energy than grassland, which relies more on the changes in the growing environment brought about by the air temperature.
Table 3 demonstrates the correlation and significance of the LAI with climatic factors among elevation zones. It can be seen that the correlation between temperature and precipitation gradually increased with the gradual increase in elevation. It can be seen that the correlation between air temperature and precipitation gradually increased, while the correlation of radiation was maintained at a relatively average level, which indicates that there is a more obvious difference between air temperature and precipitation in the watershed in the two major land-use types of forest and grassland and that the increase in precipitation and air temperature is more conducive to the growth of grassland.
In terms of the change in the contribution rate, the higher the elevation, the greater the contribution of temperature and the smaller the contribution of radiation and precipitation. This suggests that compared with the woodland growing at low altitude with strong photosynthesis, the element of air temperature is more important in influencing the growth of grass at high altitude, and compared with the woodland with broad leaf blades and a long growth cycle, the environmental factors of grass growth are more dependent on the change in temperature and, at the same time, the reliance on precipitation also decreases with the altitude.
To mitigate the impact of seasonal factors on the correlation between LAI and meteorological factors, adjustments were made. This study removed the monthly average of each month from the 37-year time series and conducted a correlation analysis again, and the results are shown in Figure 8.
It can be seen from the results of the annual mean that the two elements of precipitation and temperature have a positive correlation with the LAI, while radiation indicates a negative correlation, but with the exclusion of the monthly mean, the correlation between climate factors and the LAI begins to change in a different manner. The correlation of precipitation remained stable, but the correlations of temperature and radiation with the LAI began to change, with a decrease in the serial correlation of temperature when the winter and spring months were excluded and a significant increase in the correlation coefficient of radiation when the spring months were excluded. This observation may be associated with alterations in the regional vegetation growth environment resulting from changes in the winter temperature and the time lag in the vegetation growth process across different elevation zones.

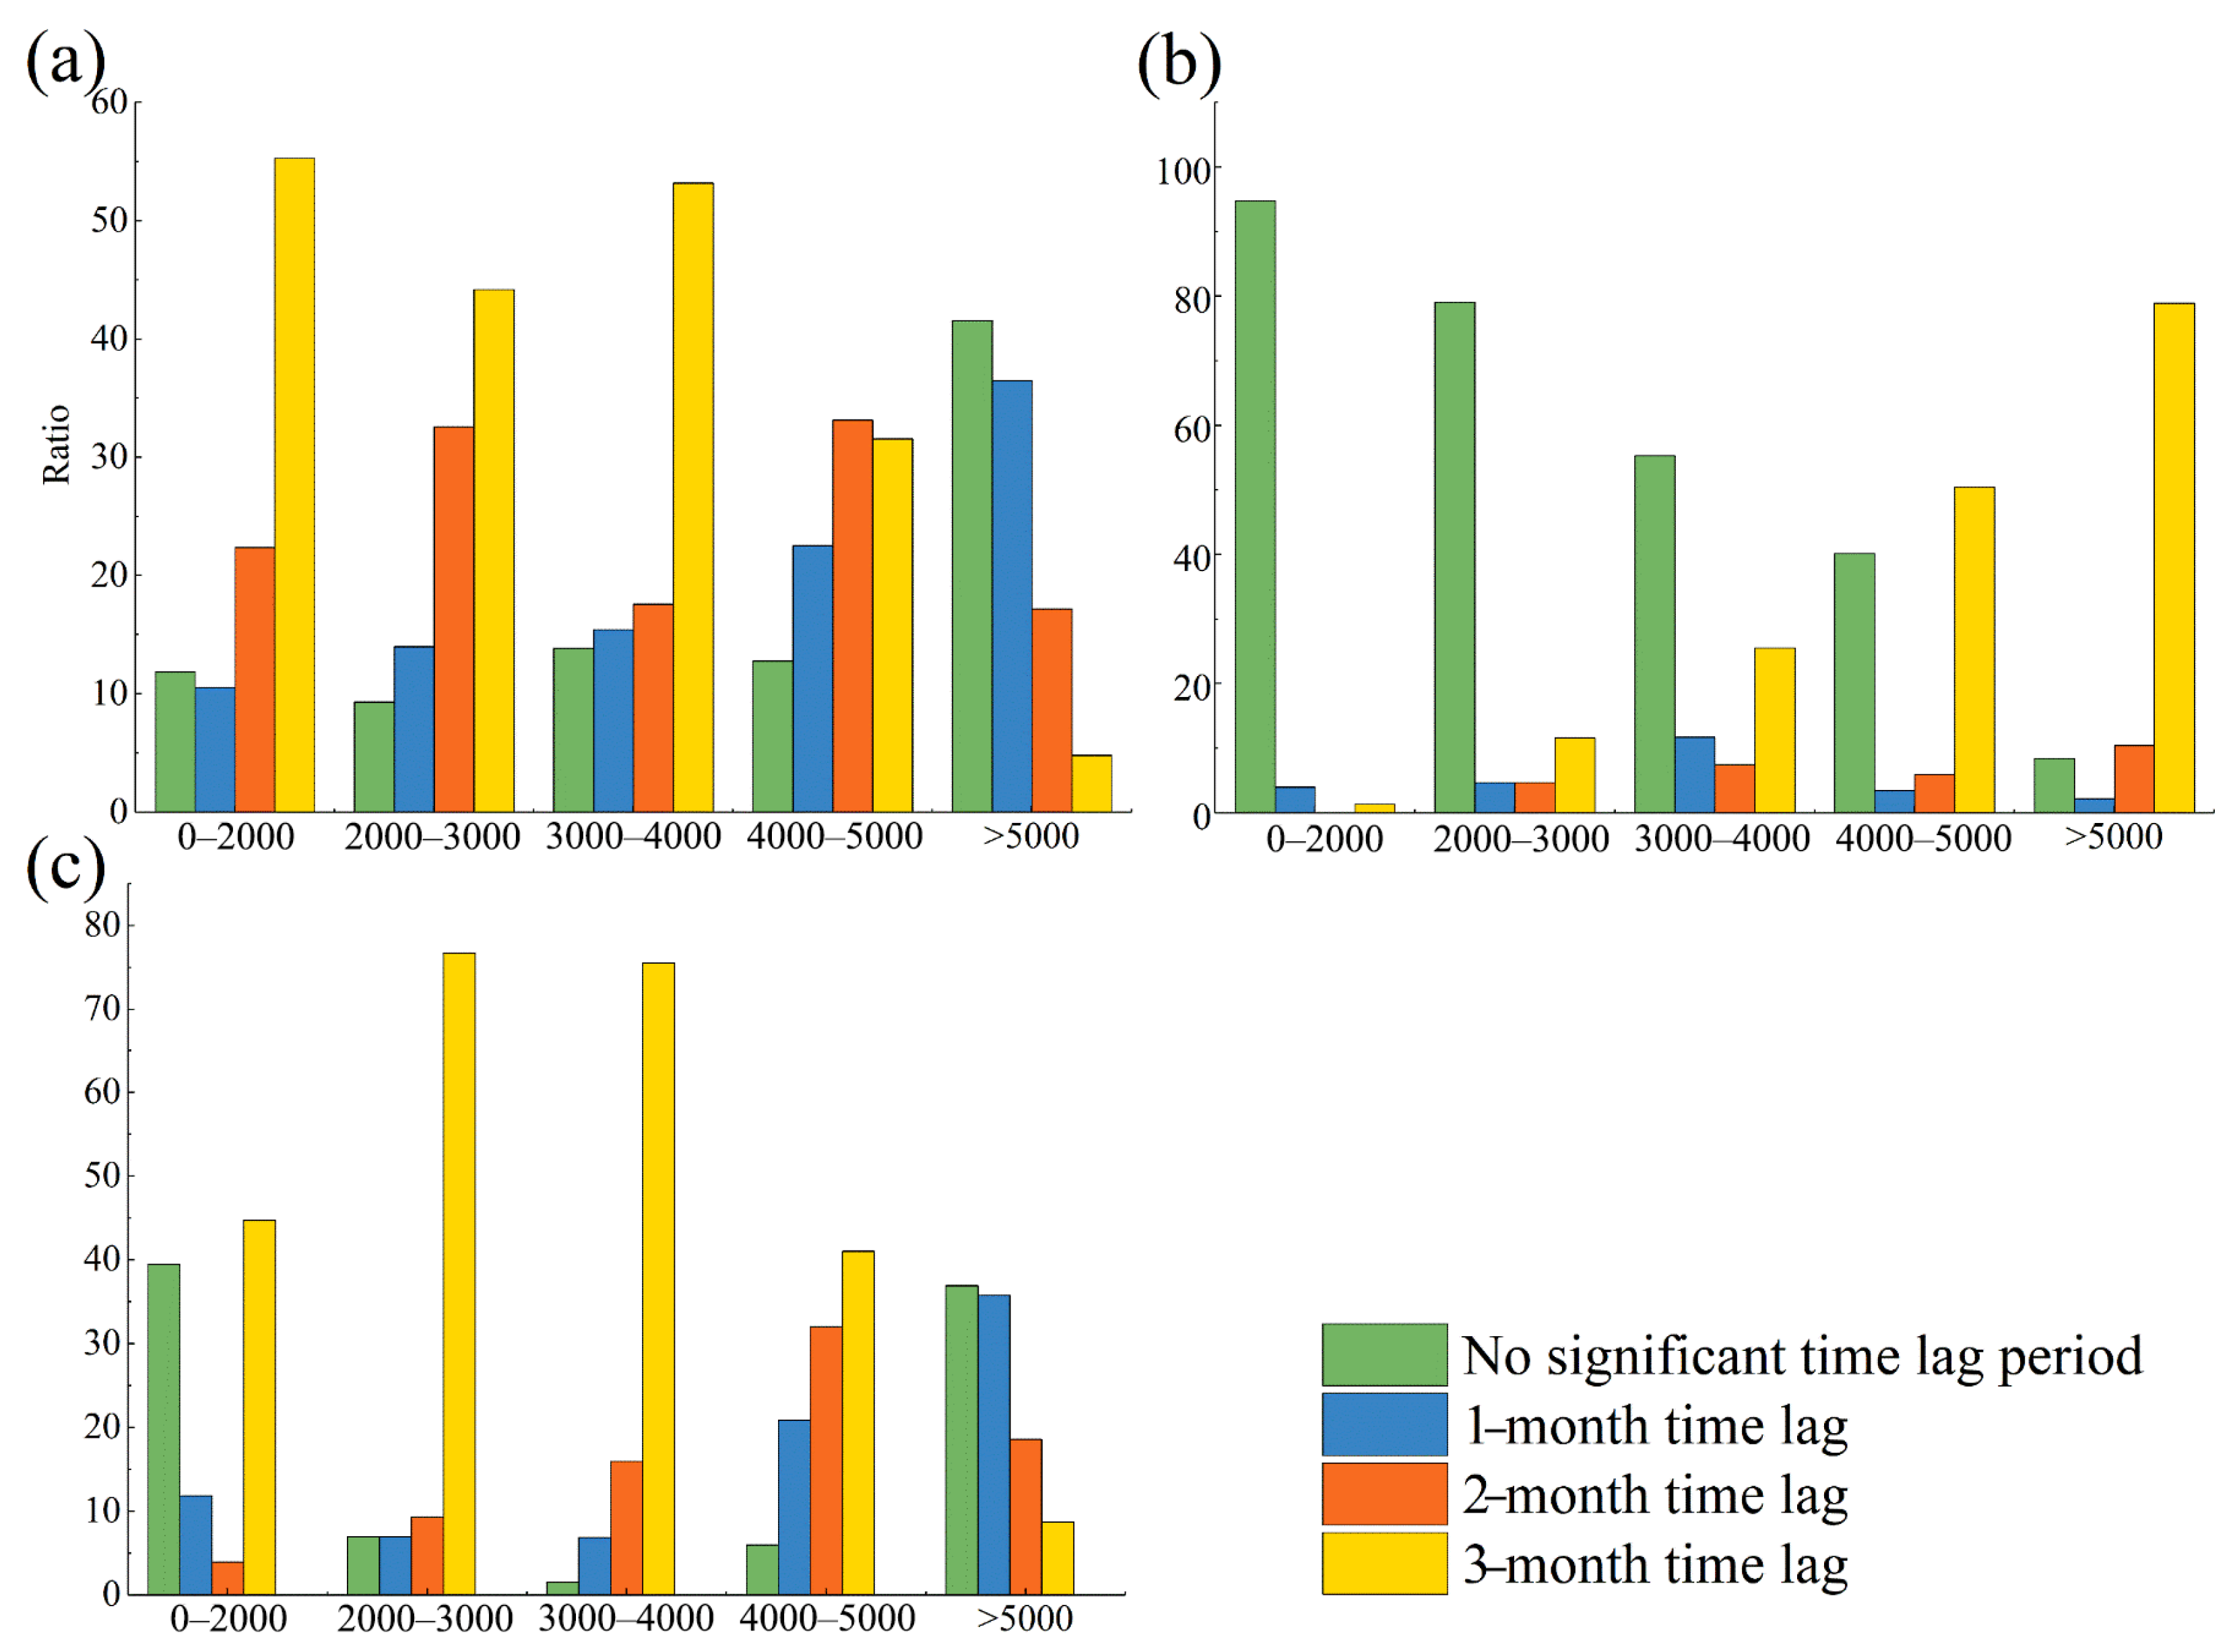
3.4. Time Lag Analysis of LAI and Climate Factors

Vegetation growth exhibits a time lag effect in response to climate factors [63], and distinct time lags exist for different climate factors [64]. This study explored the time lag of the vegetation’s response to climate factors during the growing season (April–October), focusing on precipitation, air temperature, and radiation. The calculation involved using the LAI from April to October as the reference factor. Subsequently, climate factors from April to October, March to September, February to August, and January to July were employed as comparison factors for the gray correlation analysis. This approach yielded results for the time lag between the LAI and climate factors, and the statistical outcomes of the time lag under different elevation bands are presented in Figure 9.
It can be seen that there is a lag in the vegetation for all three factors during the growing season, and there is a clear stepwise difference in the performance at different elevations. The vegetation growth at the low and middle elevations had a more obvious lag effect on the precipitation, and in the area below 4000 m, the three-month lag period was more than 50%. However, this situation was reversed in the high-elevation area, and the proportions of the three lags in the grassland environment between 4000 and 5000 m gradually converge. The lag effect of the LAI on the precipitation was gradually eliminated in the region above 5000 m. The time lag of the LAI on the air temperature was opposite to that of the precipitation. In the region below 4000 m, the LAI had no obvious lag effect on the air temperature, while in the region above 4000 m, the lag effect gradually began to manifest, and in the region above 5000 m, the lag was the most significant. The hysteresis of the radiation was greater in the middle-altitude area of the basin, and the hysteresis was most significant in the area of 2000–4000 m, which gradually weakened when the altitude increased or decreased.

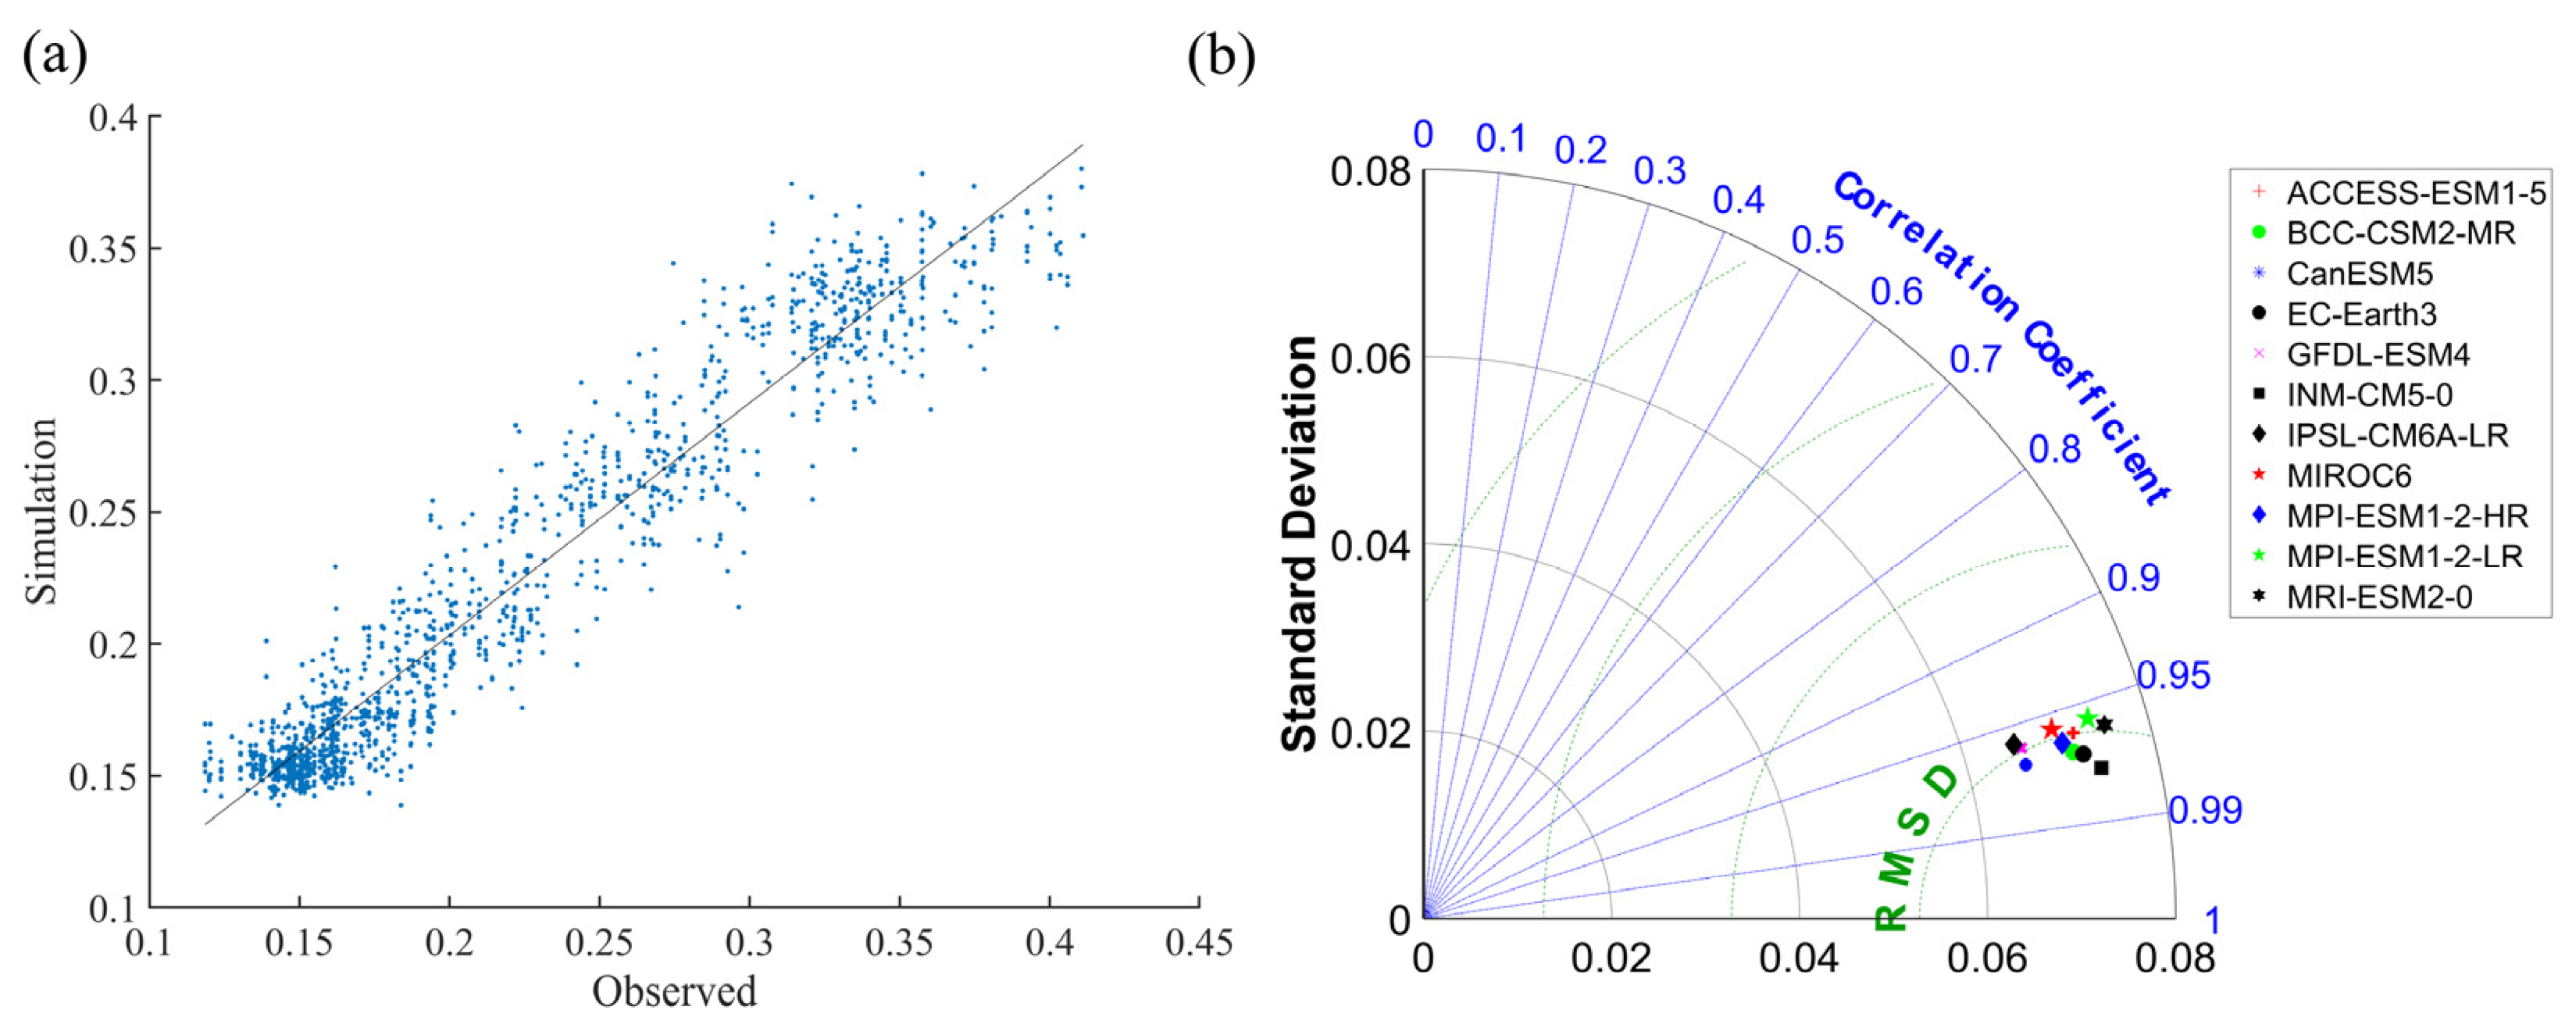
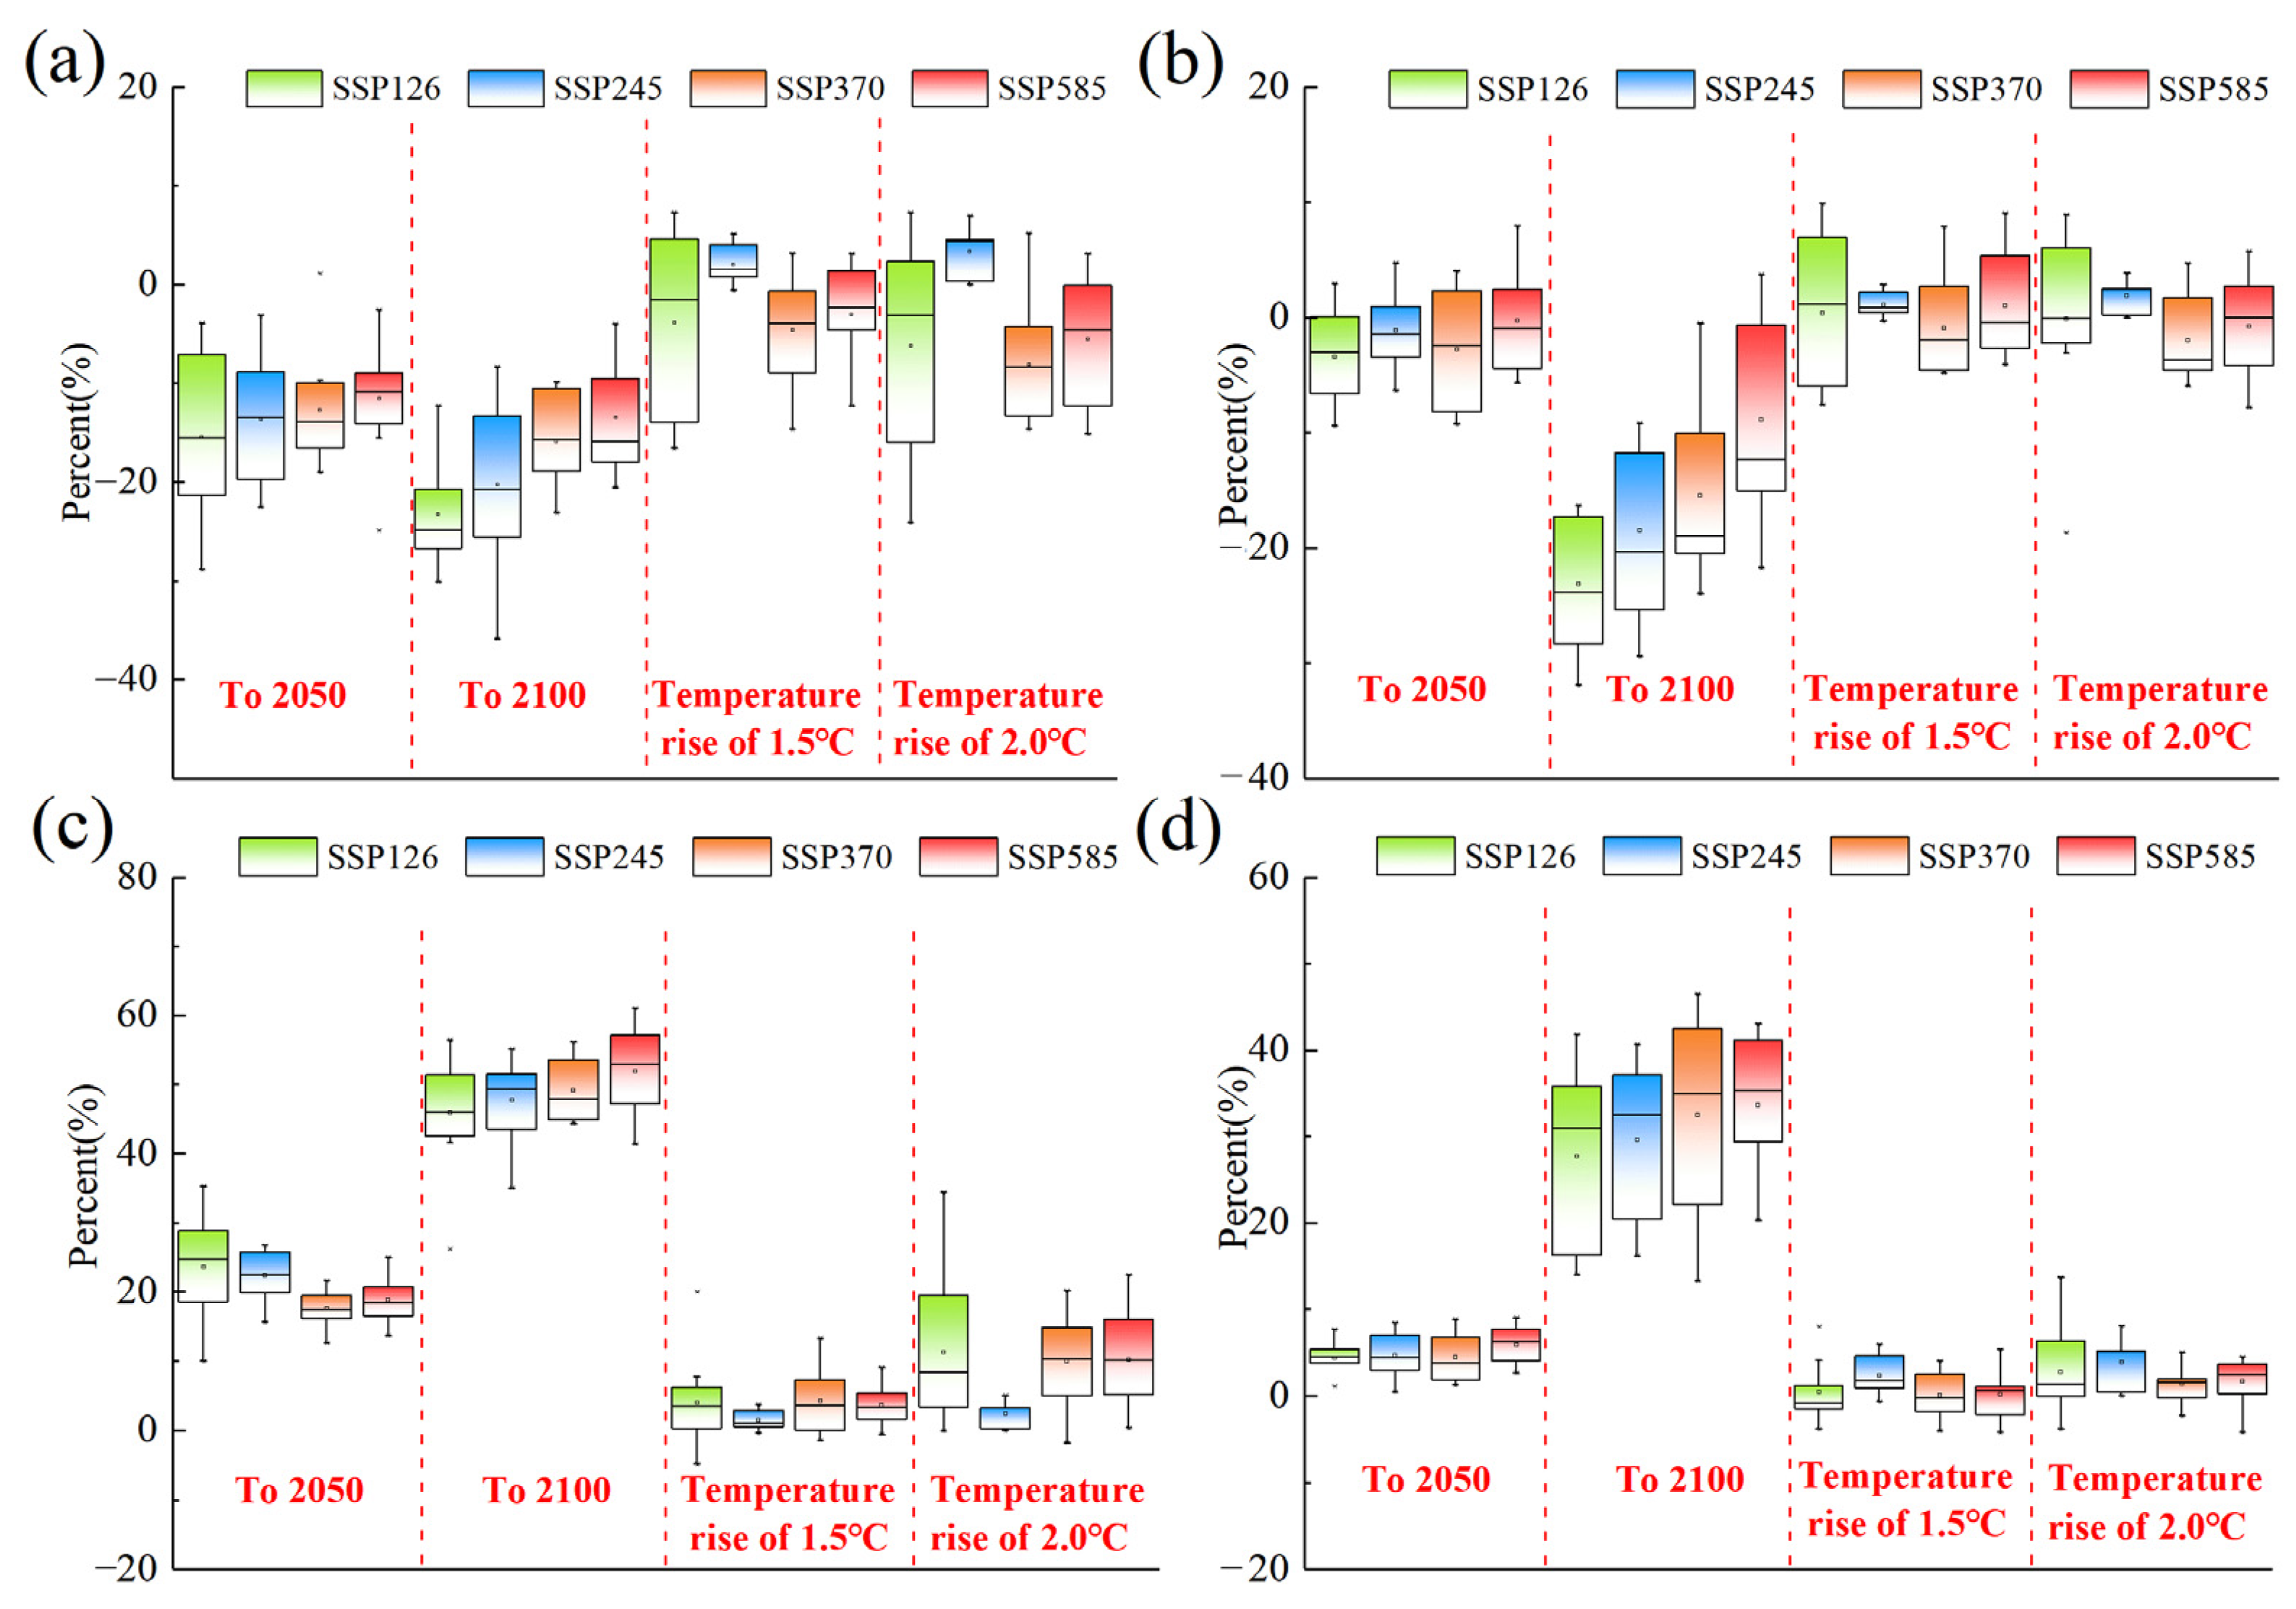
3.5. Projections of Future Vegetation Change

In this study, a random forest model was selected for training the time series of the LAI in the study area and used as a model for predicting the LAI under different scenario patterns in the study area. Before using a random forest model to make predictions, the random forest model should first be validated for different climate scenarios. A total of 11 climate scenarios were chosen, and random forest models were developed for each scenario to train and validate the time series of the LAI in the study area. The results, as depicted in Figure 10, demonstrate that the random forest model effectively reproduced the time series of the LAI in the study area. The correlation coefficients for the 11 climate models are all above 0.95, indicating the strong performance of the models in terms of the root mean square error and standard deviation.
Figure 11 shows the temporal changes in the historical and future leaf area indices under the random forest model simulations. The simulation results for the future scenarios show a significant and more pronounced variability in the change in the LAI for the different emission scenarios. The changes in the LAI for the four scenarios are similar until 2060, but in the far future (2060–2100), the increase in the LAI for the SSP126 scenario reaches a threshold and the overall change no longer shows an increasing trend. The SSP245 scenario had an overall increasing performance, but there were large differences in the age scales and limited changes; the SSP370 and SSP585 scenarios showed a more pronounced increase, and this change was somewhat stable, with the high emission SSP585 model showing a more pronounced increase, with a nearly 50% increase in the change compared to SSP370.
To analyze the change in the LAI at different future time points, the rates of change in the LAI for each of the 11 climate models at four main time points were analyzed and compared using four scenarios. The time points were the near-future period (to 2050); far-future period (to 2100); temperature rise of 1.5 °C; and temperature rise of 2.0 °C. The results of the changes under the different models are illustrated in Figure 7. Analyzing the four major time points of change under the four scenarios, it is observed that the SSP126 scenario exhibited the smallest overall change in the LAI. The increase in the LAI remained at around 3% up to the near-future period (2050), specifically at the time point of a 1.5 °C warming. The overall change in the LAI at the time point of a 2.0 °C warming increased but remained insignificant and did not reach 2.0 °C warming in two models. The change to 2100 is the largest of the four time points, but the overall percentage increase did not exceed 5%. The SSP245 scenario had similar results to SSP126 for the 2050, 1.5 °C, and 2.0 °C time points, but there was some variation at the 2100 time point, with the overall rate of change ranging from 6% to 10, with the EC-Earth3 model, in particular, showing the most significant change. SSP370 and SSP585 were similar in performance, with growth rates remaining at 3%–5% at the 2050, 1.5 °C, and 2.0 °C time points, but SSP585 had an extremely pronounced increase at the 2100 time point, with an overall change of 10%–15%.
It can be seen that the variations in the LAI among the climate scenarios were relatively similar at 2050, 1.5 °C, and 2.0 °C, but there were significant differences at 2100. This variability in the time scales may be related to the overall vegetation growth cycle in the basin: as the temperature increases, the environment for vegetation growth increases, thus overlapping with the existing vegetation cover in the basin, resulting in a more pronounced change in the LAI over a longer time line. This is also reflected in the interannual variation in the LAI in Figure 12.
In order to analyze the change in the seasonal LAI at different time points in the future in more detail, the amount of change in the LAI at four future time points in different seasons was studied separately in this paper, and the results are shown in Figure 13.
It can be seen that there are relatively obvious differences in the changes in the LAI at different time points in the future for the four seasons, among which the overall decline in spring is within 20%, except for the 2100 time point, and there are obvious differences in the performance of each model. In summer, the LAI is basically unchanged at the remaining three time points, except for 2100. The performance of each model is relatively stable at the four time points in autumn, with the largest increase of 50% at 2100 and 5–20% at the other three time points. In winter, the increase is mainly significant at the time point of 2100, while the changes at the other time points are relatively weak. As can be seen, the seasonal changes in the future LAI are more pronounced in the autumn and winter, with spring being the main season for decreases in the LAI, while summer, when vegetation growth is at its peak, does not show a significant change, which also reflects the trend of a slow increase in the future LAI. The rise in emissions has a stabilizing effect on the change in the LAI in the different scenarios, with the greater the temperature rise, the more pronounced the increase in the LAI.

4. Discussion

The results indicate a notable increase in vegetation cover in the Yarlung Tsangpo River basin over the past 37 years. This trend aligns with the global greening phenomenon, suggesting that global warming is impacting vegetation growth not only at lower altitudes but also in alpine areas. Simultaneously, changes in the vegetation cover exhibit clear regional patterns, with a substantial increase in meadows in the upper and middle reaches of the basin and a decrease in woodland cover in the lower reaches. This trend is likely attributed to the concentration of significant temperature and precipitation changes in the upper and middle reaches of the basin. The melting of snow and glaciers at higher altitudes is likely enhancing the growing conditions for meadows, resulting in an increase in the LAI in the middle reaches of the basin. Compared with other studies mentioned in Section 1, this research places a greater emphasis on changes in the elevation zones and analyzes the distinctions in climate impacts on vegetation changes between low- and medium-altitude regions, as well as medium- and high-altitude regions.
Conversely, the reduction in the LAI in certain areas of the lower reaches may be linked to topographical factors [65,66]. A comparison of the areas experiencing changes in the LAI reveals a decrease in the LAI in the bare rock areas of the lower reaches, while the LAI around the river valleys is increasing. This may be due to the increase in precipitation in the lower part of the basin, combined with the large elevation differences that exist downstream, causing the vegetation to gradually move toward the valley areas and, thus, varying spatially. It is noteworthy that despite a substantial increase in China’s population over the past 40 years, the land cover of the region has not been significantly impacted by the implementation of ecological conservation policies. This characteristic makes the region an ideal study area for investigating the impact of climate change on vegetation. However, for a detailed study of the vegetation zone in the plateau, accurate subsurface data are still essential.
The difference in elevation is also the main reason for the difference in the LAI. From the results, the correlation and contribution of climate factors in different elevation zones show different characteristics, with the contribution of precipitation and radiation decreasing and the contribution of temperature increasing. From the conclusions of other researchers, because of the change in the elevation, the vegetation type of the watershed will change to some extent, gradually transitioning from woodland to high-density grassland and then to low-density grassland [67,68], which causes the water demand of regional vegetation to gradually decrease, while the increase in temperature makes the overall environment more suitable for the survival of living organisms [69], which is coupled with the increased snowmelt due to the increase in temperature, leading to further increases in the temperature’s contribution. From the results of the MK z-value test, with the increase in the altitude, all z-values, except summer, had a rising trend, which may also be triggered by the environmental changes brought by climate change. It is worth noting that, although the z-value results showed a significant increase, the overall increase was very limited. This may be suitable for growth if the land is limited and the meadows have a single vegetation type that is less able to resist the impacts brought by the seasonal change and that has a certain relationship with those meadows. This may be related to the restriction of suitable land for growing and the weak resistance of meadows to seasonal changes due to the single vegetation type [70].
The study reveals that the LAI’s changes exhibited a certain time lag effect on climate [71,72], and regional characteristics and vegetation types influenced the response of vegetation to climate factors. In low-elevation areas, the response of vegetation to precipitation was slower than that to air temperature. However, with the gradual increase in elevation, the response of vegetation to climatic factors changed gradually. The lag effect on the response to precipitation weakened, while the lag effect on the response to air temperature increased. This phenomenon may be linked to the alteration of vegetation types in the subsurface [73]. Vegetation at higher elevations has a greater proportion of low-cover grassland, which reduces the requirement for water recharge from precipitation, and because of its rapid growth cycle, the time lag effect of precipitation is more pronounced than that of forested land. The time lag of temperature may be due to the fact that the grassland at high altitude is covered by snow in the winter, which needs some time to dissolve, and it cannot respond to temperature changes as quickly as the grassland at middle and low altitudes, so the time lag of the LAI for temperature gradually increases with the increase in altitude. The time lag for radiation is concentrated in the altitude range of 2000–4000 m, which may be related to the fact that the vegetation in this area is in the transition zone between forest and grassland [74], but more information is needed to support this part of the study. In subsequent research, carbon cycle indicators can be combined to study the process of the water–carbon cycle in the watershed and the role of vegetation in this process, and, according to the research results obtained so far, to analyze the time lag effect of different climatic elements in different elevation zones on the process of the water–carbon cycle and the influence of the differences.

5. Conclusions

This study provides valuable insight into the dynamics of the LAI and its relationship with key climate drivers across different elevation zones in the highland mountainous region of the Yarlung Tsangpo River basin from 1981 to 2017. The main conclusions drawn from this research are as follows:
(1) Vegetation in the Yarlung Tsangpo River basin showed a significant and sustained increase over the past 37 years, and it was more pronounced in the middle and lower meadow areas. However, the downstream area showed a certain decline in the LAI due to the influence of the vegetation type and other factors. From the pattern of change, the improvement in the vegetation in the high-altitude area was more significant.
(2) Temperature was the most influential climatic factor, with an average contribution of approximately 70%. The correlation between the temperature and LAI was higher in the autumn, the correlation of precipitation was stronger in the central part of the basin, and the high correlation of radiation was in the downstream region, with clear regional and seasonal differences among the three factors.
(3) At lower elevations, vegetation responded to precipitation with a 2–3 month lag relative to the air temperature. At higher elevations, there was a 1–3 month lag in the vegetation’s response to air temperature relative to precipitation. In the intermediate transition zone, the LAI’s response to radiation had a lag effect of approximately 3 months compared to the other two climate elements.
(4) In the future, the Leaf Area Index in the Yarlung Zangbo River basin will continue to increase, and this trend will intensify as emissions rise, and autumn and winter will be the main seasons that trigger changes in the Leaf Area Index, with an overall increase of around 20%–40%.
This study’s analysis of the LAI’s dynamics and its relationship with climate drivers across elevation zones in the highland mountainous region is of great significance for understanding ecological changes in the Third Pole region. Additionally, the research delved into the contributions of major meteorological factors and the impact of altitude differences. Lastly, the study provided predictions for interannual and intra-annual changes in the LAI in the future. These findings establish the fundamental groundwork for a comprehensive exploration of the impacts of environmental dynamics and vegetation changes on water and carbon cycle processes within the basin.

Author Contributions

Conceptualization, X.C. and T.G.; Data curation, X.C. and T.G.; Formal analysis, Y.L.; Funding acquisition, Y.L.; Investigation, J.J.; Methodology, X.C.; Project administration, Y.L.; Resources, T.G.; Software, X.C.; Supervision, J.Z., C.L., G.W. and Z.B.; Validation, T.G. and Y.L.; Writing—original draft, X.C.; Writing—review and editing, T.G. All authors have read and agreed to the published version of the manuscript.

Funding

This research was supported by the National Key Research and Development Program of China (grant number: 2022YFC3201701); the National Natural Science Foundation of China (grant numbers: 52079079, U2240203, 92047301, and 92047203); and the Special Project for the Second Tibetan Plateau Scientific Expedition and Research (grant number: SQ2019QZKK0203-02).

Data Availability Statement

The data will be made available by the authors on request.

Acknowledgments

We are grateful to GLASS for providing the LAI data. We sincerely appreciate the National Tibetan Plateau Data Center for supplying the climate data.

Conflicts of Interest

The authors declare no conflicts of interest.

References

  1. Fan, Y.; Cheng, G.; Dang, C.; Shao, Z.; Ding, Q.; Huang, X.; Qian, J. Assessment of the importance of increasing temperature and decreasing soil moisture on global ecosystem productivity using solar-induced chlorophyll fluorescence. Glob. Chang. Biol. 2022, 28, 2066–2080. [Google Scholar] [CrossRef]
  2. Chen, X.; Lin, C.; Hou, X.; Wu, Z.; Yan, G.; Zhu, C. The impact of land consolidation on arable land productivity: A differentiated view of soil and vegetation productivity. Agric. Ecosyst. Environ. 2022, 326, 107781. [Google Scholar] [CrossRef]
  3. Cao, D.; Zhang, J.; Xun, L.; Yang, S.; Yao, F. Spatiotemporal variations of global terrestrial vegetation climate potential productivity under climate change. Sci. Total Environ. 2021, 770, 145320. [Google Scholar] [CrossRef] [PubMed]
  4. Forkel, M.; Carvalhais, N.; Roedenbeck, C.; Keeling, R.; Heimann, M.; Thonicke, K.; Zaehle, S.; Reichstein, M. Enhanced seasonal CO2 exchange caused by amplified plant productivity in northern ecosystems. Science 2016, 351, 696–699. [Google Scholar] [CrossRef] [PubMed]
  5. Konings, A.G.; Williams, A.P.; Gentine, P. Sensitivity of grassland productivity to aridity controlled by stomatal and xylem regulation. Nat. Geosci. 2017, 10, 284–288. [Google Scholar] [CrossRef]
  6. Martel, J.L.; Chen, J.; Li, X.; Brissette, F.P.; Frei, A. Relative Importance of Internal Climate Variability versus Anthropogenic Climate Change in Global Climate Change. J. Clim. 2020, 34, 465–478. [Google Scholar] [CrossRef]
  7. Braun, J.V.; Wheeler, T. Climate Change Impacts on Global Food Security. Science 2013, 341, 508–513. [Google Scholar] [CrossRef]
  8. Brooks, R.T. Potential impacts of global climate change on the hydrology and ecology of ephemeral freshwater systems of the forests of the northeastern United States. Clim. Chang. 2009, 95, 469–483. [Google Scholar] [CrossRef]
  9. Duveiller, G.; Hooker, J.; Cescatti, A. The mark of vegetation change on Earth’s surface energy balance. Nat. Commun. 2018, 9, 679. [Google Scholar] [CrossRef]
  10. Shi, S.; Yu, J.; Wang, F.; Wang, P.; Jin, K. Quantitative contributions of climate change and human activities to vegetation changes over multiple time scales on the Loess Plateau. Sci. Total Environ. 2020, 755, 142419. [Google Scholar] [CrossRef]
  11. Li, J.; Peng, S.; Li, Z. Detecting and attributing vegetation changes on China’s Loess Plateau. Agric. For. Meteorol. 2017, 247, 260–270. [Google Scholar] [CrossRef]
  12. Qiu, B.; Ye, Z.; Chen, C.; Tang, Z.; Chen, Z.; Huang, H.; Zhao, Z.; Xu, W.; Joe, B. Dense canopies browning overshadowed by global greening dominant in sparse canopies. Sci. Total Environ. 2022, 826, 154222. [Google Scholar] [CrossRef]
  13. Piao, S.; Wang, X.; Park, T.; Chen, C.; Lian, X.; He, Y.; Jarle, W.B.; Chen, A.; Philippe, C.; Hans, T.; et al. Characteristics, drivers and feedbacks of global greening. Nat. Rev. Earth Environ. 2020, 1, 14–27. [Google Scholar] [CrossRef]
  14. Pan, N.; Feng, X.; Fu, B.; Wang, S.; Ji, F.; Pan, S. Increasing global vegetation browning hidden in overall vegetation greening: Insights from time-varying trends. Remote Sens. Environ. 2018, 214, 59–72. [Google Scholar] [CrossRef]
  15. Chu, H.; Sergey, V.; Wu, C.; Wang, M. NDVI-based vegetation dynamics and its response to climate changes at Amur-Heilongjiang River Basin from 1982 to 2015. Sci. Total Environ. 2019, 650, 2051–2062. [Google Scholar] [CrossRef] [PubMed]
  16. Svenning, J.C.; Sandel, B. Disequilibrium vegetation dynamics under future climate change. Am. J. Bot. 2013, 100, 1266–1286. [Google Scholar] [CrossRef]
  17. Jiao, W.; Wang, L.; Smith, W.K.; Chang, Q.; Wang, H.; Paolo, D. Observed increasing water constraint on vegetation growth over the last three decades. Nat. Commun. 2021, 12, 3777. [Google Scholar] [CrossRef]
  18. Pearson, R.G.; Phillips, S.J.; Loranty, M.M.; Beck, P.S.A.; Damoulas, T.; Knight, S.J.; Goetz, S.J. Shifts in Arctic vegetation and associated feedbacks under climate change. Nat. Clim. Chang. 2013, 3, 673–677. [Google Scholar] [CrossRef]
  19. Gan, G.; Liu, Y.; Sun, G. Understanding interactions among climate, water, and vegetation with the Budyko framework. Earth-Sci. Rev. 2021, 212, 103451. [Google Scholar] [CrossRef]
  20. Zhai, R.; Tao, F. Contributions of climate change and human activities to runoff change in seven typical catchments across China. Sci. Total Environ. 2017, 605–606, 219–229. [Google Scholar] [CrossRef]
  21. Yang, P.; Zhang, S.; Xia, J.; Chen, Y.; Zhang, Y.; Cai, W.; Wang, W.; Wang, H.; Luo, X.; Chen, X. Risk assessment of water resource shortages in the Aksu River basin of northwest China under climate change. J. Environ. Manag. 2022, 305, 114394. [Google Scholar] [CrossRef]
  22. Xie, D.; Du, H.; Xu, W.H.; Ran, J.H.; Wang, X.Q. Effects of climate change on richness distribution patterns of threatened conifers endemic to China. Ecol. Indic. 2022, 136, 108594. [Google Scholar] [CrossRef]
  23. Harris, R.B. Rangeland degradation on the Qinghai-Tibetan plateau: A review of the evidence of its magnitude and causes. J. Arid. Environ. 2010, 17, 1–12. [Google Scholar] [CrossRef]
  24. Wang, G.; Wang, Y.; Li, Y.; Cheng, H. Influences of alpine ecosystem responses to climatic change on soil properties on the Qinghai–Tibet Plateau, China. Catena 2007, 70, 506–514. [Google Scholar] [CrossRef]
  25. Hu, X.; Li, Z.C.; Li, X.Y.; Liu, L. Quantification of soil macropores under alpine vegetation using computed tomography in the Qinghai Lake Watershed, NE Qinghai–Tibet Plateau. Geoderma 2016, 206, 244–251. [Google Scholar] [CrossRef]
  26. Fan, Z.; Bai, X. Scenarios of potential vegetation distribution in the different gradient zones of Qinghai-Tibet Plateau under future climate change. Sci. Total Environ. 2021, 796, 148918. [Google Scholar] [CrossRef]
  27. Huang, K.; Dai, J.; Wang, G.; Chang, J.; Lu, Y.; Song, C.; Hu, Z.; Ahmed, N.; Ye, R. The impact of land surface temperatures on suprapermafrost groundwater on the central Qinghai-Tibet Plateau. Hydrol. Process. 2020, 34, 13667. [Google Scholar] [CrossRef]
  28. Bosch, A.; Schmidt, K.; He, J.S.; Doerfer, C.; Scholten, T. Potential CO2 emissions from defrosting permafrost soils of the Qinghai-Tibet Plateau under different scenarios of climate change in 2050 and 2070. Catena 2017, 149, 221–231. [Google Scholar] [CrossRef]
  29. Chen, W.; Zhou, H.; Wu, Y.; Li, Y.; Xue, S. Plant-mediated effects of long-term warming on soil microorganisms on the Qinghai-Tibet Plateau. Catena 2021, 204, 105391. [Google Scholar] [CrossRef]
  30. Gao, Q.; Guo, Y.; Xu, H.; Ganjurjav, H.; Li, Y.; Wan, Y.; Qin, X.; Ma, X.; Liu, S. Climate change and its impacts on vegetation distribution and net primary productivity of the alpine ecosystem in the Qinghai-Tibetan Plateau. Sci. Total Environ. 2016, 554–555, 34–41. [Google Scholar] [CrossRef] [PubMed]
  31. Deng, H.; Chen, Y.; Chen, X.; Li, Y.; Ren, Z.; Zhang, Z.; Zheng, Z.; Hong, S. The interactive feedback mechanisms between terrestrial water storage and vegetation in the Tibetan Plateau. Front. Earth Sci. 2022, 10, 1004846. [Google Scholar] [CrossRef]
  32. Jiao, K.; Gao, J.; Liu, Z. Precipitation Drives the NDVI Distribution on the Tibetan Plateau While High Warming Rates May Intensify Its Ecological Droughts. Remote Sens. 2021, 13, 1305. [Google Scholar] [CrossRef]
  33. Dong, C.; Wang, X.; Ran, Y.; Nawaz, Z. Heatwaves Significantly Slow the Vegetation Growth Rate on the Tibetan Plateau. Remote Sens. 2022, 14, 2402. [Google Scholar] [CrossRef]
  34. Chen, J.M.; Black, T.A. Defining Leaf Area Index for Non-flat Leaves. Plant Cell Environ. 1992, 15, 421–429. [Google Scholar] [CrossRef]
  35. Field, C.B.; Randerson, J.T.; Malmstroem, C.M. Global Net Primary Production: Combining Ecology and Remote Sensing. Remote Sens. Environ. 1995, 51, 77–88. [Google Scholar] [CrossRef]
  36. Liu, Y.; Liu, R.; Chen, J.M. Retrospective Retrieval of Longterm Consistent Global Leaf Area Index (1981–2011) from Combined AVHRR and MODIS Data. J. Geophys. Res. 2012, 117, G04003. [Google Scholar] [CrossRef]
  37. Zhu, Z.; Bi, J.; Pan, Y.; Ganguly, S.; Anav, A.; Xu, L.; Samanta, A.; Piao, S.; Nemani, R.R.; Myneni, R.B. Global Data Sets of Vegetation Leaf Area Index (LAI)3g and Fraction of Photosynthetically Active Radiation (FPAR)3g Derived from Global Inventory Modeling and Mapping Studies (GIMMS) Normalized Difference Vegetation Index (NDVI3g) for the Period 1981 to 2011. Remote Sens. 2013, 5, 927–948. [Google Scholar] [CrossRef]
  38. Hu, S.; Mo, X. Attribution of Long-Term Evapotranspiration Trends in the Mekong River Basin with a Remote Sensing-Based Process Model. Remote Sens. 2021, 13, 303. [Google Scholar] [CrossRef]
  39. Xiao, Z.; Liang, S.; Sun, R.; Wang, J.; Jiang, B. Estimating the fraction of absorbed photosynthetically active radiation from the MODIS data based GLASS leaf area index product. Remote Sens. Environ. 2015, 171, 105–117. [Google Scholar] [CrossRef]
  40. Chávez, R.O.; Clevers, J.G.P.W.; Herold, M.; Acevedo, E.; Ortiz, M. Assessing Water Stress of Desert Tamarugo Trees Using in situ Data and Very High Spatial Resolution Remote Sensing. Remote Sens. 2013, 5, 5064–5088. [Google Scholar] [CrossRef]
  41. Reygadas, Y.; Jensen, J.L.R.; Moisen, G.G.; Currit, N.; Chow, E.T. Assessing the Relationship between Vegetation Greenness and Surface Temperature Through Granger Causality and Impulse-Response Coefficients: A Case Study in Mexico. Int. J. Remote Sens. 2020, 41, 3761–3783. [Google Scholar] [CrossRef]
  42. Yang, K.; He, J. China Meteorological Forcing Dataset (1979–2018); A Big Earth Data Platform for Three Poles; National Tibetan Plateau Data Center: Boston, MA, USA, 2019. [Google Scholar] [CrossRef]
  43. He, J.; Yang, K.; Tang, W.; Lu, H.; Qin, J.; Chen, Y.; Li, X. The first high-resolution meteorological forcing dataset for land process studies over China. Sci. Data 2020, 7, 25. [Google Scholar] [CrossRef]
  44. Yan, G.; Hu, R.; Luo, J.; Marie, W.; Jiang, H.; Mu, X.; Xie, D.; Zhang, W. Review of indirect optical measurements of leaf area index: Recent advances, challenges, and perspectives. Agric. For. Meteorol. 2019, 265, 390–411. [Google Scholar] [CrossRef]
  45. Fang, H.; Baret, F.; Stephen, P.; Gabriela, S.S. An overview of global leaf area index (LAI): Methods, products, validation, and applications. Rev. Geophys. 2019, 57, 739–799. [Google Scholar] [CrossRef]
  46. Ma, H.; Liang, S. Development of the GLASS 250-m leaf area index product (version 6) from MODIS data using the bidirectional LSTM deep learning model. Remote Sens. Environ. 2022, 273, 112985. [Google Scholar] [CrossRef]
  47. Xiao, Z.; Liang, S.; Wang, J.; Chen, P.; Yin, X.; Zhang, L.; Song, J. Use of General Regression Neural Networks for Generating the GLASS Leaf Area Index Product from Time Series MODIS Surface Reflectance. IEEE Trans. Geosci. Remote Sens. 2014, 52, 209–223. [Google Scholar] [CrossRef]
  48. Xiao, Z.; Liang, S.; Wang, J.; Xiang, Y.; Song, J. Long-Time-Series Global Land Surface Satellite Leaf Area Index Product Derived from MODIS and AVHRR Surface Reflectance. IEEE Trans. Geosci. Remote Sens. 2016, 54, 1–18. [Google Scholar] [CrossRef]
  49. Yang, Y.; Li, A.; An, J.H.; Yin, G.; Wei, Z.; Bian, J. Intercomparison Among GEOV1, GLASS and MODIS LAI Products over Mountainous Area in Southwestern China. Remote Sens. Technol. Appl. 2016, 31, 438–450. [Google Scholar] [CrossRef]
  50. Wu, J.H.; Zhang, L.L.; Zhao, B.K.; Yang, N.; Gao, P.C. Remote sensing assessing of vegetation and its resilience based on critical slowing down model and GLASS LAI: A case study in the Three Gorges Reservoir Area. Acta Ecol. Sin. 2023, 43, 1–12. [Google Scholar] [CrossRef]
  51. Yang, F.; Li, Z.; Bao, Y.; Li, X.; Zhang, B.; Xin, X. Comparation of different LAI products in hulunber meadow steppe. Trans. Chin. Soc. Agric. Eng. 2016, 32, 153–160. [Google Scholar] [CrossRef]
  52. Meng, Q.; Liu, Y.; Ju, Q.; Liu, J.; Wang, G.; Jin, J.; Guan, T.; Liu, C.; Bao, Z. Vegetation Change and its response to climate change in the Yarlung Zangbo River basin in the past 18 years. South-North Water Transf. Water Sci. Technol. 2021, 19, 539–550. [Google Scholar] [CrossRef]
  53. Liu, Y.; Zhou, M. Comparison of MODIS, CYCLOPES and GLASS LAI over Hanjiang river basin. Remote Sens. Nat. Resour. 2018, 30, 14–21. [Google Scholar] [CrossRef]
  54. Yang, J.; Huang, X. The 30 m annual land cover dataset and its dynamics in China from 1990 to 2019. Earth Syst. Sci. Data 2021, 13, 3907–3925. [Google Scholar] [CrossRef]
  55. Pranabkumar, S. Estimates of the Regression Coefficient Based on Kendall’s Tau. J. Am. Stat. Assoc. 1968, 63, 1379–1389. [Google Scholar] [CrossRef]
  56. Mann, H.B. Non-parametric Test Against Trend. Econometrica 1945, 13, 245–259. [Google Scholar] [CrossRef]
  57. Zhang, S.; Ye, L.; Huang, C.; Wang, M.; Yang, Y.; Wang, T.; Tan, W. Evolution of vegetation dynamics and its response to climate in ecologically fragile regions from 1982 to 2020: A case study of the Three Gorges Reservoir area. Catena 2022, 219, 106601. [Google Scholar] [CrossRef]
  58. Jia, Q.; Wang, Y.-P. Relationships between Leaf Area Index and Evapotranspiration and Crop Coefficient of Hilly Apple Orchard in the Loess Plateau. Water 2021, 13, 1957. [Google Scholar] [CrossRef]
  59. Wang, X.; Liu, J.; Cheng, X. Relationships between leaf area index and cli-matic factors in the Tibetan Plateau. Int. J. Climatol. 2019, 39, 219–230. [Google Scholar] [CrossRef]
  60. Liu, J.; Li, X.; Wang, Y.; Li, Y. Relationships between leaf area index and climatic factors in the Inner Mongolia Plateau of China. Environ. Earth Sci. 2017, 6, 301. [Google Scholar] [CrossRef]
  61. Shen, C.; Wang, Y.; Wei, Y.; Yu, L. A lag analysis of R&D investment driving economic growth using grey relational model. In Proceedings of the IEEE International Conference on Environmental Science and Information Application Technology, Wuhan, China, 17–18 July 2010; pp. 61–64. [Google Scholar] [CrossRef]
  62. Yao, Z.; Wei, Z. Correlation analysis between vegetation fraction and vegetation indices in reclaimed forest: A case study in Pingshuo mining area. In Proceedings of the IEEE International Workshop on Earth Observation and Remote Sensing Applications, Guangzhou, China, 4–6 July 2016; pp. 122–126. [Google Scholar] [CrossRef]
  63. Nezlin, N.P.; Kostianoy, A.G.; LI, B.L. Inter-annual variability and interaction of remote-sensed vegetation index and atmospheric precipitation in the Aral Sea region. J. Arid Environ. 2005, 62, 677–700. [Google Scholar] [CrossRef]
  64. Goward, S.N.; Prince, S.D. Transient effects of climate on vegetation dynamics: Satellite observations. J. Biogeogr. 1995, 22, 549–564. [Google Scholar] [CrossRef]
  65. Wang, T.; Wu, T.; Wang, P.; Li, R.; Xie, C.; Zou, D. Spatial distribution and changes of permafrost on the Qinghai-Tibet Plateau revealed by statistical models during the period of 1980 to 2010. Sci. Total Environ. 2019, 650 Pt. 1, 661–670. [Google Scholar] [CrossRef]
  66. Ferrari, F.R.; Schaefer, C.E.G.R.; Pereira, A.B.; Tomazini, A.; Schmitz, D.; Francelino, M.R. Coupled soil-vegetation changes along a topographic gradient on King George Island, maritime Antarctica. Catena 2020, 198, 105038. [Google Scholar] [CrossRef]
  67. Wang, C.; Huang, M.; Zhai, P. Change in drought conditions and its impacts on vegetation growth over the Tibetan Plateau. Adv. Clim. Chang. Res. 2021, 3, 333–341. [Google Scholar] [CrossRef]
  68. Fassnacht, F.E.; Schiller, C.; Kattenborn, T.; Zhao, X.; Qu, J. A Landsat-based vegetation trend product of the Tibetan Plateau for the time-period 1990–2018. Sci. Data 2019, 6, 78. [Google Scholar] [CrossRef] [PubMed]
  69. Pinsky, M.L.; Selden, R.L.; Kitchel, Z.J. Climate-Driven Shifts in Marine Species Ranges: Scaling from Organisms to Communities. Annu. Rev. Mar. Sci. 2020, 12, 153–179. [Google Scholar] [CrossRef] [PubMed]
  70. Bond, S.; Kirkby, M.J.; Johnston, J.; Crowle, A.; Holden, J. Seasonal vegetation and management influence overland flow velocity and roughness in upland grasslands. Hydrol. Process. 2020, 34, 3777–3791. [Google Scholar] [CrossRef]
  71. Liang, B.; Liu, H.; Chen, X.; Zhu, X.; Cressey, E.L.; Quine, T.A. Periodic Relations between Terrestrial Vegetation and Climate Factors across the Globe. Remote Sens. 2020, 12, 1805. [Google Scholar] [CrossRef]
  72. Wu, D.H.; Zhao, X.; Liang, S.L.; Zhou, T.; Huang, K.C.; Tang, B.J.; Zhao, W.Q. Time-lag effects of global vegetation responses to climate change. Glob. Chang. Biol. 2015, 21, 3520–3531. [Google Scholar] [CrossRef] [PubMed]
  73. Gao, W.; Zheng, C.; Liu, X.; Lu, Y.; Chen, Y.; Wei, Y.; Ma, Y. NDVI-based vegetation dynamics and their responses to climate change and human activities from 1982 to 2020: A case study in the Mu Us Sandy Land, China. Ecol. Indic. 2022, 137, 108745. [Google Scholar] [CrossRef]
  74. Stocker, B.D.; Zscheischler, J.; Keenan, T.F.; Prentice, I.C.; Seneviratne, S.I.; Peñuelas, J. Drought impacts on terrestrial primary production underestimated by satellite monitoring. Nat. Geosci. 2019, 12, 264–270. [Google Scholar] [CrossRef]
Figure 1. The geographical location of the study area.
Forests 15 00308 g001
Figure 2. The conceptual framework of this research.
Forests 15 00308 g002
Figure 3. Inter- and intra-annual variation in the LAI: (a) annual variation in the LAI and meteorological factors; (b) annual distribution of the LAI (blue arrows represent a decrease, and red arrows represent an increase).
Forests 15 00308 g003
Figure 4. Spatial variation in the LAI and subsurface elements in the Yarlung Tsangpo River basin: (a) spatial variation in LAI; (b) Hurst exponent of monthly LAI; (c) land use in the study area; (d) slope of the study area.
Forests 15 00308 g004
Figure 5. Seasonal variation in the LAI: (a) interannual variation in seasonal LAI; (b) elevation differences in the amount of seasonal variation; (c) spatial variation in seasonal changes.
Forests 15 00308 g005
Figure 6. Interannual and seasonal correlations of three climatic elements with LAI.
Forests 15 00308 g006
Figure 7. Contribution of three climatic elements to the variation in LAI.
Forests 15 00308 g007
Figure 8. De-seasonal correlation analysis of LAI with climatic factors (numbers represent the month excluded).
Forests 15 00308 g008
Figure 9. Results of time lag test between LAI and climate factors. (a) Precipitation; (b) Temperature; (c) Radiation.
Forests 15 00308 g009
Figure 10. Simulation reduction results for different climate models using the random forest model: (a) scatterplot of measured and simulated results; (b) Taylor diagram for different climate models.
Forests 15 00308 g010
Figure 11. The interannual variation in the LAI in the Yarlung Tsangpo River basin from 1981 to 2100.
Forests 15 00308 g011
Figure 12. Leaf area variations at four time points for different climate models.
Forests 15 00308 g012
Figure 13. Changes in LAI at four time points in different future seasons: (a) spring; (b) summer; (c) autumn; (d) winter.
Forests 15 00308 g013
Table 1. Comparison of the elemental accuracy of the three meteorological products with measured meteorological stations (p < 0.05).
PrecipitationTemperature
CRUCN05.1CMFDCRUCN05.1CMFD
Average0.760.110.860.760.110.86
Bomi0.420.320.680.910.920.94
Dangxiong0.730.790.830.920.910.94
Jiali0.760.710.850.900.930.93
Jiangzi0.660.780.790.920.900.94
Lasa0.730.770.840.930.880.95
Lazi0.630.70.760.920.890.94
Linzhi0.690.710.810.900.930.94
Nimu0.710.780.820.930.880.95
Rikaze0.680.790.820.930.860.95
Table 2. The Z results of the MK trend test for different elevation bands.
Average0–2000 m2000–3000 m3000–4000 m4000–5000 m>5000 m
Annual average4.17−1.35−0.790.564.415.14
Spring3.07−1.29−1.160.793.885.08
Summer4.611.11−0.410.854.404.64
Autumn3.75−0.980.061.214.175.29
Winter−0.14−2.47−1.89−1.372.994.64
The elements with significant changes are shown in bold.
Table 3. Correlations and contributions of climate elements at different elevations.
CorrelationContribution
PrecipitationTemperatureRadiationPrecipitationTemperatureRadiation
0–2000 m−0.0710.004−0.1050.5050.1680.327
2000–3000 m−0.045−0.12−0.0830.3860.2850.329
3000–4000 m0.1870.209−0.080.2790.5080.213
4000–5000 m0.1140.353−0.1220.2650.5480.188
>5000 m0.0810.286−0.1030.2610.5450.194
Disclaimer/Publisher’s Note: The statements, opinions and data contained in all publications are solely those of the individual author(s) and contributor(s) and not of MDPI and/or the editor(s). MDPI and/or the editor(s) disclaim responsibility for any injury to people or property resulting from any ideas, methods, instructions or products referred to in the content.

