Abstract
It is necessary to understand the radial growth responses of trees in the Greater Khingan Range to climatic factors to predict changes in forest ecosystems under climate change scenarios. We sampled Mongolian pine (Pinus sylvestris var. mongolica) and Dahurian larch (Larix gmelinii (Rupr.) Kuzen) at four locations at elevations of 900–1100 m in the Greater Khingan Range to establish a tree-ring chronology. The Vaganov–Shashkin (VS) model was used to describe the relationship between tree radial growth and the dominant limiting climatic factors with a focus on physiological processes. The results showed that the VS model accurately reflected the effects of various climatic factors on the growth of Mongolian pine and Dahurian larch. The simulated and measured tree-ring widths index (RWI, the same as below) were consistent. The physiological parameters affecting tree growth differed for the two tree species in the study area. Mongolian pine required higher temperatures and less soil moisture for growth than Dahurian larch. The growth rings of the two tree species are more consistent across the elevation gradient. Higher-elevation trees had an “intensive strategy” with shorter growing periods and high growth rates, whereas low-elevation tree species had a “broad strategy” with lower maximum growth rates for longer periods. The start and cessation date of tree growth strongly affected the RWI of Mongolian pine and high-elevation Dahurian larch, but no significant effect on the RWI of low-elevation Dahurian larch. Differences in the limiting climatic factors were observed between Mongolian pine and Dahurian larch. Mongolian pine shows some similarity between high and low elevations, subject to the common limitations of temperature and soil moisture during the growing season for both, with a greater proportion of the lower elevations being limited by soil moisture. Dahurian larch was influenced by the growing season temperatures and May–August soil moisture at higher elevations and by the growing season soil moisture at lower elevations. This study provides a scientific basis for the management and conservation of forest ecosystems in the Greater Khingan Range.
1. Introduction
Climate change and its impact on the ecological environment is a central issue of widespread global concern and importance. Global warming has become an indisputable fact over the past century [1]. Forest ecosystems, as globally important ecosystems, are critical for maintaining the global carbon and oxygen balance, mitigating climate change, and conserving soil and water [2,3]. Numerous studies have shown that global warming has already had a significant impact on forest ecosystem composition and stability [4], and has led to a series of ecological problems [5]. Trees are both the material basis for the composition of forest ecosystems and the vehicle for their management. Climate change has resulted in changes in tree growth trends, response stability, phenological changes, and tree basal area growth [6,7,8]. In addition, the sensitivity of trees to climatic elements can be altered [9]. Different tree species will respond differently to climate change due to differences in habits, growth strategies, physiology, and ecology [10,11]. Therefore, it is necessary to investigate differences in the responses of different tree species to climate change and the impact of climate change on the forest ecosystem sustainability.
Dendrochronology is the science of dating past events and reconstructing past environmental conditions using tree rings based on the physiology of trees and their own growth characteristics [12]. Tree rings are accurate indicators of tree growth, and many samples can be obtained. Thus, tree-ring chronology has been widely used by many scientists to study climate change in historical periods [13,14]. Current tree-ring climatology studies are dominated by linear models [12,15,16]. However, the relationship between tree radial growth and limiting factors (temperature, sunlight, soil moisture, etc.) is not linear [17]. For example, the radial growth of trees at high latitudes and elevations has become less sensitive to temperature changes in recent decades as the global climate has warmed [18,19,20,21]. In addition to limiting factors, such as temperature, non-climatic factors including tree size, age, and local forest dynamics, and forest management, affect tree ring growth [22]. The physiological characteristics of trees cannot be accurately determined using only a single environmental factor affecting tree growth [23]. Therefore, it is critical to analyze the effects of multiple factors on radial tree growth based on tree physiology to study the relationship between radial tree growth and climatic factors [24].
Physiological modeling uses a process-based model with mathematical expressions to reveal the response mechanisms between radial tree growth and environmental factors. Numerous studies have performed physiological modeling [25,26,27]. The Vaganov–Shashkin (VS) model is a widely used model [28,29]. Its advantage is the ability to simulate changes in the tree’s cambium layer as a function of climatic factors, such as temperature, sunlight, and soil moisture. The model can be used to determine the major factors [12] affecting the cellular growth rate. For example, a cell’s growth rate cannot exceed a specific range during a given period in a given season due to limiting factors. In addition, growth changes in the cambium layer determine the anatomical characteristics (e.g., cell diameter and cell wall thickness) of the tube cells [30]. The VS model simplifies the radial growth of trees compared to linear models. It has been widely used in China and internationally, and favorable results have been achieved in the United States [25], Western Canada [31], the Mediterranean region [7,32], Central Europe [33], and Western China [34,35].
The Greater Khingan Range has a total area of about 327,200 square kilometers, with a general northeast–southwest orientation, a total length of more than 1400 km, and a width of 200 to 400 km. As the northernmost natural forest area in China, the Greater Khingan Range is critical to maintaining the global ecosystem’s balance. The region has a unique natural environment characterized by significant warming and is highly sensitive to climate change [36,37,38]. The Greater Khingan Range is the only high-latitude perennial permafrost regions in China. Rising temperatures and thawing permafrost significantly affect the forest ecosystem in the Greater Khingan Range. Therefore, it is critical to assess the tree response to changing climate conditions in the region in the context of global warming.
Mongolian pine and Dahurian larch are the dominant species in natural coniferous forests in the Greater Khingan Range. Although several studies have investigated the response of major tree species to climatic changes in the Greater Khingan Range, they have primarily used linear models [39,40,41], with relatively few studies on tree physiological modeling [42]. No studies have been conducted on the physiological modeling of trees at the same elevation and different tree species in the western Greater Khingan Range. Therefore, this study focuses on the Mangui area of Genhe City in the western Greater Khingan Range. The VS model is used to simulate the radial growth of Mongolian pine and Dahurian larch at the same elevation to evaluate the responses of these two species to climate factors. Our objectives are to (1) assess the feasibility of using the VS model to simulate the radial growth of Mongolian pine and Dahurian larch in the study area, (2) reveal the dominant limiting factors affecting the radial growth of the two tree species, and (3) investigate the differences in the radial growth of the two tree species in response to climate change. This study hypothesis provides information on the radial growth characteristics of trees and their physiological response mechanisms under climate change scenarios in the Greater Khingan Range. The results can be used for protecting and managing the Greater Khingan Range forest ecosystems in the context of global warming.
2. Materials and Methods
2.1. Study Area and Climate
The Greater Khingan Range (50°10′~53°33′ N, 121°12′~127°00′ E) is located in the northernmost part of China, spanning the Inner Mongolia Autonomous Region and Heilongjiang Province. It is situated in the perennial permafrost zone at high latitudes in the Asian-European Plate, with an elevation of 700–1300 m above sea level. The study area is located in Mangui Town, Genhe City, west of the Greater Khingan Range (51°51′02″~52°30′52″ N, 121°05′44″~122°47′05″ E). This area has a cold-temperate continental monsoon climate, with long and cold winters, a multi-year average temperature of −5.8 °C, and an annual precipitation of 480 mm, most of which is concentrated in July and August. The study area belongs to the Greater Khingan Range forest region of Inner Mongolia, with a total forest area of 10.68 million ha. The main tree species in the study area include Dahurian larch (Larix gmelinii (Rupr.) Kuzen), Mongolian pine (Pinus sylvestris var. mongolica), white Birch (Betula platyphylla), Masson pine (Pinus pumila), black birch (Betula dahurica Pall.), poplar (Populus davidiana), Mongolian oak (Quercus mongolica Fisch. ex Ledeb), and spruce (Picea koraiensis). Among them, the Mongolian pine forest accounts for more than 1.6% of the woodland area, while Dahurian larch for more than 60% of the woodland area. The understory vegetation mainly consists of Xing’an rhododendron (Rhododendron dauricum L.) and mountain thornbush (Rosa davurica Pall.), with a wide variety of herbaceous plants.
The meteorological data included the daily average temperature and daily precipitation from 1958 to 2020 obtained from the nearest meteorological station of Genhe (50°28′12″ N, 121°31′36″ E, 710 m above sea level) (Figure 1). Multi-year averages of temperature and precipitation were calculated on a monthly basis for the meteorological stations. The results show (Figure 2) that the region is characterized by a wet-warm synoptic period and large seasonal variations in temperature and precipitation. The highest temperatures of the year occur in June–August, and 80% of the precipitation falls in May–September, of which 50% of the year’s precipitation falls in July–August. Previous studies have shown that the air temperature in the Greater Khingan Range decreases significantly with increasing altitude, with a vertical rate of decrease of (6.5 °C/km) [43]. In this study, the elevation of the Genhe meteorological station is 710 m, and the elevation of the sampling site is 900–1000 m. Considering that there is a certain difference in the elevation between the sampling site and the meteorological station, the vertical decreasing rate of the mountain temperature is utilized to interpolate the temperature data from the meteorological station to the height of the sampling site. The precipitation was the measured value at the meteorological station.
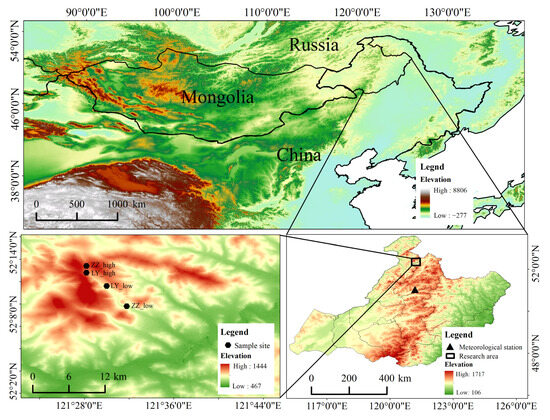
Figure 1.
Location of the study area, sampling sites, and meteorological stations. The three images differ in DEM color due to elevation.
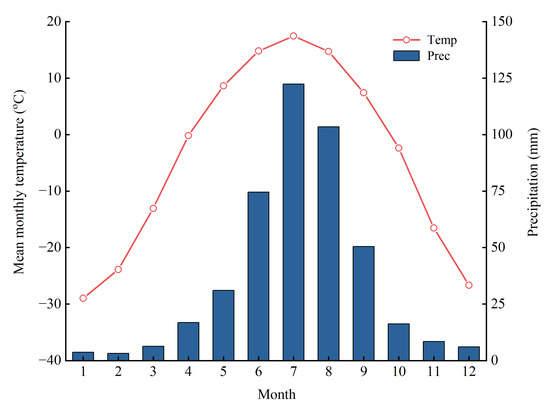
Figure 2.
Climate data from the Genhe weather station from 1958 to 2020. Note: Prec, precipitation; Temp, mean monthly temperature. The same below.
Soil data in this study area were obtained using the Harmonized World Soil Database v 1.2 (https://www.fao.org/soils-portal, accessed on 19 September 2022) published by the Food and Agriculture Organization of the United States (FAO). Soil texture is classified according to the United States Department of Agriculture (USDA), and the main soil types in this study are clay loam (CL), silty clay (SIC), and sandy clay loam (SACL).
2.2. Tree-Ring Data
We selected four sampling sites in July 2022 in Mangui Town, Genhe City, Hulunbeier Region, Greater Khingan Range area (Figure 1): high-elevation Dahurian larch (LY_high), low-elevation Dahurian larch (LY_low), high-elevation Mongolian pine (ZZ_high), and low-elevation Mongolian pine (ZZ_low). The sampling site information is listed in Table 1. We selected sites with good growth conditions and that were unaffected by fire and pests of the two tree species. The core samples were obtained at diameter at breast height (1.3 m above the ground). At least 20 trees were sampled at each location (Table 1), drilling 2–3 cores per tree from east and north or south directions. The latitude, longitude, and elevation were recorded. In the laboratory, the cores were naturally air-dried and sanded with 200, 400, and 600 grit sandpaper until the growth rings were visible. Crossdating of each sample was carried out using a Skeleton plot. The RWI was measured using a LINTAB 6 instrument with an accuracy of 0.001 mm. Crossdating quality tests were performed using COFECHA [44], and sample cores with low correlations with the main sequence were removed (LY_high, 9/60; LY_low, 0/64; ZZ_high, 4/61; ZZ_low, 4/59, the number in front of the slash represents the discarded cores, followed by the total number of cores). The tree-ring chronology was established using the ARSTAN program [45]. A negative exponential function was fitted to remove the growth trend, the subsample signal strength (SSS) was used with a threshold value of 0.85 to determine the period for which the chronology is sufficiently replicated to be deemed reliable, and a standardized tree-ring chronology (STD, Figure 3), a residual chronology (RES), and an autoregressive chronology (ARS) were obtained.

Table 1.
Site characteristics of the tree-ring chronologies.
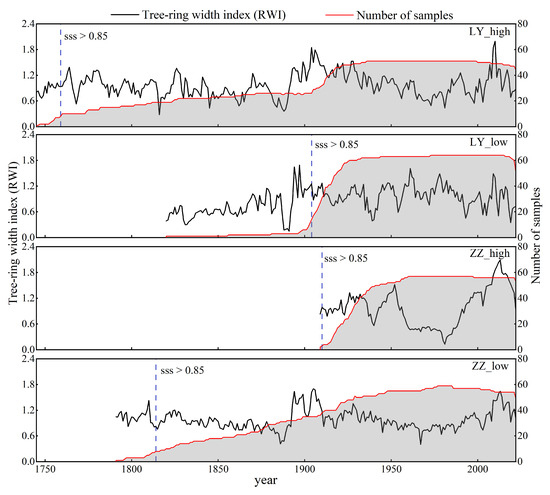
Figure 3.
The sampling sites by species, RWI chronologies (black line), and number of cores (red line and shaded below); the blue dash line shows the year in which SSS is above 0.85.
Measures such as expression population signal (EPS), mean sensitivity (MS), standard deviation (SD), the first-order auto correlation coefficient (AC1), correlation coefficient (R), and signal-to-noise ratio (SNR) are commonly used to assess chronological quality [46,47]. Among them, EPS measures the sample’s total signal strength; the higher the EPS, the better the sample’s representation. The MS represents the change in tree ring width index between consecutive years; the larger the MS, the more climate information is contained. SD reflects the inter-annual fluctuations of each chronology; the higher the SD, the more climate information is included in the tree ring sequence. AC1 shows the influence of the previous year’s climate on tree development in the current year; the larger the AC1, the more visible the influence of the previous year’s climate elements. R denotes the correlation between chronological sequences. SNR reflects the ratio of the climate signal to the noise caused by non-climatic sources, and the larger the SNR, the more climate information the chronology includes. Given that the standardized chronology (STD) for Mongolian pine (ZZ_high, ZZ_low) is higher than the residual chronology (RES) for all parameters (except MS), the standard deviation (SD), the first-order auto correlation coefficient (AC1), and the mean sensitivity (MS) (except for LY_high) of Dahurian larch (LY_high, LY_low) standard chronology (STD) are higher than the residual chronology (RES). Furthermore, in our simulations, STD performed better than RES, hence we chose STD as the study chronology (Table 2). The period in which the meteorological data overlapped with the tree-ring data was selected for the simulation year (1958–2020). We conducted Pearson correlation analyses between the simulated data and the STD at the sampling sites using SPSS software (version 22.0; SPSS Inc., Chicago, IL, USA).
Table 2.
Statistical characteristics analyses results of standardized chronologies (STD) and residual chronologies (RES) for sampling sites.
2.3. Vaganov–Shashkin Process-Based Model
The Vaganov–Shashkin (VS) model is a growth model for the tree’s formative layer that is based on the principle of simulating cell changes utilizing the primary environmental parameters influencing cell growth. The VS model consists of two main sub-modules: the first calculates the relative growth rate of the tree in an ideal state, which is influenced by the sunlight, temperature, and soil humidity, respectively, and the second sub-module simulates tree tubular structure properties using the relative growth rate to simulate the structural properties of the tree’s tubular cells.
Tree growth is affected by several environmental factors, including soil, sunlight, temperature, and precipitation. The VS model simplifies the complex growth process of trees and considers three limiting climate factors: temperature, precipitation, and sunlight. The VS model is expressed as follows:
where is the daily growth rate of the tree; , , and are the growth rates affected by the sunlight, temperature, and soil moisture, respectively [48].
The VS model characterizes the tree growth response to the three factors as follows:
- (a)
- Tree growth response to temperature. Tree growth begins when a suitable cumulative temperature (Tbeg) has been reached. Trees do not grow when the temperature is below the minimum growth temperature (Tmin1), and tree growth increases linearly with increasing temperatures when the temperature exceeds Tmin1 but is below the lower limit of the optimum growth temperature (Topt1). Maximum tree growth occurs when the temperature is between Topt1 and the upper limit of the Topt2. When the temperature exceeds Topt2 but is less than the maximum growth temperature (Tmax), the tree growth decreases linearly with an increase in temperature.
- (b)
- Tree growth response to soil moisture. The response of tree growth to soil moisture is similar to that of temperature. Four parameters are used (Wmin1, Wopt1, Wopt2, and Wmax) with a complicated calculation process. The daily change in the soil water content dW is expressed by the soil dynamic equilibrium equation:
- (c)
- Tree growth response to sunlight. The sunlight-influenced tree growth rate, (ignoring the Earth’s eccentricity as it orbits the sun and atmospheric transmittance), is expressed in terms of the latitude (φ), angle of incidence of the sun (θ), and day length (Φ) as follows:
2.4. Simulation Process and Parameter Selection
The simulations were performed using a VS-oscilloscope. The VS-oscilloscope is an interactive visualization tool for the VS model that allows users to compare observed and simulated RWI and select the ideal model parameter combination. The specific operations of this study included: (1) downloading the VS-oscilloscope software (http://vs-genn.ru/downloads/, accessed on 3 May 2023) and the initial physiological parameters that come with the software; (2) importing the initial package of parameters, daily mean temperature, daily precipitation, and the standardized chronological data from the same year as the meteorological data sequentially into the model in the software’s data window; (3) entering the latitude of the sampling point and the year of simulation termination; (4) using physiological parameters suitable for tree growth (Table 3) for simulation, and adjusting the parameter values in real time in the visualization interface of the VS-oscilloscope, the model parameter selection can be determined in two ways: with the existing measured data and with the parameters obtained from the model simulation adjustment. We used model simulations to adjust the parameters due to a lack of long-term data. We selected the initial parameter values used in previous studies [42,49,50], based on the physiological mechanism of tree growth; the model was given an initial parameter value and continuously adjusted. The fitting effects of the simulated chronological sequence and the measured chronological sequence were compared in real time, the simulation was stopped when the simulated chronological sequence and the measured chronological sequence reached a highly significant correlation (p < 0.001) and the trend and synchronization of both of them coincided most, and at this time, the debugging parameters are final (Table 3).
Table 3.
Simulated values of the parameters in the Mangui Area in the western Greater Khingan Range.
The Pearson correlation coefficient (R) (p < 0.001), synchronization coefficient (GLK), root mean square error (RMSE), and variance ratio (VR) were used to evaluate the model fitting impact. Among them, the variance ratio (VR) represents the ratio of the standard deviation of the simulated chronology to the standard deviation of the measured chronology. The VR should not exceed 1 because the VS model describes the variation in ring width due to climatic factors, and the simulated growth variance affected by climatic conditions is part of the total variance of the RWI [51].
When comparing intra-annual wide and narrow rings, we define a wide year as a simulated chronology more than the mean plus one standard deviation, and a narrow year as a simulated chronology less than the mean minus one standard deviation. Independent sample t-tests were used to compare differences in the radial growth of trees with wide and narrow growth rings. Finally, spatial correlation analyses were conducted between the measured and simulated RWI and the May precipitation, and May–September mean temperature (climate research unit time series (CRU TS) 4.03 (terrestrial) 0.5° × 0.5°) [52] at the four sampling sites.
3. Results
3.1. Process Model Results
Table 3 lists the parameter values for each sampling point simulated with the VS model. The results show that the minimum temperature for tree growth (Tmin1), the lower value of the optimal temperature range (Topt1), and the upper value of the optimal temperature range (Topt2) of Mongolian pine are generally higher than that of Dahurian larch. The lower value of the optimal soil moisture range (Wopt1) was lower in Mongolian pine than in Dahurian larch. The upper value of the optimal soil moisture range (Wopt2) was lower for high-elevation Mongolian pine than for Dahurian larch.
The correlation between the simulated and standard chronology was calculated using SPSS (Figure 4). The results showed that the correlation was significant (p < 0.001) at each sampling point. The variance ratio VR was less than 1, and both GLK and RMSE were in the reasonable range of the model. The trend of the tree-ring chronology simulated with the VS model is in good agreement with the actual growth, indicating that the model is suitable for assessing the growth of Mongolian pine and Dahurian larch.
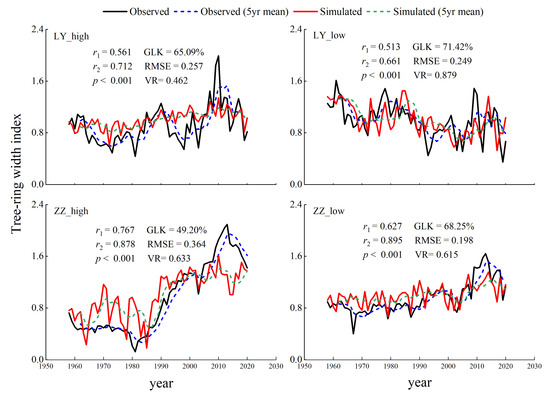
Figure 4.
Comparison of simulated and measured tree-ring chronology. r1: Correlation coefficient between simulated and measured tree-ring chronology. r2: 5-year rolling average of the correlation coefficient between simulated and measured tree-ring chronology.
3.2. Standardized Chronology and Tree Response to Climatic Factors Analysis
Since the response of tree growth to climatic factors exhibits a lag, we selected the monthly average temperature and monthly precipitation from October to September and the cumulative average temperature and precipitation from May to September as the study period. The correlation coefficients and significance levels are shown in Figure 5. LY_high showed highly significant positive correlations between the STD and monthly average temperatures in May and August and the cumulative monthly average temperatures in May–September (r = 0.429, r = 0.449, r = 0.463, p < 0.01). Significant positive correlations existed with the temperatures in October of the previous year and in June of the current year (r = 0.263, r = 0.289, p < 0.05), and a significant positive correlation was observed with precipitation in December of the previous year (r = 0.26, p < 0.05). LY_low exhibited highly significant negative correlations between the STD and monthly temperatures in February, March, and July and with cumulative monthly mean temperatures from May to September (r = −0.332, r = −0.375, r = −0.408, r = −0.352, p < 0.01). Significant negative correlations occurred with temperatures in October of the previous year and January, April, and September of the current year (r = −0.295, r = −0.309, r = −0.289, r = −0.262, p < 0.05). ZZ_high showed highly significant positive correlations between the STD and (1) monthly temperatures in October of the previous year and in January–September of the current year, (2) cumulative monthly mean temperatures from May to September (r = 0.337, r = 0.338, r = 0.411, r = 0.389, r = 0.422, r = 0.574, r = 0.446, r = 0.604, r = 0.583, r = 0.472, r = 0.401, r = 0.775, p < 0.01), and (3) precipitation in May (r = 0.25, p < 0.05) of the current year. ZZ_low showed highly significant positive correlations between the STD and (1) monthly temperatures in May, July, August, and September of the current year, (2) cumulative mean monthly temperatures from May to September (r = 0.485, r = 0.416, r = 0.481, r = 0.398, r = 0.594, p < 0.01), (3) temperatures in February, April, and June of the current year (r = 0.259, r = 0.322, r = 0.28, p < 0.05), and (4) May precipitation (r = 0.373, p < 0.05).
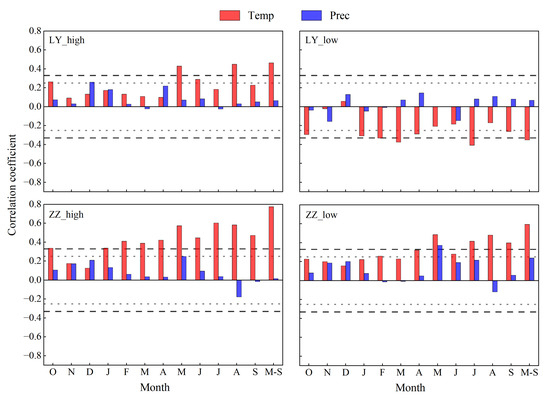
Figure 5.
Correlation coefficients between standardized tree-ring (STD) and climatic factors. The long dashed black line represents the 99% confidence level. The short gray dashed line represents the 95% confidence level. M-S denotes May through September.
3.3. Radial Growth Rate and Growth Start and Cessation Dates
The overall growth rate (Gr), soil moisture-affected growth rate (GrW), temperature-affected growth rate (GrT), and sunlight-affected growth rate (GrE) obtained from the simulation results at the four sampling sites showed that the Gr of both species was higher at higher elevations than at lower elevations. LY_high was affected by temperature and soil moisture in the middle and early part of the growing season (May–August) and primarily by temperature in the late part of the growing season. ZZ_high was affected by temperature in the early and middle (May–July) and late (September) parts of the growing season, and soil moisture is affected mainly in May–August. LY_low and ZZ_low were affected by soil moisture in the early and middle part of the growing season (May–August) and by temperature in the late part of the growing season. The Gr and the GrW were higher for LY_low than for ZZ_low (Figure 6).
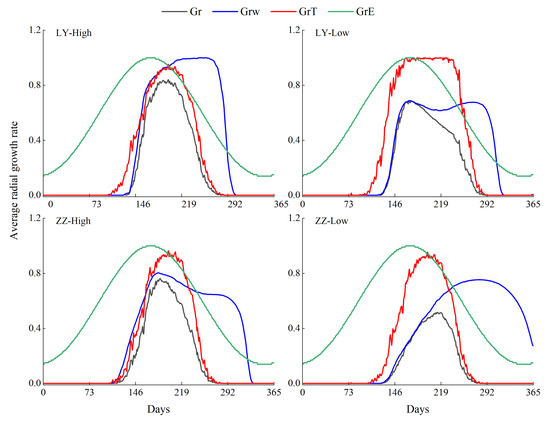
Figure 6.
Simulated multi-year daily average of the total growth rate (Gr), soil moisture-affected growth rate (GrW), temperature-affected growth rate (GrT), and sunlight-affected growth rate (GrE).
The average proportions of the total RWI in different growing season months and the relative contributions by soil moisture, temperature, and mixed (a combination of moisture and temperature) are shown in Figure 7. The results indicated rapid radial growth rates of LY_high and ZZ_high from June to August. In contrast, the radial growth rates of LY_low and ZZ_low were relatively slow, and growth occurred over a longer period from June to September, where LY_low is more pronounced than ZZ_low. The growing seasons of LY_high and ZZ_high were affected by temperature, soil moisture, and mixed (a combination of moisture and temperature). The temperatures in September had the largest influence on LY_high, and the soil moisture in May had the largest effect on ZZ_high. Soil moisture during the growing season had the largest effect on LY_low. Soil moisture in the early and middle (May–July) parts of the growing season and temperature and soil moisture in the middle part of the growing season (August) influenced the growth of ZZ_low, September was mainly controlled by temperature. The effect of soil moisture on the growth of ZZ_low was more pronounced compared to ZZ_high.
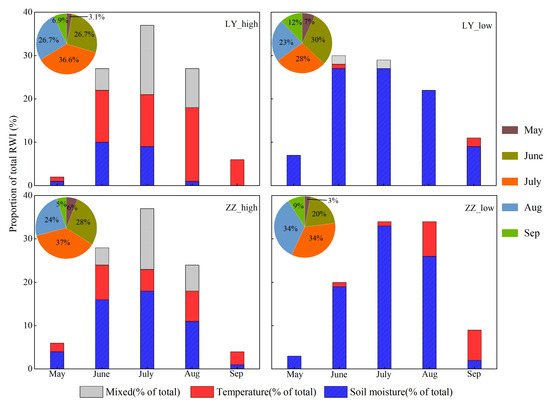
Figure 7.
The proportion of the RWI in different growing season months derived from the simulation.
A significant negative correlation (p < 0.05) was observed between the annual radial growth of LY_high, ZZ_high, and ZZ_low and the growth start season. A significant positive correlation (p < 0.05) occurred between the annual radial growth of LY_high, ZZ_high, and ZZ_low and the growth cessation season. An insignificant correlation existed between the annual radial growth of LY_low and the growth start and cessation season.
3.4. Intra-Annual Comparison of Wide and Narrow Rings
Wide and narrow growth rings were compared. The average radial growth rates of trees affected by temperature and soil moisture with wide and narrow growth rings are shown in Figure 8. Most differences in the temperature-affected radial growth occurred in the growing season (May–September). LY_high, ZZ_high, and ZZ_low exhibited more pronounced differences in temperature-affected radial growth rates than LY_low. Differences in tree growth rates due to the effect of soil moisture were observed. LY_high exhibited these differences in the middle and early parts of the growing season (May–August), ZZ_high exhibited these differences in the growing season (May–September). LY_low and ZZ_low showed differences from May to September, and the differences were more pronounced for LY_low than for ZZ_low.
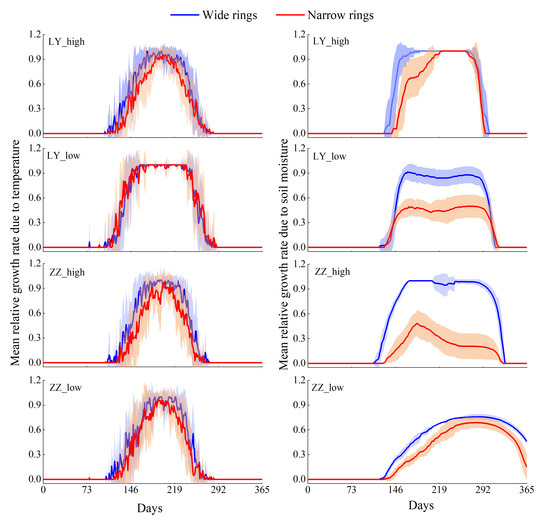
Figure 8.
Mean growth rates of trees with wide and narrow growth rings affected by temperature and soil moisture.
The results of the independent samples t-test showed that significant differences at the 99% confidence level were observed in the mean GrW between the LY_low, ZZ_high, and ZZ_low with wide and narrow growth rings during the growing season (May–September). Similarly, significant differences at the 99% confidence level occurred in the mean GrW between the LY_high with wide and narrow growth rings in the middle and early parts of the growing season (May–August). During the growing season (May–September), significant differences at the 99% confidence level were observed in the mean GrT between the LY_high and ZZ_high with wide and narrow growth rings, respectively. Significant differences at the 95% confidence level occurred in the mean GrT between the ZZ_low with wide and narrow growth rings, while LY_low was not significant (p > 0.05).
3.5. Validation of the RWI
Pearson’s correlation analysis showed a significant correlation between the RWI and the average temperature from May to September at the four sampling sites; RWI of ZZ_low also showed a significant correlation with precipitation in May. In order to explore the spatial response of RWI to climate factors at sampling sites, we performed a spatial analysis using Climate Research Unit (CRU) temperature and precipitation data. As shown in Figure 9, the spatial correlation between the measured (Figure 9a) and simulated (Figure 9b) RWI chronologies of ZZ_low and May precipitation was significant (p < 0.05). As shown in Figure 10, the spatial correlation between the measured (Figure 10a,c,e,g) and simulated (Figure 10b,d,f,h) RWI chronologies and the mean temperature from May to September for the four sampling sites was significant (p < 0.05). Significant positive correlations were observed for LY_high, ZZ_high, and ZZ_low, and significant negative correlations existed for LY_low, in agreement with the statistical results. Meanwhile, the spatial correlation between RWI and temperature was higher in high-elevation sampling sites (LY_high, ZZ_high) than low-elevation sampling sites (LY_low, ZZ_low).
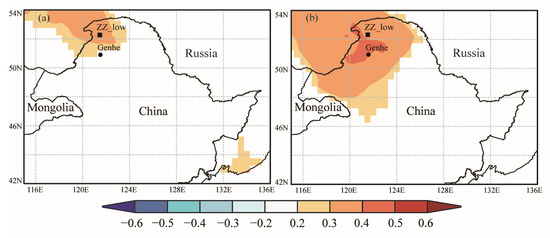
Figure 9.
Spatial correlation between measured and simulated RWI and the climate research unit (CRU) precipitation. (a) The spatial correlation between measured RWI of ZZ_low and CRU precipitation. (b) The spatial correlation between the simulated RWI of ZZ_low and CRU precipitation.
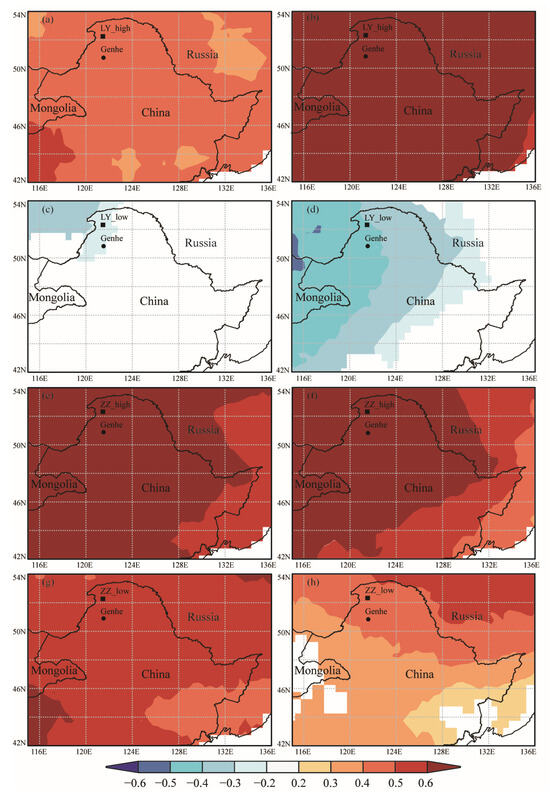
Figure 10.
Spatial correlation between measured and simulated RWI and CRU temperature. Measured chronologies are presented in the left column and simulated chronologies in the right column. (a,b) show LY_high; (c,d) show LY_low; (e,f) show ZZ_high; (g,h) show ZZ_low.
4. Discussion
4.1. Tree Physiological Parameters
Numerous scholars have used the VS model to obtain better simulation results for physiological processes in conifer species in several regions of the northern hemisphere [25,34,48,53]. A comparison of the simulated and measured values derived from the VS model for Mongolian pine and Dahurian larch showed significant correlations between the two values (Figure 3). In addition, the simulated and measured values were highly similar and significant for the tree responses to the CRU temperature and precipitation (Figure 9 and Figure 10), indicating that the model was applicable to analyzing the responses of high-latitude Mongolian pine and Dahurian larch to climatic factors.
During the simulation process, we discovered that the simulation results for LY_high, LY_low, and ZZ_low sampling points were satisfactory. ZZ_high has a decent Pearson’s correlation coefficient and variance ratio (VR), but performs poorly in terms of synchronization coefficient (GLK) and RMSE (Figure 4). The reason for this may be because ZZ_high is at a higher elevation, which is close to the upper limit of the growth of Mongolian pine, and the lower temperature and poor soil at high altitude lead to a poor environment for tree survival, resulting in an increase in the simulation error at this site. In addition, during the model simulation, we found that the difference between the simulated and measured chronologies of ZZ_high increased after 2010, which we speculate could be due to the intensification of human activities, similar to that seen in the Qilian Mountains of western China [54]. Another interesting phenomenon is that although LY_high is at the same elevation as ZZ_high, the simulation trend is much better and the RMSE is lower. The reason may be that the distribution of Dahurian larch in the Greater Khingan Range is at a relatively high elevation, and the growth of LY_high is not close to the upper limit of the elevation, so it may have a better environment to survive in, resulting in a reduced simulation error. Finally, it should be noted that while ZZ_high performs worse than the other three sampling points in terms of overall trend and RMSE. but parameterization was primarily guided to achieve high correlation results, rather than low RMSE [55]. Therefore, considering the high correlation of ZZ_high (r = 0.767), the better fitting trend, and the relatively low error, we believe that the simulation results are still credible.
Differences in the physiological responses of different tree species and the same tree species to environmental factors exist in different regions. Therefore, different parameter values are obtained from the VS simulation results. Our parameter values (Table 2) were similar to those of Bao et al. [42], who simulated the chronology of Mongolian pine in Hulunbeier sandy soil (Tmin1 = 6, Topt1 = 12, Topt2 = 22, Tmax = 27). The likely reason is that both study areas were in the Hulunbeier area in the western Greater Khingan Range, where trees grow in a similar environment. Compared with the parameter values (T1 = 3, T2 = 10, T3 = 18) obtained by Zhang et al. [35] from a simulation of Qilian cypress (Sabina przewalskii Kom.) in Qaidam, our upper and lower limits of the minimum and Topt1 of the Greater Khingan Range Mongolian pine and Dahurian larch were higher, except for a lower value of the lower limit of the Topt1 of the low-elevation Dahurian larch. The reason is that Qilian cypress grows year-round on sunny slopes in high sunlight and heat conditions; therefore, it requires lower growing temperatures [56]. Mongolian pine and Dahurian larch grow at higher latitudes and elevations in this study area under low sunlight and heat conditions; thus, they require higher temperatures to grow. Although Mongolian pine and Dahurian larch are coniferous species, their growth parameters differ due to the differences in the growth environment and habit. The growth parameters of Mongolian pine (Tmin1 = 6.5/7.5, Topt1 = 13.5/15, Topt2 = 25/24, Wopt1 = 0.125/0.275) at the sampling sites showed a higher Tmin1, a higher lower limit of Topt1, and a higher upper limit of Topt2 than Daurian larch (Tmin1 = 4/4, Topt1 = 14.5/8, Topt2 = 22/21, Wopt1 = 0.2/0.5, Table 3). In contrast, Mongolian pine had a lower limit of optimum soil moisture. The reasons for these differences are the different growth habits of the two species. Dahurian larch is hardy and sunlight-loving and requires a cool climate, moist environment, and low temperature requirements. Mongolian pine is cold-resistant and barren-tolerant [57,58], with a sparse crown and short, thick, fleshy needles, which reduce transpiration; thus, it is more adaptable than larch. As a result, Mongolian pine requires higher temperatures to grow, whereas Dahurian larch requires higher soil moisture.
4.2. Growth Rate and Phenological Period
The simulated total growth rate, the average simulated proportion of the monthly total RWI in the growing season, and the relative contributions of soil moisture and temperature differed at the sampling sites due to differences in elevation. Trees growing at higher elevations result in shorter growth periods with higher growth rates, and trees growing at lower elevations have longer growth periods with slower growth rates. These differences are attributed to differences in temperature, precipitation, and other influences caused by the altitude. High-elevation trees show an “intensive strategy” with high growth rates in the short term, while lower-altitude trees exhibit an “extensive strategy” with lower maximum growth rates and longer durations [59].
The VS model simulation of the start and cessation date of the growing season showed that the RWI of Mongolian pine and LY_high were significantly negatively correlated with the growth start days, consistent with the results of previous studies [35,56]. A high correlation exists between tree growth start days and radial growth. When trees begin to grow, cell division occurs in the tree’s cambium layer, increasing tree biomass and forming wide tree rings. The RWI of Mongolian pine and LY_high was significantly and positively correlated with the cessation date of growth, unlike in previous studies [56,60]. The reason for this may be due to the divergence between the radial growth of the tree and the temperature, in addition to the different growing conditions in the region [61]. Generally, trees grow the fastest from June to August; subsequently, the growth rate slows down as temperatures begin to drop in September and continue to drop in October, reaching the lower temperature limit for tree growth [62]. The later cessation date of growth, the longer the development period of the latewood cells of the tree’s cambium layer, and the more organic matter is accumulated during the tree’s growth, increasing the RWI [23]. The growth of Mongolian pine at high and low elevations was affected by the growth start and cessation date. Dahurian larch exhibited some differences due to the elevation. High-elevation Dahurian larch growth was affected by the growth start and cessation date. In contrast, the correlation between the STD and the growth start and cessation date of low-elevation Dahurian larch was not significant, which was attributed to different tree species and site conditions, resulting in different combinations of the effect of soil moisture and temperature.
4.3. Limiting Climatic Factors
The STD of ZZ_high and LY_high was positively correlated with temperature. The STD of LY_low was negatively correlated with temperature, consistent with the results of previous studies [63,64,65,66]. Differences were observed between Mongolian pine and Dahurian larch. The STD of LY_low was negatively correlated with temperature, and the STD of ZZ_low was positively correlated with temperature. The RWI of LY_high and LY_low were insignificantly correlated with May precipitation, whereas those of ZZ_high and ZZ_low were significantly correlated with May precipitation. The reason may be differences in the distribution areas and growing environments of the two tree species, as well as different physiological [46,64] and species [67] characteristics. Mongolian pine in the Mangui region grows at lower elevations than Dahurian larch, resulting in differences in the hydrothermal conditions. It should be noted that different species have different growth rates and characteristics, resulting in diverse growth patterns of different species at the same altitude and similar growth patterns of the same species at different elevations [64]. In this study, ZZ_high and ZZ_low exhibited similar correlations between the STD and temperature and precipitation; this result suggests that the species effect had a larger influence on Mongolian pine radial growth than the elevation effect.
The simulation results indicated that the growth of ZZ_high, ZZ_low, and LY_high was limited by temperature and soil moisture. Due to the high latitude, high altitude, and low temperature of the sampling sites, the higher the temperature in the growing season, the higher the photosynthetic rate, the higher the accumulation of organic matter, and the wider the tree rings [25]. In contrast, low temperatures reduce the photosynthetic rate, and cold air may freeze young branches and leaves, resulting in narrow tree rings [40]. Moisture is a limiting factor in the early part of the growing season because a high photosynthetic rate is required to provide sufficient carbohydrates to sustain a high cellular growth rate, resulting in wide tree rings, whereas insufficient moisture leads to narrow tree rings [68]. The simulation results in this study were generally similar to the statistical results, but there were some differences. The statistical results for LY_high showed that precipitation was not the limiting factor, but the simulation results indicated that soil moisture was the limiting factor in the middle and early periods. The reason for this discrepancy was sufficient precipitation in the previous winter. The statistical results showed that the RWI was significantly and positively correlated with precipitation in the previous December, suggesting that winter precipitation promotes radial tree growth. Numerous studies have shown that the winter snowpack contributes significantly to the water content of the upper soil layers in the spring [69,70], protecting the soil and roots from cold air [71]. The region is in a high-latitude perennial permafrost zone, and the growing season begins in May. As temperatures rise, snow and perennial permafrost melting can replenish soil moisture [70,72,73,74], and nutrients and organic matter released from permafrost also provide nutrients for trees [75,76]. In addition, increased precipitation during the summer months can increase soil moisture. The timing of precipitation and soil moisture differed for high- and low-elevation Mongolian pine; soil moisture affected ZZ_high in May–July, and soil moisture influenced ZZ_low during the entire growing season (May–September). The reasons for the inconsistency between the effect of soil moisture and the timing of precipitation were the snowpack, permafrost thawing, summer precipitation, and the soil’s ability to store water [34]. Precipitation in May may remain longer in the soil longer due to the soil’s water-holding capacity. LY_low differs from Mongolian pine and LY_high in that it is primarily affected by soil moisture during the growing season. In contrast, the negative correlation between temperature and RWI was the result of the correlation between precipitation and RWI. In the growing season, adequate temperatures are required for tree growth. Very high temperatures lead to strong evaporation, insufficient water, and drought stress [49]. The snowpack, permafrost thawing, and soil moisture are sufficient to promote tree growth.
5. Conclusions
The VS model was utilized to simulate the effects of climatic factors on the radial growth of Mongolian pine and Dahurian larch in the Greater Khingan Range. The correlation between the simulated and measured RWI was high, demonstrating that the model accurately simulated the physiological growth processes of Mongolian pine and Dahurian larch. It revealed the effects of different climatic factors (temperature, soil moisture) on the two tree species in different growth stages. Temperature and soil moisture during the growing season had a significant effect on the growth rate of both tree species.
Mongolian pine and Dahurian larch differed in their responses to climatic factors. (1) Dahurian larch is hardier but has higher soil moisture requirements, whereas Mongolian pine has lower moisture requirements and is more adaptable. (2) The radial growth rate of the two tree species were consistent for the same elevation gradient, with higher growth rates and shorter growth periods at high elevations and lower growth rates and longer growth periods at lower elevations. (3) The two tree species had the same limiting factors at high elevations and different limiting factors at low elevations. Temperature and soil moisture were the dominant factors limiting the growth of ZZ_low, whereas soil moisture was the primary factor affecting low-elevation Dahurian larch. These results suggest that the growth responses of trees to climate depend on the species and elevation. It should be noted that raw data, including real-time data, such as tree physiological indicators and hydroclimatic observations, are valuable for improving the accuracy of the modeling results. Therefore, a large sample size of tree measurements should be utilized in future work to improve model accuracy. In addition, the meteorological stations in this study are too far away from the sampling points, which may have an impact on the accuracy of the model simulation, and this is an issue to be focused on in future work.
Under the background of global warming, the phenomenon of climate warming and drying in the Greater Khingan Range will worsen, and the pattern of radial growth of trees in response to climate will alter. The growth of high-elevation tree species in this study area, which is jointly affected by temperature and soil moisture, will become complicated, and the low-elevation areas, which are more affected by soil moisture, especially the low-elevation Dahurian larch, which is mainly affected by soil moisture, may decline due to the aggravation of drought stress, which should be addressed in future forest management work.
Author Contributions
Conceptualization, S.Z. and D.Z.; methodology, S.Z. and Z.W.; software, S.Z., T.L. and X.W.; validation, D.Z., Z.W. and T.M.; formal analysis, Z.W.; investigation, S.Z.; resources, D.Z.; data curation, S.Z.; writing—original draft preparation, S.Z.; writing—review and editing, S.Z., D.Z. and Z.W.; project administration, S.Z. and D.Z. All authors have read and agreed to the published version of the manuscript.
Funding
This research was funded by the National Natural Science Foundation of China (Project No. 41671064) and the Natural Science Foundation of Heilongjiang Province of China (Project No. LH2021D012).
Data Availability Statement
The data that support the findings on this study are not openly available and are available from the corresponding author upon reasonable request.
Acknowledgments
We would like to thank the anonymous reviewers for their constructive comments; we also thank the support of the Harbin Normal University Graduate Academic Forum.
Conflicts of Interest
The authors declare no conflicts of interest.
References
- Jiao, L.; Wang, D. Climate change, the evaporation paradox, and their effects on streamflow in Lijiang watershed. Pol. J. Environ. Stud. 2018, 27, 2585–2591. [Google Scholar] [CrossRef]
- Alkama, R.; Cescatti, A. Biophysical climate impacts of recent changes in global forest cover. Science 2016, 351, 600–604. [Google Scholar] [CrossRef]
- Zhao, K.; Jackson, R.B. Biophysical forcings of land-use changes from potential forestry activities in North America. Ecol. Monogr. 2014, 84, 329–353. [Google Scholar] [CrossRef]
- Engelbrecht, B.M. Forests on the brink. Nature 2012, 491, 675–676. [Google Scholar] [CrossRef]
- Allen, C.D.; Macalady, A.K.; Chenchouni, H.; Bachelet, D.; McDowell, N.; Vennetier, M.; Kitzberger, T.; Rigling, A.; Breshears, D.D.; Hogg, E.T. A global overview of drought and heat-induced tree mortality reveals emerging climate change risks for forests. For. Ecol. Manag. 2010, 259, 660–684. [Google Scholar] [CrossRef]
- Meng, Y.; Liu, X.; Ding, C.; Xu, B.; Zhu, L. Analysis of ecological resilience to evaluate the inherent maintenance capacity of a forest ecosystem using a dense Landsat time series. Ecol. Inform. 2020, 57, 101064. [Google Scholar] [CrossRef]
- Sánchez-Salguero, R.; Camarero, J.J.; Gutiérrez, E.; Gonzalez Rouco, F.; Gazol, A.; Sangüesa-Barreda, G.; Andreu-Hayles, L.; Linares, J.C.; Seftigen, K. Assessing forest vulnerability to climate warming using a process-based model of tree growth: Bad prospects for rear-edges. Glob. Chang. Biol. 2017, 23, 2705–2719. [Google Scholar] [CrossRef] [PubMed]
- Qi, Z.; Liu, H.; Wu, X.; Hao, Q. Climate-driven speedup of alpine treeline forest growth in the Tianshan Mountains, Northwestern China. Glob. Chang. Biol. 2015, 21, 816–826. [Google Scholar] [CrossRef] [PubMed]
- Liu, H.; Yin, Y.; Hao, Q.; Liu, G. Sensitivity of temperate vegetation to Holocene development of East Asian monsoon. Quat. Sci. Rev. 2014, 98, 126–134. [Google Scholar] [CrossRef]
- Drobyshev, I.; Gewehr, S.; Berninger, F.; Bergeron, Y. Species specific growth responses of black spruce and trembling aspen may enhance resilience of boreal forest to climate change. J. Ecol. 2013, 101, 231–242. [Google Scholar] [CrossRef]
- Soh, W.K.; Yiotis, C.; Murray, M.; Parnell, A.; Wright, I.J.; Spicer, R.A.; Lawson, T.; Caballero, R.; McElwain, J.C. Rising CO2 drives divergence in water use efficiency of evergreen and deciduous plants. Sci. Adv. 2019, 5, eaax7906. [Google Scholar] [CrossRef]
- Fritts, H. Tree Rings and Climate; Academic Press Inc.: London, UK, 1976; Volume 562. [Google Scholar]
- Mann, M.E.; Jones, P.D. Global surface temperatures over the past two millennia. Geophys. Res. Lett. 2003, 30, 1–4. [Google Scholar] [CrossRef]
- Zhang, Z. Tree-rings, a key ecological indicator of environment and climate change. Ecol. Indic. 2015, 51, 107–116. [Google Scholar] [CrossRef]
- Hughes, M.K. Dendrochronology in climatology–the state of the art. Dendrochronologia 2002, 20, 95–116. [Google Scholar] [CrossRef]
- Zhang, R.; Yuan, Y.; Wei, W.; He, Q.; Shang, H.; Zhang, T.; Zhao, Y. Changes of wet and dry in the past hundred years in eastern Kyrgyzstan by tree-ring. Arid Land Geogr. 2013, 36, 691–699. [Google Scholar] [CrossRef]
- Saladyga, T.; Maxwell, R.S. Temporal variability in climate response of eastern hemlock in the Central Appalachian Region. Southeast. Geogr. 2015, 55, 143–163. [Google Scholar] [CrossRef]
- D’Arrigo, R.; Wilson, R.; Liepert, B.; Cherubini, P. On the ‘divergence problem’in northern forests: A review of the tree-ring evidence and possible causes. Glob. Planet. Chang. 2008, 60, 289–305. [Google Scholar] [CrossRef]
- Wilmking, M.; Juday, G.P.; Barber, V.A.; Zald, H.S. Recent climate warming forces contrasting growth responses of white spruce at treeline in Alaska through temperature thresholds. Glob. Chang. Biol. 2004, 10, 1724–1736. [Google Scholar] [CrossRef]
- Wu, G.; Xu, G.; Chen, T.; Liu, X.; Zhang, Y.; An, W.; Wang, W.; Fang, Z.-a.; Yu, S. Age-dependent tree-ring growth responses of Schrenk spruce (Picea schrenkiana) to climate—A case study in the Tianshan Mountain, China. Dendrochronologia 2013, 31, 318–326. [Google Scholar] [CrossRef]
- Schwab, N.; Kaczka, R.J.; Janecka, K.; Böhner, J.; Chaudhary, R.P.; Scholten, T.; Schickhoff, U. Climate change-induced shift of tree growth sensitivity at a central Himalayan treeline ecotone. Forests 2018, 9, 267. [Google Scholar] [CrossRef]
- Cook, E.R.; Kairiukstis, L.A. Methods of Dendrochronology: Applications in the Environmental Sciences; Springer Science & Business Media: Berlin, Germany, 2013. [Google Scholar]
- Wu, Y.; Gan, M.; Yu, R.; Yang, M.; Guo, Y.; Zhao, P. Process-based modeling radial growth of Picea schrenkiana in the eastern Tianshan Mountains. Arid Land Geogr. 2020, 43, 64–71. [Google Scholar] [CrossRef]
- Zhang, Y.; Shao, X.; Xu, Y.; Wilmking, M. Process-based modeling analyses of Sabina przewalskii growth response to climate factors around the northeastern Qaidam Basin. Chin. Sci. Bull. 2011, 56, 1518–1525. [Google Scholar] [CrossRef][Green Version]
- Anchukaitis, K.; Evans, M.; Kaplan, A.; Vaganov, E.; Hughes, M.; Grissino-Mayer, H.; Cane, M. Forward modeling of regional scale tree-ring patterns in the southeastern United States and the recent influence of summer drought. Geophys. Res. Lett. 2006, 33, 347–360. [Google Scholar] [CrossRef]
- Touchan, R.; Shishov, V.; Meko, D.; Nouiri, I.; Grachev, A. Process based model sheds light on climate sensitivity of Mediterranean tree-ring width. Biogeosciences 2012, 9, 965–972. [Google Scholar] [CrossRef]
- Shishov, V.V.; Tychkov, I.I.; Popkova, M.I.; Ilyin, V.A.; Bryukhanova, M.V.; Kirdyanov, A.V. VS-oscilloscope: A new tool to parameterize tree radial growth based on climate conditions. Dendrochronologia 2016, 39, 42–50. [Google Scholar] [CrossRef]
- Fritts, H.; Shashkin, A.; Downes, G. A simulation model of conifer ring growth and cell structure. In Tree-Ring Analysis: Biological, Methodological and Environmental Aspects; CABI Publishing: Wallingford, UK, 1999; pp. 3–32. [Google Scholar]
- Vaganov, E. Analysis of a seasonal growth patterns of trees and modelling in dendrochronology. Tree-Rings Clim. Humanit. Radiocarb. 1996, 1996, 73–87. [Google Scholar]
- Zhang, Y.; Shao, X.; Xu, Y.; WILMKING, M. Response processes of Qilian cypress to climatic factors at the northeastern edge of Qaidam simulated by physiological modeling. Chin. Sci. Bull. 2011, 56, 975–982. [Google Scholar]
- Chen, L.; Huang, J.-G.; Stadt, K.J.; Comeau, P.G.; Zhai, L.; Dawson, A.; Alam, S.A. Drought explains variation in the radial growth of white spruce in western Canada. Agric. For. Meteorol. 2017, 233, 133–142. [Google Scholar] [CrossRef]
- Sánchez-Salguero, R.; Camarero, J.J.; Rozas, V.; Génova, M.; Olano, J.M.; Arzac, A.; Gazol, A.; Caminero, L.; Tejedor, E.; de Luis, M. Resist, recover or both? Growth plasticity in response to drought is geographically structured and linked to intraspecific variability in Pinus pinaster. J. Biogeogr. 2018, 45, 1126–1139. [Google Scholar] [CrossRef]
- Tumajer, J.; Altman, J.; Štěpánek, P.; Treml, V.; Doležal, J.; Cienciala, E. Increasing moisture limitation of Norway spruce in Central Europe revealed by forward modelling of tree growth in tree-ring network. Agric. For. Meteorol. 2017, 247, 56–64. [Google Scholar] [CrossRef]
- Shi, J.; Liu, Y.; Vaganov, E.A.; Li, J.; Cai, Q. Statistical and process-based modeling analyses of tree growth response to climate in semi-arid area of north central China: A case study of Pinus tabulaeformis. J. Geophys. Res. Biogeosci 2008, 113, 1–10. [Google Scholar] [CrossRef]
- Zhang, J.; Gou, X.; Zhang, Y.; Lu, M.; Xu, X.; Zhang, F.; Liu, W.; Gao, L. Forward modeling analyses of Qilian Juniper (Sabina przewalskii) growth in response to climate factors in different regions of the Qilian Mountains, northwestern China. Trees 2016, 30, 175–188. [Google Scholar] [CrossRef]
- Xiao-Ying, W.; Chun-Yu, Z.; Qing-Yu, J. Impacts of climate change on forest ecosystems in Northeast China. Adv. Clim. Chang. Res. 2013, 4, 230–241. [Google Scholar] [CrossRef]
- Luo, X.; Liang, Y.; He, H.; Hang, C.; Zhang, Q. Long-term effects of climate change and different silvicultural strategies on stand information and aboveground biomass of forest major species in the Great Xing’an Mountains. Acta Ecol. Sin. 2019, 39, 7656–7669. [Google Scholar] [CrossRef]
- Xie, A.; Suan, Y.; Bai, R. Arid Climate Trend over Northeastern China and Its Response to Global Warming. Acta Geogr. Sin. 2003, 58, 75–82. [Google Scholar] [CrossRef]
- Guo, X.; Wang, Z.; Zhang, N.; Zhang, D. Responses of radial growth of Pinus sylvestris var.mongolica and Larix gmelinii to climate change. Chin. J. Appl. Ecol. 2021, 32, 3405–3414. [Google Scholar] [CrossRef]
- Sun, Z.; Zhao, H.; Zhu, L.; Li, Z.; Zhang, Y.; Wang, X. Differences in response of Larix gmelinii growth to rising temperature under different precipitation gradients in northern Daxing’an Mountains of northeastern China. J. Beijing For. Univ. 2019, 41, 1–14. [Google Scholar] [CrossRef]
- Zhang, X.; Wang, F.; Tie, N. Relationship between Radial Growth of Larix gmelinii Forest and Climatic Factors. For. Inventory Plan. 2021, 46, 106–113. [Google Scholar] [CrossRef]
- Bao, G.; Liu, Z.; Liu, N.; Wu, M. Simulation analysis of the radial growth characteristics of Pinus sylvestris var.mongolica in Hulunbuir Sandy Land by Vaganov-Shashkin Model. Chin. J. Appl. Ecol. 2021, 32, 3448–3458. [Google Scholar] [CrossRef]
- Weng, D.; Suan, Z.-a. A preliminary study of the lapse rate of surface air temperature over mountainous regions of China. Geogr. Res. 1984, 3, 24–34. Available online: https://www.dlyj.ac.cn/CN/10.11821/yj1984020003 (accessed on 20 May 2023).
- Holmes, R.L. Computer-assisted quality control in tree-ring dating and measurement. Tree-Ring Bull. 1983, 43, 69–78. [Google Scholar] [CrossRef]
- Cook, E.R. A Time Series Approach to Tree-Ring Standardization. Ph.D. Thesis, University of Arizona, Tucson, AZ, USA, 1985. [Google Scholar]
- Chen, K.; Jiao, L.; Liu, X.; Qi, C.; Xue, R. Evaluation of the response stability of two dominant conifer species to climate change in the southern margin of the Tengger Desert. Glob. Ecol. Conserv. 2021, 25, e01439. [Google Scholar] [CrossRef]
- Arzac, A.; Garcia-Cervigon, A.I.; Vicente-Serrano, S.M.; Loidi, J.; Olano, J.M. Phenological shifts in climatic response of secondary growth allow Juniperus sabina L. to cope with altitudinal and temporal climate variability. Agric. For. Meteorol. 2016, 217, 35–45. [Google Scholar] [CrossRef]
- Evans, M.; Reichert, B.; Kaplan, A.; Anchukaitis, K.; Vaganov, E.; Hughes, M.; Cane, M. A forward modeling approach to paleoclimatic interpretation of tree-ring data. J. Geophys. Res. Biogeosci. 2006, 111, 1–13. [Google Scholar] [CrossRef]
- Shi, J.; Liu, Y.; Cai, Q.; Yi, L. A case study of physiological characteristics of statistical correlation between Pinus tabulaeformis tree-ring widths and climatic factors. Acta Ecol. Sin. 2006, 26, 697–705. [Google Scholar]
- Vaganov, E.A.; Anchukaitis, K.J.; Evans, M.N. How well understood are the processes that create dendroclimatic records? A mechanistic model of the climatic control on conifer tree-ring growth dynamics. In Dendroclimatology: Progress and Prospects; Spring: Berlin/Heidelberg, Germany, 2011; pp. 37–75. [Google Scholar] [CrossRef]
- Tychkov, I.I.; Sviderskaya, I.V.; Babushkina, E.A.; Popkova, M.I.; Vaganov, E.A.; Shishov, V.V. How can the parameterization of a process-based model help us understand real tree-ring growth? Trees 2019, 33, 345–357. [Google Scholar] [CrossRef]
- Harris, I.; Osborn, T.J.; Jones, P.; Lister, D. Version 4 of the CRU TS monthly high-resolution gridded multivariate climate dataset. Sci. Data 2020, 7, 109. [Google Scholar] [CrossRef] [PubMed]
- Vaganov, E.A.; Hughes, M.K.; Shashkin, A.V. Growth Dynamics of Conifer Tree Rings: Images of Past and Future Environments; Springer Science & Business Media: Berlin, Germany, 2006; Volume 183. [Google Scholar]
- Wang, Y.F.; Zhang, Y.X.; Gou, X.H.; Gao, L.L.; Wang, F. Climate response mechanism of radial growth of Picea crassifolia in low altitude area of middle Qili. Acta Ecol. Sin. 2020, 40, 161–169. [Google Scholar] [CrossRef]
- Jevšenak, J.; Tychkov, I.; Gričar, J.; Levanič, T.; Tumajer, J.; Prislan, P.; Arnič, D.; Popkova, M.; Shishov, V.V. Growth-limiting factors and climate response variability in Norway spruce (Picea abies L.) along an elevation and precipitation gradients in Slovenia. Int. J. Biometeorol. 2021, 65, 311–324. [Google Scholar] [CrossRef]
- Chen, L.; Li, S.; Hou, L.; Shi, A.; Bai, H. Response of Larix chinensis radial growth to climatic factors based on the Vaganov-Shashkin model. Chin. J. Appl. Ecol. 2017, 28, 2470–2480. [Google Scholar] [CrossRef]
- Zhu, J.; Kang, H.; Li, Z.; Wang, G.; Zhang, R. Impact of water stress on survival and photosynthesis of Mongolian pine seedlings on sandy land. Acta Ecol. Sin. 2005, 25, 2527–2533. [Google Scholar] [CrossRef]
- Kang, H.; Zhu, J.; Li, Z.; Xu, M. Natural distribution of Pinus sylvestris var. mongolica on sandy land and its cultivation as an exotic species. Chin. J. Ecol. 2004, 23, 134–139. Available online: https://www.cje.net.cn/CN/Y2004/V/I5/134 (accessed on 13 October 2023).
- Jiang, Y.; Zhang, Y.; Guo, Y.; Kang, M.; Wang, M.; Wang, B. Intra-annual xylem growth of Larix principis-rupprechtii at its upper and lower distribution limits on the Luyashan mountain in North-Central China. Forests 2015, 6, 3809–3827. [Google Scholar] [CrossRef]
- Wu, Y.; Gan, M.; Yu, R. Effect of climate on the radial growth of Larix sibirica and its phenological features in the eastern Tianshan Mountains. Chin. J. Appl. Environ. Biol. 2019, 25, 1301–1311. [Google Scholar] [CrossRef]
- Zhang, Y.; Wilmking, M.; Gou, X. Changing relationships between tree growth and climate in Northwest China. In Forest Ecology: Recent Advances in Plant Ecology; Spring: Berlin/Heidelberg, Germany, 2009; pp. 39–50. [Google Scholar] [CrossRef]
- Zhang, T.; Yuan, Y.; Wei, W.; Shang, H.-m.; Yu, S.; Zhang, R.; Chen, F.; Fan, Z.; Qin, L. Developments and Analysis of Multi-Tree-Ring Width Chronologies of Meyer Spruce in the Ortindag Sand Land. Desert Oasis Meteorol. 2016, 10, 47–53. [Google Scholar] [CrossRef]
- Yu, D.; Wang, G.G.; Dai, L.; Wang, Q. Dendroclimatic analysis of Betula ermanii forests at their upper limit of distribution in Changbai Mountain, Northeast China. For. Ecol. Manag. 2007, 240, 105–113. [Google Scholar] [CrossRef]
- Gao, L.; Gou, X.; Deng, Y.; Yang, M.; Zhang, F. Assessing the influences of tree species, elevation and climate on tree-ring growth in the Qilian Mountains of northwest China. Trees 2017, 31, 393–404. [Google Scholar] [CrossRef]
- Zhou, P.; Huang, J.-G.; Liang, H.; Rossi, S.; Bergeron, Y.; Shishov, V.V.; Jiang, S.; Kang, J.; Zhu, H.; Dong, Z. Radial growth of Larix sibirica was more sensitive to climate at low than high altitudes in the Altai Mountains, China. Agric. For. Meteorol. 2021, 304, 108392. [Google Scholar] [CrossRef]
- Bai, X.; Zhang, X.; Li, J.; Duan, X.; Jin, Y.; Chen, Z. Altitudinal disparity in growth of Dahurian larch (Larix gmelinii Rupr.) in response to recent climate change in northeast China. Sci. Total Environ. 2019, 670, 466–477. [Google Scholar] [CrossRef]
- Li, W.; Jiang, Y.; Dong, M.; Du, E.; Wu, F.; Zhao, S.; Xu, H. Species-specific growth-climate responses of Dahurian larch (Larix gmelinii) and Mongolian pine (Pinus sylvestris var. mongolica) in the Greater Khingan Range, northeast China. Dendrochronologia 2021, 65, 125803. [Google Scholar] [CrossRef]
- Zeng, X.; Wei, C.; Liu, X.; Zhang, L. Qinghai spruce (Picea crassifolia) and Chinese pine (Pinus tabuliformis) show high vulnerability and similar resilience to early-growing-season drought in the Helan Mountains, China. Ecol. Indic. 2020, 110, 105871. [Google Scholar] [CrossRef]
- Qin, L.; Yuan, Y.; Zhang, R.; Wei, W.; Yu, S.; Fan, Z.; Chen, F.; Zhang, T.; Shang, H. Tree-ring response to snow cover and reconstruction of century annual maximum snow depth for northern Tianshan Mountains, China. Geochronometria 2016, 43, 9–17. [Google Scholar] [CrossRef]
- Zhang, X.; Liu, X.; Zhang, Q.; Zeng, X.; Xu, G.; Wu, G.; Wang, W. Species-specific tree growth and intrinsic water-use efficiency of Dahurian larch (Larix gmelinii) and Mongolian pine (Pinus sylvestris var. mongolica) growing in a boreal permafrost region of the Greater Hinggan Mountains, Northeastern China. Agric. For. Meteorol. 2018, 248, 145–155. [Google Scholar] [CrossRef]
- Dinis, L.; Savard, M.M.; Gammon, P.; Bégin, C.; Vaive, J. Influence of climatic conditions and industrial emissions on spruce tree-ring Pb isotopes analyzed at ppb concentrations in the Athabasca oil sands region. Dendrochronologia 2016, 37, 96–106. [Google Scholar] [CrossRef]
- Yu, D.; Wang, Q.; Wang, G.G.; Dai, L. Dendroclimatic response of Picea jezoensis along an altitudinal gradient in Changbai Mountains. Sci. China Ser. E Technol. Sci. 2006, 49, 150–159. [Google Scholar] [CrossRef]
- Baltzer, J.L.; Veness, T.; Chasmer, L.E.; Sniderhan, A.E.; Quinton, W.L. Forests on thawing permafrost: Fragmentation, edge effects, and net forest loss. Glob. Chang. Biol. 2014, 20, 824–834. [Google Scholar] [CrossRef]
- Feng, X.; Zhang, Y.; Chang, X. Analysis of heat and water transferring characteristics in the active layer of permafrost in the wetland of the Greater Khingan Mountains. J. Glaciol. Geocryol. 2021, 43, 1468–1479. [Google Scholar] [CrossRef]
- Guo, Y.; Song, C.; Wan, Z.; Lu, Y.; Qiao, T.; Tan, W.; Wang, L. Dynamics of dissolved organic carbon release from a permafrost wetland catchment in northeast China. J. Hydrol. 2015, 531, 919–928. [Google Scholar] [CrossRef]
- Reyes, F.R.; Lougheed, V.L. Rapid nutrient release from permafrost thaw in arctic aquatic ecosystems. Arct. Antarct. Alp. Res. 2015, 47, 35–48. [Google Scholar] [CrossRef]
Disclaimer/Publisher’s Note: The statements, opinions and data contained in all publications are solely those of the individual author(s) and contributor(s) and not of MDPI and/or the editor(s). MDPI and/or the editor(s) disclaim responsibility for any injury to people or property resulting from any ideas, methods, instructions or products referred to in the content. |
© 2024 by the authors. Licensee MDPI, Basel, Switzerland. This article is an open access article distributed under the terms and conditions of the Creative Commons Attribution (CC BY) license (https://creativecommons.org/licenses/by/4.0/).