Article

The Effect of the Vaccinium myrtillus L. Rhizosphere on the Maturity Index for Predatory Mites (Mesostigmata: Gamasina) in Assessing Anthropogenic Pollution of Forest Soils

by
Gabriela Barczyk
*,
Aleksandra Nadgórska-Socha
and
Marta Kandziora-Ciupa
Institute of Biology, Biotechnology and Environmental Protection, Faculty of Natural Sciences, University of Silesia in Katowice, 40-007 Katowice, Poland
*
Author to whom correspondence should be addressed.
Forests 2024, 15(12), 2245; https://doi.org/10.3390/f15122245
Submission received: 5 November 2024 / Revised: 2 December 2024 / Accepted: 18 December 2024 / Published: 20 December 2024
(This article belongs to the Section Forest Soil)

Abstract

:
The soil’s biological quality and its functions are closely linked. They determine the ecological processes and ecosystem services. Therefore, the heavy metal contamination of forest soils, leading to their degradation, is a major international problem. Soil is a habitat for many organisms, and the strong correlations between soil properties, vegetation, and soil fauna are particularly evident in the rhizosphere. Therefore, comprehensive soil monitoring must take all these elements into account. In forest soils, Vaccinium myrtillus plays a vital role. Despite this, there is still a lack of information in the literature on the interrelationship between microarthropod biodiversity, including predatory soil mites, and heavy metals in the rhizosphere zone of blueberry plants. To fill this gap, we assessed the impact of the V. myrtillus rhizosphere on soil stability and biological quality using a bioindicator based on predatory mites. We conducted the study in Poland, on selected forest sites characterised by varying degrees of soil contamination. In our study, we used a combined analysis based on the following indicators: maturity index (MI), contamination factor (CF), pollution load index (PLI), and potential ecological risk index (PERI), which allowed us to determine the level of soil contamination. We extracted 4190 Gamasina mites from soil samples. We also investigated soil properties such as pH, organic matter content, total carbon, total nitrogen, C/N ratio, and heavy metal concentrations (Cd, Cu, Zn, Pb, and Ni). Our study proved that the rhizosphere zone significantly influences the stability of the predatory soil mite community, but this influence depends on the degree of soil contamination. We found that in unpolluted or moderately polluted soil, soil mites prefer habitats with less biological activity, i.e., non-rhizosphere zones. These main results are fascinating and indicate the need for further in-depth research. Our study’s comprehensive combination of methods provides valuable information that can facilitate the interpretation of environmental results. In addition, our study can be a starting point for analysing the impact of the rhizosphere zones of many other plant species, especially those used in the reclamation or urban spaces.

1. Introduction

For many years, forest ecosystems have been exposed to pollutants, mainly heavy metals, which accumulate in the surface layers of the soil and then penetrate deep into the soil profile, especially in the industrial areas of central Europe [1]. Heavy metals in forests can result in soil degradation, which in turn can affect the productivity and functioning of the ecosystem. Furthermore, the microhabitats of soil organisms, including microarthropods, the majority of which are sedentary and unable to respond rapidly to changes in soil properties, may also be altered [2]. The high toxicity and environmental stability of heavy metals distinguish them from other pollutants, in addition to them being insusceptible to biodegradation [3]. This quality renders them a significant threat to the soil ecosystem, and in numerous countries, they represent a critical environmental concern [4].
As concentrations of heavy metals in soils can reach or exceed levels that are dangerous to organisms directly associated with the soil and humans, there is a growing need to monitor these ecosystems [5]. One way to comprehensively assess the degree of heavy metal accumulation in soils is through indicators of pollution and ecological risk assessment. The most commonly used indicators are the single contamination factor (CF), the pollution load index (PLI), and the potential ecological risk index (PERI). These indices are helpful for the assessment of the extent of soil contamination in different ecosystems and for the interpretation of the toxic effects of soil contamination [1,6,7]. To comprehensively analyse and assess the potential ecological impact or risk associated with the heavy metal contamination of soils, the distribution and structure of the soil fauna should be included in the study [6]. Mesofauna, especially mites, play a crucial role in soil ecology, and their diversity should be protected [8,9]. In addition, many authors emphasise soil mites’ high sensitivity to human disturbance, making them a good indicator of changes in industrial areas [2,3,6,10]. Their abundance, species richness, sensitivity to soil amendments, and ability to accumulate heavy metals are the reasons for their high bioindication potential [11,12]. If, in addition, an assessment of their life history is taken into account in the evaluation of the biological and ecological quality of the soil, then, predatory mites can be considered one of the most vulnerable groups [10]. Therefore, in our study, we used the maturity index (MI) for gamasine mites proposed by refs. [10,13,14]. This index can be used as an ecological measure of the impact of pollution on forest soils [13]. The index is based on the values of the r and K livelihood strategies and the number of Gamasina taxa that occur in the studied habitat. K-strategists prefer stable habitats, and seasonal fluctuations in numbers are rare. They are sensitive to environmental parameter changes and reluctant to colonise new sites. By contrast, r-strategists dominate disturbed and degraded habitats with low stability and biological quality [13]. Our study was conducted in a pine forest where the dominant species in the understorey was Vaccinium myrtillus L. (blueberry) [3]. It is the most abundant species in Europe and northern Asia and significantly influences the structure and functioning of forest ecosystems. This species is crucial for natural succession and forest productivity [15]. Our study focused primarily on the blueberry’s rhizosphere zone. Complex interactions occur between plants, microorganisms, and soil animals, which are crucial for the appropriate nutrient cycling and energy flow [16,17]. Our previous results showed that the blueberry rhizosphere zone is more sensitive to environmental disturbance caused by heavy metal pollution and can be used in the biomonitoring of forest soils. In addition, we found a stronger correlation between measured parameters (among others: soil enzyme activity, macronutrients, or potentially bioavailable elements) in the rhizosphere zone of blueberry, and we also saw a higher abundance of soil microarthropods, of which Acari were the most abundant [3].
In the literature, information on the interrelationship between microarthropod biodiversity, including predatory soil mites and heavy metals in the rhizosphere zone of blueberries, is still scarce. Therefore, the present study’s main aim was to determine the influence of the Vaccinium myrtillus rhizosphere on predatory soil mite communities’ stability in sites with varying soil pollution. Furthermore, we verified the hypothesis that the rhizosphere zone of blueberry would be preferred by predatory mites regardless of the degree of soil contamination. In addition, we tested the usefulness of the maturity index for gamasine mites to assess the impact of the selected heavy metals on soil quality in the blueberry rhizosphere zone.

2. Materials and Methods

2.1. Study Area

We studied a Scots pine (Pinus sylvestris L.) forest with the participation of Quercus robur L., Betula pendula L., and Fagus sylvatica L. on sandy soils. Three distinct polluted locations were used to collect materials as follows: close to the “Miasteczko Śląskie” zinc smelter in Miasteczko Śląskie (which has been in operation since 1968) (M), close to the ZGH “Boleslaw” mining and smelting complex in Bukowno (which was in operation from 1955 to 2022) (B), and close to a busy main road in Katowice–Kostuchna (K). A control site, an unprotected natural forest community in Kokotek (KO), was also sampled. All the sites are located in southern Poland’s Śląskie or Małopolskie province (Figure 1). Our previous publications outline the sites’ precise characteristics [3].

2.2. Sample Collections

In May and September of 2017, soil samples were collected. Samples for assessing predatory mite fauna, soil properties, and heavy metal content were taken from areas with vegetation of Vaccinium myrtillus Ten V. myrtillus shrubs chosen at random were meticulously excavated from the field at each sampling location. We considered rhizosphere soil (R) to be soil tightly adhered to the bilberry roots and separated from them by gently shaking them by hand [18,19,20]. In addition, we sampled soil from areas with no or minimal vegetation, excluding V. myrtillus (maintaining a distance of at least 50 cm from the rhizosphere of individual plants to eliminate the influence of the rhizosphere). For simplicity, this latter soil type is called ’non-rhizosphere’ (NR). Ten soil samples (separated between rhizosphere and non-rhizosphere samples) collected from subplots were combined into three composite samples at each study site. A total of 80 samples were taken.
At each location, two sampling sites were designated each season. Three samples of mite fauna were taken at each sampling site using the random sampling method. Samples were taken with a ten cubic cm metal core [21]. Samples were taken separately from the rhizospheric and non-rhizospheric zones. A total of 96 samples were taken. The correctness of the sampling protocol was checked using species accumulation curves analysis [22]. Tullgren funnels were used to extract mites from soil samples. For the taxonomic classification of soil mites, the most recommended methods can be found in refs. [23,24]. The samples remained in Tullgren funnels for seven days. After this time, the extracted mites were stored in 70% ethyl alcohol. Gamasina mites were counted and identified at the family level using commonly used keys such as those described in refs. [25,26,27,28,29]. From the samples, 4190 Gamasina mite individuals were extracted, including 2428 adults.

2.3. Soil Properties

A soil/water ratio of 1: 2.5 was used to measure the pH of the soil. The following technique was used to determine the organic matter content (%) [30]. The soil’s metal content (Cd, Cu, Zn, Pb, and Ni) was estimated using methods [31,32] in samples previously air-dried and sieved through a 2 mm-mesh sieve. Metals were extracted from soil with concentrated HNO3. Soil (0.5 g) was placed in quartz tubes to which 5 mL of HNO3 was added. The samples were left overnight at room temperature and then subjected to further mineralisation on an aluminium block at 150 °C for eight hours. The extracts were filtered and diluted with deionised water to a volume of 25 mL. Inductively coupled plasma-atomic emission spectroscopy (SPECTROBLUE ICP-OES, Spectro Analytical Instruments, Kleve, Germany) was used to determine the metal content of the extracts. An Vario MAX CNS, Elementar, Langenselbold, Germany was used to measure the carbon (Ctotal), nitrogen (Ntotal), and C/N ratio. All measurements were performed in triplicate. To determine the accuracy of the analytical data, reference soil material (NCS DC 77302, China 502 National Analysis Center for Iron and Steel, Beijing, China) was used. Additionally, all experimental protocols used blank samples.

2.4. Maturity Index

The performance of the Gamasina mite maturity indicator was tested to indicate the degree of rhizosphere influence on soil biological quality under conditions of varying soil pollution. The maturity index expresses the proportion of K-values to the total r- and K-values for every species in a sampled community. The index value ranges from zero, indicating no K-strategists at the site, to one indicating all species are K-strategists. The indicator’s value should be low in a highly or moderately disturbed ecosystem, e.g., due to heavy metal pollution. In such conditions, r-strategists dominate. Conversely, in an undisturbed ecosystem, the indicator takes higher values.
In this study, we assessed the degree of pollution and the condition of the soil at the investigated sites.
M I = i = 1 S K i i = 1 S K i + i = 1 S r i
where S is the number of Gamasina taxa, K is the K-value, and r is the r-value for the family of species i [10]. Families are ranked on a numerical r/K scale, as outlined in Table 1.

2.5. Assessment of Heavy (Trace) Metal Pollution

2.5.1. Contamination Factor and Pollution Load Index

For every heavy metal under investigation, the level of contamination was evaluated using a single contamination factor (CF) as follows:
C f i = C 0 1 i C n i
where C 0 1 i is the metal content of the investigated site and C n i is the reference value of heavy metals in ppm as follows: Cd = 1.0, Cu = 50, Zn = 175, and Pb = 70 by Hakanson [7] and Ni = 20 by Rutkowski [31].
In this study, we assessed the degree of pollution and the condition of the soil at the investigated sites. To calculate the overall level of soil pollution across the sampling sites, the pollution load index (PLI) was determined as follows [32,33,34]:
PLI = (Cf1 × Cf2 × Cf3 ×…× Cfn)1/n
where Cf is the metal contamination factor, and n is the number of samples analysed in this study. Recommendations for the use of the PLI are outlined in Table 2. The PLI for each site’s overall pollution level was also calculated.

2.5.2. Potential Ecological Risk Index

Hakanson [7] proposed a potential ecological risk index (PERI) to assess the degree of the heavy metal contamination of soils. This indicator considers the abundance of elements and their release capacity, considering the toxicity of heavy metals and the environmental response [35,36]. The PERI was calculated using the following formula:
P E R I = i = 1 M E r   i
E I R E r   i = i = 1 M T r i × C f i
where E r   i is the Ecological Risk Index (ERI), which provides a quantitative measure of the potential ecological risk of the heavy metals under consideration. T r i is the Toxic Response Factor for contamination with a single metal. The T r i values of heavy metals were reported by Hakanson [7] and Qing et al. [4]. Recommendations for the use of the ERI and PERI are outlined in Table 2.

2.6. Statistical Analysis

A two-way analysis of variance (ANOVA) was used to examine for differences in soil properties, abundance, and MI between the various sites and spheres. Analysis was preceded by testing the data for normality. Statistically significant differences were established using Tukey’s test at p < 0.05. The properties of the soil that affected the maturity index value in rhizosphere and non-rhizosphere soil were identified using multiple regression equations. The method of stepwise forward regression was applied. Statistica version 13 package, StatSoft, Inc., was used to perform all analyses. In addition, we created species accumulation curves to assess the correctness of the sampling protocol. Species accumulation curves have been created in the Species Diversity and Richness—version 4.0.

3. Results

3.1. Analysis of the Soil Parameters

All tested soils were acidic. These values ranged from pH = 3.56 (site KO R) to pH = 5.23 (site M R). For all the properties tested, differences were found between soil samples taken from the rhizosphere and outside the rhizosphere, which are statistically significant. The organic matter content at the studied sites ranged in various values. The lowest OM value was found at the M NR site (9%) and the highest at the KO R site (57.85%). There was a greater variation in the OM content in both spheres. The lowest and highest N% values were found in the non-rhizosphere zone at sites M and KO, respectively. The Ctotal% content ranged from 5.56 to 30.75, with the lowest values found in both tested zones at site M and the highest at the control site (KO). The C/N ratio showed the lowest value at the M R site and the highest value at the KO R site (Table 3). The differences in the content of the tested metals in the contaminated locations and the control sites were statistically significant.
The rhizosphere soil at site M had an exceptionally high PLI value, twice as high as the non-rhizosphere soil. The differences in heavy metal content in the two soil zones studied were statistically significant. The levels of individual elements are shown in Table 4. The highest potential ecological risk (PERI) was found at site M, and the differences in index values between the rhizosphere and non-rhizosphere zones were statistically significant (Table 4).

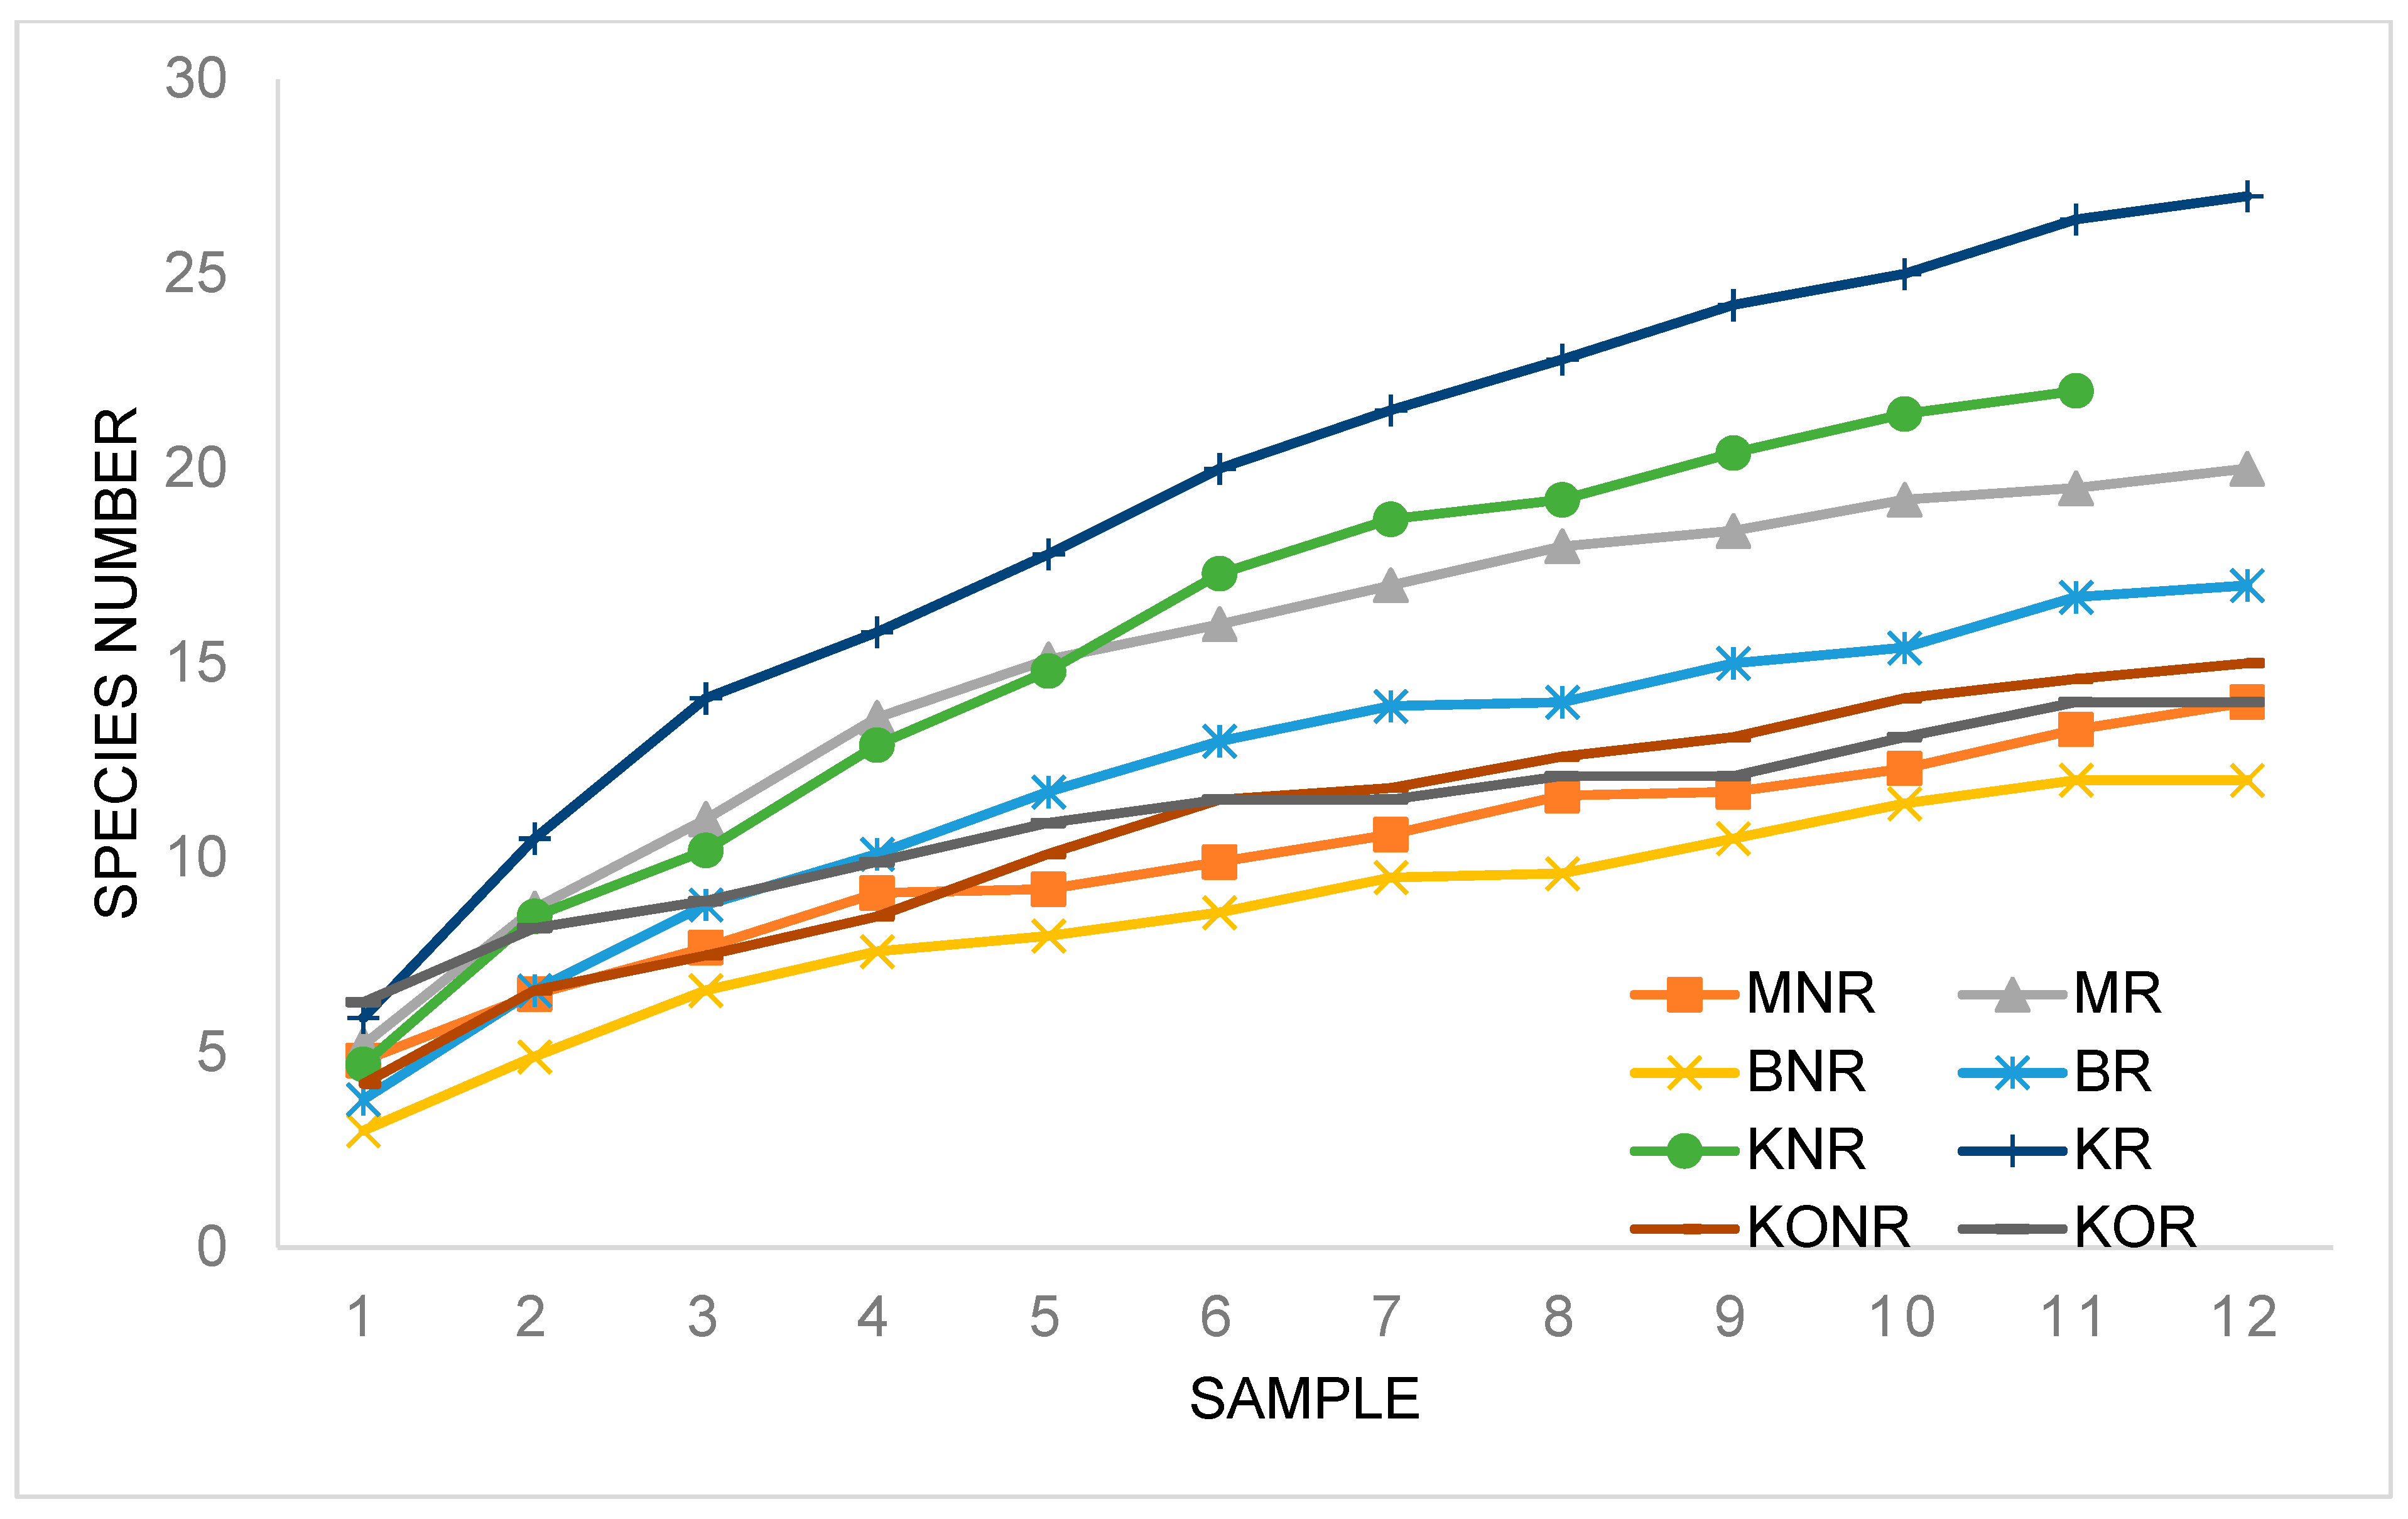
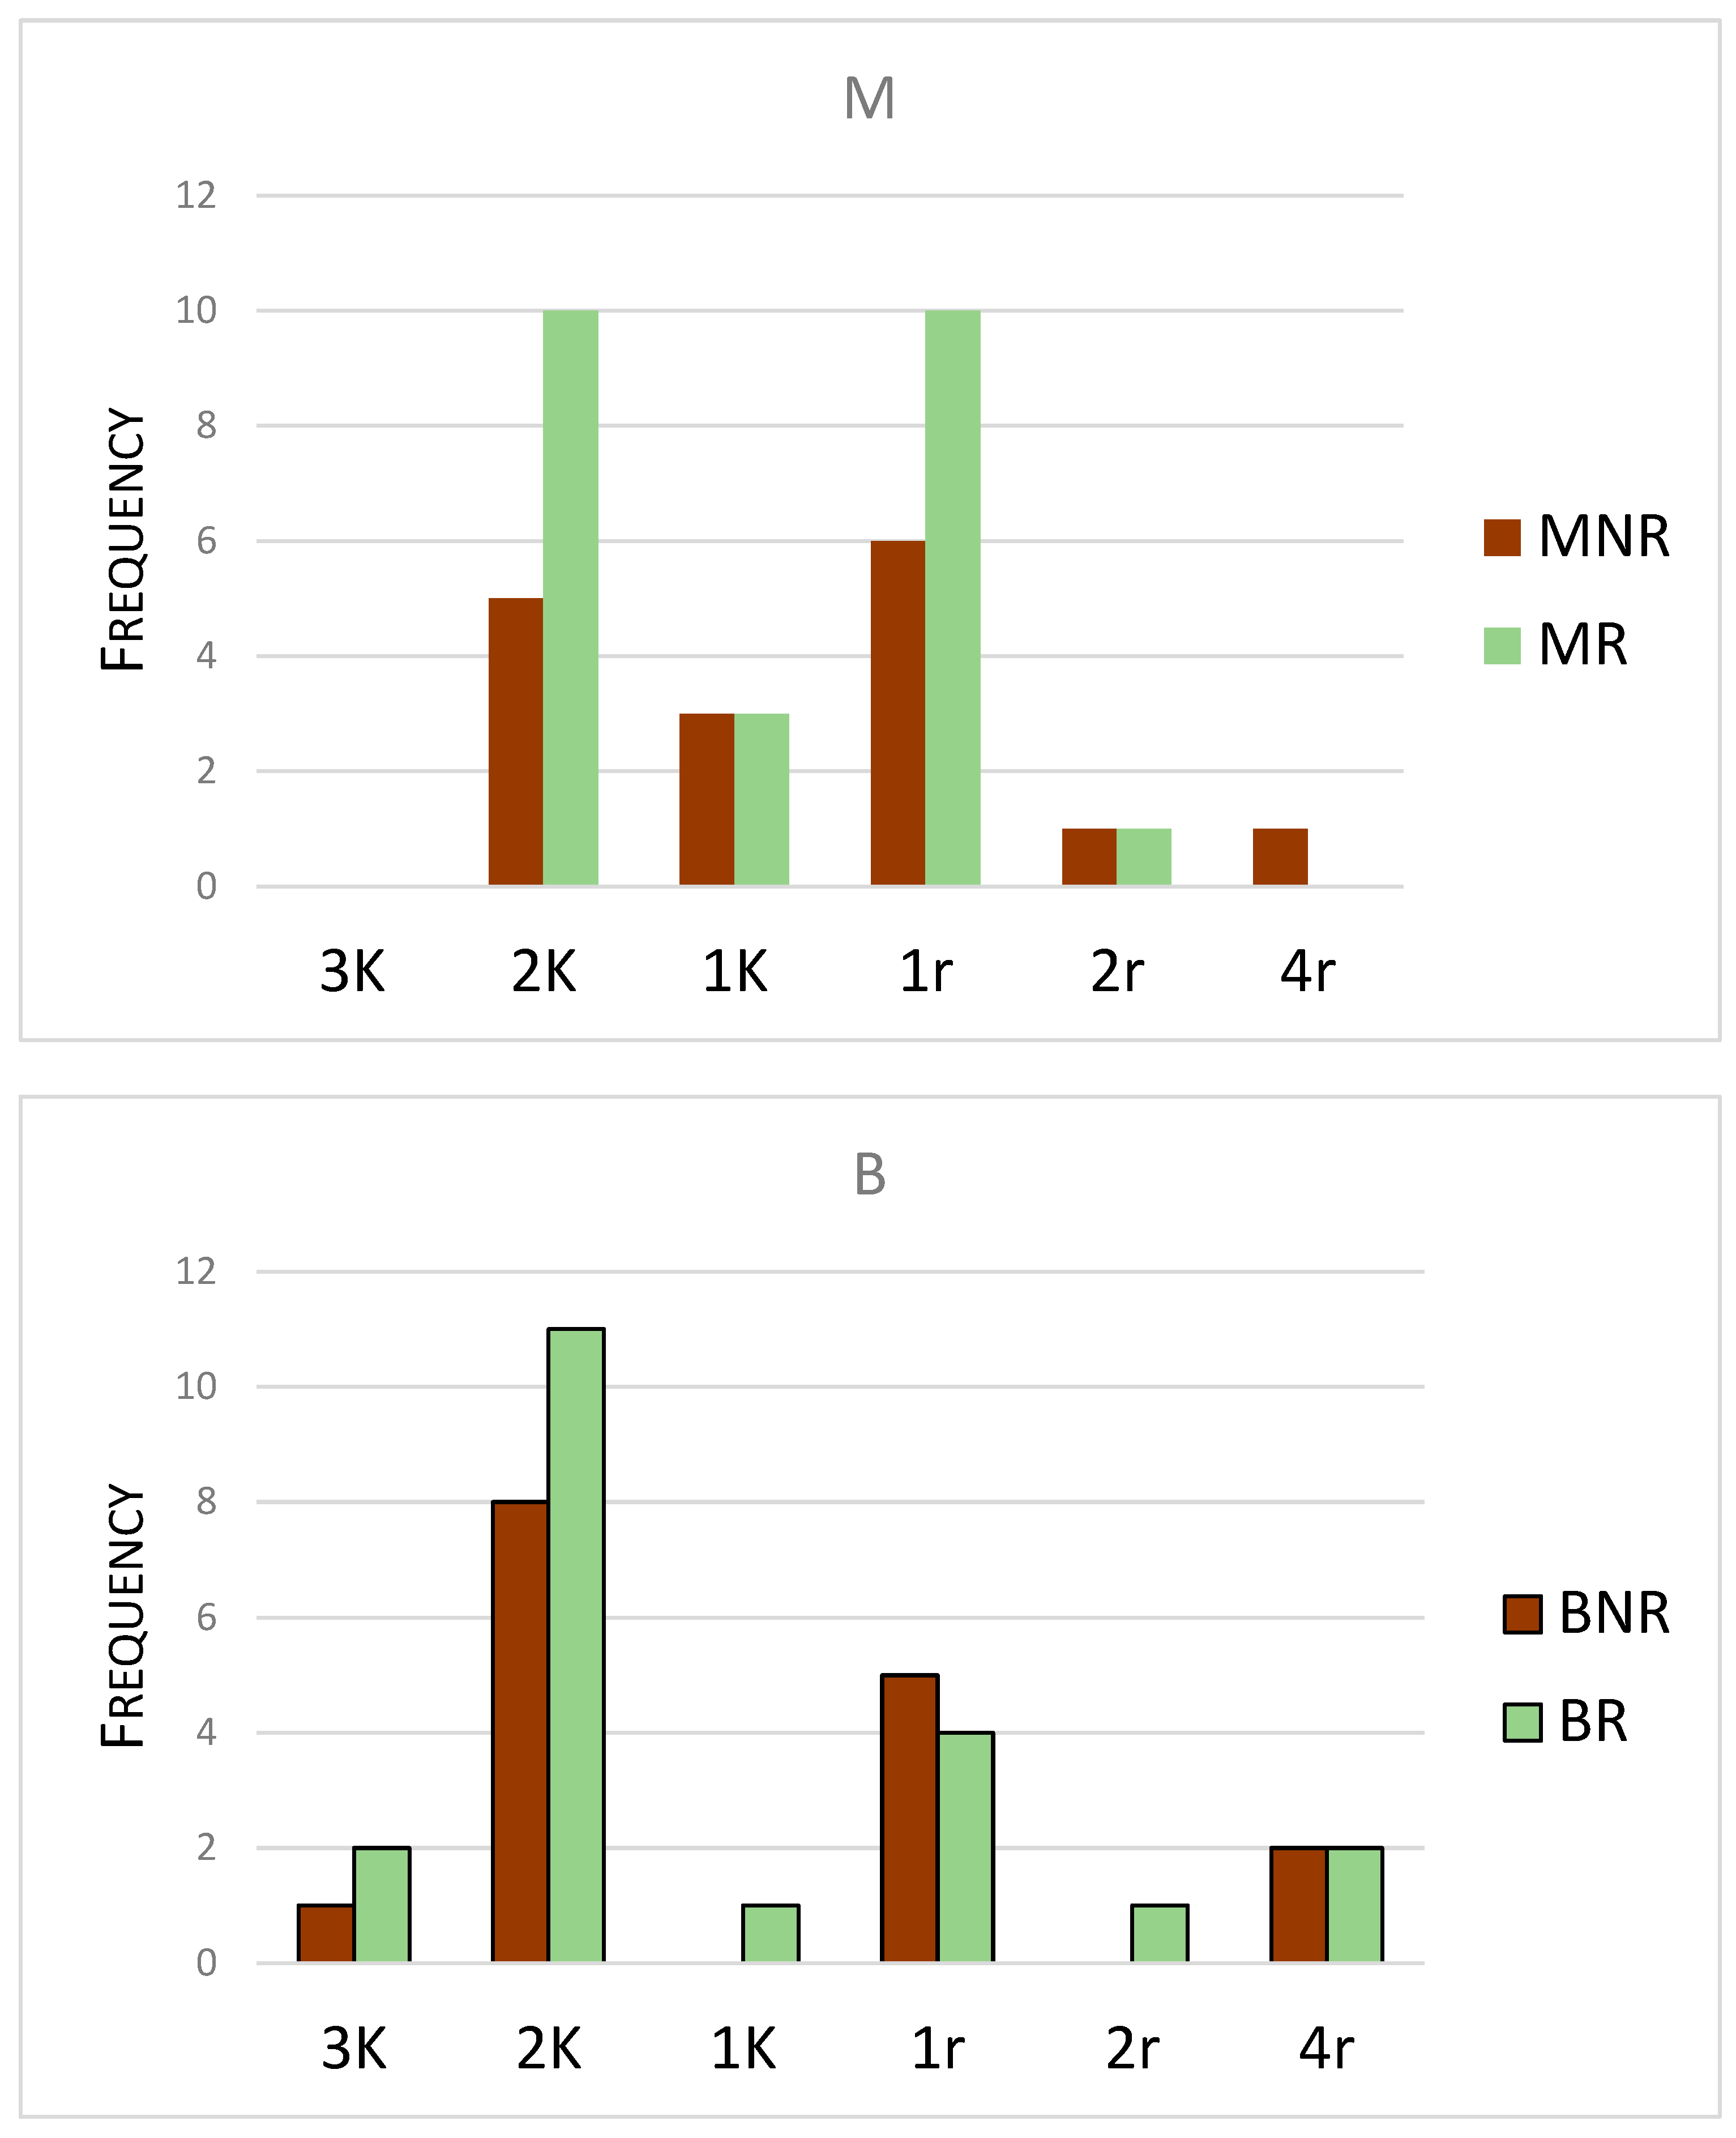
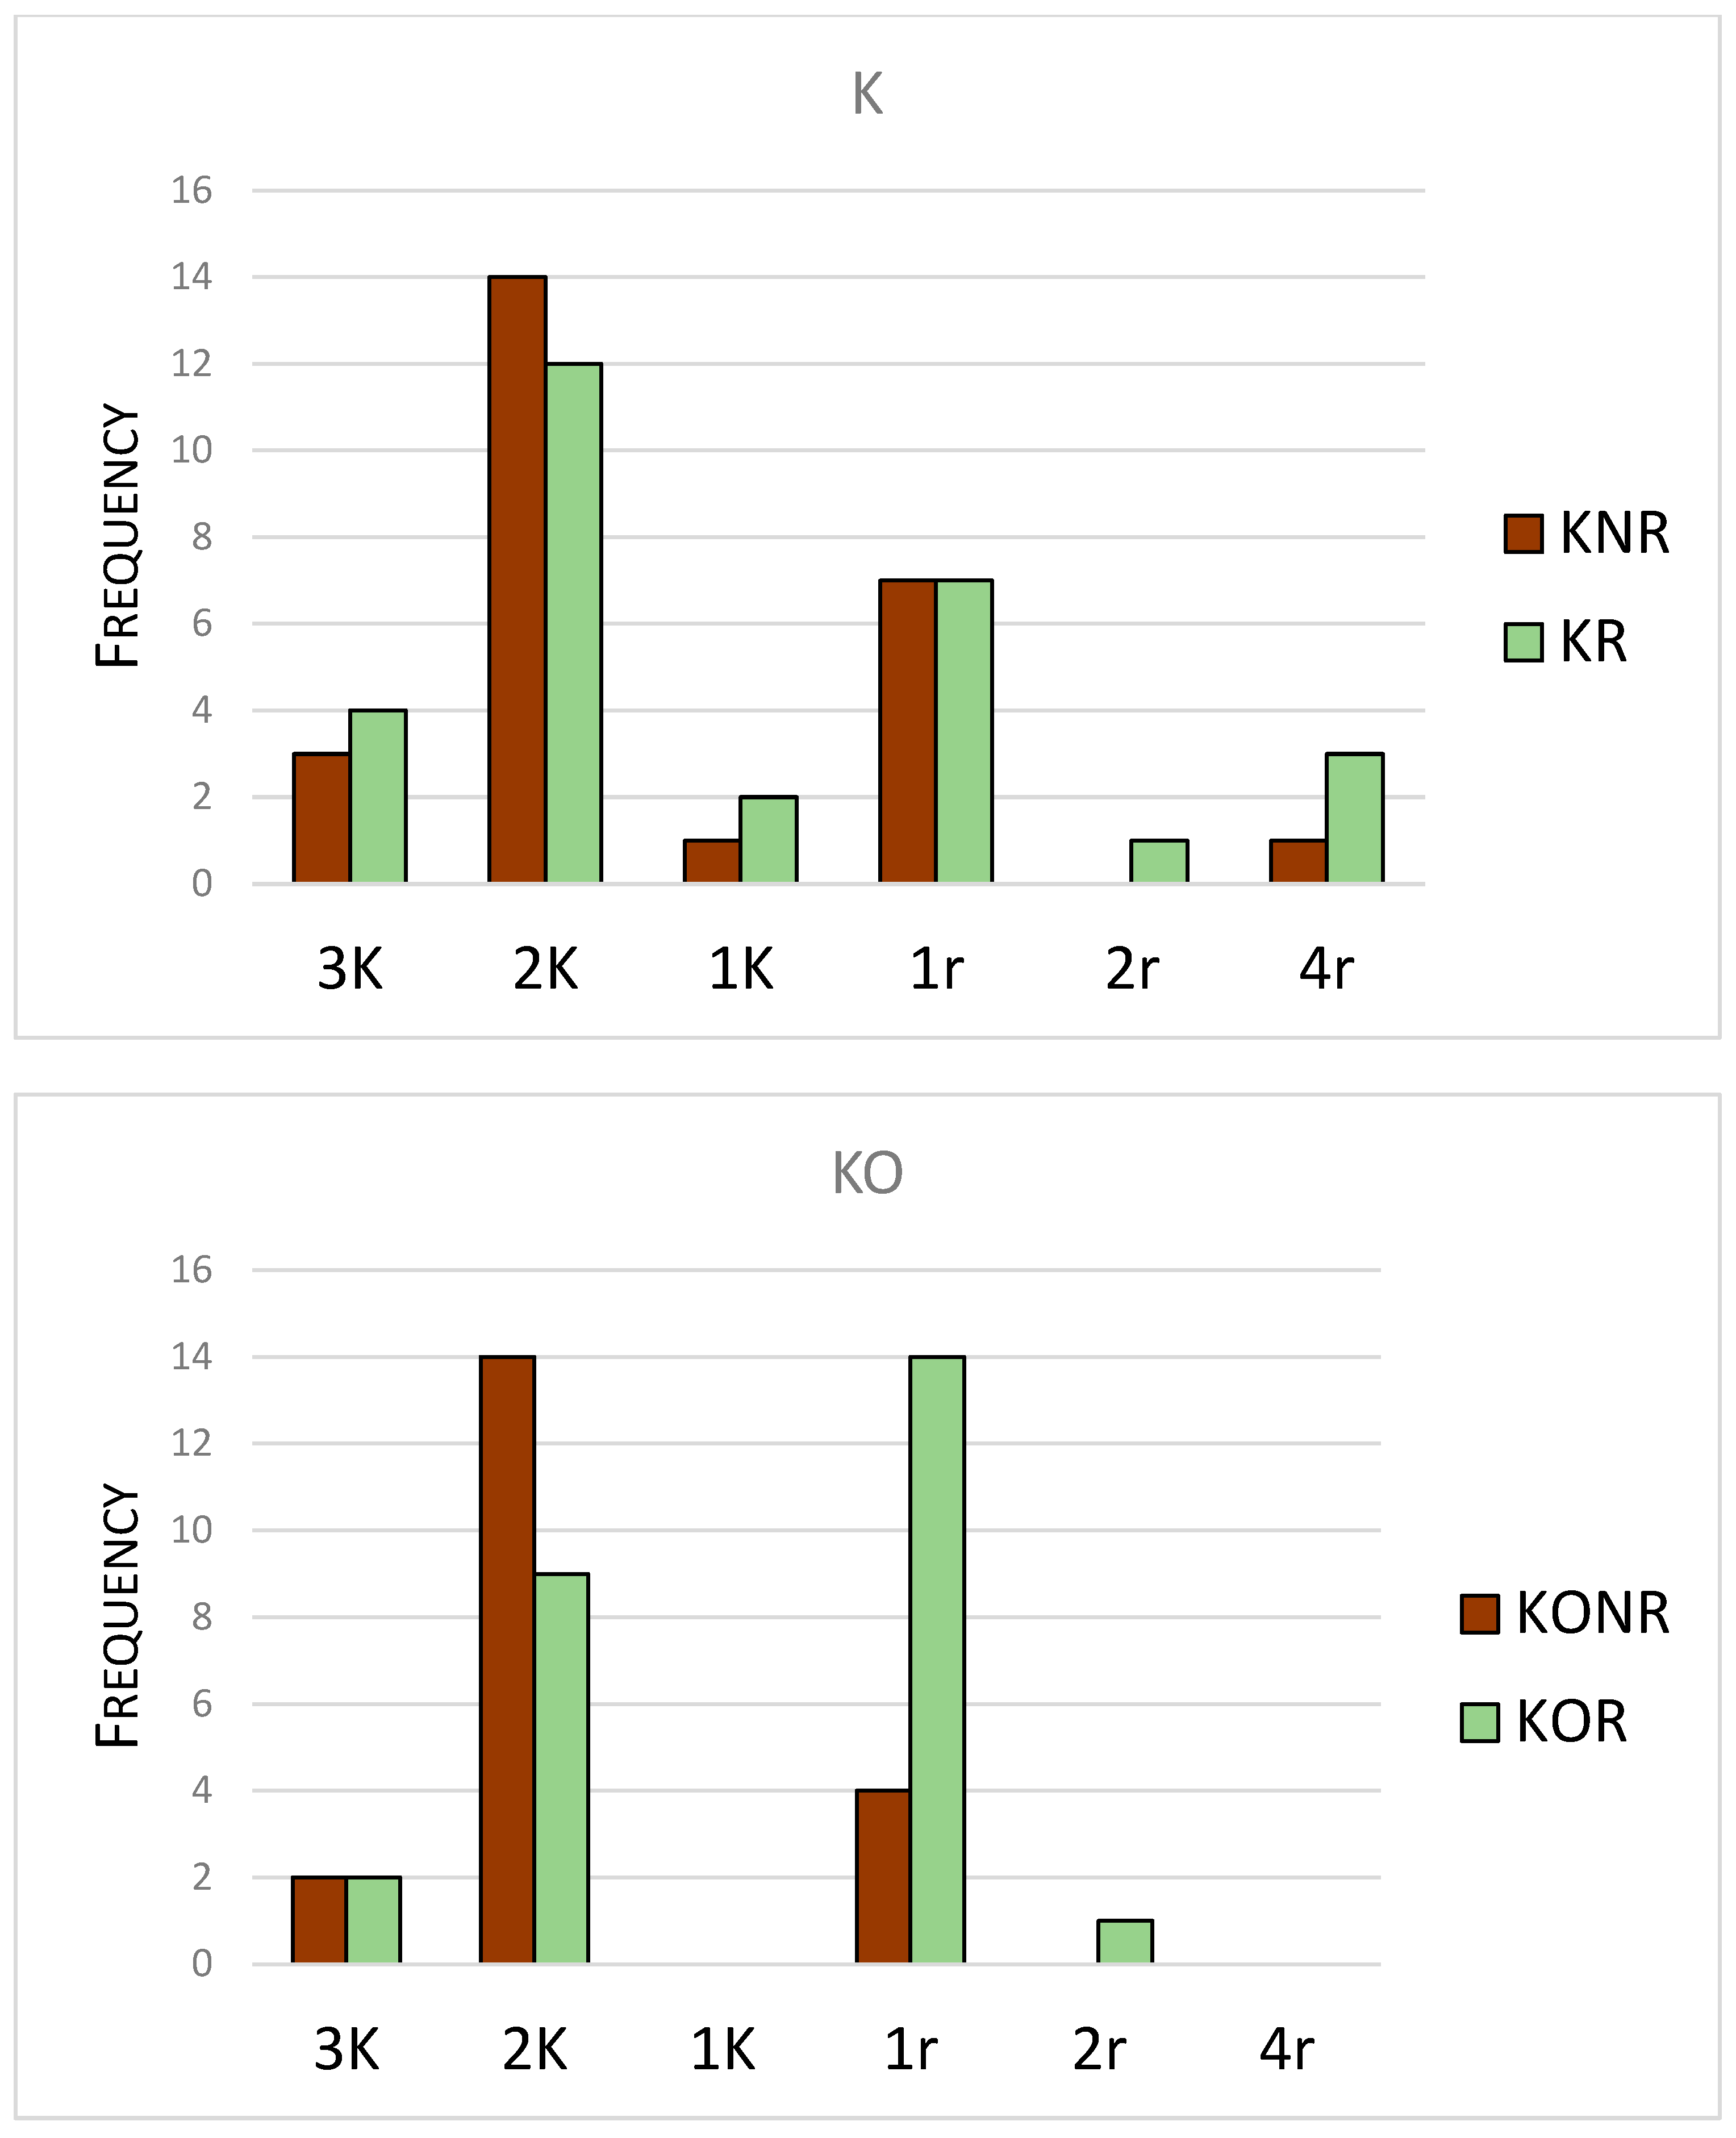
3.2. Predatory Mite Analysis

In total, 4190 mites were collected and classified into 44 species. The total number of species recorded differed among sampling sites and zones. The number of species was higher in the rhizosphere zone at the highly polluted sites (M and B) and the moderately polluted sites (K). At the control site (KO), the number of species was higher in the non-rhizosphere zone (Table 5). Both the site and zone of sampling significantly impacted the variation in numerical abundance values. The species accumulation plot (Figure 2) shows the appropriate sampling protocol. This provided reliable information on the diversity of the sampled taxa and allowed the maturity index value to be calculated correctly. The rhizosphere zone maturity index values were similar at all the studied sites. In the non-rhizosphere zone, MI values increased with the decrease in the degree of soil contamination. At the moderately polluted sites (K) and unpolluted sites (KO), MI values were higher in the non-rhizosphere zone than in the rhizosphere zone, and they took the highest values there (Table 3). Approximately 9% of the species in the sample could not receive r- or K-values, as Ruf did not classify their families [10]. The frequency of the life history classes shows a large diversity within the studied sites and the rhizosphere and non-rhizosphere soil. Although most locations had species from every life cycle class, the majority of the species in the rhizospheric and non-rhizospheric zones were categorised as 2K and 2r. At the site with the highest degree of contamination (M site), r-strategists accounted for 50% in both zones and at the uncontaminated site, 57% in the rhizosphere zone, and 20% in the non-rhizosphere zone (Figure 3). The regression model showed statistically significant differences in the influence of the studied parameters on the stability and quality of soil expressed by the maturity index depending on the degree of the heavy metal contamination of the soil. Organic matter content and soil pH significantly influence the MI value in the non-rhizosphere zone. Still, the heavy metals studied substantially affect the index value in sites with high contamination. In the rhizosphere zone, we observe a differentiated influence of the studied parameters depending on the degree of soil contamination (Table 6).

4. Discussion

The main objective of our study was to determine the effect of the Vaccinium myrtillus rhizosphere on the stability of predatory soil mite communities at sites with different soil contamination. We assumed that the rhizosphere zone of blueberry would be preferred by predatory mites regardless of the degree of soil contamination.
To achieve the objective and test the hypothesis, we selected sites for the study with different levels of heavy metal contamination in the soil directly related to the presence or absence of industrial activity in these areas and various levels of anthropopressure. This research is part of a multi-year series of biomonitoring studies conducted by our research team in heavily industrialised areas. Very high concentrations of the investigated heavy metals were found in the soils of Miasteczko Ślaskie (site M) and Bukowno (site B). In both locations, there are industrial plants specialising in the production of products mainly containing Cd, Zn and Pb, causing the concentrations of these elements in this area to exceed the permissible values specified by The Regulation of Environment Minister [37], which are, respectively, 3 mg kg−1, 300 mg kg−1 and 100 mg kg−1. In Miasteczko Ślaskie, the permissible levels of these three elements were exceeded in both the rhizospheric and non-rhizospheric zones, while in Bukowno, the allowable level of Cd concentration was exceeded only in the non-rhizospheric zone. The permissible concentrations of other elements were exceeded in both zones at this site. These results were consistent with our previous studies [3].
Compared to the background values and the control site, the mean concentrations of the investigated heavy metals were well above the European environmental background values, indicating that Miasteczko Śląskie (site M) and Bukowno (site B) are heavily polluted. It was also found that in Miasteczko Śląskie, concentrations of metals were higher in the rhizospheric zone than outside it. These differences were statistically significant. Cu was the only element with a higher concentration in the rhizosphere at all sites. This element is present in most products from the zinc smelter in Miasteczko Ślaskie and the ZGH “Boleslaw” mining and smelting complex in Bukowno. The contamination of these sites with the elements studied indicates that they originate from anthropogenic sources, such as metal smelting and processing activities. Such conclusions were also reached by ref. [6], who studied the concentrations of Cu, Zn, Pb, and Cd in forest soil.
At sites with high contamination levels, the PLI and the PERI values indicate high ecological risks in the non-rhizosphere zone. However, ecological risks are much higher in the rhizosphere zone at the M site, with high soil contamination. These results were similar to our previous studies in the same or similar areas and indicate that the relevant levels of heavy metal contamination come from local industries [5]. Other studies also contain similar conclusions, e.g., ref. [38]. According to Liu et al. [6], there was a significant negative correlation between the Acari community characteristics (species richness, individual abundance) and the pollution levels and heavy metal concentrations measured by the PERI. Additionally, they discovered that the characteristics of the Acari mite community were more reliant on soil pollution with Cu and Zn than with Pb and Cd, and these effects were most noticeable in forests.
Many authors [39,40,41,42,43] have found that land use practices are the primary distinguishing factor, followed by pH and C/N ratio, which appear to be crucial elements in the soil fauna. Our research supports this conclusion but indicates that these parameters significantly impact the MI value in the non-rhizosphere zone. In contrast, the mite community in the rhizosphere zone is mainly shaped by the soil’s concentration of Ni, Cd, Pb, and C. Our study also showed that at most sites, the concentrations of Cu (four sites) and Cd and Zn (three sites) were higher in the rhizosphere soil, significantly affecting the studied properties of the mite predatory communities. Studies suggest low soil Cu concentrations stimulate mite reproduction (hormesis) [44]. Furthermore, it was discovered that the diversity of mite species and the quantity of copper in the soil were positively correlated [6].
Our previous studies have shown that on sites with medium and low soil contamination, i.e., K and KO sites, both heavy metal bioavailability and enzymatic activity were higher in the rhizosphere of blueberry than outside it. In contrast, the site with the highest contamination (M) in the rhizosphere soil showed a higher accumulation of heavy metals, but their bioavailability was lower than at the other localizations. Furthermore, in the rhizosphere zone, stronger correlations were found between parameters such as pH, OM, macronutrient content, soil enzyme activity, and heavy metal concentration [3]. The results indicate that in the case of low environmental stress caused by pollution, the intensity of the rhizosphere zone processes inhibits its colonisation by predatory mites. In the case of high soil contamination, the rhizosphere zone significantly mitigates the impact of pollution on soil biological activity.
Our study showed the statistically significant effect of both the site and the sampling zone on the abundance and biodiversity of mite species. As the level of pollution decreased, the value of these indicators increased. However, when comparing the MI values obtained for the two zones, it was found that the rhizosphere is only preferred by K-strategists under conditions of high soil contamination with heavy metals. In this zone, the values obtained for this indicator were similar (B 67 > M 66 > K 64 > KO 60). This may indicate that soil contamination does not affect mite communities as much in this zone. Beyond the rhizosphere, we found a greater variation in MI values (M 52 > B 59 > K 78 > KO 89), and the values were in line with our expectations. As the degree of contamination and the PERI value decreased, the MI value increased, and in two sites (K and KO), values close to 1 were obtained. This allows us to conclude that these study sites are stable, ecologically mature habitats. Such results were obtained by ref. [13] for old-growth forests, where the influence of harmful human activities was not recorded for a longer period of time. The mites’ qualitative and quantitative predictors are deteriorated by pollution [45]. Many authors have reported that mite response was related to the severity of industrial pollution. A progressive reduction in numbers and species has been demonstrated from least- to most-polluted sites [3,39,43,46]. Low MI values (0.60–0.67) were observed at all surveyed sites in the rhizosphere. Reference [13] states that such matters are observed for habitats in which the stages of succession have regressed. Equally low values were recorded in ref. [10], which indicated the influence of the “humus gradient” on the values obtained. Comparing the MI values in samples taken inside and outside the rhizosphere of blueberry revealed more differences. The rhizosphere zone on sites with a high degree of soil contamination indicates greater stability of predatory mite groupings than the non-rhizosphere zone. In contrast, the rhizosphere zone showed significantly lower stability on sites classified as moderately polluted and unpolluted. The result is unique worldwide and indicates the need for further research.
Our results indicate that we cannot unequivocally confirm our hypothesis by analysing the effect of the rhizosphere on the abundance, the number of species, and the life history of predatory mites. The observed influence of the rhizosphere on the predatory mite community is probably due to the overlapping effects of many processes and interactions between plants, soil, and soil organisms, as well as the degree of the heavy metal contamination of the soil and their mobility and bioavailability. In addition, the combined activity of bacterial and fungal microorganisms characteristic of the rhizosphere may have a direct or indirect inhibitory effect on the mite fauna [47,48]. Comparing the results obtained with literature data and previous studies, we note that the MI is a more sensitive indicator of differences in heavy metal contaminated soil quality than other indicators based on a broader group of soil microarthropods such as QBS (the Soil Biological Quality Index) [9,49] or FAI (Abundance-based Fauna Index) [12]. Studies indicate that the use of a wider group of microarthropods in bioindication studies yields more general but unequivocal results, such as a decrease in indicator values under conditions of increasing heavy metal concentration or soil degradation, also when comparing rhizosphere and non-rhizosphere zones [3,11,12,46,49]. However, the indicators listed are more straightforward tools than the MI indicator, which requires specialised knowledge and may be a limiting factor. Moreover, our research indicates that it has a high bioindicative potential, and its effectiveness should be verified in other ecosystems.
Furthermore, the presence of predatory soil mites in degraded soils of post-mining and post-industrial sites can positively influence the functionality of these ecosystems, as they demonstrate a high capacity for the colonisation of degraded areas [40]. Therefore, determining the current biodiversity is the basis for planning passive and technical reclamation activities in these areas to restore ecosystem services [50]. The maturity index, as employed in our study, and a comprehensive examination of the variables influencing the predatory mite population can effectively assist in interpreting the findings and evaluating the reclamation process’s efficacy.
We recognise that drawing firm conclusions from field studies is complicated, as the overlapping effects of many environmental factors can influence them. We would also like to highlight the difficulties we encountered in sampling, particularly from the rhizosphere zone. According to established methodology, soil that is considered rhizosphere soil is obtained by gently shaking it off the plant roots and sieving it through a sieve. This method means that the samples obtained may contain additional amounts of fine root and mycorrhizal material, which directly impacts the organic matter results obtained. However, according to the methodology, a sieve with a mesh diameter of 2 mm used to sieve the soil makes it impossible to separate the small roots and mycorrhizae from the soil. Despite these difficulties and limitations, a multi-parameter approach, such as the one presented in our study, allows us to better understand the diverse responses to environmental contaminants and the actual risks to soil organisms and plants.

5. Conclusions

Our research has shown that the Vaccinium myrtillus rhizosphere zone significantly affects the biological quality of the soil expressed by the stability of the predatory mite community. However, this impact depends on the degree of soil contamination. We found that in unpolluted or moderately polluted soil, soil mites prefer habitats with less biological activity, i.e., non-rhizosphere zones. These main results are exciting and indicate the need for further in-depth research because the diversity of soil micro-arthropods may vary at local and regional scales. We obtained these results using the maturity index, which appears to be an indicator that is more sensitive to changes in soil associated with heavy metal pollution than other indicators based on microarthropods. However, there is a need to test the effectiveness of this indicator in different ecosystems. Therefore, our study can provide a starting point for analysing the impact of rhizosphere zones, especially plant species used in the reclamation of degraded areas or planted in urban spaces. Scientific research conducted around the world has shown that the correlation of the stability of Gamasina communities and their ecological life strategy with environmental variables can be a useful biological tool for assessing the biological quality of the soil as well as for evaluating the effectiveness of actions taken to restore biodiversity, especially in areas subject to intensive industrial activity. Therefore, finding a sensitive bioindicator is essential to better understand the functioning of soil ecosystems, especially in restoring the high biological quality of degraded soils.

Author Contributions

G.B.: conceptualization, investigation, methodology, formal analysis, data curation, visualisation, and writing—original draft, review, and editing. A.N.-S.: investigation, methodology, and writing—review and editing. M.K.-C.: conceptualization, investigation, methodology, data curation, and writing—review and editing. All authors have read and agreed to the published version of the manuscript.

Funding

This research received no external funding.

Data Availability Statement

The data are available upon request from the corresponding author.

Conflicts of Interest

The authors declare no conflicts of interest.

References

  1. Mazurek, R.; Kowalska, J.; Gąsiorek, M.; Zadrożny, P.; Józefowska, A.; Zaleski, T.; Kępka, W.; Tymczuk, M.; Orłowska, K. Assessment of Heavy Metals Contamination in Surface Layers of Roztocze National Park Forest Soils (SE Poland) by Indices of Pollution. Chemosphere 2017, 168, 839–850. [Google Scholar] [CrossRef]
  2. Galli, L.; Capurro, M.; Menta, C.; Rellini, I. Is the QBS-Ar Index a Good Tool to Detect the Soil Quality in Mediterranean Areas? A Cork Tree Quercus suber L. (Fagaceae) Wood as a Case of Study. Ital. J. Zool. 2014, 81, 126–135. [Google Scholar] [CrossRef]
  3. Kandziora-Ciupa, M.; Nadgórska-Socha, A.; Barczyk, G. The Influence of Heavy Metals on Biological Soil Quality Assessments in the Vaccinium myrtillus L. Rhizosphere under Different Field Conditions. Ecotoxicology 2021, 30, 292–310. [Google Scholar] [CrossRef]
  4. Qing, X.; Yutong, Z.; Shenggao, L. Assessment of Heavy Metal Pollution and Human Health Risk in Urban Soils of Steel Industrial City (Anshan), Liaoning, Northeast China. Ecotoxicol. Environ. Saf. 2015, 120, 377–385. [Google Scholar] [CrossRef] [PubMed]
  5. Kandziora-Ciupa, M.; Gospodarek, J.; Nadgórska-Socha, A. Pollution and Ecological Risk Assessment of Heavy Metals in Forest Soils with Changes in the Leaf Traits and Membrane Integrity of Vaccinium myrtillus L. Eur. J. For. Res. 2022, 141, 409–419. [Google Scholar] [CrossRef]
  6. Liu, M.; Li, Z.; Li, S.; Liang, F.; Huang, C.; Pan, H.; Wu, J.; Liu, S.; Pu, L.; Christie, P.; et al. The Effects of Pollution by Multiple Metals Derived from Long-Term Smelting Activities on Soil Mite Communities in Arable Soils under Different Land Use Types in East China. Environ. Sci. Pollut. Res. Int. 2023, 30, 47182–47208. [Google Scholar] [CrossRef]
  7. Hakanson, L. An Ecological Risk Index for Aquatic Pollution Control. A Sedimentological Approach. Water Res. 1980, 14, 975–1001. [Google Scholar] [CrossRef]
  8. George, P.B.; Keith, A.M.; Creer, S.; Barrett, G.L.; Lebron, I.; Emmett, B.A.; Robinson, D.A.; Jones, D.L. Evaluation of Mesofauna Communities as Soil Quality Indicators in a National-Level Monitoring Programme. Soil Biol. Biochem. 2017, 115, 537–546. [Google Scholar] [CrossRef]
  9. Parisi, V.; Menta, C.; Gardi, C.; Jacomini, C.; Mozzanica, E. Microarthropod Communities as a Tool to Assess Soil Quality and Biodiversity: A New Approach in Italy. Agric. Ecosyst. Environ. 2005, 105, 323–333. [Google Scholar] [CrossRef]
  10. Ruf, A. A Maturity Index for Predatory Soil Mites (Mesostigmata: Gamasina) as an Indicator of Environmental Impacts of Pollution on Forest Soils. Appl. Soil Ecol. 1998, 9, 447–452. [Google Scholar] [CrossRef]
  11. Madej, G.; Kozub, M. Possibilities of Using Soil Microarthropods, with Emphasis on Mites (Arachnida, Acari, Mesostigmata), in Assessment of Successional Stages in a Reclaimed Coal Mine Dump (Pszów, S Poland). Biol. Lett. 2014, 51, 19–36. [Google Scholar] [CrossRef]
  12. Yan, S.; Singh, A.N.; Fu, S.; Liao, C.; Wang, S.; Li, Y.; Cui, Y.; Hu, L. A Soil Fauna Index for Assessing Soil Quality. Soil Biol. Biochem. 2012, 47, 158–165. [Google Scholar] [CrossRef]
  13. Čoja, T.; Bruckner, A. The Maturity Index Applied to Soil Gamasine Mites from Five Natural Forests in Austria. Appl. Soil Ecol. 2006, 34, 1–9. [Google Scholar] [CrossRef]
  14. Ruf, A.; Beck, L. The Use of Predatory Soil Mites in Ecological Soil Classification and Assessment Concepts, with Perspectives for Oribatid Mites. Ecotoxicol. Environ. Saf. 2005, 62, 290–299. [Google Scholar] [CrossRef]
  15. Mróz, L.; Demczuk, M. Contents of Phenolics and Chemical Elements in Bilberry (Vaccinium myrtillus L.) Leaves from Copper Smelter Area (SW Poland). Pol. J. Ecol. 2010, 58, 475–486. [Google Scholar]
  16. Bonkowski, M.; Villenave, C.; Griffiths, B. Rhizosphere Fauna: The Functional and Structural Diversity of Intimate Interactions of Soil Fauna with Plant Roots. Plant Soil 2009, 321, 213–233. [Google Scholar] [CrossRef]
  17. Xiao, S.; You, H.; You, W.; Liu, J.; Cai, C.; Wu, J.; Ji, Z.; Zhan, S.; Hu, Z.; Zhang, Z.; et al. Rhizosphere and Bulk Soil Enzyme Activities in a Nothotsuga Longibracteata Forest in the Tianbaoyan National Nature Reserve, Fujian Province, China. J. For. Res. 2017, 28, 521–528. [Google Scholar] [CrossRef]
  18. Baudoin, E.; Benizri, E.; Guckert, A. Impact of Growth Stage on the Bacterial Community Structure along Maize Roots, as Determined by Metabolic and Genetic Fingerprinting. Appl. Soil Ecol. 2002, 19, 135–145. [Google Scholar] [CrossRef]
  19. Garcia, C.; Roldan, A.; Hernandez, T. Ability of Different Plant Species to Promote Microbiological Processes in Semiarid Soil. Geoderma 2005, 124, 193–202. [Google Scholar] [CrossRef]
  20. Ge, Y.; Zhang, C.; Jiang, Y.; Yue, C.; Jiang, Q.; Min, H.; Fan, H.; Zeng, Q.; Chang, J. Soil Microbial Abundances and Enzyme Activities in Different Rhizospheres in an Integrated Vertical Flow Constructed Wetland. CLEAN Soil Air Water 2011, 39, 206–211. [Google Scholar] [CrossRef]
  21. Manu, M. The Influence of Some Environmental Factors on the Species Diversity of the Predator Mites (Acari: Mesostigmata) from Natural Forest Ecosystems of Bucegi Massif (Romania). Trav. Du Muséum Natl. D’histoire Nat. Grigore Antipa 2011, 54, 9–20. [Google Scholar] [CrossRef]
  22. Ugland, K.I.; Gray, J.S.; Ellingsen, K.E. The Species—Accumulation Curve and Estimation of Species Richness. J. Anim. Ecol. 2003, 72, 888–897. [Google Scholar] [CrossRef]
  23. Crossley Jr, D.A.; Blair, J.M. A High-Efficiency, “Low-Technology” Tullgren-Type Extractor for Soil Microarthropods. Agric. Ecosyst. Environ. 1991, 34, 187–192. [Google Scholar] [CrossRef]
  24. Manu, M.; Onete, M.; Băncilă, R.I. The Effect of Heavy Metals on Mite Communities (Acari: Gamasina) from Urban Parks-Bucharest, Romania. Environ. Eng. Manag. J. EEMJ 2018, 17, 2071–2081. [Google Scholar] [CrossRef]
  25. Błaszak, C. Zerconidae (Acari, Mesostigmata) Polski; Państwowe Wydawnictwo Naukowe Warszawa: Warszawa, Poland, 1974. [Google Scholar]
  26. Ghilyarov, M.S.; Bregetova, N.G. A Key to the Soil-Inhabiting Mites (Mesostigmata); Zoological Institute, USSR Academy of Sciences: Leningrad, Russia, 1977. (In Russian) [Google Scholar]
  27. Gwiazdowicz, D.J. Ascid Mites (Acari, Mesostigmata) from Selected Forest Ecosystems and Microhabitats in Poland.; Wydawnictwo Akademii Rolniczej im. Augusta Cieszkowskiego: Poznań, Poland, 2007. [Google Scholar]
  28. Karg, W. Cohors Gamasina Leach, Raubmilben; Fischer: Frankfurt am Main, Germany, 1993. [Google Scholar]
  29. Micherdziński, W. Die Familie Parasitidae Oudemans 1901 (Acarina, Mesostigmata); Państwowe Wydawnictwo Naukowe Warszawa: Warszawa, Poland, 1969. [Google Scholar]
  30. Ostrowska, A.; Gawliński, S.; Szczubiałka, Z. Methods of Analysis and Evaluation of Soil Properties and Plant–Catalogue; Institute of Environmental Protection: Warsaw, Poland, 1991. [Google Scholar]
  31. Rutkowski, P.; Diatta, J.; Konatowska, M.; Andrzejewska, A.; Tyburski, Ł.; Przybylski, P. Geochemical Referencing of Natural Forest Contamination in Poland. Forests 2020, 11, 157. [Google Scholar] [CrossRef]
  32. Yang, J.; Yang, F.; Yang, Y.; Xing, G.; Deng, C.; Shen, Y.; Luo, L.; Li, B.; Yuan, H. A Proposal of “Core Enzyme” Bioindicator in Long-Term Pb-Zn Ore Pollution Areas Based on Topsoil Property Analysis. Environ. Pollut. 2016, 213, 760–769. [Google Scholar] [CrossRef]
  33. Fang, L.; Liu, Y.; Tian, H.; Chen, H.; Wang, Y.; Huang, M. Proper Land Use for Heavy Metal-Polluted Soil Based on Enzyme Activity Analysis around a Pb-Zn Mine in Feng County, China. Environ. Sci. Pollut. Res. 2017, 24, 28152–28164. [Google Scholar] [CrossRef] [PubMed]
  34. Bhuiyan, M.A.; Parvez, L.; Islam, M.A.; Dampare, S.B.; Suzuki, S. Heavy Metal Pollution of Coal Mine-Affected Agricultural Soils in the Northern Part of Bangladesh. J. Hazard. Mater. 2010, 173, 384–392. [Google Scholar] [CrossRef]
  35. Islam, S.; Ahmed, K.; Masunaga, S. Potential Ecological Risk of Hazardous Elements in Different Land-Use Urban Soils of Bangladesh. Sci. Total Environ. 2015, 512, 94–102. [Google Scholar] [CrossRef]
  36. Kolawole, T.O.; Olatunji, A.S.; Jimoh, M.T.; Fajemila, O.T. Heavy Metal Contamination and Ecological Risk Assessment in Soils and Sediments of an Industrial Area in Southwestern Nigeria. J. Health Pollut. 2018, 8, 180906. [Google Scholar] [CrossRef]
  37. Regulation on Soil Quality Standards. | UNEP Law and Environment Assistance Platform. Available online: https://leap.unep.org/en/countries/pl/national-legislation/regulation-soil-quality-standards (accessed on 18 October 2024).
  38. Mehmood, K.; Ahmad, H.R.; Abbas, R.; Saifullah; Murtaza, G. Heavy Metals in Urban and Peri-Urban Soils of a Heavily-Populated and Industrialized City: Assessment of Ecological Risks and Human Health Repercussions. Hum. Ecol. Risk Assess. Int. J. 2020, 26, 1705–1722. [Google Scholar] [CrossRef]
  39. Manu, M.; Iordache, V.; Băncilă, R.I.; Bodescu, F.; Onete, M. The Influence of Environmental Variables on Soil Mite Communities (Acari: Mesostigmata) from Overgrazed Grassland Ecosystems—Romania. Ital. J. Zool. 2016, 83, 89–97. [Google Scholar] [CrossRef]
  40. Manu, M.; Băncilă, R.I.; Bîrsan, C.C.; Mountford, O.; Onete, M. Soil Mite Communities (Acari: Mesostigmata) as Indicators of Urban Ecosystems in Bucharest, Romania. Sci. Rep. 2021, 11, 3794. [Google Scholar] [CrossRef]
  41. Ruf, A.; Beck, L.; Dreher, P.; Hund-Rinke, K.; Römbke, J.; Spelda, J. A Biological Classification Concept for the Assessment of Soil Quality: “Biological Soil Classification Scheme” (BBSK). Agric. Ecosyst. Environ. 2003, 98, 263–271. [Google Scholar] [CrossRef]
  42. Wissuwa, J.; Salamon, J.-A.; Frank, T. Effects of Habitat Age and Plant Species on Predatory Mites (Acari, Mesostigmata) in Grassy Arable Fallows in Eastern Austria. Soil Biol. Biochem. 2012, 50, 96–107. [Google Scholar] [CrossRef] [PubMed]
  43. Woźniak, G.; Kamczyc, J.; Bierza, W.; Błońska, A.; Kompała-Bąba, A.; Sierka, E.; Jagodziński, A.M. Functional Ecosystem Parameters: Soil Respiration and Diversity of Mite (Acari, Mesostigmata) Communities after Disturbance in a Late Cambrian Bedrock Environment. Land Degrad. Dev. 2022, 33, 3343–3357. [Google Scholar] [CrossRef]
  44. Skubała, P.; Kafel, A. Oribatid Mite Communities and Metal Bioaccumulation in Oribatid Species (Acari, Oribatida) along the Heavy Metal Gradient in Forest Ecosystems. Environ. Pollut. 2004, 132, 51–60. [Google Scholar] [CrossRef] [PubMed]
  45. Rusek, J.; Marshall, V.G. Impacts of Airborne Pollutants on Soil Fauna. Annu. Rev. Ecol. Syst. 2000, 31, 395–423. [Google Scholar] [CrossRef]
  46. Santorufo, L.; Van Gestel, C.A.M.; Rocco, A.; Maisto, G. Soil Invertebrates as Bioindicators of Urban Soil Quality. Environ. Pollut. 2012, 161, 57–63. [Google Scholar] [CrossRef]
  47. Bora, P.; Gogoi, S.; Deshpande, M.V.; Garg, P.; Bhuyan, R.P.; Altaf, N.; Saha, N.; Borah, S.M.; Phukon, M.; Tanti, N.; et al. Rhizospheric Bacillus Spp. Exhibit Miticidal Efficacy against Oligonychus coffeae (Acari: Tetranychidae) of Tea. Microorganisms 2023, 11, 2691. [Google Scholar] [CrossRef]
  48. Hosseini, A.; Hosseini, M.; Schausberger, P. Plant Growth-Promoting Rhizobacteria Enhance Defense of Strawberry Plants Against Spider Mites. Front. Plant Sci. 2022, 12, 783578. [Google Scholar] [CrossRef]
  49. Menta, C.; Conti, F.D.; Pinto, S.; Bodini, A. Soil Biological Quality Index (QBS-Ar): 15 Years of Application at Global Scale. Ecol. Indic. 2018, 85, 773–780. [Google Scholar] [CrossRef]
  50. Prach, K.; Tolvanen, A. How Can We Restore Biodiversity and Ecosystem Services in Mining and Industrial Sites? Environ. Sci. Pollut. Res. 2016, 23, 13587–13590. [Google Scholar] [CrossRef]
Figure 1. Map of sampling locations with the administrative division of the provinces: Kokotek—KO; Miasteczko Śląskie—M; Bukowno—B; Katowice–Kostuchna—K.
Forests 15 02245 g001
Figure 2. Plot of species accumulation. MNR—Miasteczko Śląskie non-rhizosphere, BNR—Bukowno, non-rhizosphere KNR—Katowice–Kostuchna, non-rhizosphere, KONR—Kokotek, non-rhizosphere, MR—Miasteczko Śląskie, rhizosphere, BR—Bukowno, rhizosphere KR—Katowice–Kostuchna, rhizosphere, KOR—Kokotek, rhizosphere.
Forests 15 02245 g002
Figure 3. Frequency distribution of life history classes of soil mites in sampling sites. K- and r-values are assigned to Gamasina soil mite taxa; see Table 1.
Forests 15 02245 g003aForests 15 02245 g003b
Table 1. K- and r-values assigned to predatory gamasine soil mite taxa [10,13].
TaxonKr
Eviphidae (Alliphis) 4
Ascidae 1
Digamasellidae 2
Laelapidae 1
Pachylaelapidae1
Parasitidae 4
Pergamasidae2
Phytoseiidae 2
Rhodacaridae2
Veigaiidae2
Zerconidae3
Hypoaspididae 1
Table 2. Grades of the pollution load index (PLI) [4], ecological risk index (EIR), and potential ecological risk index (PERI) [31].
PLIPLI GradeERI ValueEIR Grade of Single MetalGrade SymbolPERI ValueEnvironmental PERI Grade
PLI < 1Unpolluted
(U)
ERI < 40low ecological riskLPERI < 150low ecological risk
(L)
1 ≤ PLI < 2unpolluted to moderately polluted
(UM)
40 ≤ ERI < 80moderate ecological riskM150 ≤ PERI < 300moderate ecological risk
(M)
2 ≤ PLIr < 3moderately polluted
(M)
80 ≤ ERI< 160 considerable ecological riskC300 ≤ PERI < 600high ecological risk
(H)
3 ≤ PLI < 4moderately to highly polluted
(MH)
160 ≤ ERI < 320high ecological riskHPERI ≥ 600very high ecological risk (VH)
4 ≤ PLI < 5highly polluted
(H)
ERI ≥ 320very high ecological riskVH
PLI ≥ 5very highly polluted
(VH)
Table 3. Physicochemical properties of soil samples (mean ± SD, n = 3) and results of F-test and the effect sizes (ŋ2) of two-way ANOVA. The different letters denote significant differences between sampling sites, and the different numbers denote significant differences between sampling sites and rhizosphere (R) or non-rhizosphere soils (NR). * Statistical significance (p < 0.05). Data were partly taken from ref. [3].
SamplepHOM%Ntotal%Ctotal%C/N Ratio
MNR4.65 ± 0.08 d,59.00 ± 2.89 c,10.26 ± 0.06 b,15.56 ± 1.24 b,121.48 ± 0.8 a,1
R5.23 ± 0.19 d,317.65 ± 1.8 c,10.5 ± 0.04 b,1,29.58 ± 0.7 b,1,219.26 ± 0.62 a,3
BNR5.14 ± 0.13 c,319.1 ± 5.59 b,10.41 ± 0.13 a,1,29.62 ± 3.16 a,1,223.35 ± 0.34 c,1
R4.28 ± 0.15 c,457.05 ± 8.84 b,20.8 ± 0.18 a,322.68 ± 4.75 a,328.28 ± 0.2 c,2
KNR4.00 ± 0.24 b,217.55 ± 0.75 a,10.47 ± 0.11 a,1,29.85 ± 2.27 a,1,2,421.16 ± 1.23 b,1
R3.98 ± 0.06 b,243.25 ± 5.03 a,30.92 ± 0.05 a,321.62 ± 1.09 a,3,423.52 ± 0.25 b,1
KONR3.65 ± 0.11 a,117.85 ± 10.84 a,11.17 ± 0.58 a,1,2,330.75 ± 15.15 a,2,3,426.21 ± 1.73 d,2
R3.56 ± 0.09 a,157.85 ± 12.51 a,20.85 ± 0.15 a,2,324.77 ± 4.44 a,329.24 ± 0.54 d,2
SiteF/ŋ2224.99 */0.94 *34.63 */0.72 *7.01 */0.34 *10.94 */0.45 *164.19 */0.92 *
SphereF/ŋ25.2 */0.12 *202.2 */0.83 *25.64 */0.39 *28.29 */0.41 *12.59 */0.24 *
Site ∗ sphereF/ŋ250.9 */0.79 *13.31 */0.50 *2.23/0.143.3 */0.20 *34.4 */0.72 *
M—Miasteczko Śląskie; B—Bukowno; K—Katowice–Kostuchna; KO—Kokotek; OM—organic matter.
Table 4. Concentrations of selected metals (mg kg−1; mean ± SD, n = 3) and classification of soil samples and results of F-test and the effect sizes (ŋ2) of two-way ANOVA. Different letters denote significant differences between sampling sites, and different numbers denote significant differences between sampling sites and rhizosphere (R) or non-rhizosphere (NR) soils. * Statistical significance (p < 0.05). Data were partly taken from ref. [3].
SiteSphereCdCuZnPbNiPERIGRADEPLIGRADE
MNR8.32 ± 2.64 c,214.61 ± 3.15 c,3480.27 ± 180.26 c,2619.38 ± 62.27 c,31.35 ± 0.27 b,1,2709.60VH6VH
R31.03 ± 3.75 c,349.24 ± 7.39 c,51552.29 ± 298.03 c,31576.67 ± 278.89 c,42.86 ± 0.24 b,4,52116.02VH18VH
BNR6.55 ± 1.33 b,213.31 ± 4.13 b,2,3621.6 ± 119.01 b,2333.54 ± 61.67 b,22.93 ± 0.58 b,5452.34H6VH
R3.01 ± 0.46 b,124.2 ± 7.60 b,4459.11 ± 64.13 b,2204.79 ± 29.49 b,1,21.95 ± 0.32 b,2,3263.84Mo5H
KNR0.21 ± 0.11 a,17.08 ± 2.00 a,1,2,335.35 ± 13.53 a,184.23 ± 24.47 a,12.39 ± 0.69 b,3,4,574.29L1UM
R0.39 ± 0.09 a,17.46 ± 1.32 a,1,2,340.85 ± 7.31 a,162.99 ± 11.15 a,12.12 ± 0.41 b,2,3,464.96L1UM
KONR0.07 ± 0.08 a,13.18 ± 0.76 a,123.1 ± 12.93 a,151.45 ± 27.44 a,10.97 ± 0.44 a,143.95L0.1U
R0.41 ± 0.09 a,15.49 ± 2.31 a,1,236.23 ± 5.63 a,136.75 ± 10.46 a,10.92 ± 0.25 a,144.43L0.1U
SiteF/ŋ2352.98 */0.96 *616.85 */0.88 *152.53 */0.92 *267.26 */0.95 *29.94 */0.69 *
SphereF/ŋ2101.15 */0.72 *100.26 */0.70 *36.91 */0.48 *42.88 */0.52 *0.16/0.00
Site ∗
sphere
F/ŋ2150.02 */0.92 *39.35 */0.75 *54.87 */0.80 *70.67 */0.84 *18.03 */0.57 *
PLI—pollution load index; U—unpolluted (PLI < 1); UM—unpolluted to moderately polluted (1 ≤ PLI ≤ 2); Mo—moderately polluted (2 ≤ PLIr ≤ 3); H—highly polluted (4 ≤ PLI ≤ 5); VH—very highly polluted (PLI > 5). M—Miasteczko Śląskie; B—Bukowno; K—Katowice–Kostuchna; KO—Kokotek.
Table 5. Number of species, mean abundance of Gamasina, and results of F-test and the effect sizes (ŋ2) of two-way ANOVA (only Abundance) and MI. Different letters denote significant differences between sampling sites, and different numbers denote significant differences between sampling sites and rhizosphere (R) or non-rhizosphere soils (NR). * Statistical significance (p < 0.05).
SampleAbundanceNumber of SpeciesMI
MNR12.27 ± 11.33 a,1140.52
R31 ± 16.92 a,1200.66
BNR17.64 ± 23.63 a,1120.59
R33.91 ± 19.53 a,1170.67
KNR48.64 ± 68.9 a,1220.78
R54.18 ± 35.97 a,1270.64
KONR61.64 ± 48.71 b,2150.89
R115.18 ± 58.77 b,2140.60
SiteF/ŋ211.76 */0.60 *
SphereF/ŋ28.34 */0.31 *
Site ∗ sphereF/ŋ21.4/0.09 *
M—Miasteczko Śląskie; B—Bukowno; K—Katowice–Kostuchna; KO—Kokotek.
Table 6. Regression models for MI in rhizosphere (R) or non-rhizosphere (NR) soils in sites with varying contamination levels. * Statistical significance (p < 0.05).
EquationR2Fp
NR very highly polluted sites (M and B)
MI = 0.35 * − 0.05 Pb + 0.28 Ni * − 0.29 Cd * + 0.42 pH * + 0.32 OM * − 0.09 C/N Ratio1.00321.050.00
NR unpolluted to moderately polluted sites (K and KO)
MI = 0.09 + 1.02 C/N Ratio * + 0.38 OM *0.8937.880.00
R very highly to highly polluted sites (M and B)
MI = 0.63 * + 0.57 C/N Ratio * + 0.05 Pb − 0.12 Ni * + 0.46 OM * + 0.37 pH * − 0.38 Cd * + 0.11 Cu *1.004394.670.00
R unpolluted to moderately polluted sites (K and KO)
MI = 0.67 * − 0.49 C/N Ratio − 0.015 OM + 0.14 Cu − 0.14 Cd * + 0.17 pH + 0.18 Ni1.00317.420.00
Disclaimer/Publisher’s Note: The statements, opinions and data contained in all publications are solely those of the individual author(s) and contributor(s) and not of MDPI and/or the editor(s). MDPI and/or the editor(s) disclaim responsibility for any injury to people or property resulting from any ideas, methods, instructions or products referred to in the content.

