Article

Assessing Forest Resources with Terrestrial and Backpack LiDAR: A Case Study on Leaf-On and Leaf-Off Conditions in Gari Mountain, Hongcheon, Republic of Korea

1
Division of Forest Management Research, National Institute of Forest Science, Seoul 02455, Republic of Korea
2
Forestland Policy Research Center, Korea Forest Conservation Association, Daejeon 35262, Republic of Korea
*
Author to whom correspondence should be addressed.
Forests 2024, 15(12), 2230; https://doi.org/10.3390/f15122230
Submission received: 27 October 2024 / Revised: 22 November 2024 / Accepted: 16 December 2024 / Published: 18 December 2024
(This article belongs to the Section Forest Inventory, Modeling and Remote Sensing)

Abstract

:
In Republic of Korea, the digital transformation of forest data has emerged as a critical priority at the governmental level. To support this effort, numerous case studies have been conducted to collect and analyze forest data. This study evaluated the accuracy of forest resource assessment methods using terrestrial laser scanning (TLS) and backpack personal laser scanning (BPLS) under Leaf-on and Leaf-off conditions in the Gari Mountain Forest Management Complex, Hongcheon, Republic of Korea. The research was conducted across six sample plots representing low, medium, and high stand densities, dominated by Larix kaempferi and Pinus koraiensis. Conventional field survey methods and LiDAR technologies were used to compare key forest attributes such as tree height and volume. The results revealed that Leaf-off LiDAR data exhibited higher accuracy in capturing tree height and canopy structures, particularly in high-density plots. In contrast, during the Leaf-on season, measurements of understory vegetation and lower canopy were hindered by foliage obstruction, reducing precision. Seasonal differences significantly impacted LiDAR measurement accuracy, with Leaf-off data providing a clearer and more reliable representation of forest structures. This study underscores the necessity of considering seasonal conditions to improve the accuracy of LiDAR-derived metrics. It offers valuable insights for enhancing forest inventory practices and advancing the application of remote sensing technologies in forest management.

1. Introduction

To efficiently manage and cultivate forests, forest resource surveys have been conducted globally to collect fundamental data for decision-making in forest management. The primary objectives of forest management are to produce high-quality timber, maintain ecosystems, protect against natural disasters, manage water resources, and support recreation and healing. Forest management also plays a crucial public role in improving cultural conditions for human life, and therefore, rational forest management must aim to maximize these functions [1]. Traditional forest resource survey methods, such as calipers and diameter tapes, require workers to manually measure the attributes and volume of every tree within the sample plots. As a result, these methods are time-consuming and labor-intensive, making them inefficient for surveying large forest areas [2,3].
Traditional field survey methods introduce various sources of error. For instance, different tools or surveyors measuring the same tree may lead to discrepancies. Additionally, the top of a tree is often obscured by the canopy, leading to inaccurate height measurements [4,5]. These surveys are influenced by factors such as stand density, slope, and surveyor skill level.
As an alternative, remote sensing-based laser scanning (LS) technology has gained significant global attention, helping to improve efficiency. Additionally, LS technology is environmentally friendly because it does not damage the forest, making it an ideal tool for forest monitoring while also addressing concerns about forest destruction [3,6,7,8,9,10,11].
Light detection and ranging (LiDAR) provides 3D point clouds comprising millions of points for a target of interest. Collecting 3D structural information is essential for digital forest resource surveys [12]. Airborne laser scanners (ALS) and terrestrial laser scanners (TLS) are primarily used in forests. For large-scale forest surveys, it is reasonable to use ALS or UAV LiDAR. However, distinguishing individual tree crowns is challenging, and obtaining ground-level data, such as diameter at breast height (DBH) and understory vegetation, which are critical for forest surveys, has many limitations. In contrast, TLS can obtain higher-density point clouds than ALS. Since the early 2000s, studies on the applicability of TLS for forest monitoring have been actively conducted [13,14].
TLS can accurately capture data on tree trunks from the ground to the top of the canopy. However, one of the main issues with TLS is the occlusion effect, in which the target tree cannot be fully measured owing to obstructions from surrounding trees. Occlusion refers to parts of the trunk, branches, or leaves that are blocked by objects in front of them, thereby preventing them from being scanned. According to previous studies, 10%–32% of trees within a sample plot are obstructed by other trees and thus cannot be scanned from the center of the plot [15,16,17].
Recently, mobile laser scanning (MLS) has been used to overcome the limitations of TLS. MLS can be attached to vehicles or drones, or used in personal laser scanning (PLS), where the user moves while scanning. PLS includes handheld laser scanning (HMLS) and personal backpack laser scanning (BPLS). PLS was introduced in 2013, with early equipment weighing approximately 30 kg, making it difficult to operate and move within forests [18]. Over time, the equipment has become lighter and more portable, with backpack versions used for forest surveys since 2014 [3,7,8,19,20,21,22].
BPLS offers higher detection efficiency than traditional field surveys and addresses the limitations of TLS, such as mobility and data registration accuracy. However, previous studies using TLS and BPLS have primarily focused on urban forests and parks, where there is no slope or location that allows for verification of the accuracy of the equipment in measuring DBH and detection rates [7,23,24,25]. In particular, there is a lack of research comparing the LiDAR data accuracy under both Leaf-On and Leaf-Off conditions in combination with varying stand densities.
This study aimed to explore the effects of shooting seasons and stand density on forest variable measurements using TLS and BPLS. The study site, representative of South Korean forests, is characterized by extremely steep slopes and high stand densities, where timber harvesting and other forest management activities are conducted. The accuracy of LiDAR measurements was statistically validated by categorizing the shooting seasons into growing and non-growing periods. Additionally, detection rates and measurement accuracies of forest variables, such as diameter at breast height (DBH) and tree height, were analyzed in sample plots classified by low, medium, and high stand densities. Conducted as a case study in the Gari Mountain Leading Forest Management Complex, Republic of Korea, this research proposes methodologies for utilizing LiDAR in future digital forest surveys.

2. Materials and Methods
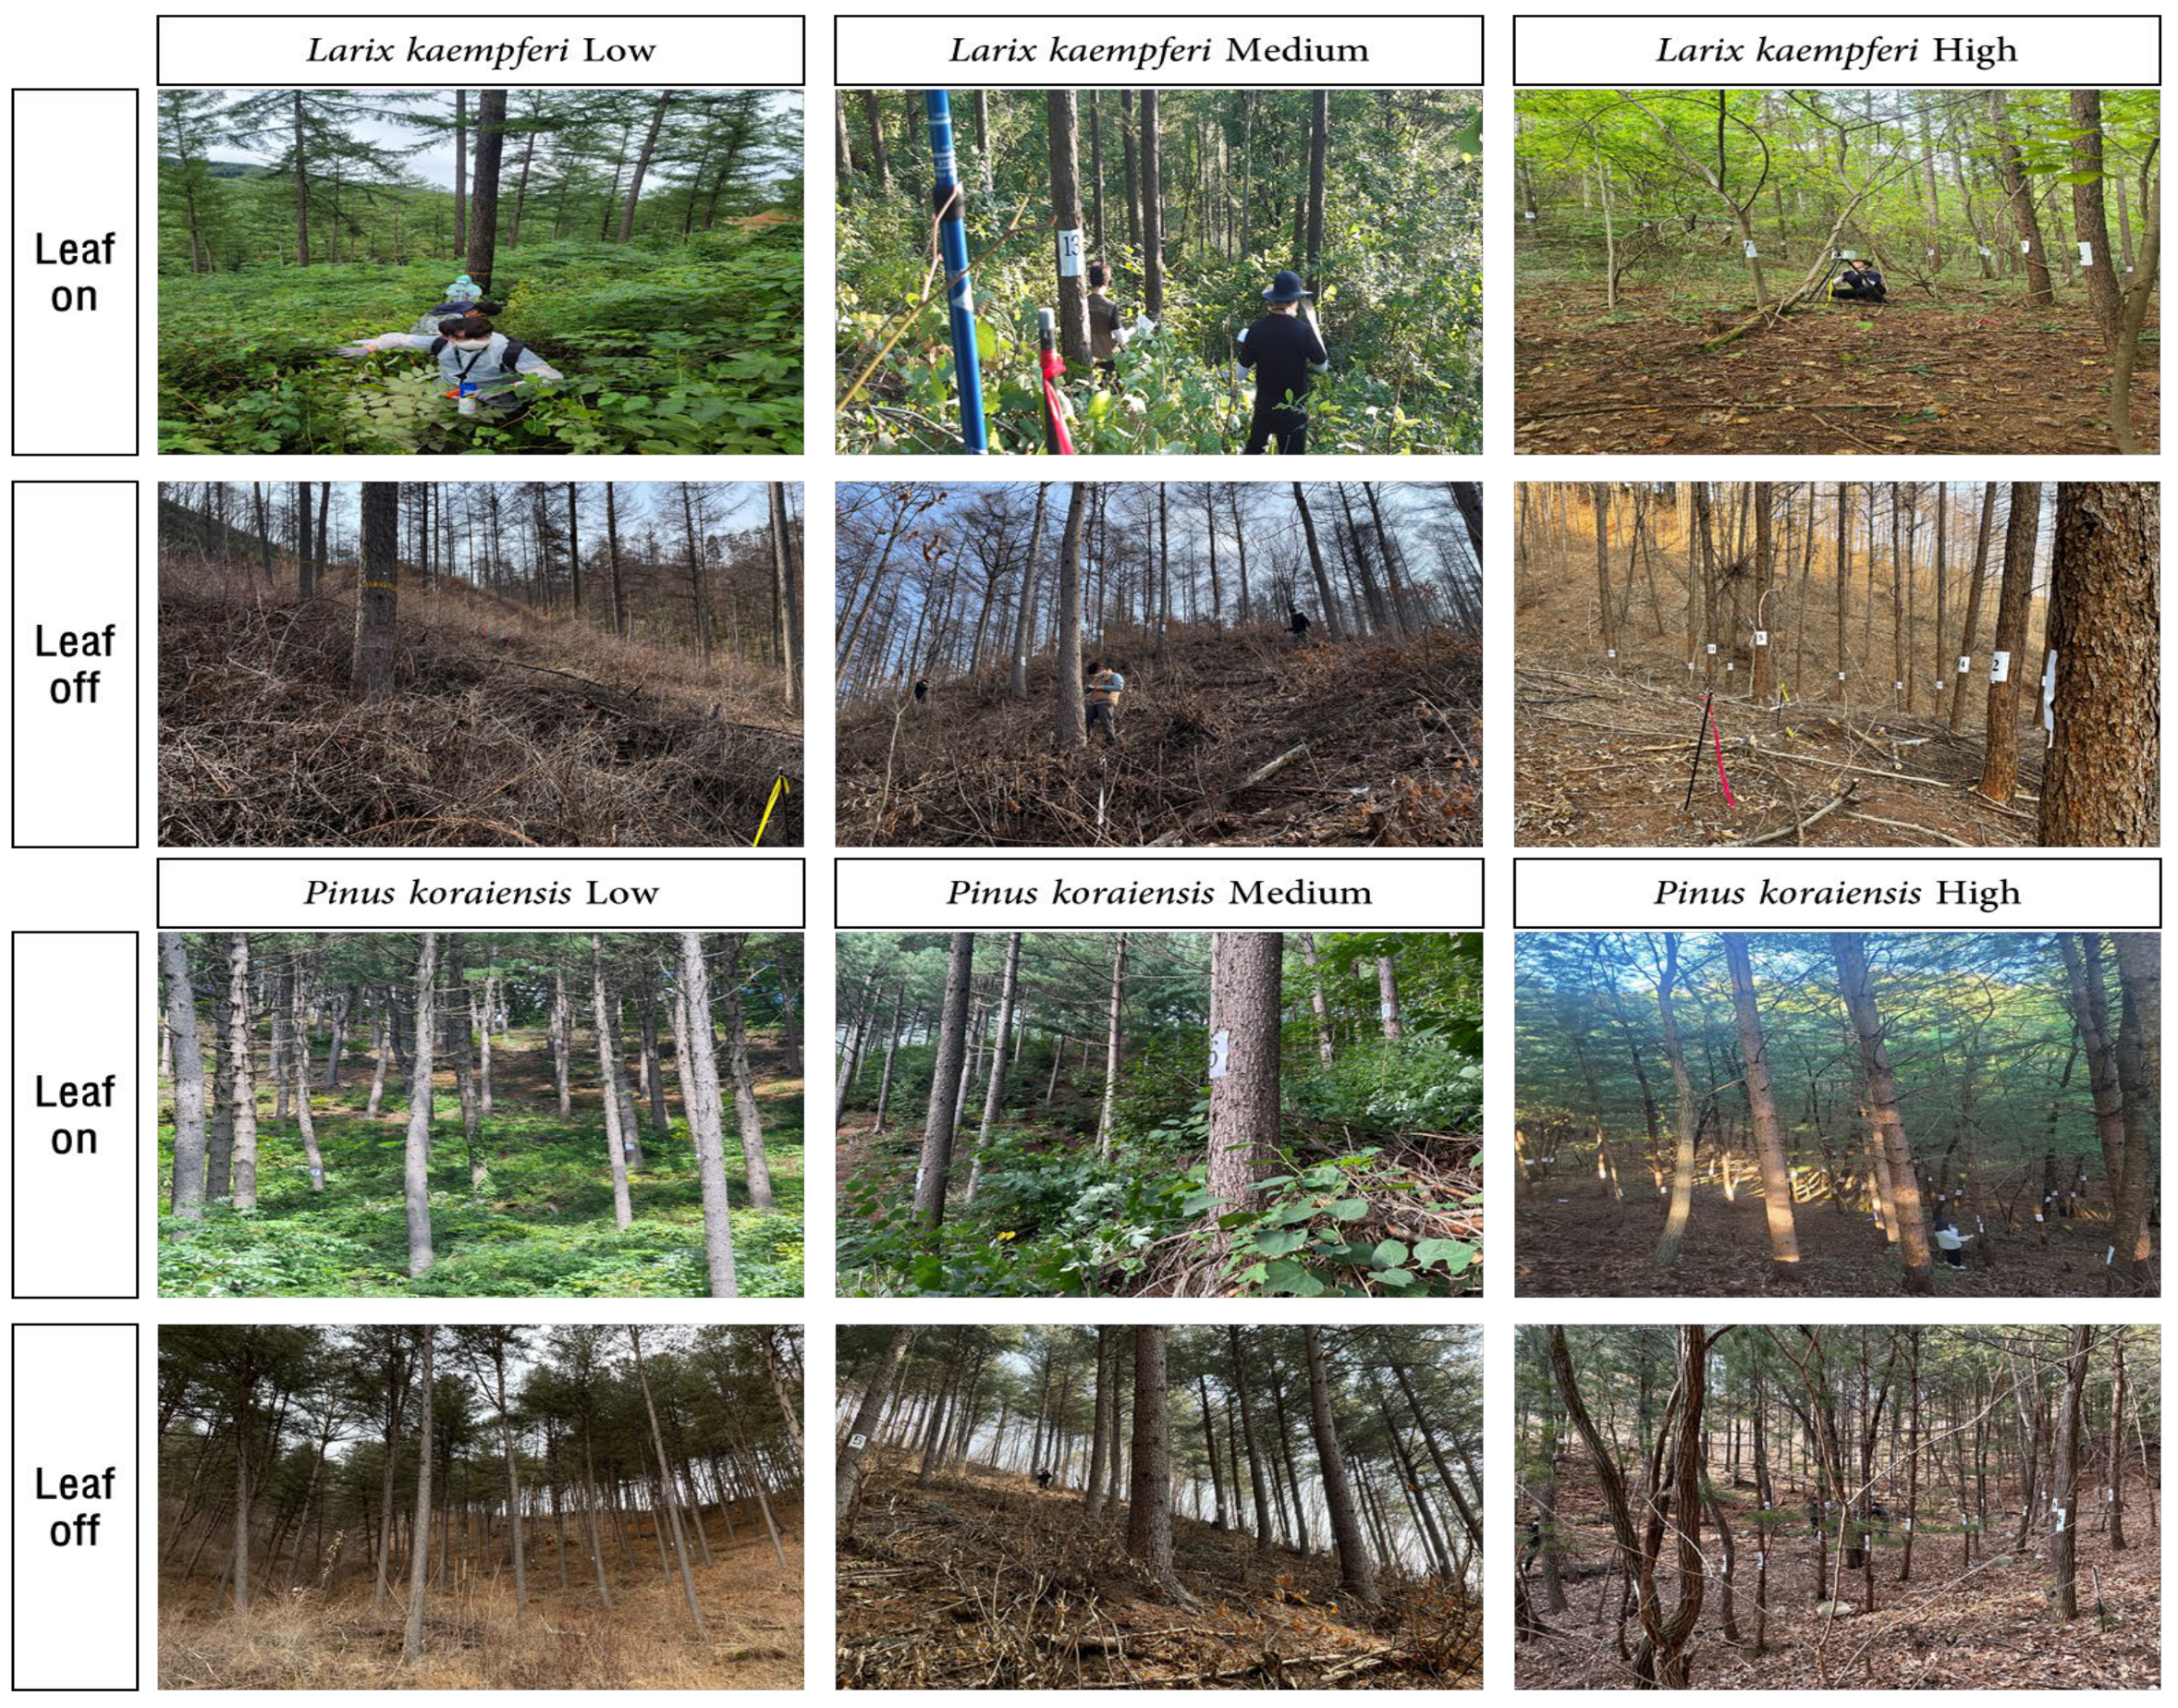
2.1. Study Area

This study focused on the Gari Mountain Forest Management Complex, located in Hongcheon-gun, Gangwon Province, Republic of Korea (37°49′49″ N, 127°58′1″ E) (Table 1). The study site was established as a circular sample plot with a radius of 16 m (approximately 0.08 ha), which was consistent with the National Forest Inventory (NFI) sample plot size in Republic of Korea. This sample plot was selected because of its representativeness of the typical forest conditions in the region, allowing for meaningful comparison and analysis.
The datasets used in this study include field-based forest survey data and LiDAR-based indirect survey data, including TLS and BPLS. To assess the accuracy of the LiDAR data collected during the growing (August 2021) and dormant (March 2022) seasons, data were collected independently for each period (Figure 1). The target tree species were the principal coniferous species in Republic of Korea: Larix kaempferi and Pinus koraiensis. Six sample plots were selected based on species and stand density (low, medium, and high) to assess the differences in measurement outcomes according to stand density (Figure 2).

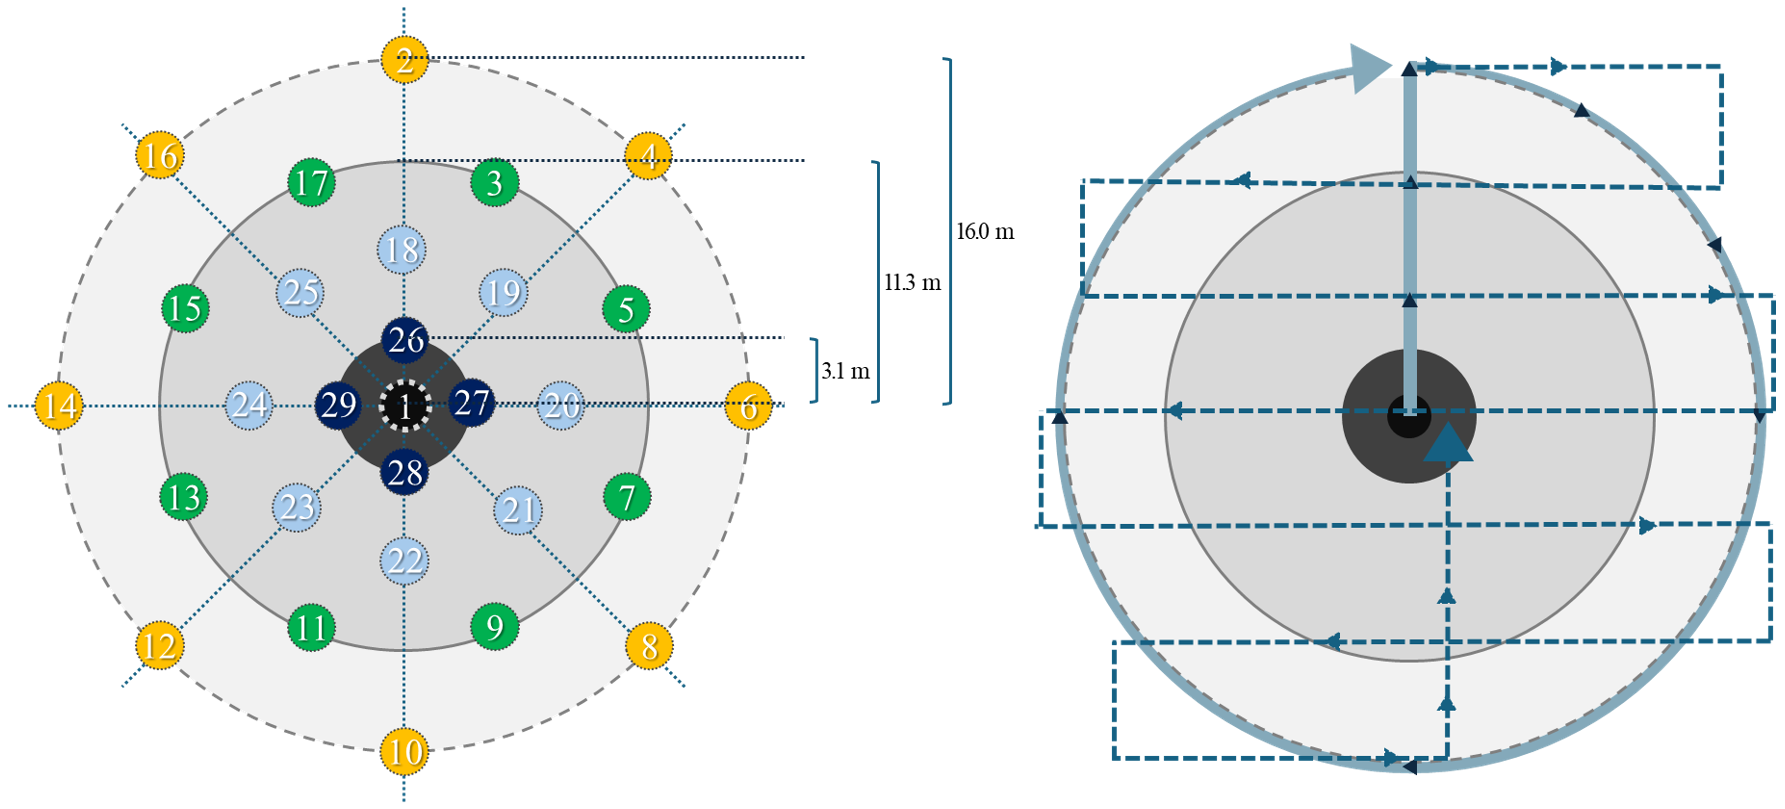
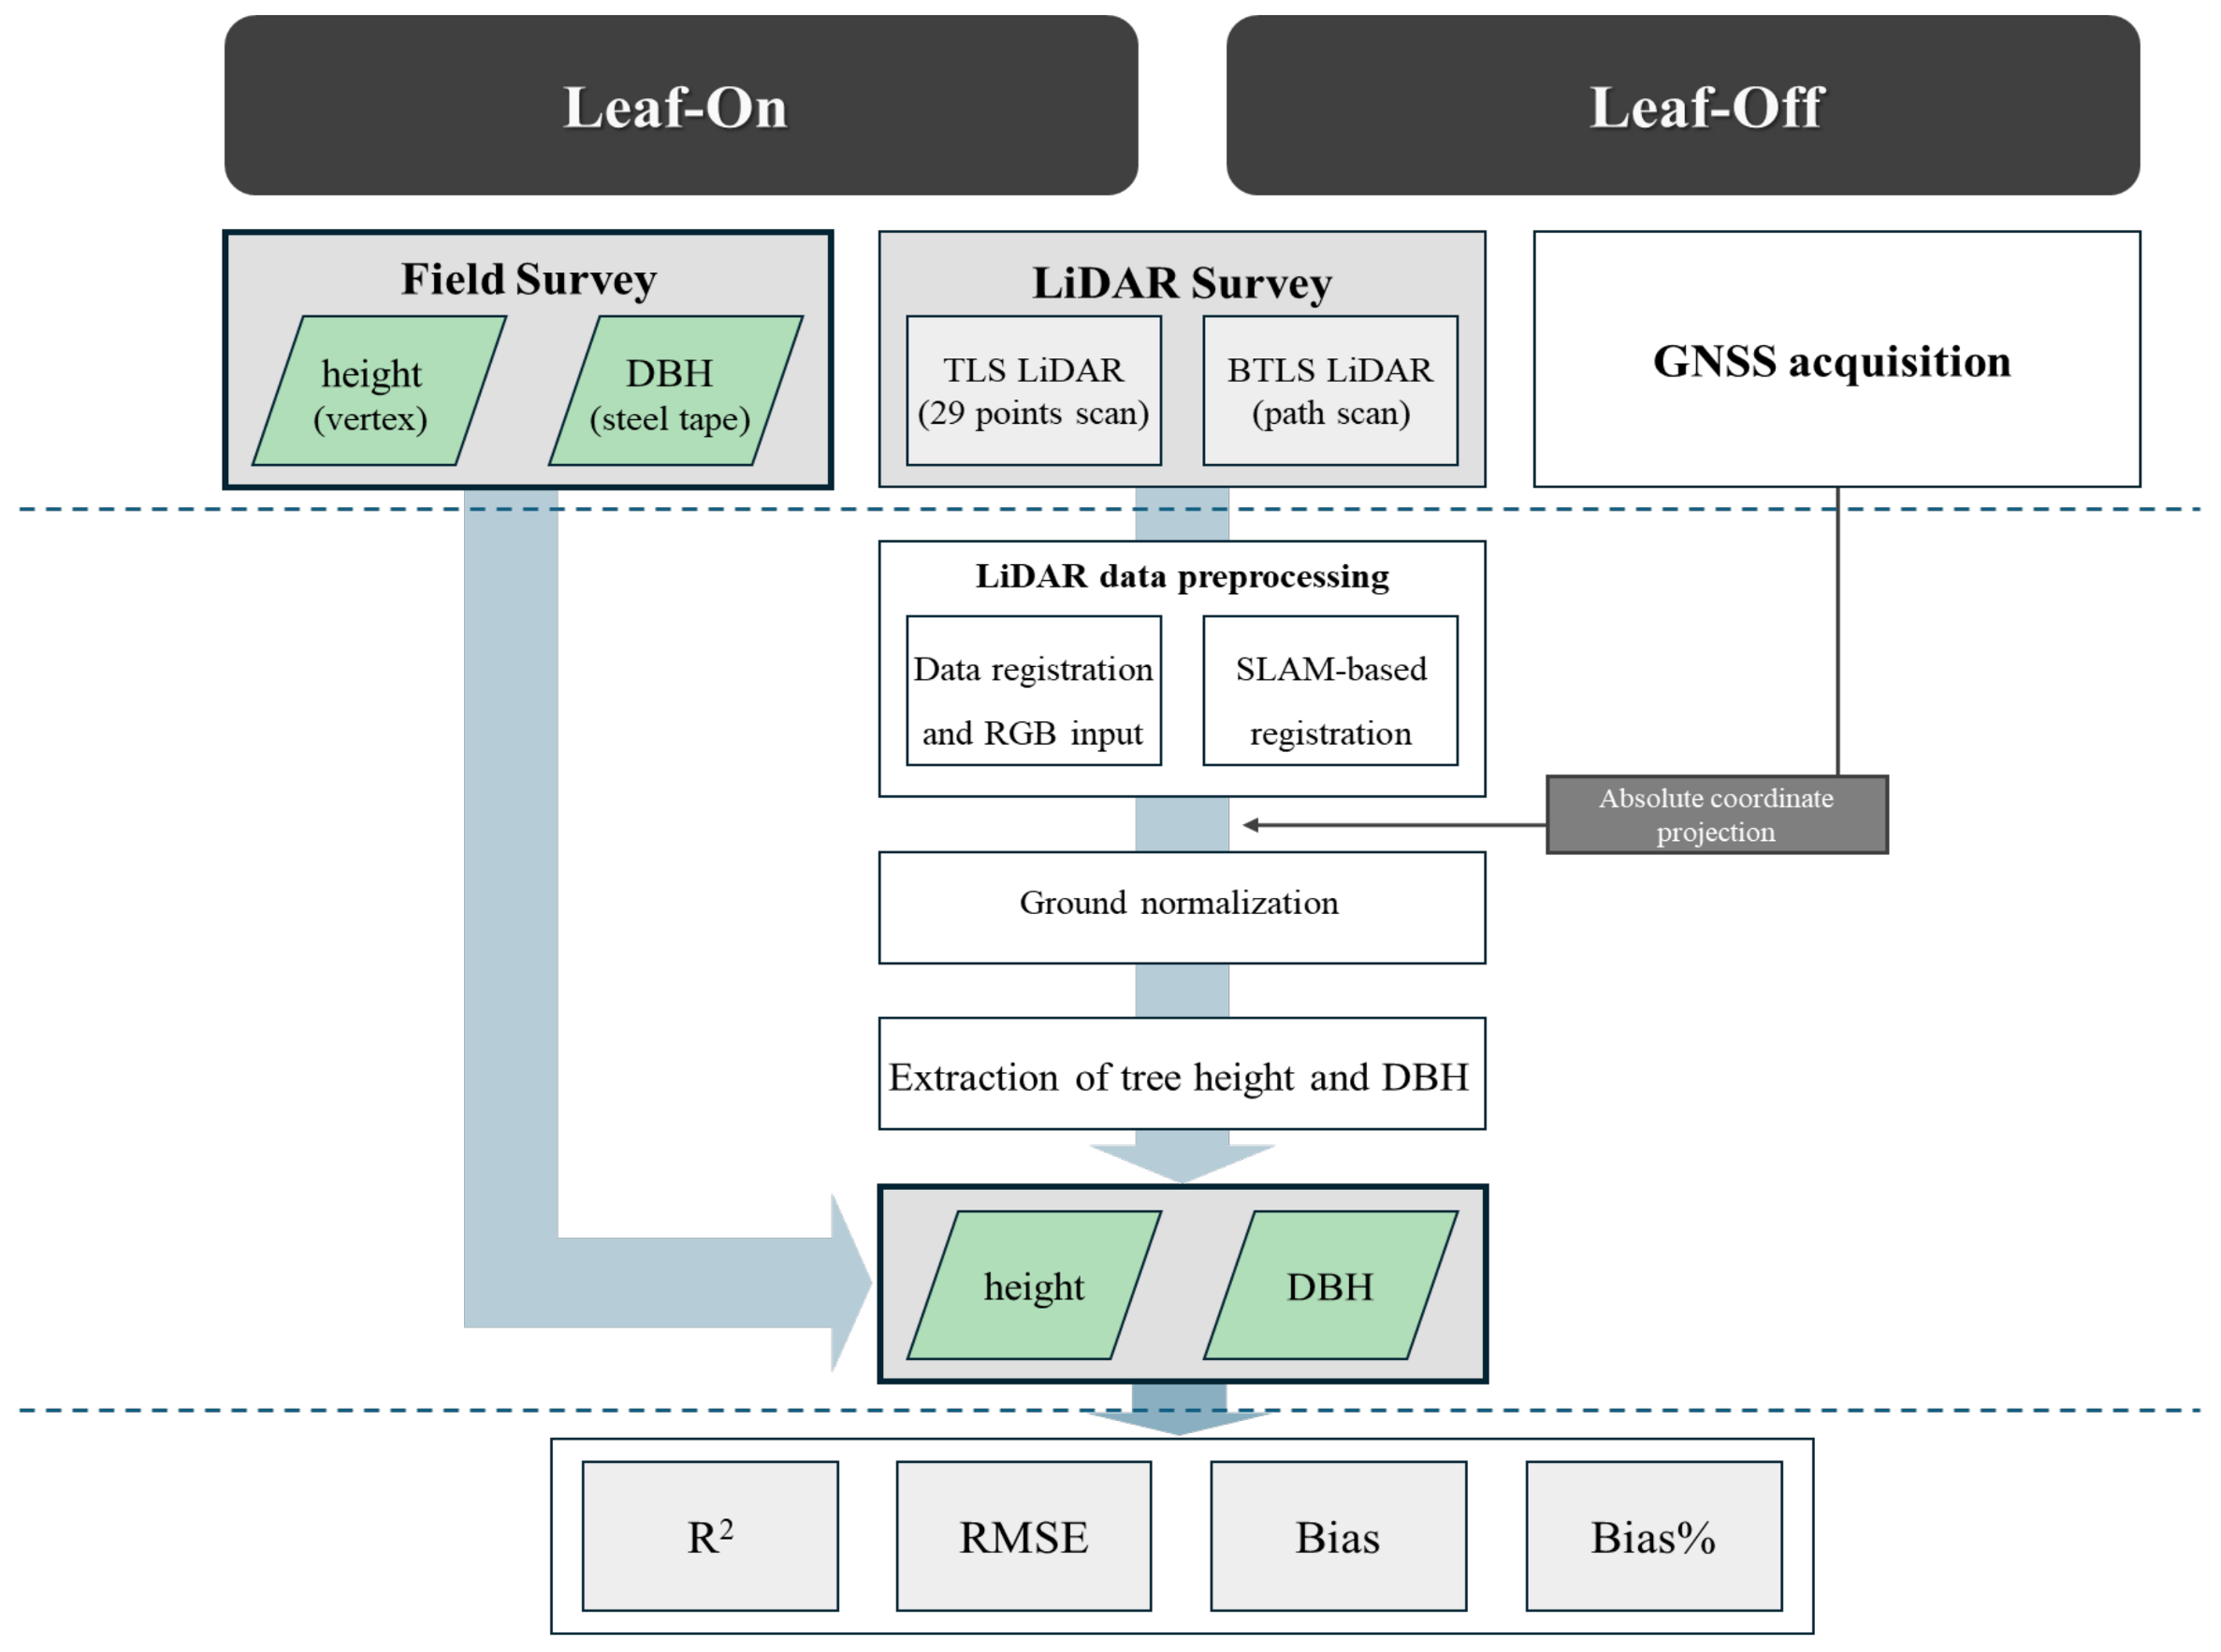
2.2. Data Collection

Field surveys were conducted by a team of three using conventional forest measurement instruments, such as the Vertex Laser Geo by Haglöf [26], to determine tree height and a steel tape to measure the DBH. The LiDAR-based surveys were conducted by a single operator. TLS was performed using a Leica RTC360 3D laser scanner (Leica Geosystems, St. Gallen, Switzerland) [27], whereas BPLS was performed using a Model Libackpack D50 by Greenvalley International [28] (Table 2).
Tree-level data were collected using GNSS to georeference both the sample plots and individual trees. Identification tags were attached to each tree to facilitate data comparison. TLS data acquisition involved 29 scans to match the steep and dense conditions of the sample plots and improve data precision, while BPLS scanning followed a similar procedure. Utilizing multiple scans enhanced the accuracy and reliability of the LiDAR data, allowing for a detailed analysis of tree- and stand-level characteristics. As shown in Table 2, the study site is characterized by steep slopes and high stand density, resulting in a large number of individual trees. To minimize occlusion among trees, a total of 29 scans were performed. Methods utilizing TLS are known to experience challenges related to occlusion effects caused by surrounding trees, which hinder accurate measurement of the target trees [29]. Occlusion occurs when parts of the trunk, branches, or leaves obstruct the line of sight, preventing the scanner from capturing the rear portions of the object. Since TLS data acquisition involves scanning from multiple positions and aligning the datasets, issues such as occlusion effects, omission errors, and commission errors are common, leading to reduced data accuracy. Previous studies have reported that 10%–32% of trees within a sample plot may remain unscanned from the center due to obstruction by neighboring trees closer to the LiDAR device [15,17]. To mitigate these issues, scans must be conducted from multiple positions within the plot to minimize errors and improve data quality (Figure 3).

2.3. Comparison of LiDAR Measurements and Field Survey Methods

LiDAR data were processed using both pre- and post-processing steps (Figure 4). The pre-processing included data registration, inputting RGB values into the point cloud, and converting the relative coordinates to absolute coordinates. For TLS, pre-processing was performed using Leica Cyclone REGISTER 360 software (Leica Geosystems, ST. Gallen, Switzerland) [27] to align the 29 scans and input RGB values. The relative coordinates of the LiDAR data were converted to absolute coordinates using the GNSS data. In the case of BPLS, the SLAM technology integrated into the equipment allowed automatic path alignment during data acquisition; therefore, no additional pre-processing was required. The GNSS data were used to match the georeference with the TLS data. Due to interference from the tree canopy, GNSS signals were not consistently acquired. To address this, a tethering connection with a smartphone was utilized during the data collection process. Furthermore, data were continuously collected from the forest road to the plot locations, and coordinates were recorded once the positional error was confirmed to be within 1 m.
Post-processing was conducted using the LiDAR360 software ver 4.1 [30] for both TLS and BPLS. The acquired LiDAR data were segmented into plots, and ground and non-ground points were distinguished before ground normalization was conducted. Understory vegetation was classified, and tree height and DBH were extracted for comparison with field survey data, thereby evaluating accuracy. The data processing methods using LiDAR360 are detailed as follows. Outliers were removed using the “remove outliers” function and the “noise filter” in the LiDAR360 software. After removing the outliers, point clouds were classified into ground and aboveground components using the TIN algorithm to separate attribute values. Ground surface values were further processed through ground normalization, facilitating the extraction of DBH and tree height. Individual trees were identified using the CSP algorithm, applied for spatial clustering. To estimate DBH, only the point clouds within the range of 1.2 m to 1.3 m of the identified stems were extracted to obtain cross-sectional data. Tree height was calculated by determining the vertical distance between the highest point of each stem and the normalized ground level, where the z-value equals zero.

2.4. Statistical Analysis

To compare the accuracy of the field survey data across different seasons and stand densities, statistical metrics such as R2, RMSE, RMSE%, Bias, and Bias% were analyzed. The R2 value ranged between 0 and 1, with higher values indicating greater explanatory power between the dependent and independent variables. RMSE measures the precision of estimates by evaluating the difference between observed and predicted values, whereas bias assesses the degree of over or underestimation relative to the actual measurements. These metrics are commonly used to evaluate the difference between the estimated and measured values, with values closer to zero indicating higher data quality. In this study, field survey data were used as reference values, whereas LiDAR data were treated as estimated values for evaluation (Table 3.

3. Results and Discussion

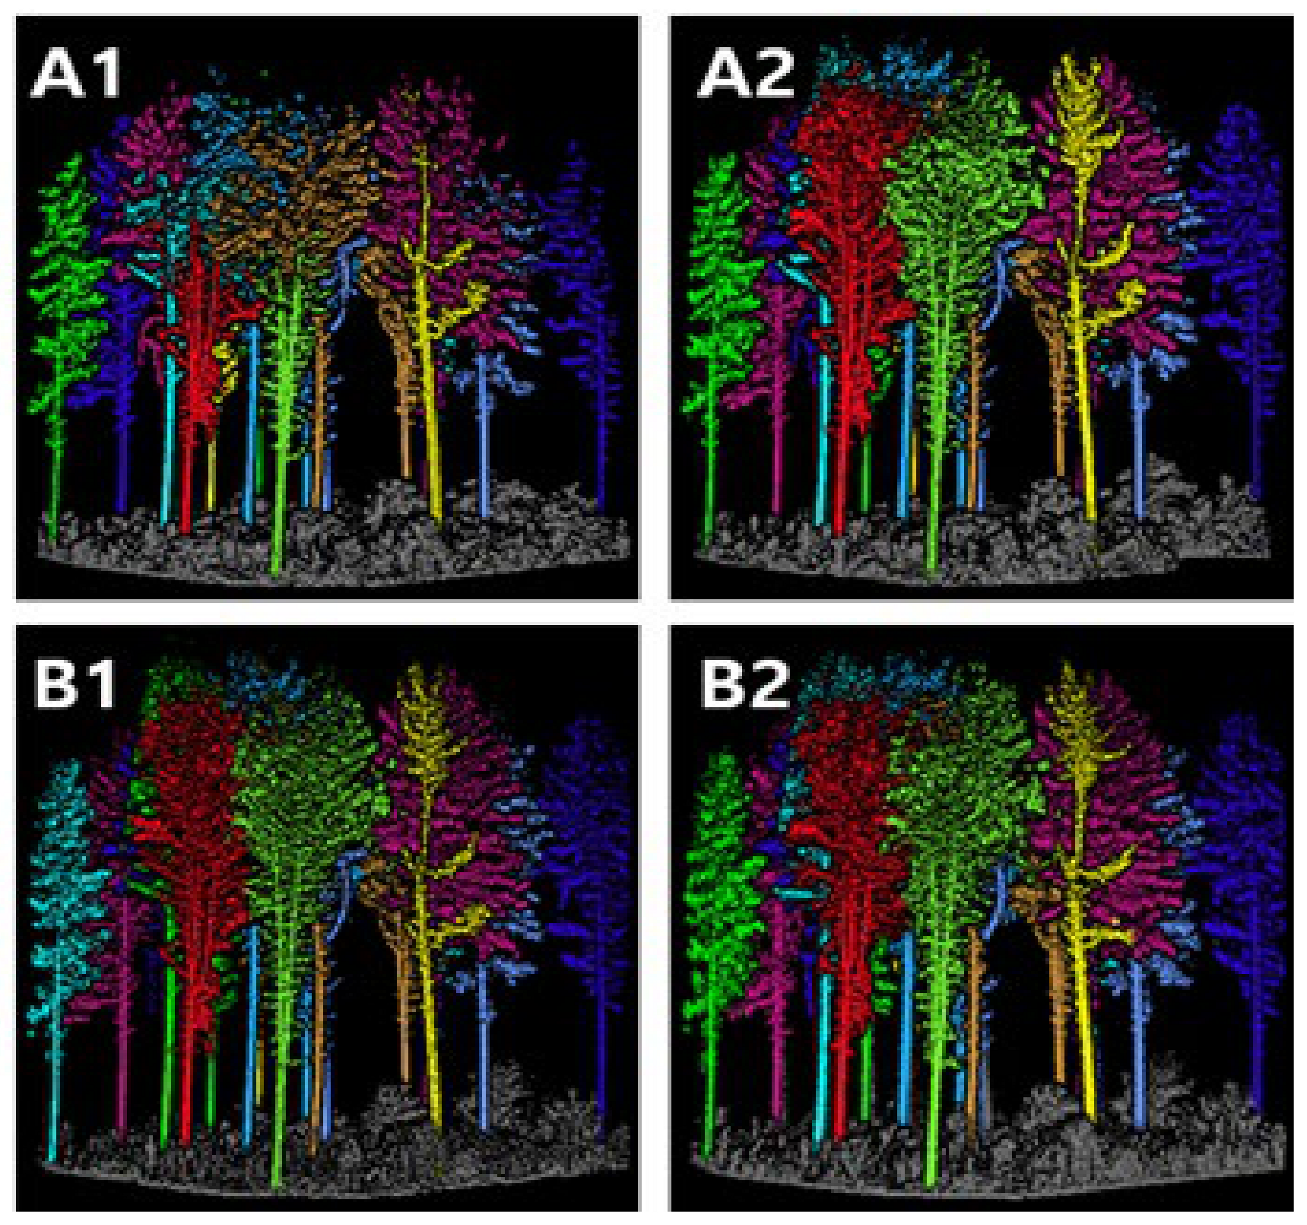
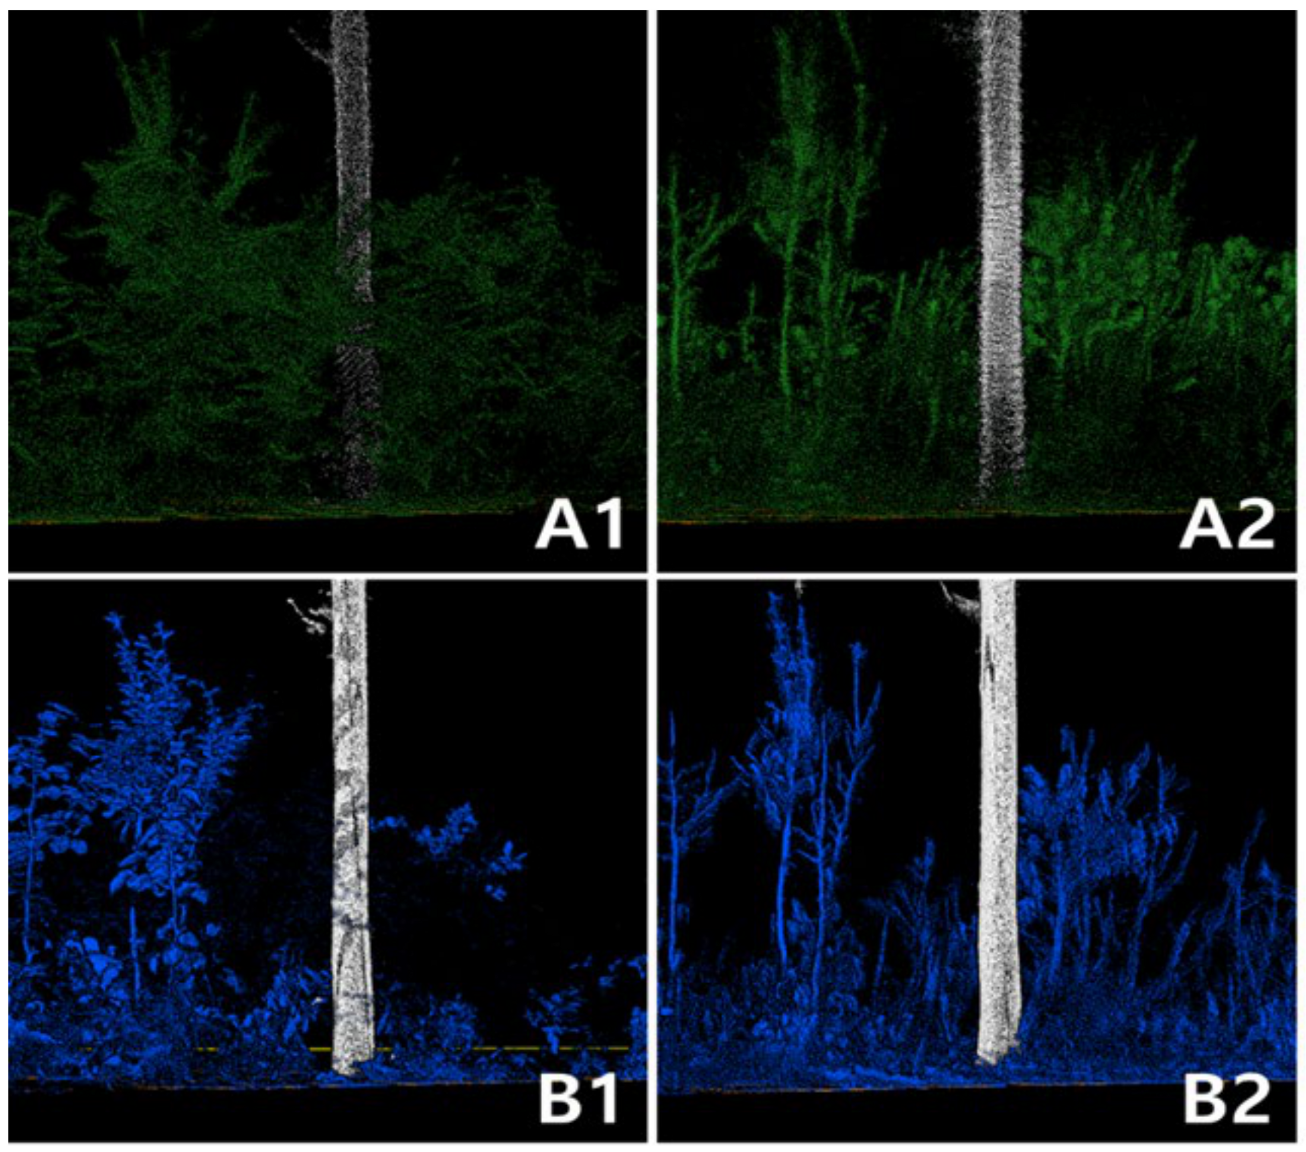
3.1. Tree Mapping Results

Tree mapping results using LiDAR and TLS showed a 100% detection rate across six standard plots in the Gari Mountain Forest Management Complex. However, BPLS showed a lower detection rate of 81.63% during the growing season in the Larix kaempferi _High plot, with 18.37% of stems missing (Table 4). Previous studies have indicated that mapping using laser scanning (ALS, TLS, MLS, and PLS) is affected by the tree density in the field [7]. Although the number of trees in the Larix kaempferi _ High plot was not significantly higher than that in the Pinus koraiensis _ High plot, there was considerable distribution of mid and understory vegetation. This suggests that occlusion occurred during tree scanning during the growing season. Chen et al. [7] used a highly mobile PLS device, ZEB-REVO-RT, to verify the detection rate of birch and Chinese pine stems in a plot with 1100 trees per hectare and found a detection rate of 90.9%, with 9.1% of the trees remaining undetected. [2] analyzed the detection capability of BPLS based on plot density in boreal forests in Finland. Their results showed that plots with low density and little understory vegetation had a detection rate of 95%, whereas plots with high density and understory vegetation had an 84% detection rate. Recent advancements in hardware and software have significantly improved the accuracy of individual tree detection [31]. achieved a high detection rate of 96% when using a deep learning model along with MLS and unmanned laser scanning (ULS) for a large-scale natural forest inventory at the individual tree level. Additionally, employed hierarchical strategy-based segmentation (SHS) to improve individual tree segmentation, achieving a 100% detection rate, confirming the high accuracy of individual tree extraction using LiDAR [32].
Compared with previous studies, the detection rate of the equipment used in this study was significantly high. This was likely because, in the case of TLS, data collection was performed from diverse positions through 29 scans to avoid occlusion, thereby ensuring no data loss. In the case of BPLS, thorough scanning inside the plot contributed to a high tree detection rate. However, the detection rates decreased in plots with abundant understory vegetation. These results indicate that when scanning data using LiDAR, careful consideration must be given to the data acquisition methods, scan positions, and scanning timing to minimize data loss. Furthermore, compared to TLS and MLS, which are commonly used under similar tree density conditions, BPLS was more efficient for tree detection in forested areas.

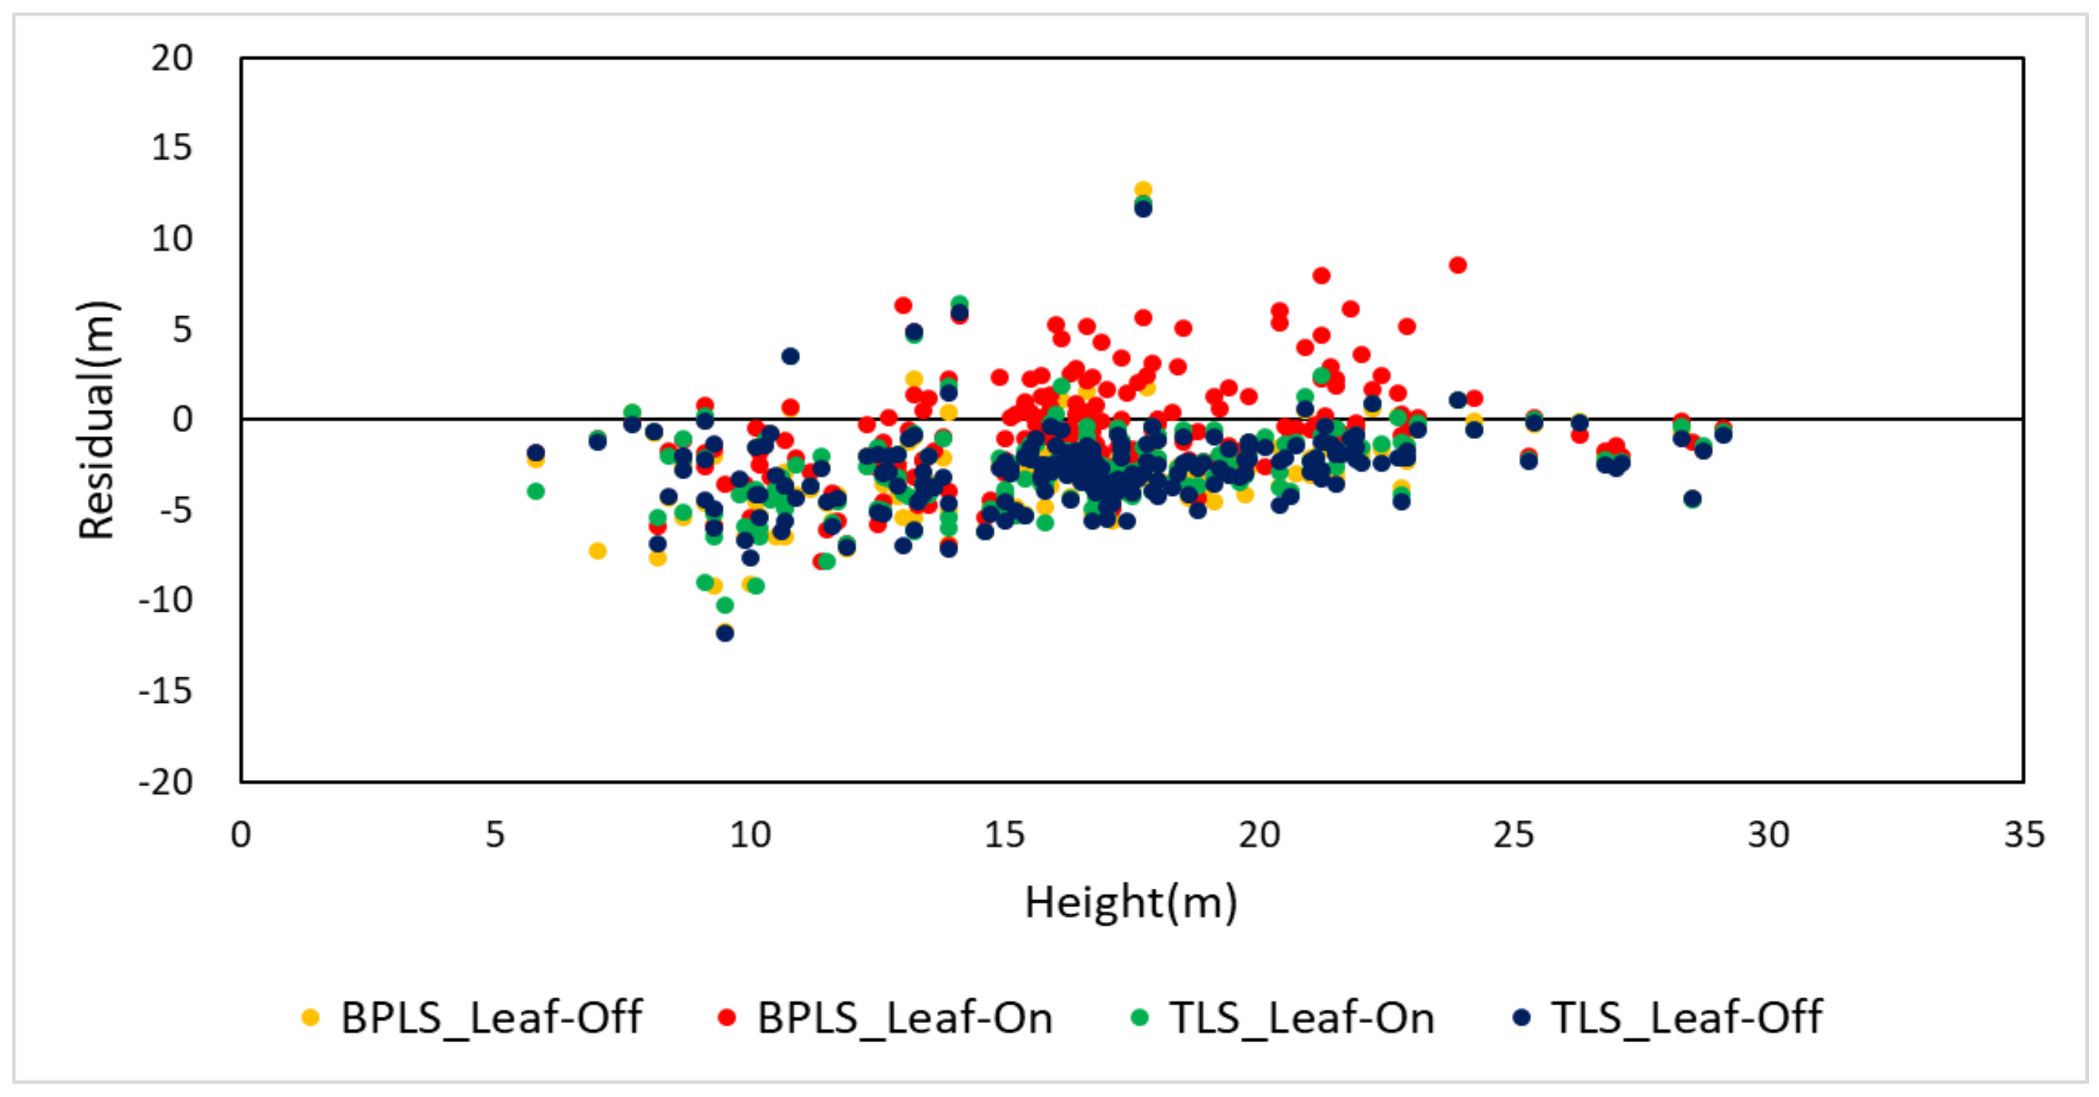
3.2. Comparison of DBH and Tree Height Estimation Using LiDAR and Field Survey Methods

The statistical results comparing DBH and tree height of individual trees from seasonal field surveys and LiDAR equipment are shown in Table 5 and Table 6.
For the DBH, the accuracy of the L. kaempferi plots was generally higher than that of the P. koraiensis plots. BPLS had an R2 ranging from 0.16 to 0.9, while that of TLS ranged from 0.71 to 0.97. The RMSE for BPLS was 1.53 to 7.75 m, and for TLS it was 0.87 to 3.26 m, indicating that TLS had an overall higher accuracy compared to BPLS. In terms of seasonal differences, during the dormant season, the R2 ranged from 0.42 to 0.97 with an RMSE of 0.87 to 7.75 m, while in the growing season, the R2 ranged from 0.16 to 0.88 with an RMSE of 1.43 to 7.38 m. This indicates that the accuracy was higher during the dormant season than during the growing season. Differences in stand density had no significant effect on accuracy. Compared to previous studies that reported an acceptable RMSE% of 5% to 10% for DBH measurements using LiDAR in visible forest conditions [33], the values obtained via BPLS, in this study, showed notable differences. TLS, which captures 2 million points per second with a scanning accuracy of ±3 mm, produced denser data with fewer residuals compared to BPLS, which captures 600,000 points per second with a scanning accuracy of ±3 cm (Figure 5). These results suggest that the accuracy of LiDAR equipment significantly affects DBH measurement errors. Because tree trunks are often irregularly shaped and have species-specific bark textures, they tend to resemble ellipses rather than perfect circles. This irregularity may impact the DBH measurement accuracy when using the circle-fitting algorithm, which relies only on point clouds at a height of 1.2 to 1.3 m, contributing to these discrepancies.
Through this analysis, we observed that the accuracy of LiDAR devices could cause significant variations in DBH measurements, contributing to a notable margin of error. However, this algorithm may produce discrepancies compared to field measurements, primarily owing to equipment errors and the influence of understory and midstory vegetation obstructing the stem at that height (Figure 6). Our findings indicate that LiDAR measurement accuracy decreases significantly during the growing season, particularly when the foliage is dense. Understory vegetation became more abundant as tree density decreased, amplifying the error in DBH measurements.
For BPLS, although it showed lower accuracy compared to TLS, it was significantly more efficient in acquiring data on-site. Additionally, the SLAM algorithm enables automatic registration, greatly reducing analysis time compared to TLS. Therefore, it is deemed that the choice of LiDAR technology should depend on the specific purpose and environment of the task.
For tree height, the FI ranged from 0.011 to 0.908, the RMSE ranged from 1.272 to 5.07 m, and the RMSE% ranged from 4.723 to 32.287%. The Bias ranged from −3.522 to 1.072 m, and the Bias% ranged from −22.416 to 5.051%. Compared to P. koraiensis, L. kaempferi generally showed a similar but slightly higher accuracy. Regarding the statistical results between the equipment, TLS showed a higher tendency than BPLS. In the case of the growing season and dormant season, the growing season showed lower accuracy than the dormant season, and BPLS had significantly lower accuracy than TLS. Differences in stand density showed that the accuracy decreased as stand density increased from sparse to dense. This is because, for tree height, it is important for the laser to reach the treetop; as stand density increases, branches obscure the view of the treetop, resulting in accuracy differences by density (Figure 7). As shown in Figure 7, A1 had significantly fewer recordings of the treetop than the other areas, which led to an underestimation of tree height accuracy compared to others.
Observing treetops using TLS and BPLS data to estimate tree height has been studied across many plots with various scanning devices [20,21,24,34,35,36]. Tsuchiya et al. [20] used BPLS to survey tree height in stands of Chamaecyparis obtusa and Cryptomeria japonica, resulting in an RMSE% of 5.4 to 10.1%. Yang et al. [21] compared the forest survey accuracy using BPLS with different LiDAR sensor orientations and numbers, resulting in an RMSE of 1 to 2.76 m, demonstrating the excellence of tree height estimation using LiDAR.
Consequently, DBH is measured directly by workers using a diameter tape, resulting in highly accurate field survey data. When residual plots were drawn by comparing DBH and tree height from field surveys, tree height showed a greater range of differences than DBH (Figure 8 and Figure 9). When comparing the equipment, TLS had fewer residuals than BPLS. In terms of seasonal comparison, the growing season had higher residuals than the dormant season. The lower accuracy of BPLS and TLS for tree height measurements compared to DBH was due to the field survey method using a Vertex hypsometer, which is more sensitive to user variability, stand conditions, crown width, and tree species compared to LS methods [37]. Additionally, tree height is generally more difficult to measure directly than DBH in dense stands because of the influence of neighboring trees. Tree height measurements using the LS equipment showed lower accuracy because fewer points were obtained at the treetop. Therefore, tree height is more affected by stand density and the timing of scanning than DBH. Bauwens et al. [29] also reported that most laser signals have difficulty acquiring heights of 15 to 20 m. Figure 9 shows that many trees are distributed in the 20 to 30 m range. In particular, BPLS showed the largest residuals during the growing season, indicating a significantly lower accuracy for tree height measurement during the growing season.

4. Conclusions

The objective of this study was to analyze the performance differences of LiDAR equipment during the Leaf-on and Leaf-off seasons in the Gari Mountain Leading Forest Management Complex, Republic of Korea. To achieve this, forest data were collected during each season, and the results were compared to evaluate the differences in performance. The analysis revealed significant differences in data accuracy for TLS and BPLS equipment between the Leaf-on season (August 2021) and the Leaf-off season (March 2022). During the Leaf-on season, dense foliage interfered with the absorption and reflection of LiDAR signals, leading to reduced accuracy in tracking the positions and shapes of individual trees. In contrast, during the Leaf-off season, reduced foliage allowed for clearer identification of tree shapes, resulting in improved data quality.
Moreover, the quality of the collected data was found to vary depending on tree density and site conditions. This finding underscores the importance of carefully considering the timing of data collection and the choice of equipment for successful forest management and research. Therefore, forest surveys using LiDAR equipment must account for seasonal characteristics. Such considerations can enhance the efficiency of forest resource management and facilitate the acquisition of more precise forest information.
In conclusion, the performance of LiDAR equipment is significantly influenced by the presence or absence of foliage, with more accurate data collection achievable during the Leaf-off season. Differences in accuracy between equipment types were also confirmed. Future research will aim to investigate the impact of seasonal foliage changes on LiDAR data accuracy for broadleaf species and delve deeper into the effects of understory vegetation development based on stand density. Although this study was conducted as a case study, subsequent research will seek to build on these findings by compiling data from diverse cases. Ultimately, this effort is expected to contribute to optimizing forest survey methods and improving the efficiency of forest resource management using LiDAR technology.

Author Contributions

Conceptualization, C.K. and J.P.; methodology, C.K.; software, C.K. and M.L.; validation, C.K. and J.K.; formal analysis, C.K.; investigation, C.K.; resources, C.K. and J.P.; data curation, C.K. and M.L.; writing—original draft preparation, C.K.; writing—review and editing, C.K. and J.P.; visualization, C.K.; supervision, J.K.; project administration, J.K.; funding acquisition, J.K. All authors have read and agreed to the published version of the manuscript.

Funding

This research was funded by the National Institute of Forest Science, grant number FM0101-2024-01-2024 and FM0300-2024-01-2024.

Data Availability Statement

The original contributions presented in this study are included in the article. Further inquiries can be directed to the corresponding author.

Conflicts of Interest

The authors declare no conflicts of interest.

References

  1. Jeon, B.H.; Lee, S.H.; Lee, Y.J.; Kim, H.; Kang, H.M. Estimation of Site Index and stem volume equations for Larix kaempferi stand in jinan, chonbuk. J. Korean For. Soc. 2007, 96, 40–47. [Google Scholar]
  2. Hyyppä, E.; Kukko, A.; Kaijaluoto, R.; White, J.C.; Wulder, M.A.; Pyörälä, J.; Liang, X.; Yu, X.; Wang, Y.; Kaartinen, H.; et al. Accurate derivation of stem curve and volume using backpack mobile laser scanning. ISPRS J. Photogramm. 2020, 161, 246–262. [Google Scholar] [CrossRef]
  3. Ko, C.; Lee, S.; Yim, J.; Kim, D.; Kang, J. Comparison of forest inventory methods at plot-level between a Backpack Personal Laser Scanning (BPLS) and conventional equipment in Jeju island, South Korea. Forests 2021, 12, 308. [Google Scholar] [CrossRef]
  4. Clark, N.A.; Wynne, R.H.; Schmoldt, D.L. A review of past research on dendrometers. Forest Sci. 2000, 46, 570–576. [Google Scholar] [CrossRef]
  5. Olofsson, K.; Holmgren, J.; Olsson, H. Tree stem and height measurements using terrestrial laser scanning and the RANSAC algorithm. Remote Sens. 2014, 6, 4323–4344. [Google Scholar] [CrossRef]
  6. Rutzinger, M.; Pratihast, A.K.; Oude Elberink, S.; Vosselman, G. Detection and modelling of 3D trees from mobile laser scanning data. Int. Arch. Photogramm. Remote Sens. Spat. Inf. Sci. 2010, 38, 520–525. [Google Scholar]
  7. Chen, S.; Liu, H.; Feng, Z.; Shen, C.; Chen, P. Applicability of personal laser scanning in forestry inventory. PLoS ONE 2019, 14, e0211392. [Google Scholar] [CrossRef]
  8. Ko, C.; Lee, J.; Kim, D.; Kang, J. The application of terrestrial light detection and ranging to forest resource inventories for timber yield and carbon sink estimation. Forests 2022, 13, 2087. [Google Scholar] [CrossRef]
  9. Lee, Y.; Lee, J. Evaluation of accuracy in estimating diameter at breast height based on the scanning conditions of terrestrial laser scanning and circular fitting algorithm. Forests 2024, 15, 313. [Google Scholar] [CrossRef]
  10. Maltamo, M.; Næsset, E.; Vauhkonen, J. Forestry applications of airborne laser scanning. Concepts and Case Studies. Manag. For. Ecosys. 2014, 27, 460. [Google Scholar]
  11. Zhou, L.; Li, X.; Zhang, B.; Xuan, J.; Gong, Y.; Tan, C.; Huang, H.; Du, H. Estimating 3D Green Volume and Aboveground Biomass of Urban Forest Trees by UAV-Lidar. Remote Sens. 2022, 14, 5211. [Google Scholar] [CrossRef]
  12. Ayrey, E.; Hayes, D.J. The use of three-dimensional convolutional neural networks to interpret LiDAR for forest inventory. Remote Sens. 2018, 10, 649. [Google Scholar] [CrossRef]
  13. Erikson, M.; Karin, V. Finding tree-stems in laser range images of young mixed stands to perform selective cleaning. In Proceedings of the ScandLaser Scientific Workshop on Airborne Laser Scanning of Forest, Umeå, Sweden, 3–4 September 2003. [Google Scholar]
  14. Lovell, J.L.; Jupp, D.L.B.; Culvenor, D.S.; Coops, N.C. Using airborne and ground-based ranging lidar to measure canopy structure in Australian forests. Can. J. Remote Sens. 2003, 29, 607–622. [Google Scholar] [CrossRef]
  15. Brolly, G.; Király, G. Algorithms for stem mapping by means of terrestrial laser scanning. Acta Silv. Lignaria Hung. 2009, 5, 119–130. [Google Scholar] [CrossRef]
  16. Murphy, G.E.; Acuna, M.A.; Dumbrell, I. Tree value and log product yield determination in radiata pine (Pinus radiata) plantations in Australia: Comparisons of terrestrial laser scanning with a forest inventory system and manual measurements. Can. J. For. Res. 2010, 40, 2223–2233. [Google Scholar] [CrossRef]
  17. Lovell, J.L.; Jupp, D.L.B.; Newnham, G.J.; Culvenor, D.S. Measuring tree stem diameters using intensity profiles from ground-based scanning lidar from a fixed viewpoint. ISPRS J. Photogramm. 2011, 66, 46–55. [Google Scholar] [CrossRef]
  18. Kukko, A. Mobile Laser Scanning—System Development, Performance and Applications. Ph.D. Thesis, Aalto University, Espoo, Finland, 2013. [Google Scholar]
  19. Liang, X.; Kukko, A.; Kaartinen, H.; Hyyppä, J.; Yu, X.; Jaakkola, A.; Wang, Y. Possibilities of a personal laser scanning system for forest mapping and ecosystem services. Sensors 2014, 14, 1228–1248. [Google Scholar] [CrossRef] [PubMed]
  20. Tsuchiya, B.; Mochizuki, H.; Hoshikawa, T.; Suzuki, S. Error estimation of trunk diameter and tree height measured with a backpack LiDAR system in Japanese plantation forests. Landscape Ecol. Eng. 2023, 19, 169–177. [Google Scholar] [CrossRef]
  21. Yang, S.; Xing, Y.; Xing, T.; Deng, H.; Xi, Z. Multi-sensors fusion SLAM-aided forest plot mapping with backpack dual-LiDAR system. IEEE J. Sel. Top. Appl. Earth Obs. Remote Sensing 2024, 17, 16051–16070. [Google Scholar] [CrossRef]
  22. Gharineiat, Z.; Tarsha Kurdi, F.; Henny, K.; Gray, H.; Jamieson, A.; Reeves, N. Assessment of NavVis VLX and BLK2GO SLAM Scanner Accuracy for Outdoor and Indoor Surveying Tasks. Remote Sens. 2024, 16, 3256. [Google Scholar] [CrossRef]
  23. Saarela, S.; Breidenbach, J.; Raumonen, P.; Grafström, A.; Ståhl, G.; Ducey, M.J.; Astrup, R. Kriging prediction of stand-level forest information using mobile laser scanning data adjusted for nondetection. Can. J. For. Res. 2017, 47, 1257–1265. [Google Scholar] [CrossRef]
  24. Cabo, C.; Del Pozo, S.D.; Rodríguez-Gonzálvez, P.; Ordóñez, C.; González-Aguilera, D. Comparing terrestrial laser scanning (TLS) and wearable laser scanning (WLS) for individual tree modeling at plot level. Remote Sensing 2018, 10, 540. [Google Scholar] [CrossRef]
  25. Del Perugia, B.; Giannetti, F.; Chirici, G.; Travaglini, D. Influence of scan density on the estimation of single-tree attributes by handheld mobile laser scanning. Forests 2019, 10, 277. [Google Scholar] [CrossRef]
  26. The VL Vertex Laser. Available online: https://haglofsweden.com/product-catalogs/ (accessed on 23 October 2024).
  27. Leica. Leica Cyclone 3D Point Cloud Processing Software. 2024. Available online: https://leica-geosystems.com/products/laser-scanners/software/leica-cyclone (accessed on 23 October 2024).
  28. LiBackpack. Mobile Handheld LiDAR—3D Mapping System. Available online: https://www.greenvalleyintl.com/LiBackpackDGC50H/ (accessed on 23 October 2024).
  29. Bauwens, S.; Bartholomeus, H.; Calders, K.; Lejeune, P. Forest inventory with terrestrial LiDAR: A comparison of static and handheld mobile laser scanning. Forests 2016, 7, 127. [Google Scholar] [CrossRef]
  30. LiDAR360—Point Cloud Processing Software. Available online: https://www.greenvalleyintl.com/LiDAR360/ (accessed on 23 October 2024).
  31. Shao, J.; Lin, Y.-C.; Wingren, C.; Shin, S.-Y.; Fei, W.; Carpenter, J.; Habib, A.; Fei, S. Large-scale inventory in natural forests with mobile LiDAR point clouds. Nat. For. Inventory J. 2024, 10, 100168. [Google Scholar] [CrossRef]
  32. Zhu, D.; Liu, X.; Zheng, Y.; Xu, L.; Huang, Q. Improved Tree Segmentation Algorithm Based on Backpack-LiDAR Point Cloud. Forests 2024, 15, 136. [Google Scholar] [CrossRef]
  33. Liang, X.; Wang, Y.; Pyörälä, J.; Lehtomäki, M.; Yu, X.; Kaartinen, H.; Kukko, A.; Honkavaara, E.; Issaoui, A.E.I.; Nevalainen, O.; et al. Forest in situ observations using unmanned aerial vehicle as an alternative of terrestrial measurements. For. Ecosyst. 2019, 6, 20. [Google Scholar] [CrossRef]
  34. Huang, H.; Li, Z.; Gong, P.; Cheng, X.; Clinton, N.; Cao, C.; Ni, W.; Wang, L. Automated methods for measuring DBH and tree heights with a commercial scanning lidar. Photogramm. Eng. Remote Sens. 2011, 77, 219–227. [Google Scholar] [CrossRef]
  35. Fleck, S.; Mölder, I.; Jacob, M.; Gebauer, T.; Jungkunst, H.F.; Leuschner, C. Comparison of conventional eight-point crown projections with LIDAR-based virtual crown projections in a temperate old-growth forest. Ann. For. Sci. 2011, 68, 1173–1185. [Google Scholar] [CrossRef]
  36. Liang, X.; Hyyppä, J. Automatic stem mapping by merging several terrestrial laser scans at the feature and decision levels. Sensors 2013, 13, 1614–1634. [Google Scholar] [CrossRef]
  37. Wang, Y.; Kukko, A.; Hyyppä, E.; Hakala, T.; Pyörälä, J.; Lehtomäki, M.; El Issaoui, A.; Yu, X.; Kaartinen, H.; Liang, X.; et al. Seamless integration of above- and under-canopy unmanned aerial vehicle laser scanning for forest investigation. For. Ecosyst. 2021, 8, 10. [Google Scholar] [CrossRef]
Figure 1. Comparison of photos taken during the growing season and dormant season.
Forests 15 02230 g001
Figure 2. Map showing the location of sample points within the Gari Mountain Forest Management Complex.
Forests 15 02230 g002
Figure 3. Methodology for scanning plots using LiDAR (Left: TLS; Right: BPLS).
Forests 15 02230 g003
Figure 4. The overall flow chart of the study.
Forests 15 02230 g004
Figure 5. Comparison of diameter at breast height (DBH) point density between equipment types (A1: BPLS_Leaf-On; A2: BPLS_Leaf-Off; B1: TLS_Leaf-On; B2: TLS_Leaf-Off).
Forests 15 02230 g005
Figure 6. Differences in trunk occlusion due to understory vegetation between growing and dormant seasons (A1: BPLS_Leaf-On; A2: BPLS_Leaf-Off; B1: TLS_Leaf-On; B2: TLS_Leaf-Off).
Forests 15 02230 g006
Figure 7. Comparison of tree height point density between equipment types (A1: BPLS_Leaf-On; A2: BPLS_Leaf-Off; B1: TLS_Leaf-On; B2: TLS_Leaf-Off).
Forests 15 02230 g007
Figure 8. Residual analysis of tree height by equipment and measurement period.
Forests 15 02230 g008
Figure 9. Residual analysis of diameter at breast height (DBH) by equipment and measurement period.
Forests 15 02230 g009
Table 1. Geographical characteristics per plot of study site.
SpeciesDenseSlope (°)Age ClassAltitude (m)Tree/0.08 ha
Larix
kaempferi
Low10VI291~54812
Medium29VI394~68026
High28V245~35149
Pinus
koraiensis
Low14VI308~55518
Medium35VI334~64739
High20VI334~620115
Table 2. Comparison of specifications between TLS and BPLS systems.
Specifications
Laser SensorTLS (Leica RTC360)BPLS (Velodyne VLP-16×2)
Wavelength1550 nm905 nm
LiDAR Accuracy1.9 mm~5.3 mm
(1.9 mm @ 10 m
2.9 mm @ 20 m
5.3 mm @ 40 m)
±3 cm
Scan Range130 m100 m
Weight5.35 kg without battery8.8 kg without battery
Scan Rate2,000,000 pts/s600,000 pts/s
Field of viewvertical: 300°
horizontal: 360°
vertical: −90°– + 90°
horizonal: 360°
Camera36 MP 3-camera system
432 MP×raw data for calibrated 360° × 300° spherical image
Table 3. Statistical accuracy comparison between laser scanning and field measurements.
StatisticsCalculation Forms
Coefficient of determination (R2) 1 ( x i x ^ i ) 2 ( x i x ¯ i ) 2
Bias i = 1 n ( x i x i ^ ) / n
Bias% B i a s x i ¯ × 100 %
Root Mean Square Error (RMSE) i = 1 n ( x i x i ^ ) 2 n
Root Mean Square Error% (RMSE%) R M S E x i ¯ × 100 %
where x i ,   x i ^ , and x i ¯ refer to the measurement value (LiDAR), reference value (field survey), and mean of the reference value, respectively. n = the number of trees.
Table 4. Tree mapping accuracy using TLS and BPLS data.
SpeciesSeasonNumber of TreesTLS MappedBPLS MappedTLS Percentage
(%)
BPLS Percentage
(%)
Larix
kaempferi
Leaf-OffLow1111100100
Medium2626100100
High4949100100
Leaf-OnLow1111100100
Medium2626100100
High494010081.63
Pinus
koraiensis
Leaf-OffLow1818100100
Medium2929100100
High9595100100
Leaf-OnLow1818100100
Medium2929100100
High9595100100
Table 5. Summary of statistical results for diameter at breast height (DBH) by measurement period and equipment.
SpeciesEquipmentSeasonStand DensityR2BiasBias%RMSERSME%
Larix
kaempferi
TLSLeaf-OffLow0.914−0.473−1.4081.3464.010
Medium0.9540.2540.9860.9183.559
High0.8600.0850.4021.6697.921
BPLSLow0.8460.3451.0291.5344.569
Medium0.417−0.488−1.8953.21012.451
High0.7270.0920.4382.42911.534
TLSLeaf-OnLow0.8810.4001.1911.4254.245
Medium0.8220.8913.4572.0628.000
High0.7250.4912.3322.29410.891
BPLSLow0.327−0.827−2.4643.59610.710
Medium0.5960.2581.0003.28612.746
High0.3641.5007.1216.03828.667
Pinus
koraiensis
TLSLeaf-OffLow0.9710.2170.6351.0753.148
Medium0.9600.4091.3010.8742.779
High0.9540.3151.8441.4338.396
BPLSLow0.8181.0062.9457.75422.710
Medium0.5683.70611.7783.53311.230
High0.9010.9235.4082.19812.878
TLSLeaf-OnLow0.823−0.044−0.1303.2619.551
Medium0.7080.5281.6782.3397.436
High0.8840.0130.0742.53614.853
BPLSLow0.7211.2943.7916.22218.223
Medium0.3125.17216.4405.02315.965
High0.1580.1530.8947.38043.230
Table 6. Summary of statistical results for tree height by measurement period and equipment.
SpeciesEquipmentSeasonStand DensityR2BiasBias%RMSERSME%
Larix
kaempferi
TLSLeaf-OffLow0.780−1.688−6.2802.0767.727
Medium0.902−2.155−11.7752.29812.552
High0.583−3.522−18.6713.91720.763
BPLSLow0.780−1.476−5.4941.9197.143
Medium0.807−2.834−15.4843.06616.751
High0.627−3.052−16.1813.45618.323
TLSLeaf-OnLow0.758−1.457−5.4211.9497.254
Medium0.908−2.049−11.1942.18811.955
High0.428−2.968−15.7343.59419.052
BPLSLow0.855−0.992−3.6911.2724.732
Medium0.671−1.039−5.6752.08511.389
High0.1080.6093.2305.07026.876
Pinus
koraiensis
TLSLeaf-OffLow0.690−1.384−6.5211.7888.428
Medium0.726−2.848−17.2362.92617.708
High0.529−2.744−21.1293.93330.287
BPLSLow0.707−1.231−5.8001.7128.069
Medium0.446−2.455−14.8572.53615.346
High0.411−2.911−22.4164.19832.324
TLSLeaf-OnLow0.745−1.129−5.3211.5527.316
Medium0.615−2.751−16.6512.85917.303
High0.451−2.835−21.8294.12331.749
BPLSLow0.0111.0725.0513.08214.527
Medium0.491−0.762−4.6131.73310.486
High0.339−1.199−9.2283.27525.214
Disclaimer/Publisher’s Note: The statements, opinions and data contained in all publications are solely those of the individual author(s) and contributor(s) and not of MDPI and/or the editor(s). MDPI and/or the editor(s) disclaim responsibility for any injury to people or property resulting from any ideas, methods, instructions or products referred to in the content.

