Article

Remote Sensing Identification of Picea schrenkiana var. tianschanica in GF-1 Images Based on a Multiple Mixed Attention U-Net Model

1
College of Geography and Tourism, Xinjiang Normal University, Urumqi 830054, China
2
College of Computer and Information Engineering, Chuzhou University, Chuzhou 239000, China
3
College of Geography and Tourism, Anhui Normal University, Wuhu 241002, China
4
College of Computer Science and Technology, Anhui University, Hefei 230601, China
*
Author to whom correspondence should be addressed.
These authors contributed equally to this work.
Forests 2024, 15(11), 2039; https://doi.org/10.3390/f15112039
Submission received: 26 September 2024 / Revised: 3 November 2024 / Accepted: 16 November 2024 / Published: 19 November 2024
(This article belongs to the Section Forest Inventory, Modeling and Remote Sensing)

Abstract

:
Remote sensing technology plays an important role in woodland identification. However, in mountainous areas with complex terrain, accurate extraction of woodland boundary information still faces challenges. To address this problem, this paper proposes a multiple mixed attention U-Net (MMA-U-Net) semantic segmentation model using 2015 and 2022 GF-1 PMS images as data sources to improve the ability to extract the boundary features of Picea schrenkiana var. tianschanica forest. The U-Net architecture serves as its underlying network, and the feature extraction ability of the Picea schrenkiana var. tianschanica is improved by adding hybrid attention CBAM and replacing the original skip connection with the DCA module to improve the accuracy of the model segmentation. The results show that on the remote sensing dataset with GF-1 PMS images, compared with the original U-Net and other models, the accuracy of the multiple mixed attention U-Net model is increased by 5.42%–19.84%. By statistically analyzing the spatial distribution of Picea schrenkiana var. tianschanica as well as their changes, the area was 3471.38 km2 in 2015 and 3726.10 km2 in 2022. Combining the predicted results with the DEM data, it was found that the Picea schrenkiana var. tianschanica were most distributed at an altitude of 1700–2500 m. The method proposed in this study can accurately identify Picea schrenkiana var. tianschanica and provides a theoretical basis and research direction for forest monitoring.

1. Introduction

Picea schrenkiana var. tianschanica are mainly found in the sub-frigid zone or tundra at an altitude of 1500–2800 m, usually in remote and topographically complex areas. With the continuous expansion of human activities, the Picea schrenkiana var. tianschanica in the Tianshan Snowy Mountains are facing serious ecological threats, and excessive deforestation, grazing, tourism development, and other activities have caused varying degrees of damage to them. Therefore, it is important to obtain information on the area and spatial distribution of Picea schrenkiana var. tianschanica [1,2]. A large number of open datasets on forest resources have now been published [3,4,5,6]. However, due to the large resolution or the difficulty of identifying some areas, there are cases of incomplete extraction of forest boundaries, failure to identify, and misclassification of forests in complex environments such as plateaus and mountains. To address this situation, we propose a method that can identify Picea schrenkiana var. tianschanica species in a timely, effective, and accurate manner and make up for the shortcomings of the use of publicly available data for identification in complex environments such as mountainous areas. This model can also be used to develop reasonable resource management plans and ensure the sustainable utilization of resources [7,8,9].
In the initial stage of forestry investigation, the forest land data of Picea schrenkiana var. tianschanica can only be obtained by consulting relevant literature and using manual measurements, which is inefficient and requires a large amount of manpower and material resources [10,11]. Before the rise of deep learning, semantic segmentation relied heavily on traditional image processing techniques, and these methods typically performed pixel classification based on low-level features such as color and texture [12,13]. However, the performance of traditional methods tends to be more limited due to the sensitivity of these features to changes in light and angle. With the rise of deep learning technology, the U-Net model has achieved good results in the field of image segmentation due to its encoder–decoder structure, which fuses different levels of feature information through jump connections, making U-Net perform well in capturing detailed information [14]. Compared to other deep learning models, the U-Net model has fewer parameters and is easy to extend and improve, which makes it possible to train in a shorter time and achieve better performance on limited training data [15,16,17,18]. However, for complex and variable image scenes, its generalization ability is limited, and it cannot effectively extract and utilize image features. The traditional jump increases the dependence on the input data, and when the quality of the input data is not good or there is noise, it will transfer this bad information to the decoding stage, which affects the final segmentation results and leads to a decrease in the segmentation accuracy. For this reason, scholars have conducted a lot of research on improving U-Net [19,20,21].
Accompanied by the attention mechanism module proposed, a large number of experiments have shown that the attention mechanism can focus on a specific part of the target object and reduce the interference of the noise region, which can solve the problem of not being able to effectively extract and utilize the image features and improve the accuracy of semantic segmentation [22,23,24]. Among them, the CBAM module is able to model both the channel and spatial information of the image to better capture the important information in the image, which can enhance the model’s ability to focus on the target and capture details [25,26,27,28,29]. The DCA module improves on traditional skip connection by addressing the semantic gap between encoder features and decoder features by sequentially capturing the channel and spatial dependencies between multiscale encoder features [30]. However, the expression ability of a single attention mechanism is limited by its single concern, making it unable to fully express the complexity and diversity of the input data. This module can only focus on a particular aspect or feature in the input data and thus may not be able to capture all the key information when dealing with complex tasks [31,32,33,34,35]. Therefore, how to use the U-Net network while targeting the network loss of some information in downsampling, which affects the completeness of the information in the original image, is explored. In addition, how to solve the problem that the traditional skip connection directly passes the encoder feature information to the decoder, which is prone to propagate noise or outliers along with it, is also explored. Using the combination of attention mechanisms to better extract the edge information of Picea schrenkiana var. tianschanica and improve the recognition accuracy is of great significance to promote the application of deep learning models with multiple attention mechanisms in remote sensing recognition of forest land.
In summary, in order to improve the accuracy of Picea schrenkiana var. tianschanica stand boundary information extraction, this study proposed a multiple mixed attention U-Net semantic segmentation model using U-Net as the backbone network using GF-1 PMS data. This method changes the traditional U-Net model, which tends to ignore the channel and spatial information of the image as well as the semantic gap problem. The model adds the CBAM module in the process of downsampling to mitigate the problem of Picea schrenkiana var. tianschanica boundary information loss and changes the original skip connection to use double cross-attention instead, which improves the ability of Picea schrenkiana var. tianschanica feature expression in the network layer of the model, reduces the semantic gap, and improves the Picea schrenkiana var. tianschanica recognition accuracy by means of multiple attentional mechanisms working in conjunction with each other. In addition, the spatial distribution and change in the Picea schrenkiana var. tianschanica area were comprehensively analyzed using DEM data. This research expands the application of this model in forest management and provides technical support for fine management.

2. Materials and Methods
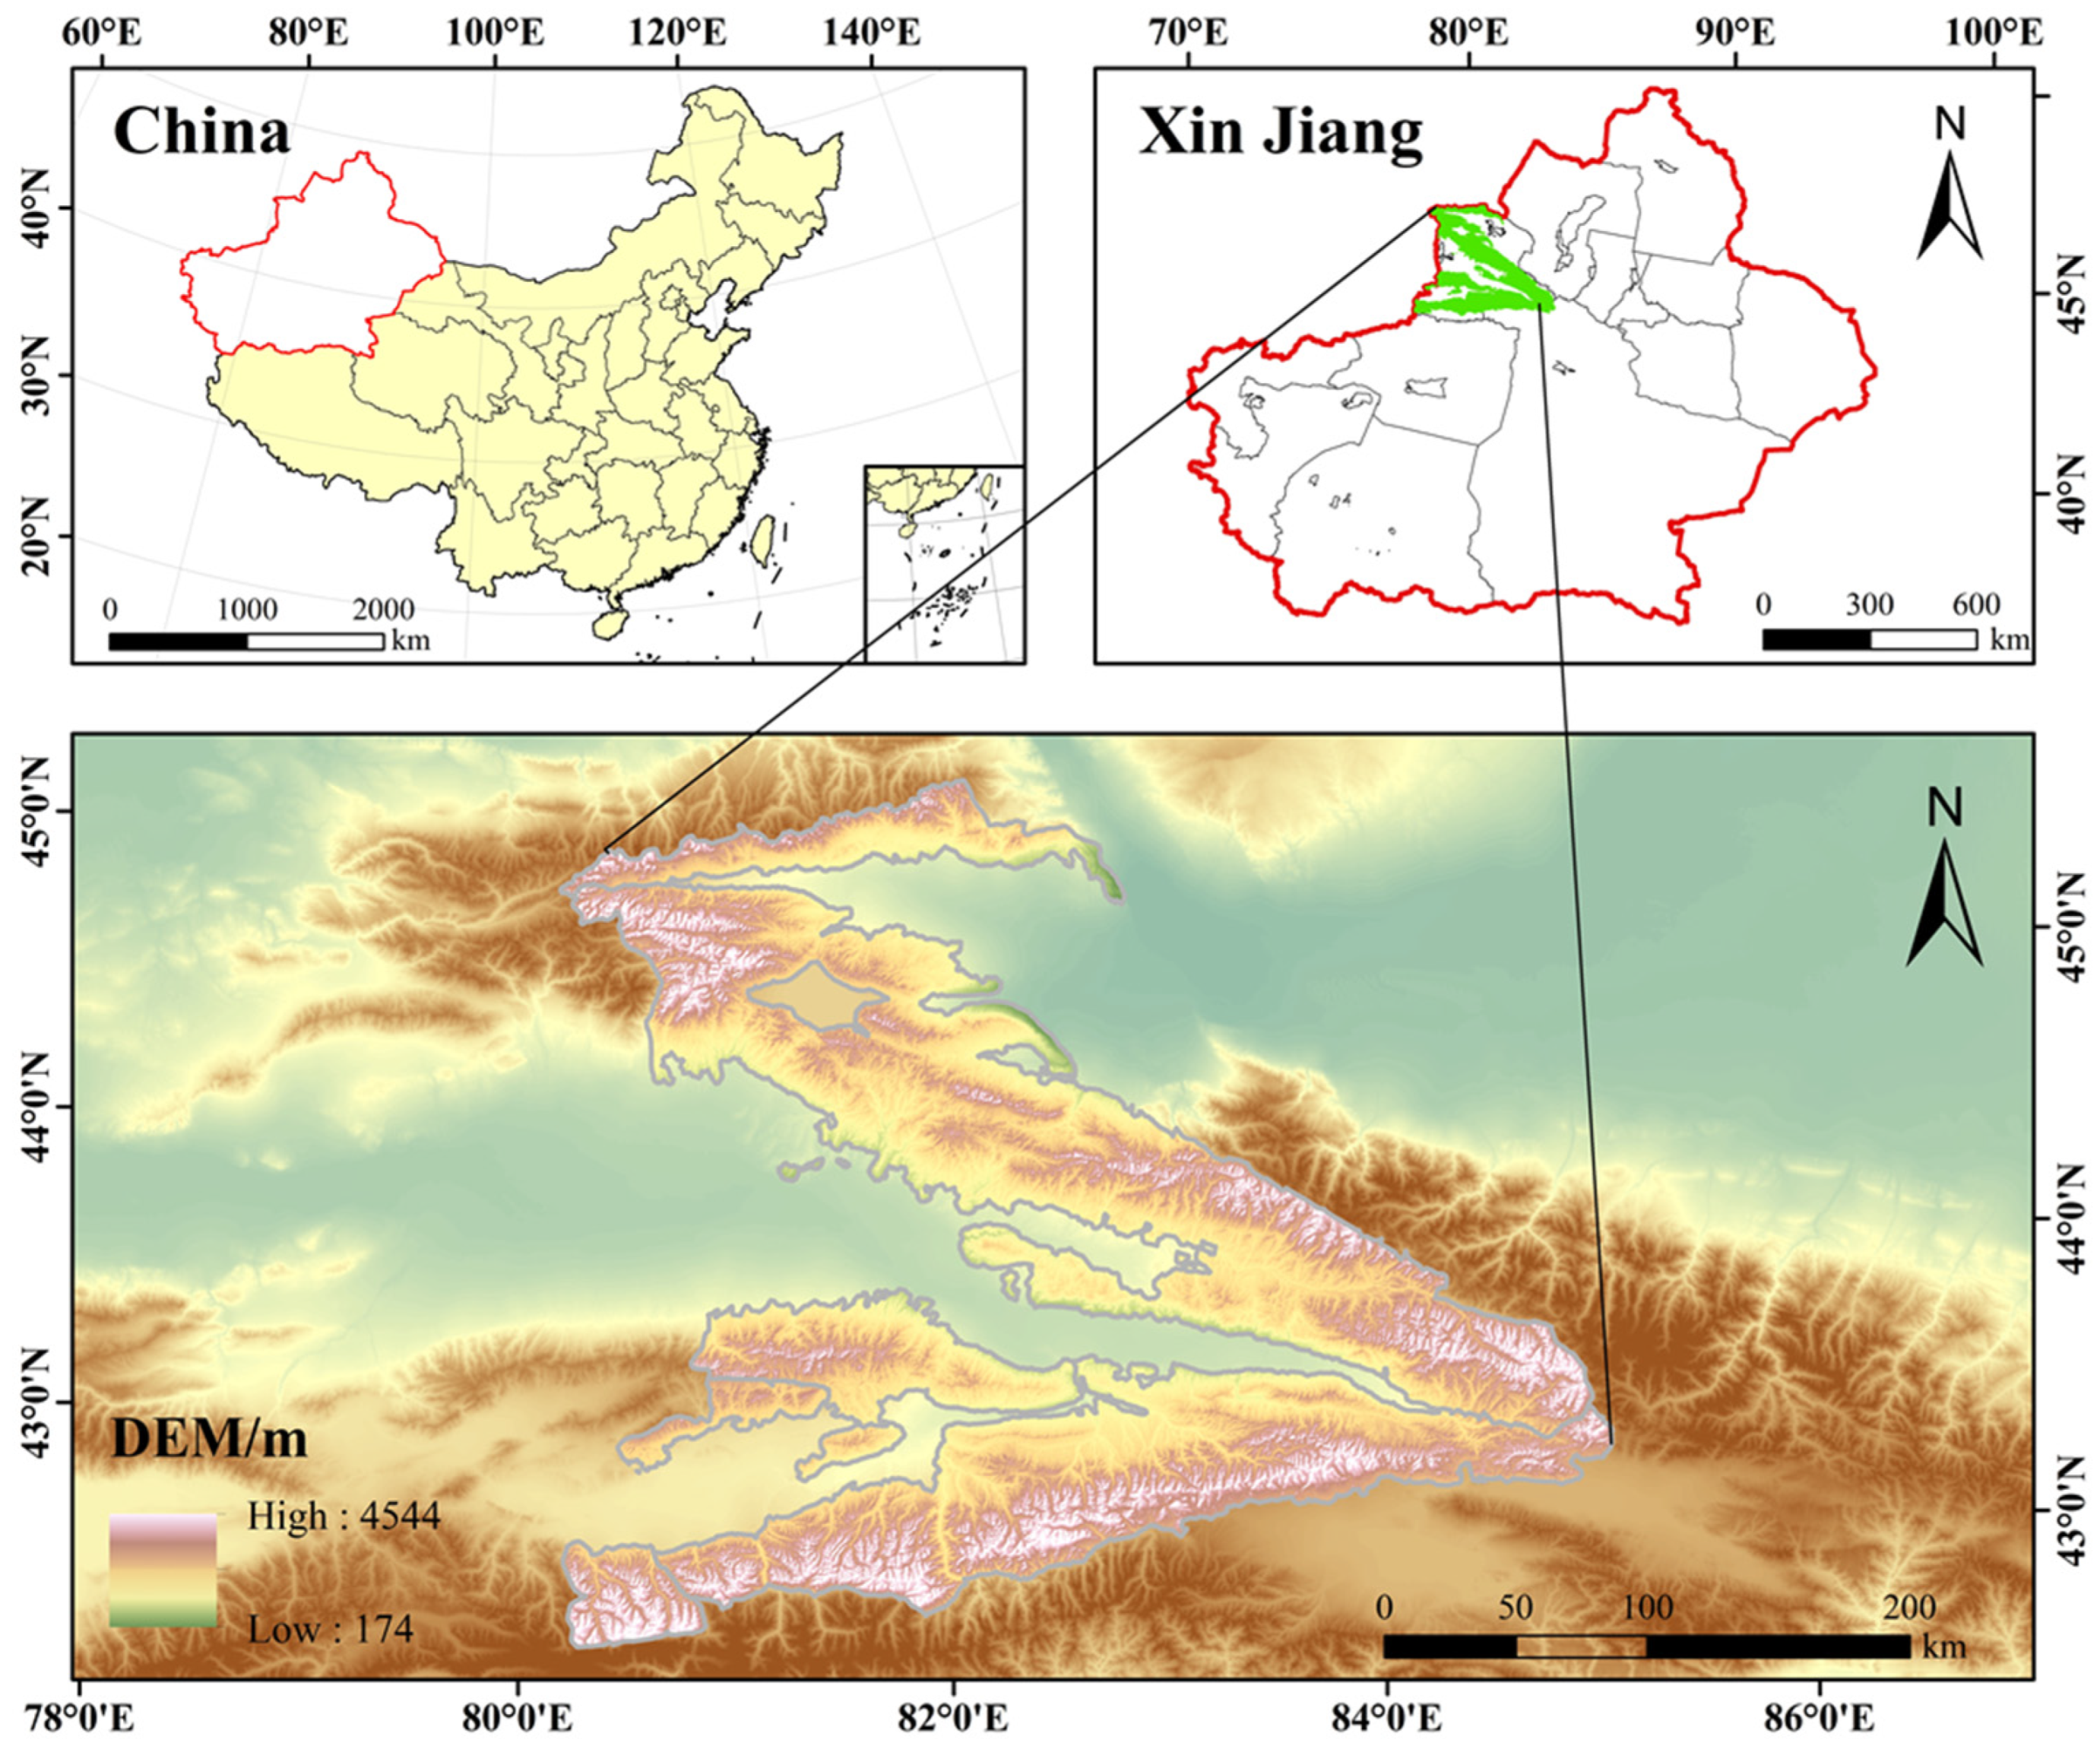
2.1. Study Area

This study area is located in the Tianshan region within China in the western part of the Tianshan mountains (45°26′ N–42°19′ N, 79°52′ E–85°00′ E), along both sides of the Tianshan Mountains, with elevations ranging from 174 m to 4544 m. The woodlands are mainly distributed in nine subdistricts of the Xinjiang region, namely, Chabchal, Gongliu, Hocheng, Mengmala, Nilgak, Teixu, Xinyuan, Yining, and Zhaosu. The mountains in this area are crisscross and shaped like a trumpet that intercepts the moist air flow in the west, ensures sufficient snow water supply, and is less disturbed by the outside world. The Picea schrenkiana var. tianschanica grows thickly, which is favorable for forestry (Figure 1).

2.2. Data Sources

The remote sensing data used in this study are the August 2015 and September 2022 GF-1 PMS data from (https://data.cresda.cn/ accessed on 25 February 2024). The original GF-1 PMS data have a multi-spectral image with a spatial resolution of 8 m, and the image has four bands of red, green, blue, and near infrared [36]. In order to reduce the effect of cloud and snow caused by high latitude and high altitude, we selected the June–September images to reduce the area of the region covered by ice and snow. The DEM data are derived from (https://srtm.csi.cgiar.org/ accessed on 25 February 2024), and image spatial resolution is 30 m, which was measured jointly by the National Aeronautics and Space Administration (NASA) and the Department of National Imagery and Mapping Agency (NIMA) and became publicly available in 2003. The validation data are a combination of forest resource inventory and planning data provided by the western state-owned forest administration of Tianshan mountain in Xinjiang Uygur autonomous region and used for visual interpretation. The time of forest resources inventory and planning data correspond to the year of the remote sensing image.

2.3. Data Preprocessing

The GF-1 PMS data used in this study belong to the first-level product data and require pre-processing [37]. The ENVI 5.3 software is used to perform radiometric calibration and atmospheric correction on the images to eliminate errors caused by the atmosphere and the sensor and to improve the image quality. Then, orthorectification and image registration are performed. Geometric distortions due to atmospheric refraction and curvature of the earth that affect the true coordinate information of the object are eliminated, and finally the image is cropped to obtain the desired area image. Considering the growth elevation of Picea schrenkiana var. tianschanica and the influence of cloud and snow cover and occlusion in the image, sample areas were selected through visual interpretation and forest resources inventory and planning data. Using 2015 and 2022 images as base maps, mixed samples were produced in three different areas, and Picea schrenkiana var. tianschanica and other land types were manually classified with ArcGIS 10.8 software using visual interpretation to produce area labels. Following the manual classification process, the vector data were converted to raster data with the same resolution as the GF-1 PMS image, with Picea schrenkiana var. tianschanica assigned a pixel value of 0 and other types assigned a pixel value of 1. Python program is used to crop the image and the corresponding labels to 256 × 256 pixel size and apply the labels to the image [38,39]. Data enhancement is performed by flipping the image horizontally and rotating it at different angles to construct the dataset and removing the images with pixel values of NODATA to prevent interference. The dataset was separated 4:1 according to the training and validation sets. In total, 5715 images remained, of which 4572 images were used for the training set, and 1143 images were used for the validation set (Figure 2).

2.4. Research Methodology

This section details the backbone network and modules used. The backbone network used in this paper is U-Net, which is combined with the convolutional block attention module and dual cross-attention module to identify Picea schrenkiana var. tianschanica by comparing other models and performing an ablation study in order to assess the performance of the network model on the self-made dataset. In addition, the advantages of the model and the distribution of and changes in the Picea schrenkiana var. tianschanica were analyzed

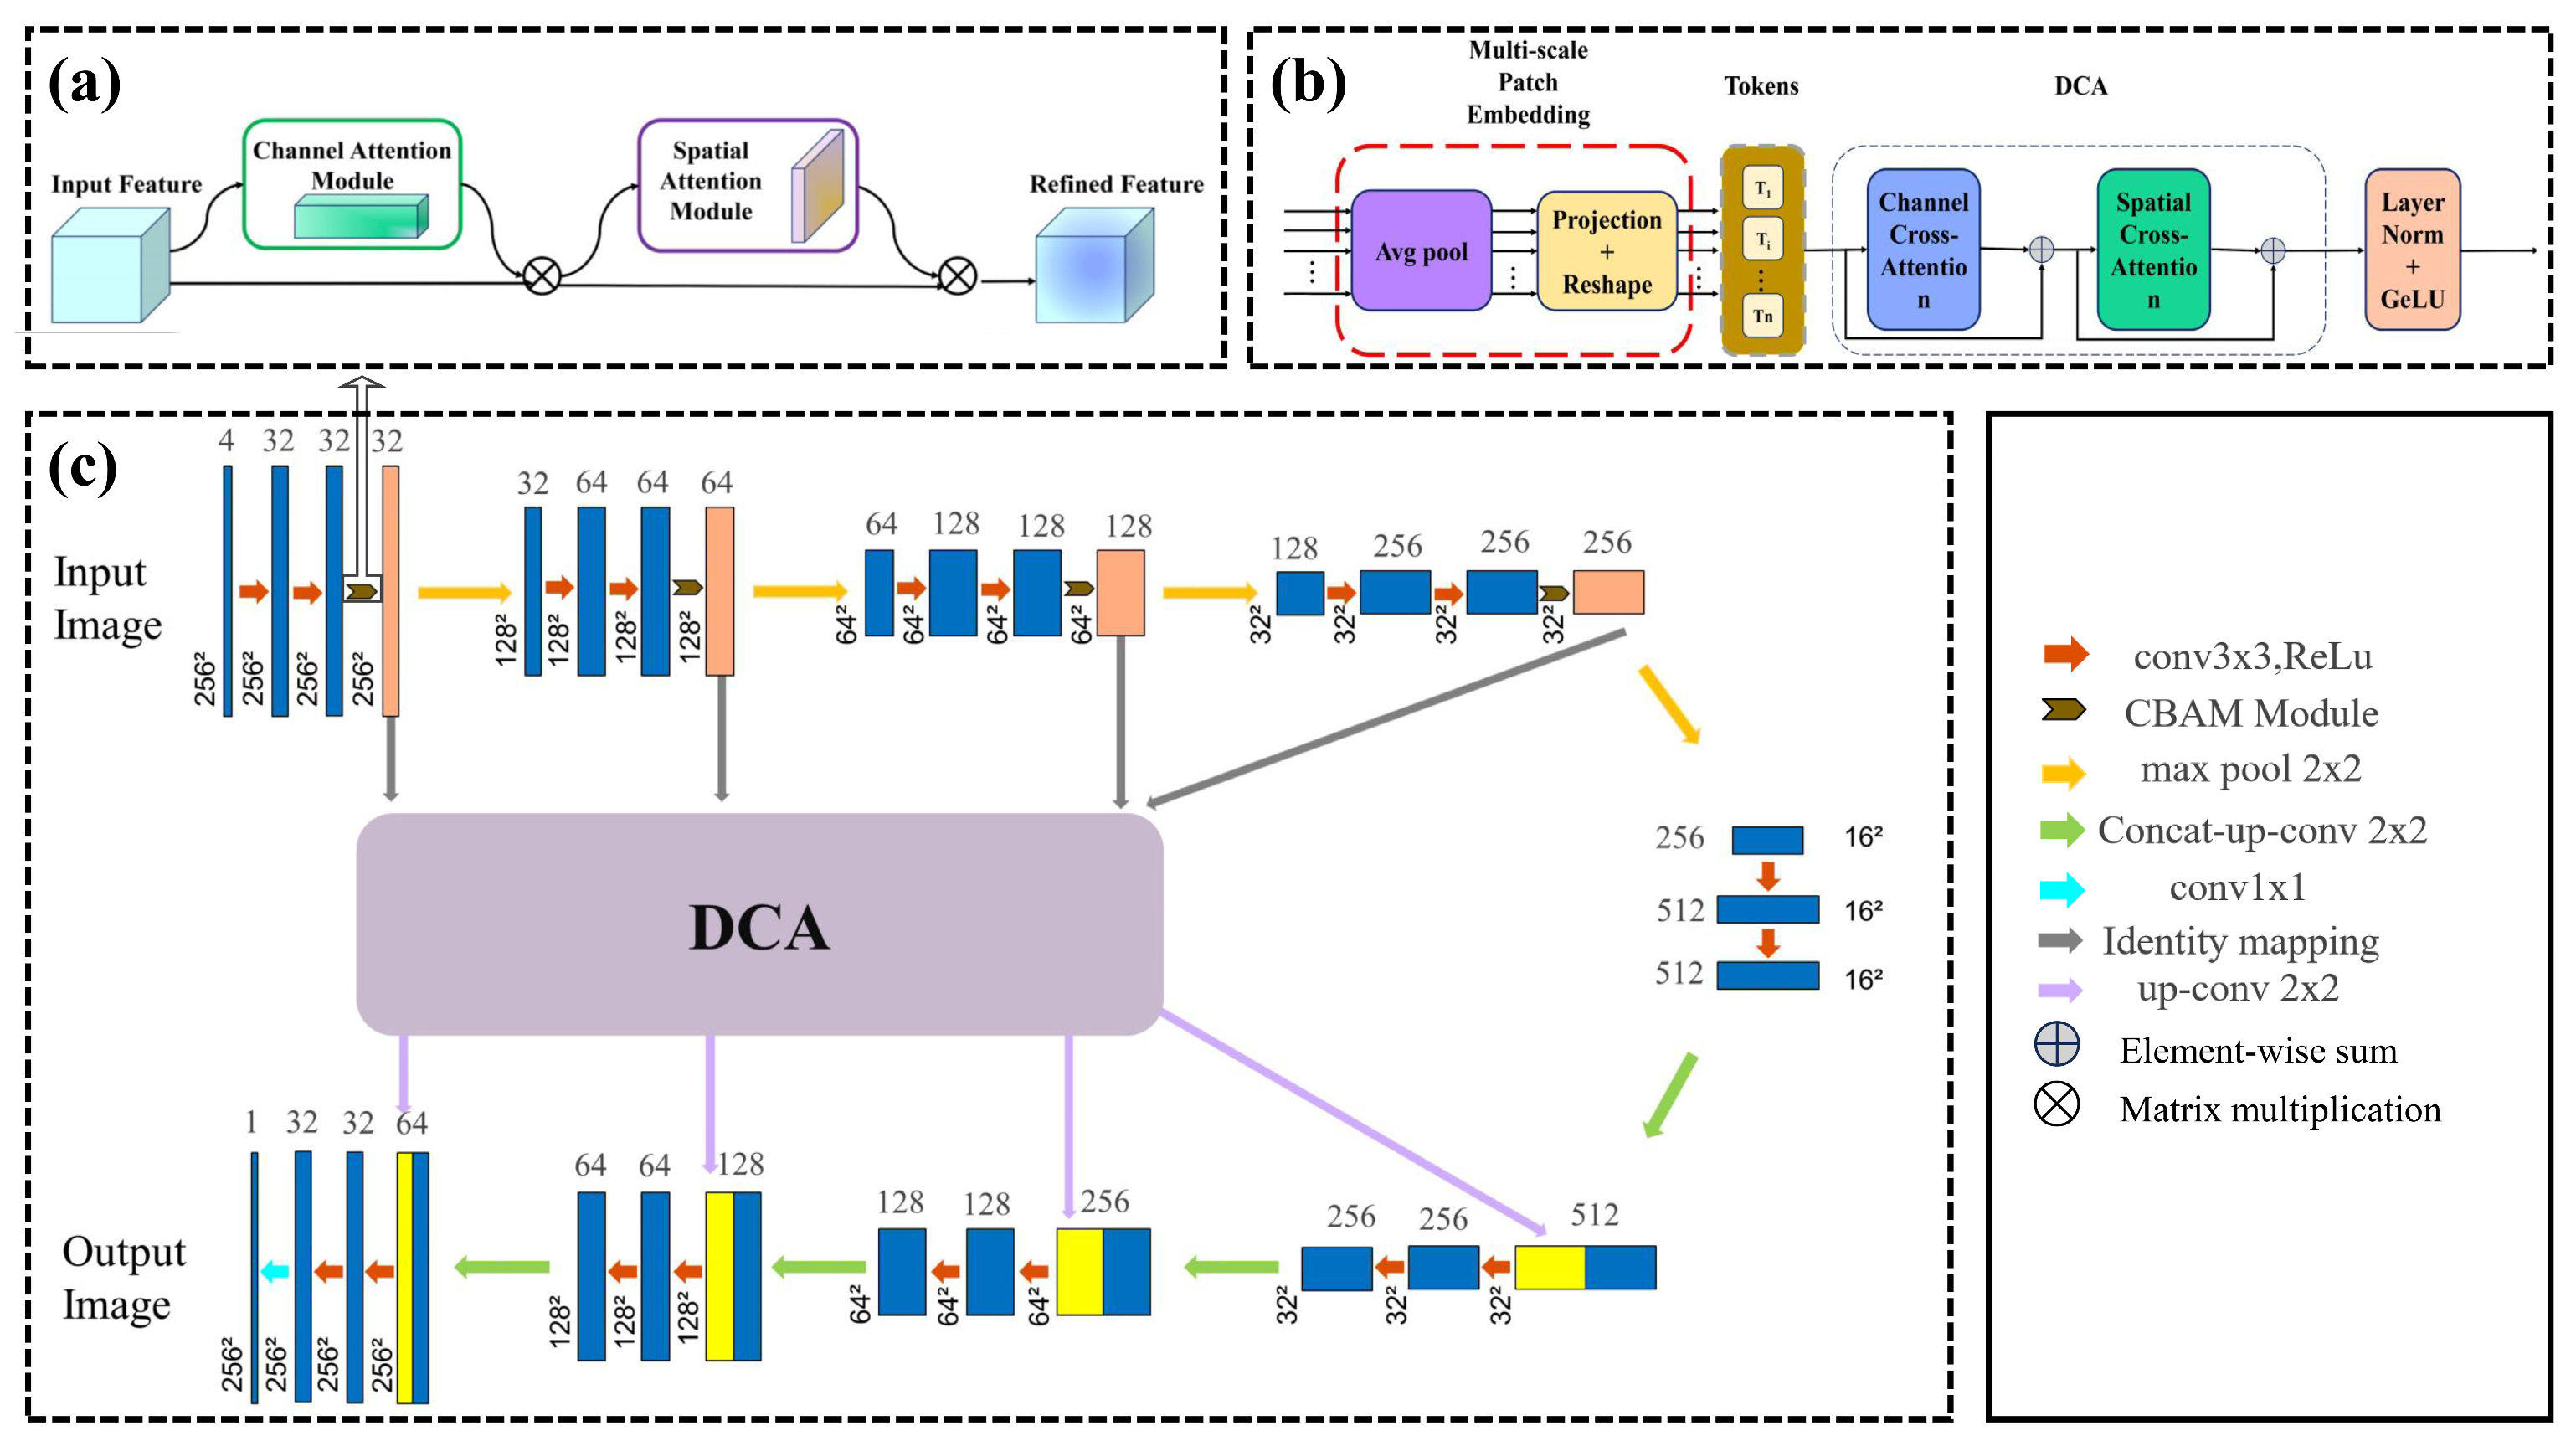
2.4.1. Convolutional Block Attention Module

The convolutional block attention module (CBAM) is a lightweight attention mechanism in the field of deep learning designed to enhance the modelling and representation of image features using convolutional neural networks. It can perform attention operations in both spatial and channel dimensions, enabling the model to dynamically adjust the weights of the feature map to adapt to different tasks and scenarios. CBAM contains two sub-modules, including the channel attention module (CAM) and spatial attention module (SAM) (Figure 3), which help the network to pay more attention to the feature region of the object from the channel and space to improve the classification accuracy and better adapt to different image features. Therefore, we add the CBAM module between the subsampled convolution and the activation function, which directly affects the weight assignment of the extracted features after the convolution operation. This enables the module to act directly on the convolution output, directly affect the feature representation ability, focus more precisely on the important regions or feature channels in the input, and thus optimize the processing of the subsequent activation function. Thus, the dichotomous classification can focus more on the target itself, resulting in better performance in the acquisition of Picea schrenkiana var. tianschanica boundaries and features.
M C ( F ) = σ ( M L P ( A v g P o o l ( F ) ) + M L P ( M a x Pool ( F ) ) )
M S ( F ) = σ ( f 7 * 7 ( [ Avg Pool ( F ) ; M a x P o o l ( F ) ] ) )
Here, M C F is the CAM module, M s F is the SAM module, f 7 * 7 is the convolution kernel of 7 × 7 used for the convolution operation, and F is the feature map.
Figure 3. Diagram of each attention sub-module. As illustrated, the channel sub-module utilizes both max-pooling outputs and average-pooling outputs with a shared network; the spatial sub-module utilizes two similar outputs that are pooled along the channel axis and forward them to a convolution layer.
Forests 15 02039 g003

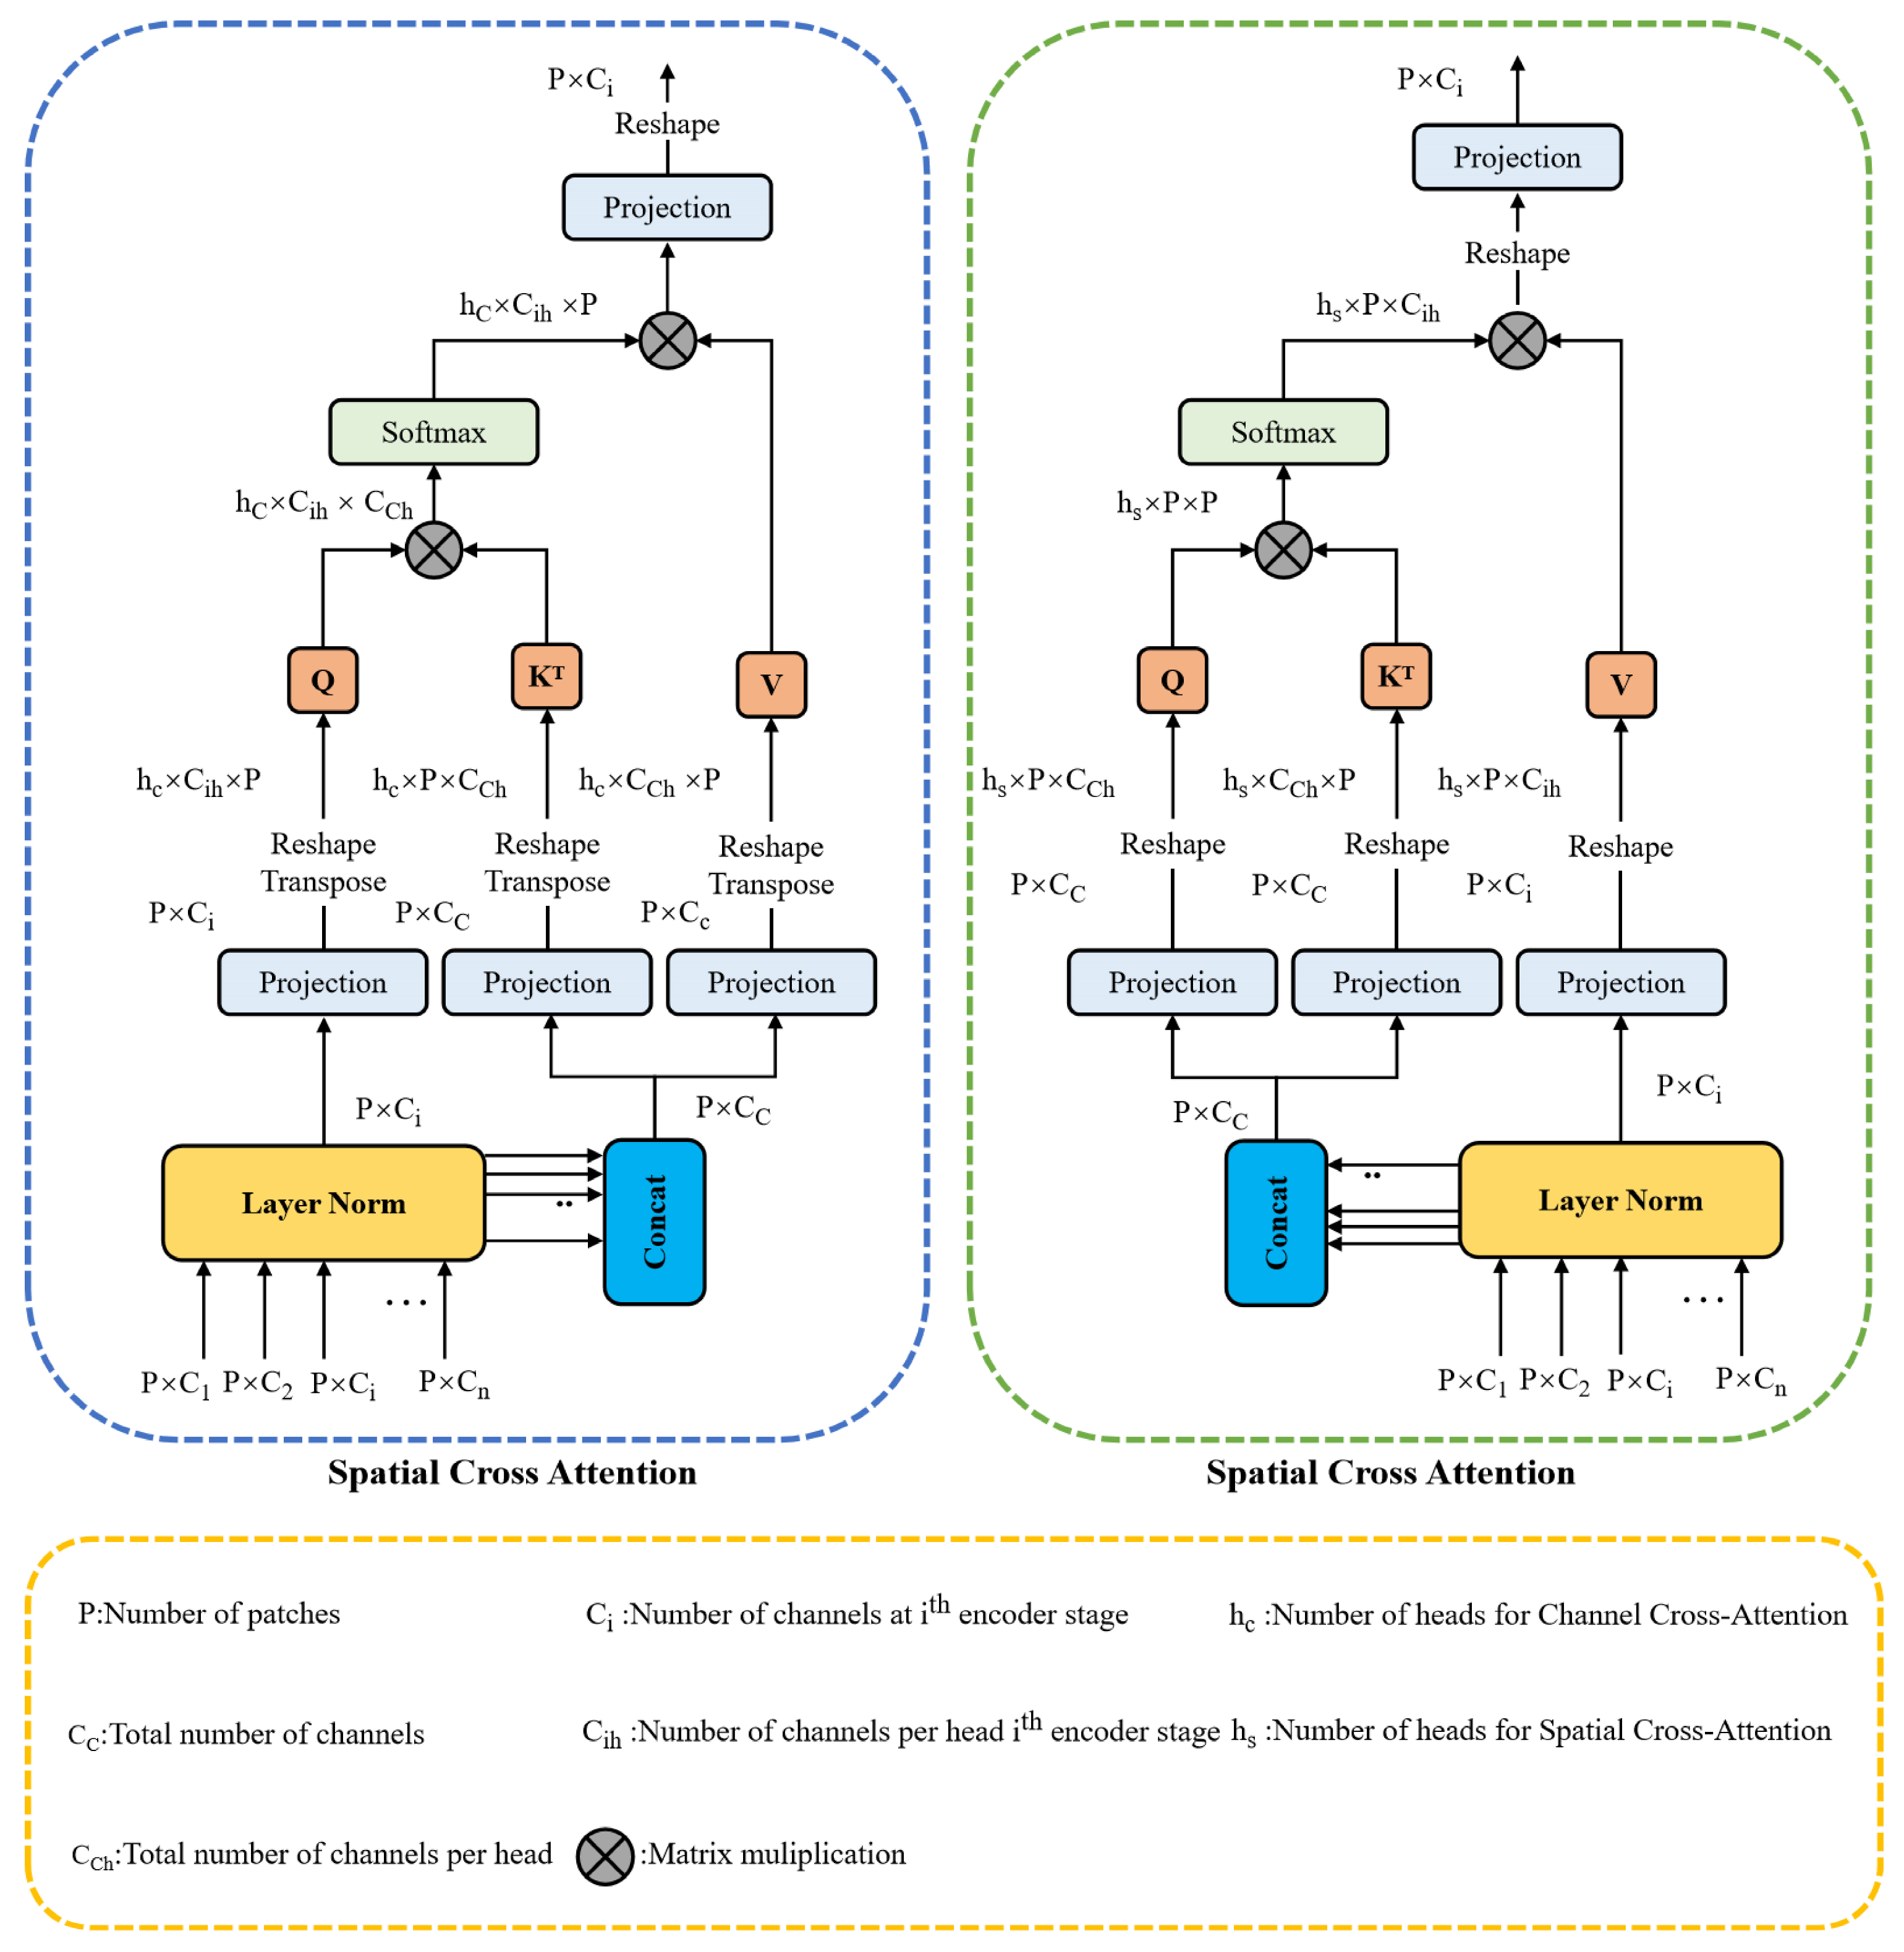
2.4.2. Dual Cross-Attention

Dual cross-attention (DCA) is a simple and efficient attention module proposed in 2023 by a team of researchers at the University of Miami to simply and efficiently enhance skip connections in U-Net structures with slight increases in parameters and complexity. The DCA module components are primarily channel cross-attention (CCA) and spatial cross-attention (SCA) (Figure 4). The encoder tokens are first obtained through the composition of multiscale block embedding modules. The CCA module extracts global channel dependencies by using cross-attention across channel tokens of multiscale encoder features. The SCA module performs cross-attention to capture spatial dependencies across spatial tokens in order to capture remote dependencies, and these fine-grained encoder features are upsampled and connected to their corresponding decoder sections in order to form a skip connection scheme. The semantic gap between encoder and decoder features is addressed by sequentially capturing the channel and spatial dependencies between multi-scale encoder features. Using this connection helps to optimize the feature fusion process, allowing the network to make full use of the feature information at different levels, thus improving the model performance while maintaining a simple network structure.
CCA ( Q i , K , V ) = S o f t max Q i T K C C V T
S C A ( Q , K , V i ) = S o f t max Q K T d k V i
Here, Qi and Q representing the queries, K is representing keys, Vi and V are representing values, 1 C c and 1 d k are the scaling factor.
Figure 4. Diagram of each attention sub-module. As illustrated, the CCA module first extracts a patch from each encoder stage for layer normalization. Then, the module splices it along the channel dimension, processes the output of the cross-attention using depth separable convolution, and feeds it into the SCA module. The SCA module is given the processed output of the CCA module, processes it along the channel dimension. The layer is normalized and spliced, and the output of SCA is processed using depth separable convolution to obtain the output of the final DCA.
Forests 15 02039 g004

2.4.3. U-Net Model

The U-Net model is a modified fully convolutional network (FCN) structure (Figure 5). The model consists of a compressed channel on the left side and an extended channel on the right side [40,41]. The convolutional layer and pooling layer are used for feature extraction, and the deconvolution layer is used to restore the image size. Using the encoder–decoder structure, the feature information in the image can be efficiently extracted by subsampling and upsampling operations, and the feature information can be mapped back to the spatial dimensions of the original image in the decoding stage. In addition, the U-Net model introduces skip connections to connect features between the encoder and decoder, which helps to improve the segmentation accuracy of the model. Compared to other deep learning models, the U-Net model has fewer parameters, which allows it to be trained in a shorter period of time and to achieve better performance on limited training data. Therefore, we improve on this basis in subsampled and skip connections, expecting to improve the accuracy of the model.

2.4.4. Multiple Mixed Attention U-Net

In this study, we propose an multiple mixed attention U-Net (MMA-U-Net) model by adding the CBAM attention mechanism and DCA attention mechanism to the U-Net model as the base model framework (Figure 6). This model dynamically adjusts the weights of the feature maps by adding the CBAM module to the input feature maps in the process of downsampling, weighting the input feature maps in both the channel and spatial dimensions. Thus, the network pays more attention to the important features, reduces the interference of redundant information, and improves the performance without increasing the complexity of the network. The DCA module is used instead of skip connection, and the global channel dependency is extracted by cross-channel token cross-attention of multi-scale encoder features using the channel cross-attention part of the module. The spatial cross-attention part of the module performs the cross-attention to capture spatial dependencies across spatial tokens, which solves the problem of the skip connection in connecting encoder and decoder features. The semantic gap caused by the localization of the convolution fails to capture long distance dependencies between different features. This allows the network to focus on key regions in the input image and allocate more computational resources to them, which helps the network to understand the interactions and dependencies between the different channels and thus better represent the features of the input image.

2.4.5. Accuracy Evaluation Metrics

In order to be able to demonstrate the semantic segmentation capability of the improved model in this paper, the SE-U-Net [42], ResU-Net [43], and ECA-U-Net [44] models are used to validate the improved model proposed in this paper based on comparisons using the same dataset. To quantitatively assess the effectiveness of the method proposed in this study, we chose five metrics, including accuracy, recall (R), precision (P), F1 score, and mean intersection over union (mIOU), to provide a comprehensive evaluation of recognition accuracy [45]. To analyze the results, we use the visual interpretation as the true value and the predicted results of the model as the predicted value to finally calculate the accuracy based on pixel counts. The expression is as follows:
Accuracy = TP + TN TP + TN + FP + FN
Re call = TP TP + FN
Pr ecision = TP TP + FP
F 1 Score = 2 PR P + R
m I O U = 1 K + 1 i = 0 K T P F N + F P + T P
where R is the recall, P is the precision, TP is the correct classification of the model to the target category, TN is the correct classification of the model to the non-target category, FN is the wrong classification of the model to the non-target category, and FP is the wrong classification of the model to the target category.

2.4.6. Spatial Distribution Analysis of Picea schrenkiana var. tianschanica

As a dominant tree species in the Tianshan mountains, Picea schrenkiana var. tianschanica forms montane coniferous forests along the mountain ranges, with suitable growth areas ranging from 1500 to 2800 m in the mid to low mountain forest-steppe zone to the subalpine sparse forest zone. This paper is based on the division of the vegetation vertical zone spectrum in some areas of the Tianshan mountains by Zhang Xinshi et al. [46], with some modifications. The altitude of this study area is 174–4544 m, and Arc Map10.8 is used to divide the research into six vegetation vertical zones, namely, the area below the middle and low mountain forest grassland zone below 150–1500 m, the middle and low mountain forest grassland zone between 1500 m and 1700 m, the middle mountain forest meadow zone between 1700 m and 2250 m, the upper Nakayama forest meadow zone between 2250 m and 2550 m, the subalpine sparse forest belt between 2550 m and 2700 m, and the subalpine sparse forest belt above the area between 2700 m and 4600 m.

3. Results

3.1. Experimental Parameter Setting

A desktop computer with Windows 11 operating system, pytorch 1.13 framework with Python 3.7, processor Intel (R) Xeon (R) Silver 4210R CPU @ 2.40 GHz, GPU NVIDIA RTX A5000, and 24 G of computer graphics memory was used for the experiments. The model training optimizer selects the SGD algorithm with an initial learning rate of 0.01, momentum of 0.9, batch size set to 8, and the number of iterations (epoch) to 250 rounds.

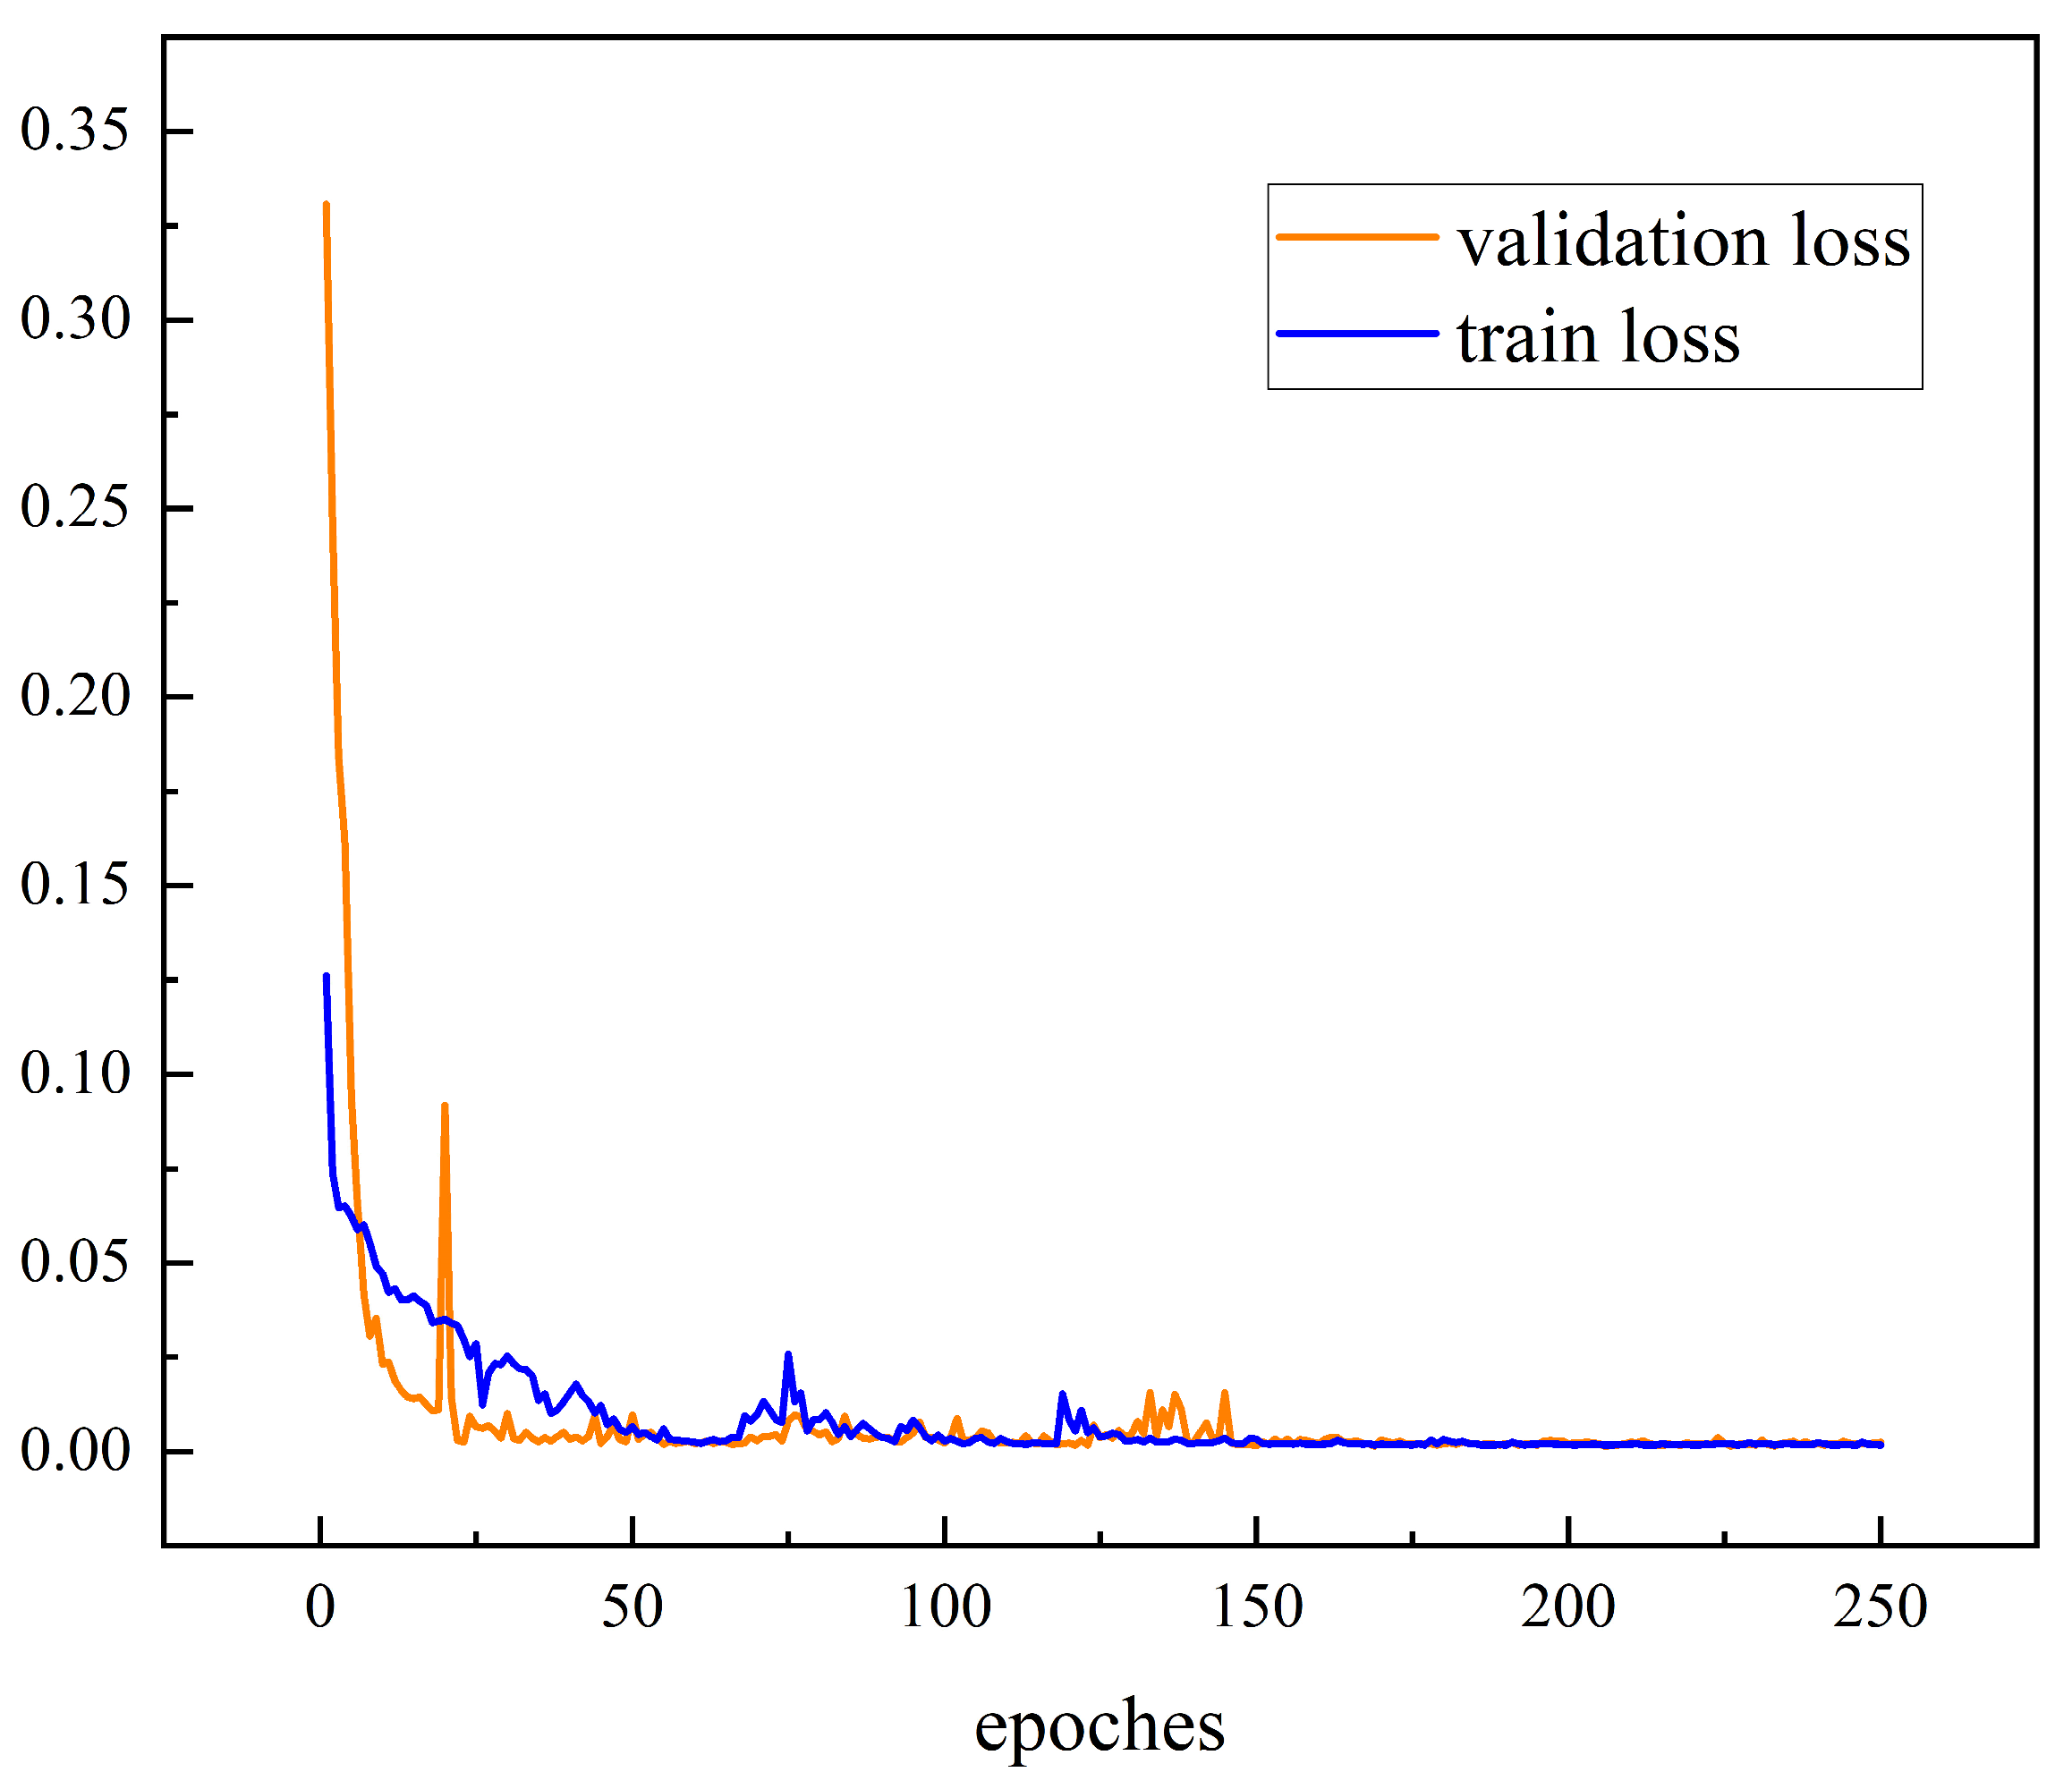
3.2. Loss Assessment

In order to reflect the dynamic trend of network training and understand whether the model converges and overfits, loss curves are used to evaluate the performance of the model (Figure 7). If the model is overfitted, then the validation loss curve will become higher as the training loss curve becomes lower. Overfitting may exhibit erratic performance fluctuations during training, and the model may cause its performance on the validation or test set to fluctuate as it tries to fit every detail of the training data. In the first round of training, the loss value of the training set differs greatly from the loss value of the verification set, indicating that the model has not completed the learning. After the 150th training round, the two loss curves dropped to the same level and remained stable, indicating that the model training was completed.

3.3. Ablation Experiment

In order to verify that the proposed method in this paper has improved the accuracy, ablation experiments are designed for comparative analysis. The CBAM module and DCA module are added to the U-Net model in turn, using the same configuration parameters and training environment. The results from the model segmentation accuracy show (Table 1) that the initial U-Net model is inferior to the model with the addition of the attention mechanism module in all evaluation metrics. In contrast, after using DCA module and CBAM module, separately, we can see the relative improvement of evaluation indicators. The accuracy, recall, precision, and F1 score increased by 6.37%, 8.64%, 10.76%, and 10.88%, respectively, after the CBAM module was added, and mIOU increased by 1.8%. The accuracy, recall, precision, F1 score, and mIOU accuracy of the added DCA module are improved by 6.57%, 8.38%, 10.31%, 10.37%, and 1.6%, respectively. Comparing the two modules added, the added DCA module is higher in accuracy than the added CBAM module. The rest of the evaluation indexes are lower than the CBAM module, and the accuracy is not much different, both within 1%. The segmentation performance and accuracy of the network model are significantly improved compared to the original U-Net model network model with the addition of both the DCA module and the CBAM module. After adding both the DCA module and CBAM module, the segmentation performance and accuracy of the network model are significantly improved compared to the original U-Net model network model. The accuracy, recall, precision, and F1 score were improved by 11.45%, 16.20%, 15.46%, and 12.42%, respectively, and mIOU was improved by 10.0%. This indicates that the DCA module and CBAM module adopted in this paper can extract the image features more adequately, retain more complete semantic information, and can better extract the area and boundary of Picea schrenkiana var. tianschanica.
In order to verify the generalization ability of the model, three validation regions, namely, urban and mountainous areas where Picea schrenkiana var. tianschanica grow densely, are selected in this paper. From the prediction results (Figure 8), it is observed that the initial U-Net model has a more serious loss of some features in the Picea schrenkiana var. tianschanica extraction, and there is a situation that the Picea schrenkiana var. tianschanica cannot be recognized. With the addition of the CBAM module alone, Picea schrenkiana var. tianschanica extraction was more complete, but some misclassification occurred. After adding the DCA module alone, the results show that there is no misjudgment, but the extraction is incomplete at the small boundary. By adding the DCA module and CBAM module at the same time, it can be observed that the prediction results are basically comparable to the labels, making full use of the extraction of image feature information by each module, and showing good results in terms of boundary information and feature recognition of Picea schrenkiana var. tianschanica.

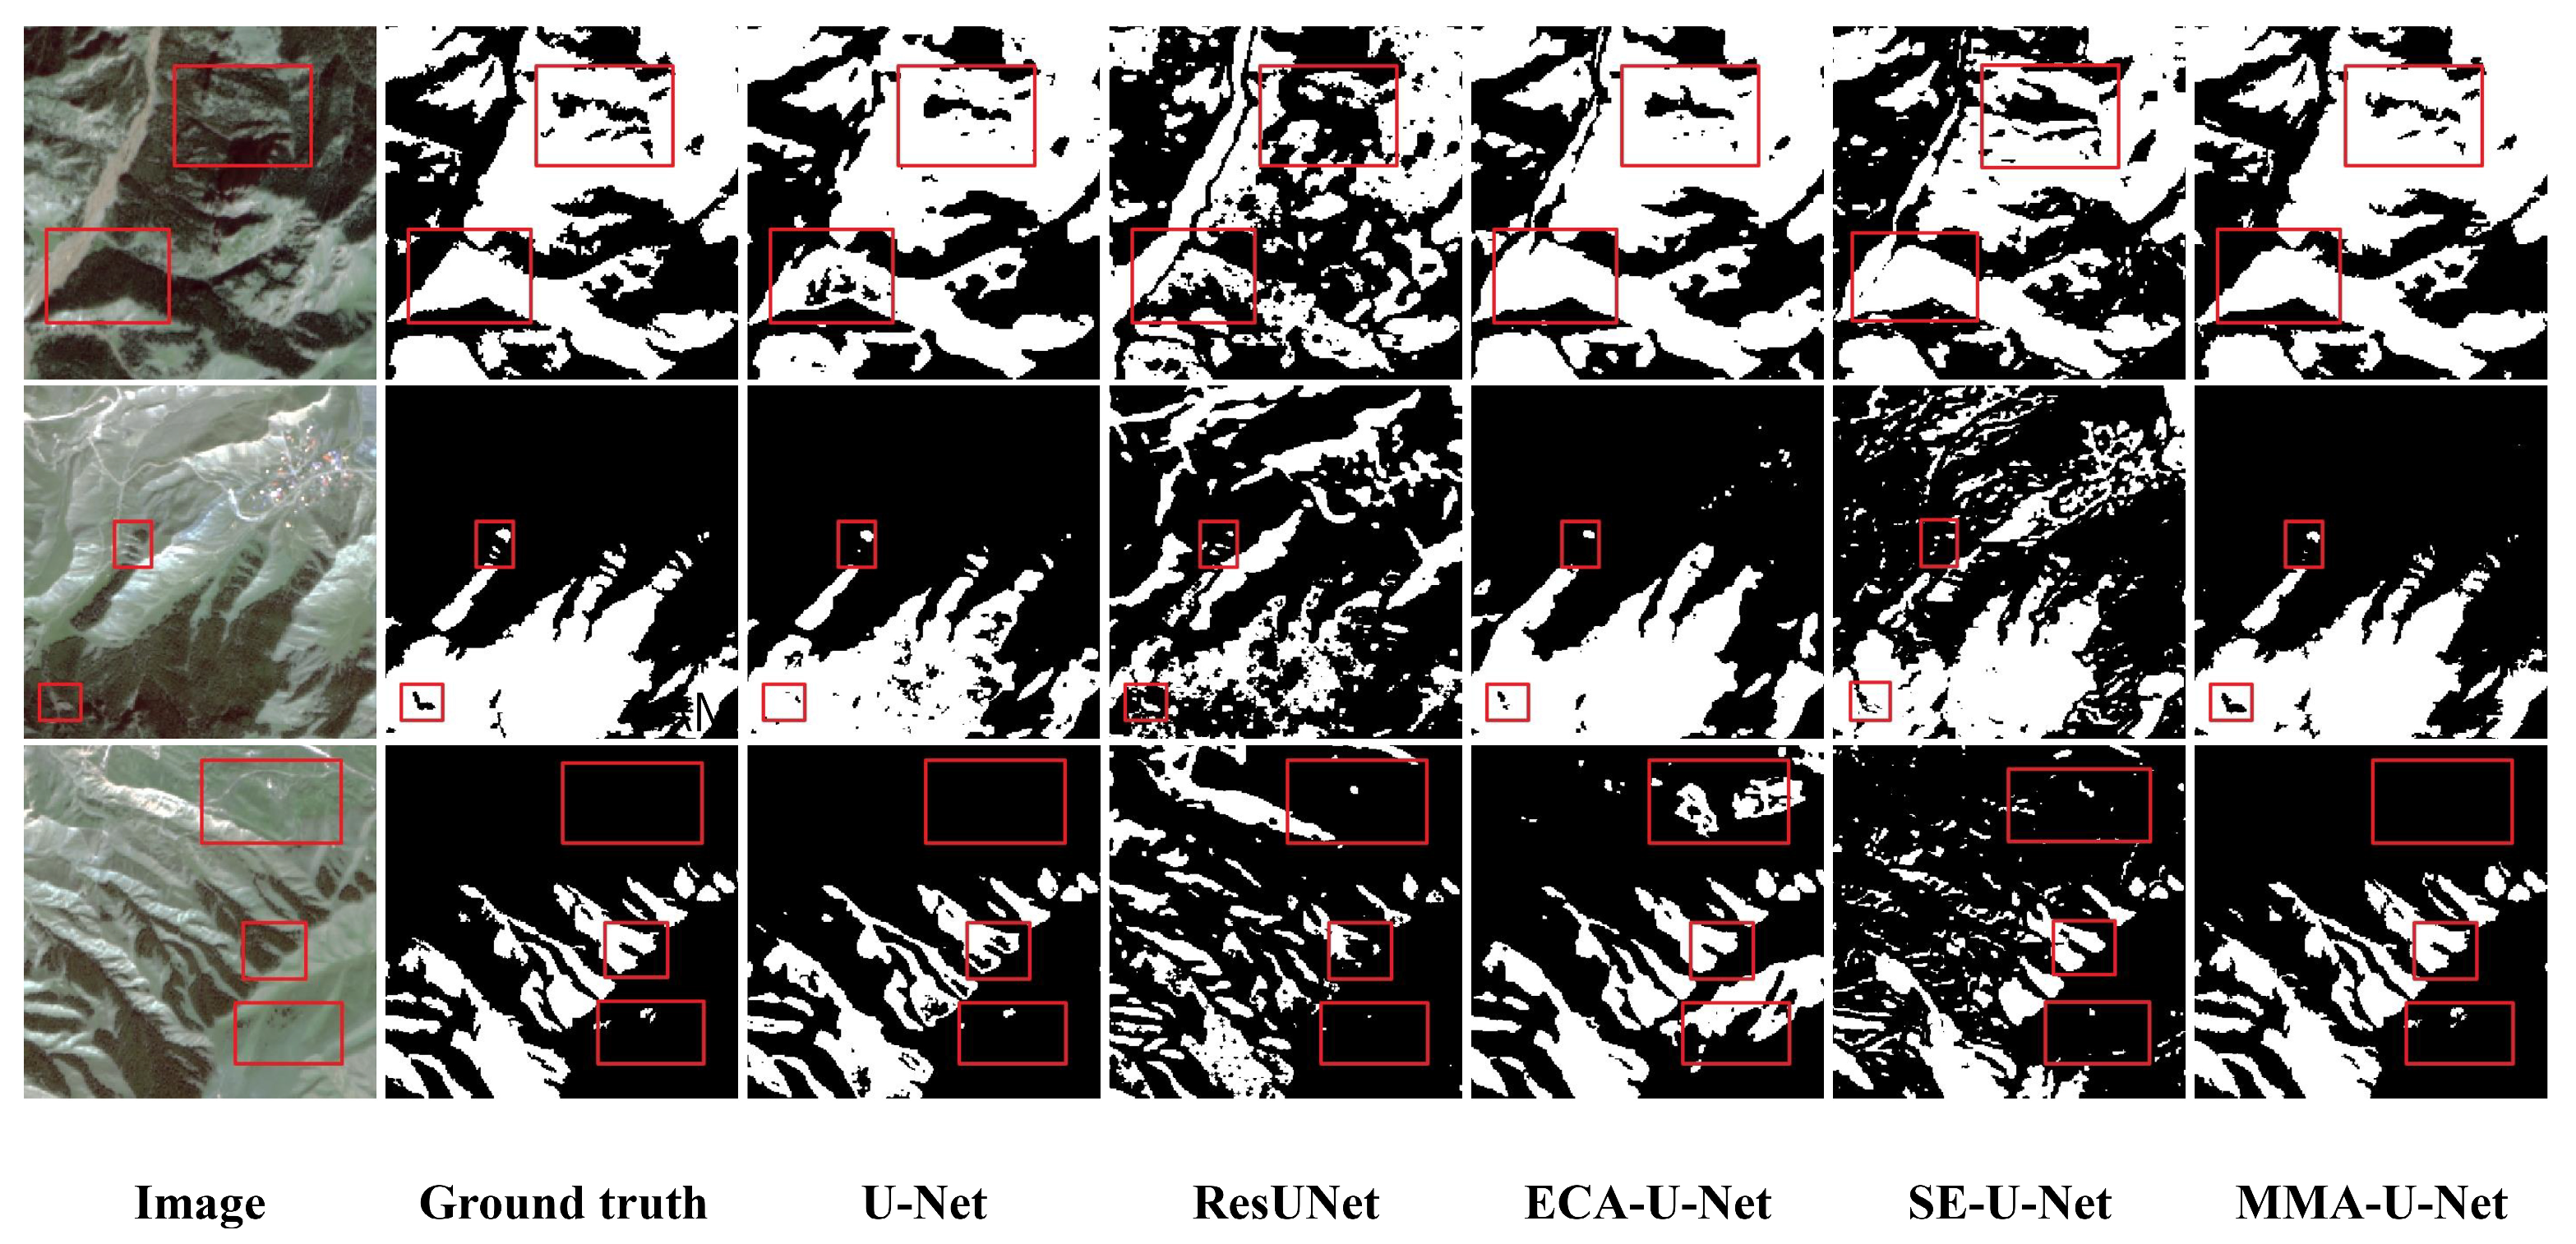
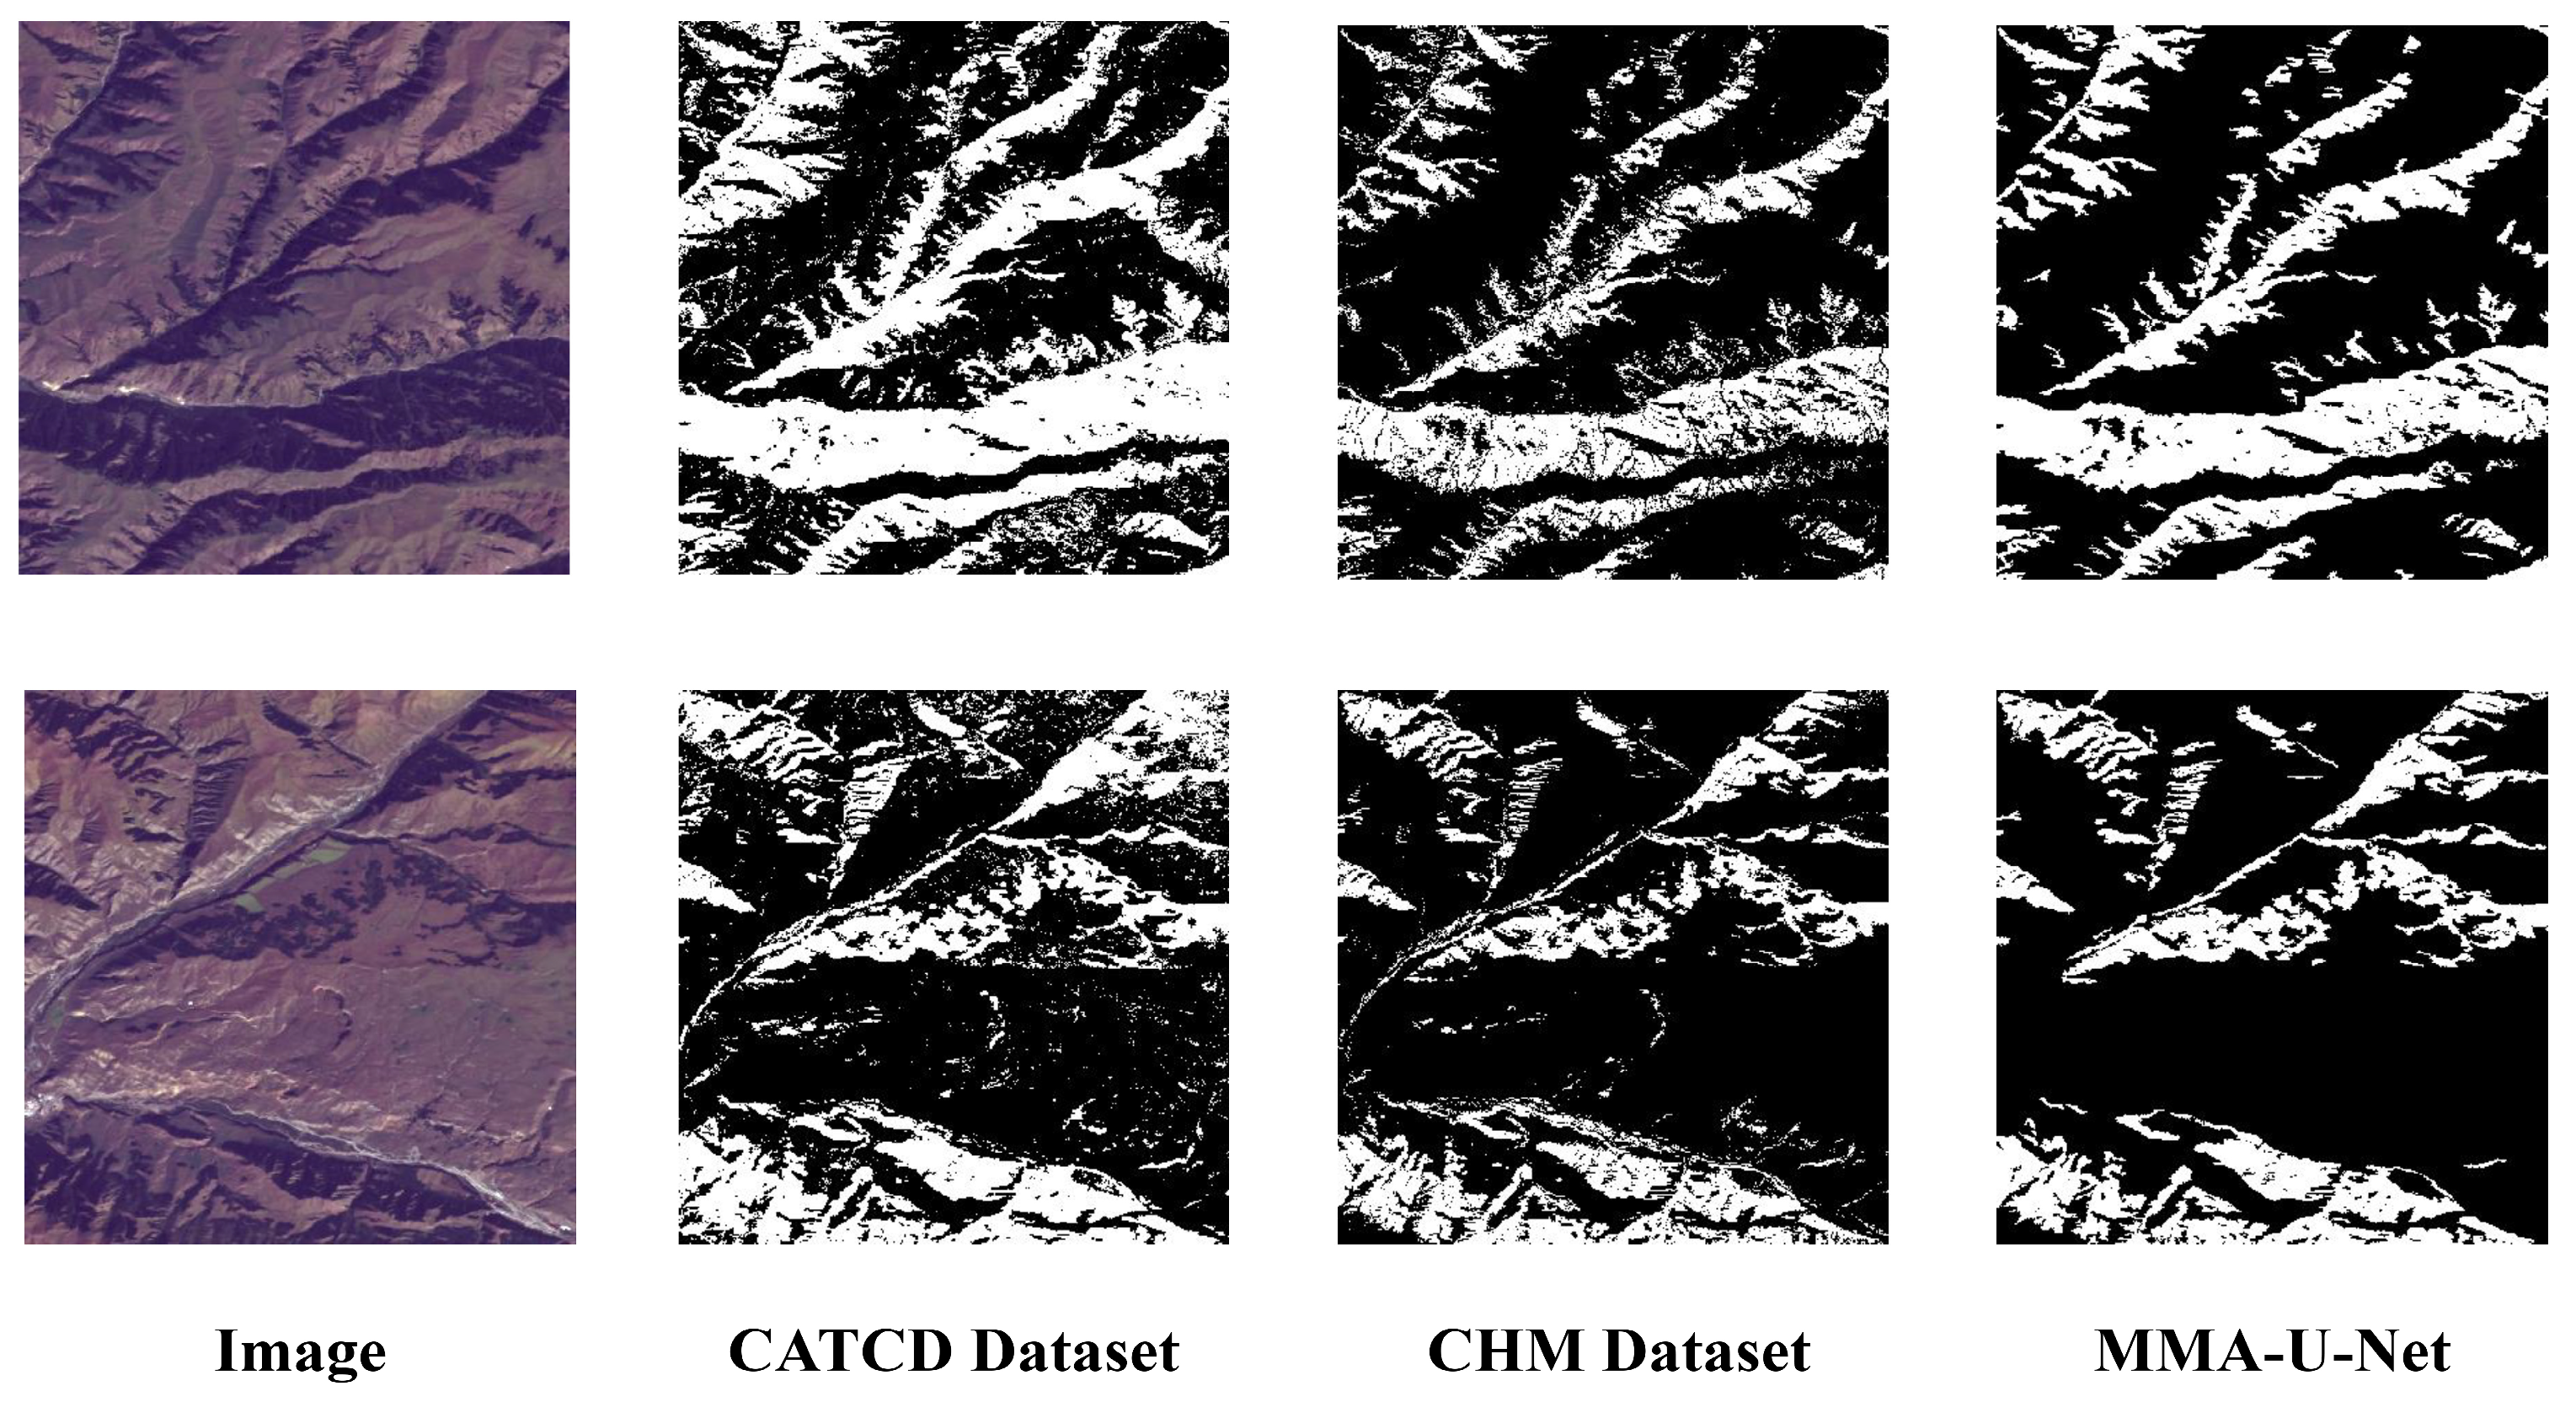
3.4. Comparison of Different Methods

The model proposed in this paper has a significant improvement in extraction capability compared to other models (Table 2). All evaluation metrics are the highest, followed by the ECA-U-Net model. ResU-Net performs the worst and is at the bottom of all evaluation metrics. Compared to the SE-U-Net, ResU-Net, and ECA-U-Net models with other attention mechanisms added, the accuracy of the method in this paper is 10.29%, 19.84%, and 5.42% higher; the recall is 10.72%, 20.08%, and 11.73% higher; the precision is 12.29%, 22.65%, and 11.97% higher; the F1 score is 11.97%, 20.35%, and 10.13% higher; and mIOU is 8.9%, 9.1%, and 9.00% higher, respectively. However, regarding the prediction time for a single picture, the U-Net network is the fastest, and the MMA-U-Net network is the slowest due to its complex structure and many modules.
As can be seen from Figure 9, the extraction of Picea schrenkiana var. tianschanica using the SE-U-Net model in the verification area was mottled, and the Picea schrenkiana var. tianschanica only has basic shapes. Thus, the extracted boundary details and the integrity of the Picea schrenkiana var. tianschanica area are not good. There is a big difference between the area of Picea schrenkiana var. tianschanica extracted by ResU-Net and the label, which basically cannot identify Picea schrenkiana var. tianschanica, and there are a lot of wrong identification phenomena. ECA-U-Net has a good effect on edge details and can roughly extract Picea schrenkiana var. tianschanica. However, misclassification occurs, and other woodlands are classified as Picea schrenkiana var. tianschanica. In comparison, the proposed method has the best performance, and the extracted Picea schrenkiana var. tianschanica has higher segmentation accuracy and edge information than the other models.

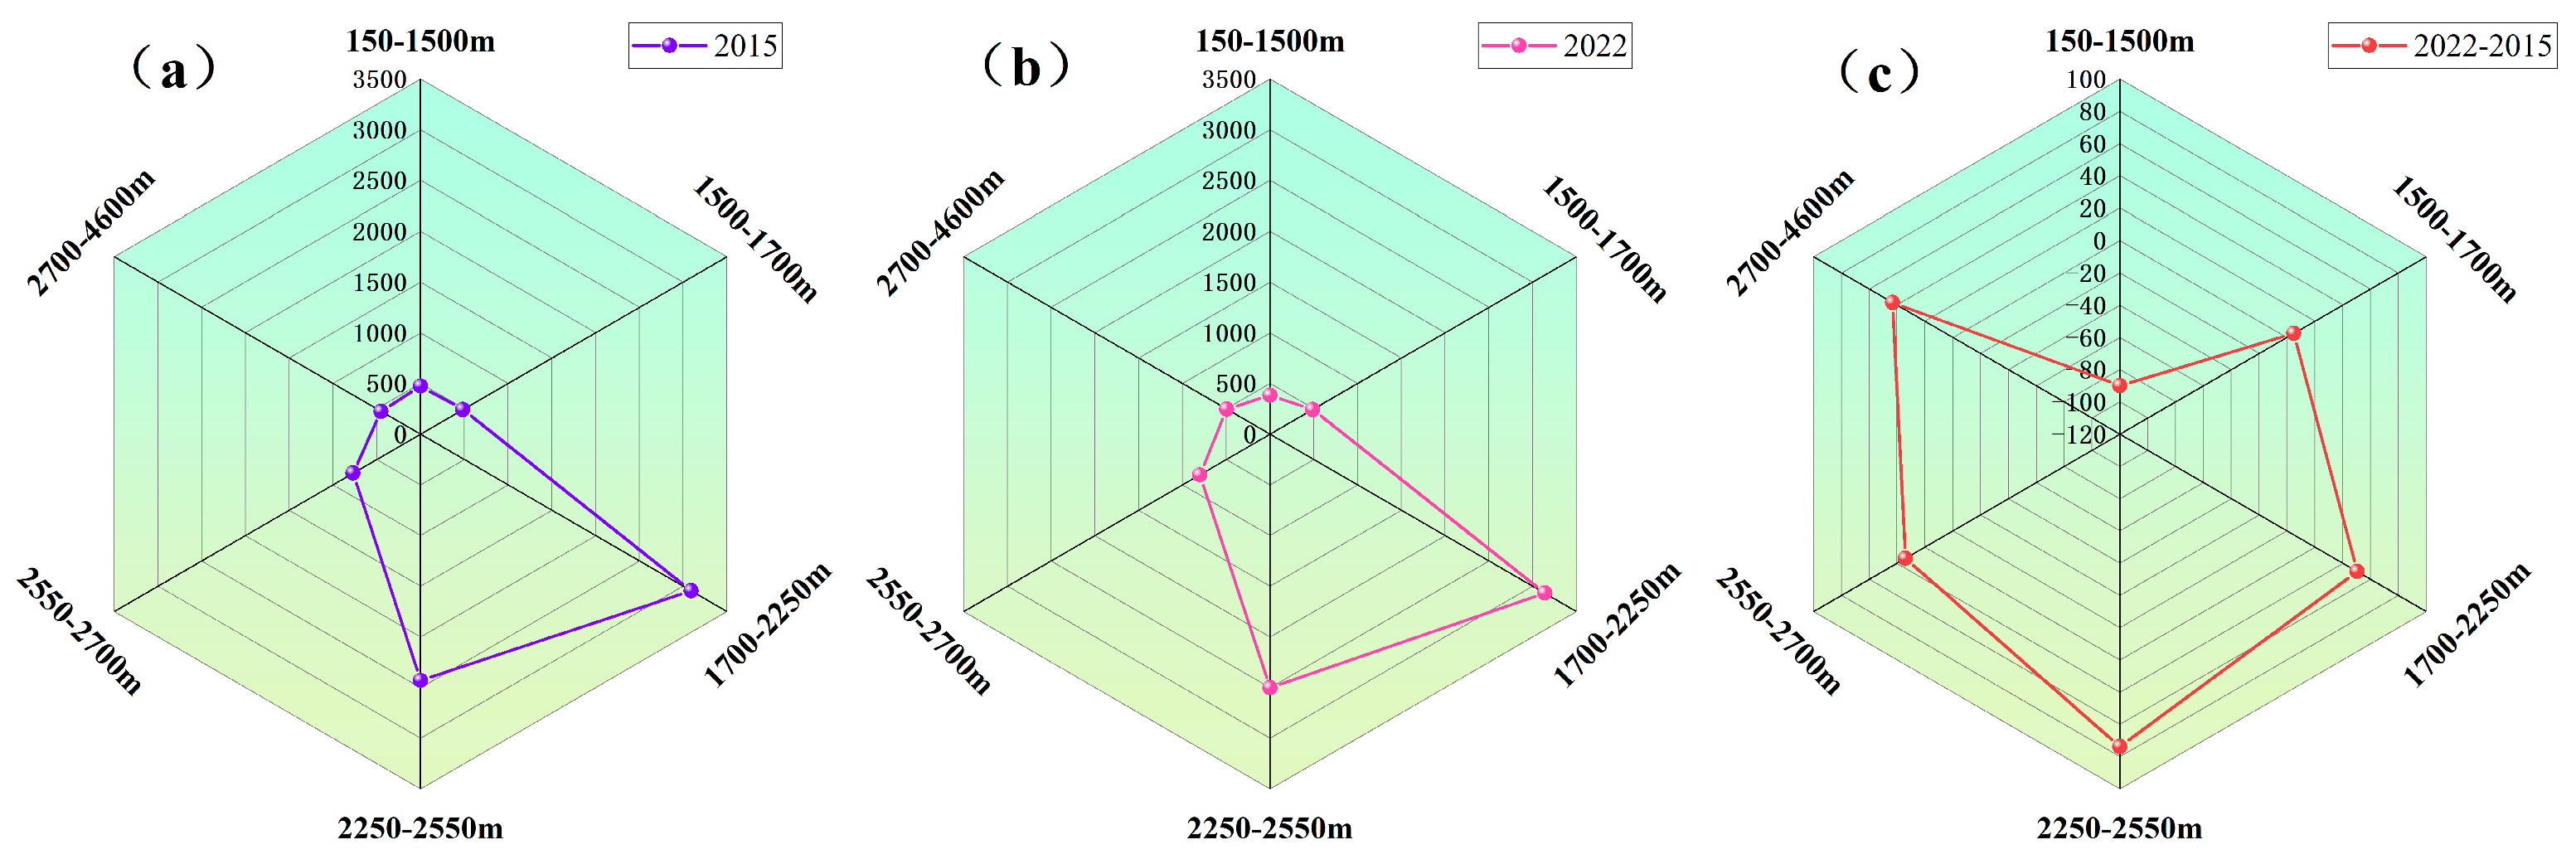
3.5. Picea schrenkiana var. tianschanica Distribution

The MMA-U-Net model proposed in this paper predicted distribution maps of Picea schrenkiana var. tianschanica in the study area in 2015 and 2022 and verified the maps by visual interpretation. The prediction results were basically consistent with the visual interpretation results (Figure 10). It can be seen that for the distribution of Picea schrenkiana var. tianschanica in different vertical zones of the spectrum, the distribution observed for the two years basically does not differ much. Basically the distribution is concentrated in the elevation between 1700–2250 m and 2250–2550 m, which is also the main growth area of Picea schrenkiana var. tianschanica. From the scope of the study area, the distribution of Picea schrenkiana var. tianschanica is relatively concentrated in the upper left corner. The Picea schrenkiana var. tianschanica with an altitude of 100–1500 m are mostly concentrated in this area, while the distribution of Picea schrenkiana var. tianschanica in other areas is mainly distributed along the two sides of the Tianshan mountains.
The area distribution of Picea schrenkiana var. tianschanica at different elevations was calculated (Figure 11). The area of Picea schrenkiana var. tianschanica below the middle and low mountain forest grassland was 112.54 km2 in 2015 and 75.73 km2 in 2022, and the area decreased by 36.81 km2 from 2015 to 2022. The region below the middle and low mountain forest grassland zone is mainly affected by tourism and animal husbandry, and the overall trend is downward. In 2015, the area of Picea schrenkiana var. tianschanica in the middle and low mountain forest grassland zone was 141.00 km2. In 2022, the area of Picea schrenkiana var. tianschanica in the region was 162.20 km2, with an increase in area of 21.2 km2, which is not a significant change in area compared to the overall area. The main growth area of Picea schrenkiana var. tianschanica is the middle mountain forest meadow zone to the subalpine sparse forest zone, which accounts for more than 80% of the total area of Picea schrenkiana var. tianschanica in the study area. In 2015, the area of Picea schrenkiana var. tianschanica in the middle mountain forest meadow zone is 1398.62 km2. In 2022, the area of Picea schrenkiana var. tianschanica in the region is 1515.20 km2. The area of Picea schrenkiana var. tianschanica in the upper Nakayama forest meadow zone was 1282.49 km2 in 2015 and 1363.90 km2 in 2022. The area of the subalpine sparse forest zone is 378.03 km2 in 2015 and 392.70 km2 in 2022. Affected by the growth environment of Picea schrenkiana var. tianschanica, this area occupied most of the distribution area of Picea schrenkiana var. tianschanica. Due to the vigorous development of forest resources in the West Tianshan forest farm, the original Picea schrenkiana var. tianschanica in this area grew normally, and the area of Picea schrenkiana var. tianschanica with three vertical bands increased steadily. Above the subalpine sparse forest belt, the area of Picea schrenkiana var. tianschanica was 195.51 km2 in 2015, and the area of Picea schrenkiana var. tianschanica in this region was 179.56 km2 in 2022, with a decrease in surface of 15.95 km2. The overall area showed an increasing trend from 2015 to 2022, with an increase in area of 181.10 km2.

4. Discussion

4.1. Model Evaluations

In this paper, we try to use the GF-1 PMS image data to improve the accuracy of the model by using the mechanism of adding attention in the process of downsampling and skip connection. The experiments show that the model of this paper shows good woodland extraction capability over the whole TianShan region, and the recognition accuracy has been significantly improved. To demonstrate the accuracy of the data in this paper, the projection results of this paper were compared with canopy height model dataset (CHM) and China’s inaugural annual tree cover dataset (CATCD) [3,6]. The results of this paper are similar in distribution to the CHM and CATCD dataset. However, the results of this paper are better than this dataset both in the extraction of the forest boundary and the segmentation accuracy, which confirms that the method of this paper has a higher accuracy for Picea schrenkiana var. tianschanica extraction (Figure 12). Through experimental studies, it is found that the introduction of an attention mechanism improves the recognition accuracy, and the model is able to pay better attention to the image features (Table 1). Chen [47] and Li [48] improved the recognition of tree species by adding an attention module to U-Net and conducted comparative experiments to verify its performance over the original U-Net method. However, the repeated stacking of the attention mechanism does not achieve improved accuracy. We use multiple attentions in different parts of the network structure, separately, to add the attention mechanism, to prevent the model from losing the semantic information of the image, and to improve the accuracy of the extraction of the boundary of the forest land. Comparing the single-attention model, ResU-Net, SE-U-Net, and ECA-U-Net models, Figure 9 shows that the relative accuracy of the model proposed in this paper is better, and the accuracy was higher by 5.42%–19.84%. It indicates that the semantic segmentation of remote sensing images using a single attention mechanism is relatively limited, and the semantic segmentation capability of the model can be effectively increased by combining multiple attention mechanisms and enhancing the sensory field of the model to obtain more image features. This also confirms that the combination of multiple attention modules can improve the accuracy of the model. In the future, we will continue to explore the combination of different attentions to further explore to improve the efficiency and accuracy of Picea schrenkiana var. tianschanica extraction.

4.2. Analysis of Spatial Distribution and Change in Picea schrenkiana var. tianschanica

Applying this model to the Picea schrenkiana var. tianschanica growth area in the West Tien Shan for identification, the prediction results are basically consistent with the results of visual interpretation and forest resource inventory and planning data. When the spatial distribution of Picea schrenkiana var. tianschanica was analyzed in this study, the overall total Picea schrenkiana var. tianschanica area showed an increasing trend. This is consistent with the results of Haixia Z. et al. [49] and Ma Nan et al. [50]. The observed decrease in the area of Picea schrenkiana var. tianschanica in the middle and low mountain forest grassland zone and below in 2015 compared to the area of Picea schrenkiana var. tianschanica in the region in 2022 during this period may be due to the fact that the area below the middle and low mountain forest grassland zone is affected by tourism, agriculture, and animal husbandry. Some of the human activities, as well as the use of water for domestic purposes, affect the growth and development of Picea schrenkiana var. tianschanica. In addition, a large amount of other vegetation and trees compete with each other at lower elevations, resulting in an overall downward trend [51]. Picea schrenkiana var. tianschanica mainly grow in the middle mountain forest meadow zone to the subalpine sparse forest belt at an altitude of 1500–2800 m, which is the most widely distributed Picea schrenkiana var. tianschanica and the most important area of change. The area of this region accounted for 91.6% of the total area of the Picea schrenkiana var. tianschanica in the study area, which occupies most of the area compared with the middle and low mountain forest grassland zone. This area is at a higher altitude, and the environment is not easily damaged. There is sufficient snowmelt from the Tianshan Mountains to maintain water supply [52,53]. In recent years, the Xinjiang forest farm has been carrying out forest conservation and public welfare afforestation and artificially promoting natural regeneration to vigorously develop and protect the forestry resources of the Xinjiang region, which has led to a steady increase in the area of the Picea schrenkiana var. tianschanica. The area above the subalpine sparse forest belt is larger compared to the middle and low mountain forest grassland zone. This is a relatively stable area without the influence of other external factors, although the Picea schrenkiana var. tianschanica grows more slowly at higher altitudes [54]. In the future, government departments should consider paying attention to the protection of the local ecological environment and promoting the sustainable development of Picea schrenkiana var. tianschanica in their planning and development.

4.3. Deficiencies and Prospects

In this paper, the model misclassified the images and the fine woodland could not be identified when the pixels of the image features were extremely close to each other. The network model will be optimized and adjusted in the future. The image samples used in this study were remote sensing image data, and the inclusion of the vegetation index into the image features was not considered, thus the rich information of the remote sensing image bands was ignored. The accuracy enhancement of the model using different data sources was considered in a previous study [55]. In addition, as the complexity of the model increases, the running time of the model also increases relatively, and it is a key direction to consider how to improve the training speed of the model in future research. Regarding the distribution of Picea schrenkiana var. tianschanica, in the next study, the spatial distribution of Picea schrenkiana var. tianschanica will be monitored by combining meteorological and geographic factors in order to enrich and expand the incorporation of different factors and to improve the accuracy of monitoring Picea schrenkiana var. tianschanica. In addition, the time factor will also be considered to monitor Picea schrenkiana var. tianschanica in different periods and different regions, so as to realize the dynamic monitoring of Picea schrenkiana var. tianschanica and to better understand the distribution of and change in the characteristics of the Picea schrenkiana var. tianschanica.

5. Conclusions

This paper sought to improve the precision of forest land boundary information extraction and obtain forest land distribution information. Taking GF-1 PMS as the data source, we propose a forest land recognition method using the semantic segmentation model MMA-U-Net for remote sensing images and analyze the distribution of forest land by combining the model with DEM. In this paper, in order to improve the representation ability of the network and obtain richer image information, the CBAM module is added to increase the adaptive adjustment of the input feature maps in the downsampling process of the model, and the DCA module is used instead of the traditional skip connection to solve the problem of semantic gaps in the structure of the network and ultimately improve the accuracy of the Picea schrenkiana var. tianschanica boundary extraction. The experimental results proved that the model in this paper has good ability to extract the edge information of the forest land, with values of 93.06%, 92.22%, 93.26%, 93.89%, and 81.8% for accuracy, recall, precision, F1 score, and mIOU. Using the model to identify the area of Picea schrenkiana var. tianschanica, Picea schrenkiana var. tianschanica at different altitudes were analyzed, revealing an increasing trend in area from 2015 to 2022, with a growth area of 181.10 km2. The research results of this paper can be used as a reference for tree species classification in remote sensing image and provide data support for ecological environment protection and tree species protection.

Author Contributions

Conceptualization, J.Z. and D.C.; methodology, J.Z.; software, Q.Z.; investigation, G.Z.; resources, H.Z. (Hanchi Zhang); data curation, H.Z. (Haiping Zhao); writing—original draft preparation, J.Z.; writing—review and editing, D.C.; visualization, H.Z. (Hanchi Zhang); supervision, N.Z.; project administration, S.L. All authors have read and agreed to the published version of the manuscript.

Funding

This research was funded by the Major Science and Technology Project of High-Resolution Earth Observation System (Grant NOs. 76-Y50G14-0038-22/23 and 30-Y60B01-9003-22/23), the Science Foundation for Distinguished Young Scholars of Anhui Universities (Grant NO. 2022AH020069), Anhui Provincial Special Support Plan (grant No.2019) and Key Research and Development Program of Anhui Province (Grant No.2022107020028).

Data Availability Statement

All data, models, or code generated or used during the study are available from the author by request (107622022210579@stu.xjnu.edu.cn).

Acknowledgments

We would like to thank the data support provided by various data source websites in the article. I would like to thank Chen Donghua et al. for their guidance on the paper and support of these projects for the paper.

Conflicts of Interest

The authors declare no conflicts of interest.

References

  1. Gao, G.; Guo, X.; Feng, Q.; Xu, E.; Hao, Y.; Wang, R.; Jing, W.; Ren, X.; Liu, S.; Shi, J.; et al. Environmental Controls on Evapotranspiration and Its Components in a Qinghai Spruce Forest in the Qilian Mountains. Plants 2024, 13, 801. [Google Scholar] [CrossRef] [PubMed]
  2. Gottardini, E.; Cristofolini, F.; Cristofori, A.; Ferretti, M. Forests Attenuate Temperature and Air Pollution Discomfort in Montane Tourist Areas. Forests 2023, 14, 545. [Google Scholar] [CrossRef]
  3. Nico, L.; Walter, J.; Konrad, S.; JanDirk, W. A high-resolution canopy height model of the Earth. Nat. Ecol. Evol. 2023, 7, 1778–1789. [Google Scholar]
  4. Liu, X.; Su, Y.; Hu, T.; Yang, Q.; Liu, B.; Deng, Y.; Tang, H.; Tang, Z.; Fang, J.; Guo, Q. Neural network guided interpolation for mapping canopy height of China’s forests by integrating GEDI and ICESat-2 data. Remote Sens. Environ. 2022, 269, 112844. [Google Scholar] [CrossRef]
  5. Jamie, T.; Hung, I.Y.; Benjamin, N.; Guillaume, C.; Vo, H.V.; John, B.; Justine, S.; Sayantan, M.; Daniel, H.; Janaki, V.; et al. Very high resolution canopy height maps from RGB imagery using self-supervised vision transformer and convolutional decoder trained on aerial lidar. Remote Sens. Environ. 2024, 300, 113888. [Google Scholar]
  6. Cai, Y.; Xu, X.; Nie, S.; Wang, C.; Zhu, P.; Xiong, Y.; Liu, X. Unveiling Spatiotemporal Tree Cover Patterns in China: The First 30m Annual Tree Cover Mapping from 1985 to 2023. ISPRS J. Photogramm. Remote Sens. 2024, 216, 240–258. [Google Scholar] [CrossRef]
  7. Gosselin, M.; Dumas, Y.; Cadet, S.; Cateau, E.; Paillet, Y.; Gosselin, F. Macroclimate modulates the positive dead-wood influence on bryophyte diversity in managed and unmanaged temperate lowland forests. J. Environ. Manag. 2024, 367, 121840. [Google Scholar] [CrossRef]
  8. Francini, S.; Schelhaas, J.M.; Vangi, E.; Lerink, B.J.; Nabuurs, G.J.; McRoberts, R.E.; Chirici, G. Forest species mapping and area proportion estimation combining Sentinel-2 harmonic predictors and national forest inventory data. Int. J. Appl. Earth Obs. Geoinf. 2024, 131, 103935. [Google Scholar] [CrossRef]
  9. Liu, Y.; Gong, W.; Hu, X.; Gong, J. Forest Type Identification with Random Forest Using Sentinel-1A, Sentinel-2A, Multi-Temporal Landsat-8 and DEM Data. Remote Sens. 2018, 10, 946. [Google Scholar] [CrossRef]
  10. Yu, E.; Zhang, M.; Hou, Y.; Liu, S.; Deng, S.; Sun, M.; Wang, Y. Identifying long-term burned forests in the rugged terrain of Southwest China: A novel method based on remote sensing and ecological mechanisms. Int. J. Appl. Earth Obs. Geoinf. 2024, 133, 104134. [Google Scholar]
  11. He, G.; Li, S.; Huang, C.; Xu, S.; Li, Y.; Jiang, Z.; Xu, J.; Yang, F.; Wan, W.; Zou, Q.; et al. Comparison of Algorithms and Optimal Feature Combinations for Identifying Forest Type in Subtropical Forests Using GF-2 and UAV Multispectral Images. Forests 2024, 15, 1327. [Google Scholar] [CrossRef]
  12. Emre, A.; Narendra, A. Low-Level Hierarchical Multiscale Segmentation Statistics of Natural Images. IEEE Trans. Pattern Anal. Mach. Intell. 2014, 36, 1900–1906. [Google Scholar]
  13. Zhang, M.; Shen, J.; Shang, Z. Color Image Fuzzy Classification Algorithm with Salient Regions. Inf. Technol. J. 2008, 7, 560. [Google Scholar] [CrossRef]
  14. Ronneberger, O.; Fischer, P.; Brox, T. U-Net: Convolutional Networks for Biomedical Image Segmentation. CoRR abs/1505.04597. 2015. Available online: https://dblp.org/rec/journals/corr/RonnebergerFB15.html (accessed on 25 February 2024).
  15. Cui, J.; Tan, F.; Bai, N.; Fu, Y. Improving U-net network for semantic segmentation of corns and weeds during corn seedling stage in field. Front. Plant Sci. 2024, 15, 1344958. [Google Scholar] [CrossRef]
  16. Jamali, A.; Roy, K.S.; Beni, H.L.; Pradhan, B.; Li, J.; Ghamisi, P. Residual wave vision U-Net for flood mapping using dual polarization Sentinel-1 SAR imagery. Int. J. Appl. Earth Obs. Geoinf. 2024, 127, 103662. [Google Scholar] [CrossRef]
  17. Kushanav, B.; Raj, S.M.; Lorenzo, N.; Cees, V.W.; Mario, F.; Filippo, C. Mapping landslides through a temporal lens: An insight toward multi-temporal landslide mapping using the u-net deep learning model. GISci. Remote Sens. 2023, 60, 2182057. [Google Scholar] [CrossRef]
  18. Khankeshizadeh, E.; Tahermanesh, S.; Mohsenifar, A.; Moghimi, A.; Mohammadzadeh, A. FBA-DPAttResU-Net: Forest burned area detection using a novel end-to-end dual-path attention residual-based U-Net from post-fire Sentinel-1 and Sentinel-2 images. Ecol. Indic. 2024, 167, 112589. [Google Scholar] [CrossRef]
  19. Yan, H.; Liu, G.; Li, Z.; Li, Z.; He, J. SCECA U-Net crop classification for UAV remote sensing image. Clust. Comput. 2024, 28, 23. [Google Scholar] [CrossRef]
  20. Li, C.; Xian, G.; Jin, S. A “Region-Specific Model Adaptation (RSMA)”-Based Training Data Method for Large-Scale Land Cover Mapping. Remote Sens. 2024, 16, 3717. [Google Scholar] [CrossRef]
  21. Hewarathna, I.A.; Hamlin, L.; Charles, J.; Vigneshwaran, P.; George, R.; Thuseethan, S.; Wimalasooriya, C.; Shanmugam, B. Change Detection for Forest Ecosystems Using Remote Sensing Images with Siamese Attention U-Net. Technologies 2024, 12, 160. [Google Scholar] [CrossRef]
  22. Xie, X.; Liu, P.; Lang, Y.; Guo, Z.; Yang, Z.; Zhao, Y. US-Net: U-shaped network with Convolutional Attention Mechanism for ultrasound medical images. Comput. Graph. 2024, 124, 104054. [Google Scholar] [CrossRef]
  23. Sui, T.; Huang, Q.; Wu, M.; Wu, M.; Zhang, Z. BiAU-Net: Wildfire burnt area mapping using bi-temporal Sentinel-2 imagery and U-Net with attention mechanism. Int. J. Appl. Earth Obs. Geoinf. 2024, 132, 104034. [Google Scholar] [CrossRef]
  24. Chen, H.; He, Y.; Zhang, L.; Yao, S.; Yang, W.; Fang, Y.; Liu, Y.; Gao, B. A landslide extraction method of channel attention mechanism U-Net network based on Sentinel-2A remote sensing images. Int. J. Digit. Earth 2023, 16, 552–577. [Google Scholar] [CrossRef]
  25. Woo, S.; Park, J.; Lee, J.; Kweon, I.S. CBAM: Convolutional Block Attention Module; Springer: Cham, Switzerland, 2018. [Google Scholar] [CrossRef]
  26. Zheng, Y.; Dong, W.; Yang, Z.; Lu, Y.; Zhang, X.; Dong, Y.; Sun, F. A new attention-based deep metric model for crop type mapping in complex agricultural landscapes using multisource remote sensing data. Int. J. Appl. Earth Obs. Geoinf. 2024, 134, 104204. [Google Scholar] [CrossRef]
  27. Liu, Q.; Yu, Z.; Jing, C.; Sun, C.; Huang, M.; Che, M.; Li, C.; Lin, S. An improved Deeplab V3+ network based coconut CT image segmentation method. Front. Plant Sci. 2023, 141, 1139666. [Google Scholar] [CrossRef]
  28. Tie, J.; Wu, W.; Zheng, L.; Wu, L.; Chen, T. Improving Walnut Images Segmentation Using Modified UNet3+ Algorithm. Agriculture 2024, 14, 149. [Google Scholar] [CrossRef]
  29. Zhu, X.; Yue, Y.; Zheng, Y.; Su, C.; Chen, F. Bilinear Attention Network for Image-Based Fine-Grained Recognition of Oil Tea (Camellia oleifera Abel.). Cultivars. Agron. 2022, 12, 1846. [Google Scholar] [CrossRef]
  30. Can, G.A.; Prasoon, M.; Emrah, C. Dual Cross-Attention for medical image segmentation. Eng. Appl. Artif. Intell. 2023, 126, 107139. [Google Scholar]
  31. Wang, J.; Ding, J.; Ran, S.; Qin, S.; Liu, B.; Li, X. Automatic Pear Extraction from High-Resolution Images by a Visual Attention Mechanism Network. Remote Sens. 2023, 15, 3283. [Google Scholar] [CrossRef]
  32. See, V.L.; Mohd, A.Z.; Azlan, S.; Adhi, H.S.; Siti, R.A.A.H.S.; Siti, R.A. Attention-Based Semantic Segmentation Networks for Forest Applications. Forests 2023, 14, 2437. [Google Scholar] [CrossRef]
  33. Xu, J.; Zhu, Y.; Zhong, R.; Lin, Z.; Xu, J.; Jiang, H.; Huang, J.; Li, H.; Lin, T. DeepCropMapping: A multi-temporal deep learning approach with improved spatial generalizability for dynamic corn and soybean mapping. Remote Sens. Environ. 2020, 247, 111946. [Google Scholar] [CrossRef]
  34. David, J.; Ce, Z. An attention-based U-Net for detecting deforestation within satellite sensor imagery. Int. J. Appl. Earth Obs. Geoinf. 2022, 107, 102685. [Google Scholar]
  35. Kassim, K.; Ahmed, O.M.; Teck, D.L.C. FCD-AttResU-Net: An improved forest change detection in Sentinel-2 satellite images using attention residual U-Net. Int. J. Appl. Earth Obs. Geoinf. 2023, 122, 103453. [Google Scholar]
  36. Liu, K.; Zhou, X. Forest Cover Extraction From Gaofen-1 PMS Image in Mountain Area Using Decision Tree. J. Huaqiao Univ. (Nat. Sci.) 2019, 40, 376–383. [Google Scholar] [CrossRef]
  37. Chang, Z.; Li, H.; Chen, D.; Liu, Y.; Zou, C.; Chen, J.; Han, W.; Liu, S.; Zhang, N. Crop Type Identification Using High-Resolution Remote Sensing Images Based on an Improved DeepLabV3+ Network. Remote Sens. 2023, 15, 5088. [Google Scholar] [CrossRef]
  38. Peng, D.; Zhang, Y.; Guan, H. End-to-End Change Detection for High Resolution Satellite Images Using Improved UNet++. Remote Sens. 2019, 11, 1382. [Google Scholar] [CrossRef]
  39. Syrris, V.; Pesek, O.; Soille, P. SatImNet: Structured and Harmonised Training Data for Enhanced Satellite Imagery Classification. Remote Sens. 2020, 12, 3358. [Google Scholar] [CrossRef]
  40. Abramova, I.A.; Demchev, D.M.; Kharyutkina, E.; Savenkova, E.N. Utilization of the U-Net Convolutional Neural Network and Its Modifications for Segmentation of Tundra Lakes in Satellite Optical Images. Atmos. Ocean. Opt. 2024, 37, 205–210. [Google Scholar] [CrossRef]
  41. Ali, G.; Mohammadmehdi, S.; Jakub, B.; Sibylle, I. Comparative performance analysis of simple U-Net, residual attention U-Net, and VGG16-U-Net for inventory inland water bodies. Appl. Comput. Geosci. 2024, 21, 100150. [Google Scholar]
  42. Wan, Y.; Wei, G.; Li, R.; Xiang, Y.; Yin, D.; Yang, M.; Gong, D.; Chen, J. Retinal Blood Vessels Segmentation With Improved SE-UNet Model. Int. J. Imaging Syst. Technol. 2024, 34, e23145. [Google Scholar] [CrossRef]
  43. Su, F.; Wang, G.; Shi, Y.; Jia, R.; Yan, Y.; Zu, L. Leaf disease segmentation model of greenhouse tomatoes based on ResUnet with attention mechanism. J. Chin. Agric. Mech. 2024, 45, 228–233. [Google Scholar]
  44. Shu, X.; Chang, F.; Zhang, X.; Shao, C.; Yang, X. ECAU-Net: Efficient channel attention U-Net for fetal ultrasound cerebellum segmentation. Biomed. Signal Process. Control 2022, 75, 103528. [Google Scholar] [CrossRef]
  45. Shahab, J.; Chen, D. On the versatility of popular and recently proposed supervised evaluation metrics for segmentation quality of remotely sensed images: An experimental case study of building extraction. ISPRS J. Photogramm. Remote Sens. 2020, 160, 275–290. [Google Scholar]
  46. Zhang, X.; Zhang, Y.; Chen, W.; Zheng, J.; Chen, F.; Chen, K.; Mo, G. The types and regeneration of the spruce forest in Xueling Mountains of Tianshan Mountains. Sci. Silve Sin. 1964, 9, 167–183. [Google Scholar]
  47. Chen, C.; Jing, L.; Li, H.; Tang, Y. A New Individual Tree Species Classification Method Based on the ResU-Net Model. Forests 2021, 12, 1202. [Google Scholar] [CrossRef]
  48. Li, Q.; Jia, W.; Sun, M.; Hou, S.; Zheng, Y. A novel green apple segmentation algorithm based on ensemble U-Net under complex orchard environment. Comput. Electron. Agric. 2021, 180, 105900. [Google Scholar] [CrossRef]
  49. Zhao, H.; Gu, B.; Lindley, S.; Zhu, T. Regulation factors driving vegetation changes in China during the past 20 years. J. Geogr. Sci. 2023, 33, 508–528. [Google Scholar] [CrossRef]
  50. Ma, N.; Bai, T.; Cai, Z. Vegetation Cover Change and Its Response to Climate and Surface Factors in Xinjiang Based on Different Vegetation Types. Res. Soil Water Conserv. 2024, 31, 385–394. [Google Scholar]
  51. Zhang, Y.; Sun, J.; Lu, Y.; Song, X. Influence of Anthropogenic Activities and Major Natural Factors on Vegetation Changes in Global Alpine Regions. Land 2022, 11, 1084. [Google Scholar] [CrossRef]
  52. Sun, M.; Sun, P.; Liu, N.; Zhang, L.; Yu, Z.; Feng, Q.; Smettem, K.; Liu, S. Alternating dominant effects of temperature and precipitation along elevational gradient on the alpine and subalpine vegetation activities in southwestern China. For. Ecol. Manag. 2024, 554, 121668. [Google Scholar] [CrossRef]
  53. Ma, Q.; Li, Y.; Li, X.; Liu, J.; Keyimu, M.; Zeng, F.; Liu, Y. Modeling future changes in potential habitats of five alpine vegetation types on the Tibetan Plateau by incorporating snow depth and snow phenology. Sci. Total Environ. 2024, 918, 170399. [Google Scholar] [CrossRef] [PubMed]
  54. Zhang, Y.; An, C.; Jiang, L.; Zheng, L.; Tan, B.; Lu, C.; Zhang, W.; Zhang, Y. Increased Vegetation Productivity of Altitudinal Vegetation Belts in the Chinese Tianshan Mountains despite Warming and Drying since the Early 21st Century. Forests 2023, 14, 2189. [Google Scholar] [CrossRef]
  55. Lu, T.; Gao, M.; Wang, L. Crop classification in high-resolution remote sensing images based on multi-scale feature fusion semantic segmentation model. Front. Plant Sci. 2023, 14, 1196634. [Google Scholar] [CrossRef] [PubMed]
Figure 1. Location of the study area.
Forests 15 02039 g001
Figure 2. Examples of remote sensing datasets produced in this study.
Forests 15 02039 g002
Figure 5. The framework of the U-Net model.
Forests 15 02039 g005
Figure 6. (a) The CBAM module was added to the downsampling. (b) The DCA module replaces the original jump connection. (c) The MMA-U-Net modelling framework proposed in this study.
Forests 15 02039 g006
Figure 7. The MMA-U-Net model loss curve for the model.
Forests 15 02039 g007
Figure 8. Predicted results of the ablation experiments and the identification of Picea schrenkiana var. tianschanica at different elevations; The red boxes show areas where there are clear gaps in the categorisation results.
Forests 15 02039 g008
Figure 9. Predictions from experiments comparing different attention models and the identification of Picea schrenkiana var. tianschanica at different elevations; The red boxes show areas where there are clear gaps in the categorisation results.
Forests 15 02039 g009
Figure 10. Predicted distribution of Picea schrenkiana var. tianschanica. (a) Picea schrenkiana var. tianschanica distribution map in 2015. (b) Picea schrenkiana var. tianschanica distribution map in 2022.
Forests 15 02039 g010
Figure 11. Picea schrenkiana var. tianschanica area and changes. (a) Area of Picea schrenkiana var. tianschanica in 2015. (b) Area of Picea schrenkiana var. tianschanica in 2022. (c) Change in Picea schrenkiana var. tianschanica area from 2015 to 2022.
Forests 15 02039 g011
Figure 12. Comparison of predicted results for spruce forests.
Forests 15 02039 g012
Table 1. Results of the ablation experiment. (× is for not adding the module, √ is for adding the module).
CBAMDCAAccuracy/%Recall/%Precision/%F1 Score/%mIOU/%
××81.6179.8077.8077.6970.8
×87.9888.4488.5688.5772.6
×88.1888.1888.1188.0672.4
93.0692.2293.2693.8981.8
Table 2. Experimental results comparing different attention models.
ModelAccuracy/%Recall/%Precision/%F1 Score/%mIOU/%Speed/(it·s−1)
U-Net81.6179.8077.8077.6971.87.01
SE-U-Net82.7781.5080.9783.7672.96.86
ResU-Net73.2272.1470.6173.5472.76.98
ECA-U-Net87.6480.4983.2981.9272.84.98
MMA-U-Net93.0692.2293.2693.8981.81.28
Disclaimer/Publisher’s Note: The statements, opinions and data contained in all publications are solely those of the individual author(s) and contributor(s) and not of MDPI and/or the editor(s). MDPI and/or the editor(s) disclaim responsibility for any injury to people or property resulting from any ideas, methods, instructions or products referred to in the content.

