Article

Species Differentiation of Prunus serrulata and Prunus xueluoensis Based on Combined Analysis of SSR and cpDNA Markers

1
Co-Innovation Center for Sustainable Forestry in Southern China, College of Life Sciences, Nanjing Forestry University, Nanjing 210037, China
2
Cerasus Research Center, College of Life Sciences, Nanjing Forestry University, Nanjing 210037, China
*
Author to whom correspondence should be addressed.
Forests 2024, 15(11), 1927; https://doi.org/10.3390/f15111927
Submission received: 7 September 2024 / Revised: 9 October 2024 / Accepted: 28 October 2024 / Published: 31 October 2024
(This article belongs to the Section Genetics and Molecular Biology)

Abstract

:
Prunus xueluoensis C. H. Nan & X. R. Wang is a new species of the Subg. Cerasus Mill., described by C. H. Nan and X. R. Wang in 2013. Since the publication of P. xueluoensis, its taxonomic status has been the subject of ongoing debate. This study focuses on wild populations of P. xueluoensis and Prunus serrulata (Lindley) London, utilizing 18 pairs of SSR molecular markers and variations in chloroplast DNA sequences (matK, trnD-E, and trnS-G) to delineate the relationship between the two species. The results showed that P. serrulate (N = 12.400, Na = 5.144, H = 0.578, I = 1.129, Ho = 0.493) and P. xueluoensis (N = 13.625, Na = 6.264, H = 0.614, I = 1.342, Ho = 0.495) populations exhibit rich genetic diversity, which may be related to their wide geographical distribution. The CpDNA genetic diversities of P. serrulata (Hd = 0.553, Pi = 0.00136) and P. xueluoensis (Hd = 0.496, Pi = 0.00180) are at a high level within the Subg. Cerasus Mill. The UPGMA clustering, along with MP and ML phylogenetic trees, show that the unique haplotypes of P. xueluoensis cluster separately as a terminal branch in the evolutionary tree with high support. The shared haplotypes and unique haplotypes of P. serrulata are predominantly located at the base of the phylogenetic tree, suggesting that the two species have diverged. In the TCS haplotype network, the central and key node haplotypes are primarily unique to P. serrulata and shared haplotypes, while the unique haplotypes of P. xueluoensis are all distributed along the network’s periphery. Both P. serrulata (Nst = 0.254, Gst = 0.103, Nst/Gst = 2.466, p < 0.05) and P. xueluoensis (Nst = 0.366, Gst = 0.268, Nst/Gst = 1.366, p < 0.05) exhibit phylogeographic structures. However, when considered as a whole, the combined entity of P. serrulata and P. xueluoensis does not show a significant phylogeographic structure (Nst = 0.317, Gst = 0.400, Nst/Gst = 0.793, p < 0.05), which supports the classification of these as two distinct species. The estimate of the average age of the latest common ancestor of P. serrulata and P. xueluoensis is 3.22 mya (PP = 1; 95% HPD: 3.07~3.46 mya). Due to environmental differences in altitude, the group of P. serrulata differentiated in the expansion into the cold and humid alpine environment and gradually formed P. xueluoensis. The findings support the classification of P. serrulata and P. xueluoensis as two distinct species.

1. Introduction

P. serrulata and P. xueluoensis are important genetic resources belonging to the Subg. Cerasus Mill. of Rosaceae. P. xueluoensis is a new species of Prunus published by Nan and others in 2013 [1]. However, the taxonomic status of P. xueluoensis has been continuously debated. In terms of morphology, P. xueluoensis possesses most traits typical of the Subg. Cerasus, but its axillary three-bud and shrubby characteristics significantly differ from the single axillary buds of Prunus serrulate and other typical species in the Subg. Cerasus. There is considerable morphological variation among individuals, which can easily lead to misidentification or confusion with similar species.
Species delimitation is the process of redefining the boundaries of existing species through a series of methods and measures [2]. To publish new species, delimit species, and revise classification, it is essential to combine multiple lines of evidence, including biology, morphology, evolution, ecology, and systematics [3,4]. The importance of these pieces of evidence is ranked as follows: molecular, morphological, reproductive isolation, ecological niche differentiation, karyotype, and geographic distribution. With the enrichment of marking methods and the reduction in experimental costs, the selection and combination of different genomes (nDNA, mtDNA, cpDNA, and whole genomes), different markers (SSR, SNP, AFLP, ITS, etc.), and different fragment sequences have become a new trend in research on species delineation [5,6,7,8,9].
The classification research of the Subg. Cerasus has long been based on morphological methods. With the application of advanced techniques such as micromorphology, cytology, biochemistry, and molecular biology, comprehensive analyses using various experimental methods and multidisciplinary approaches have provided more robust and objective scientific evidence for the classification and evolution of the Subg. Cerasus. Morphologically, studies by Chang et al. [10], Nan [11], Yi [12], Zhu [13], and others have investigated population differentiation and species delimitation within the Subg. Cerasus. Utilizing morphological and micromorphological markers, species such as P. xueluoensis [1], Prunus laoshanensis [14], Prunus paludosa [15], and Prunus kumanoensis [16] have been discovered. Oginuma, K [17], Mowrey et al. [18], Granger et al. [19], Zhou et al. [20], and Li et al. [21] have conducted in-depth research in cytology and chemotaxonomy. The application of molecular marker technology has greatly advanced the in-depth research of the taxonomy of the Subg. Cerasus. In recent years, new species such as Prunus pananensis [22], Prunus fengyangshanica [23], Prunus sunhangii [24], Prunus quanzhouensis [25], and Prunus tongmuensis [26] have been reported, enriching the species diversity of the Subg. Cerasus. Additionally, molecular marker technology has provided more comprehensive information for the identification of closely related natural groups such as Prunus discoidea [27], Prunus pseudocerasus [28], and Prunus avium [29,30], contributing to the taxonomic delimitation and phylogenetic studies of the Subg. Cerasus.
This study focuses on the wild populations of P. serrulata and P. xueluoensis, examining 110 samples from five P. serrulata populations and 231 samples from eight P. xueluoensis populations. By integrating 18 pairs of SSR molecular markers and chloroplast sequence fragment variation (matK, trnD-E, and trnS-G), this research delineates the relationship between P. serrulata and P. xueluoensis and discusses the spatiotemporal patterns of their genetic variation and evolutionary relationships.

2. Materials and Methods

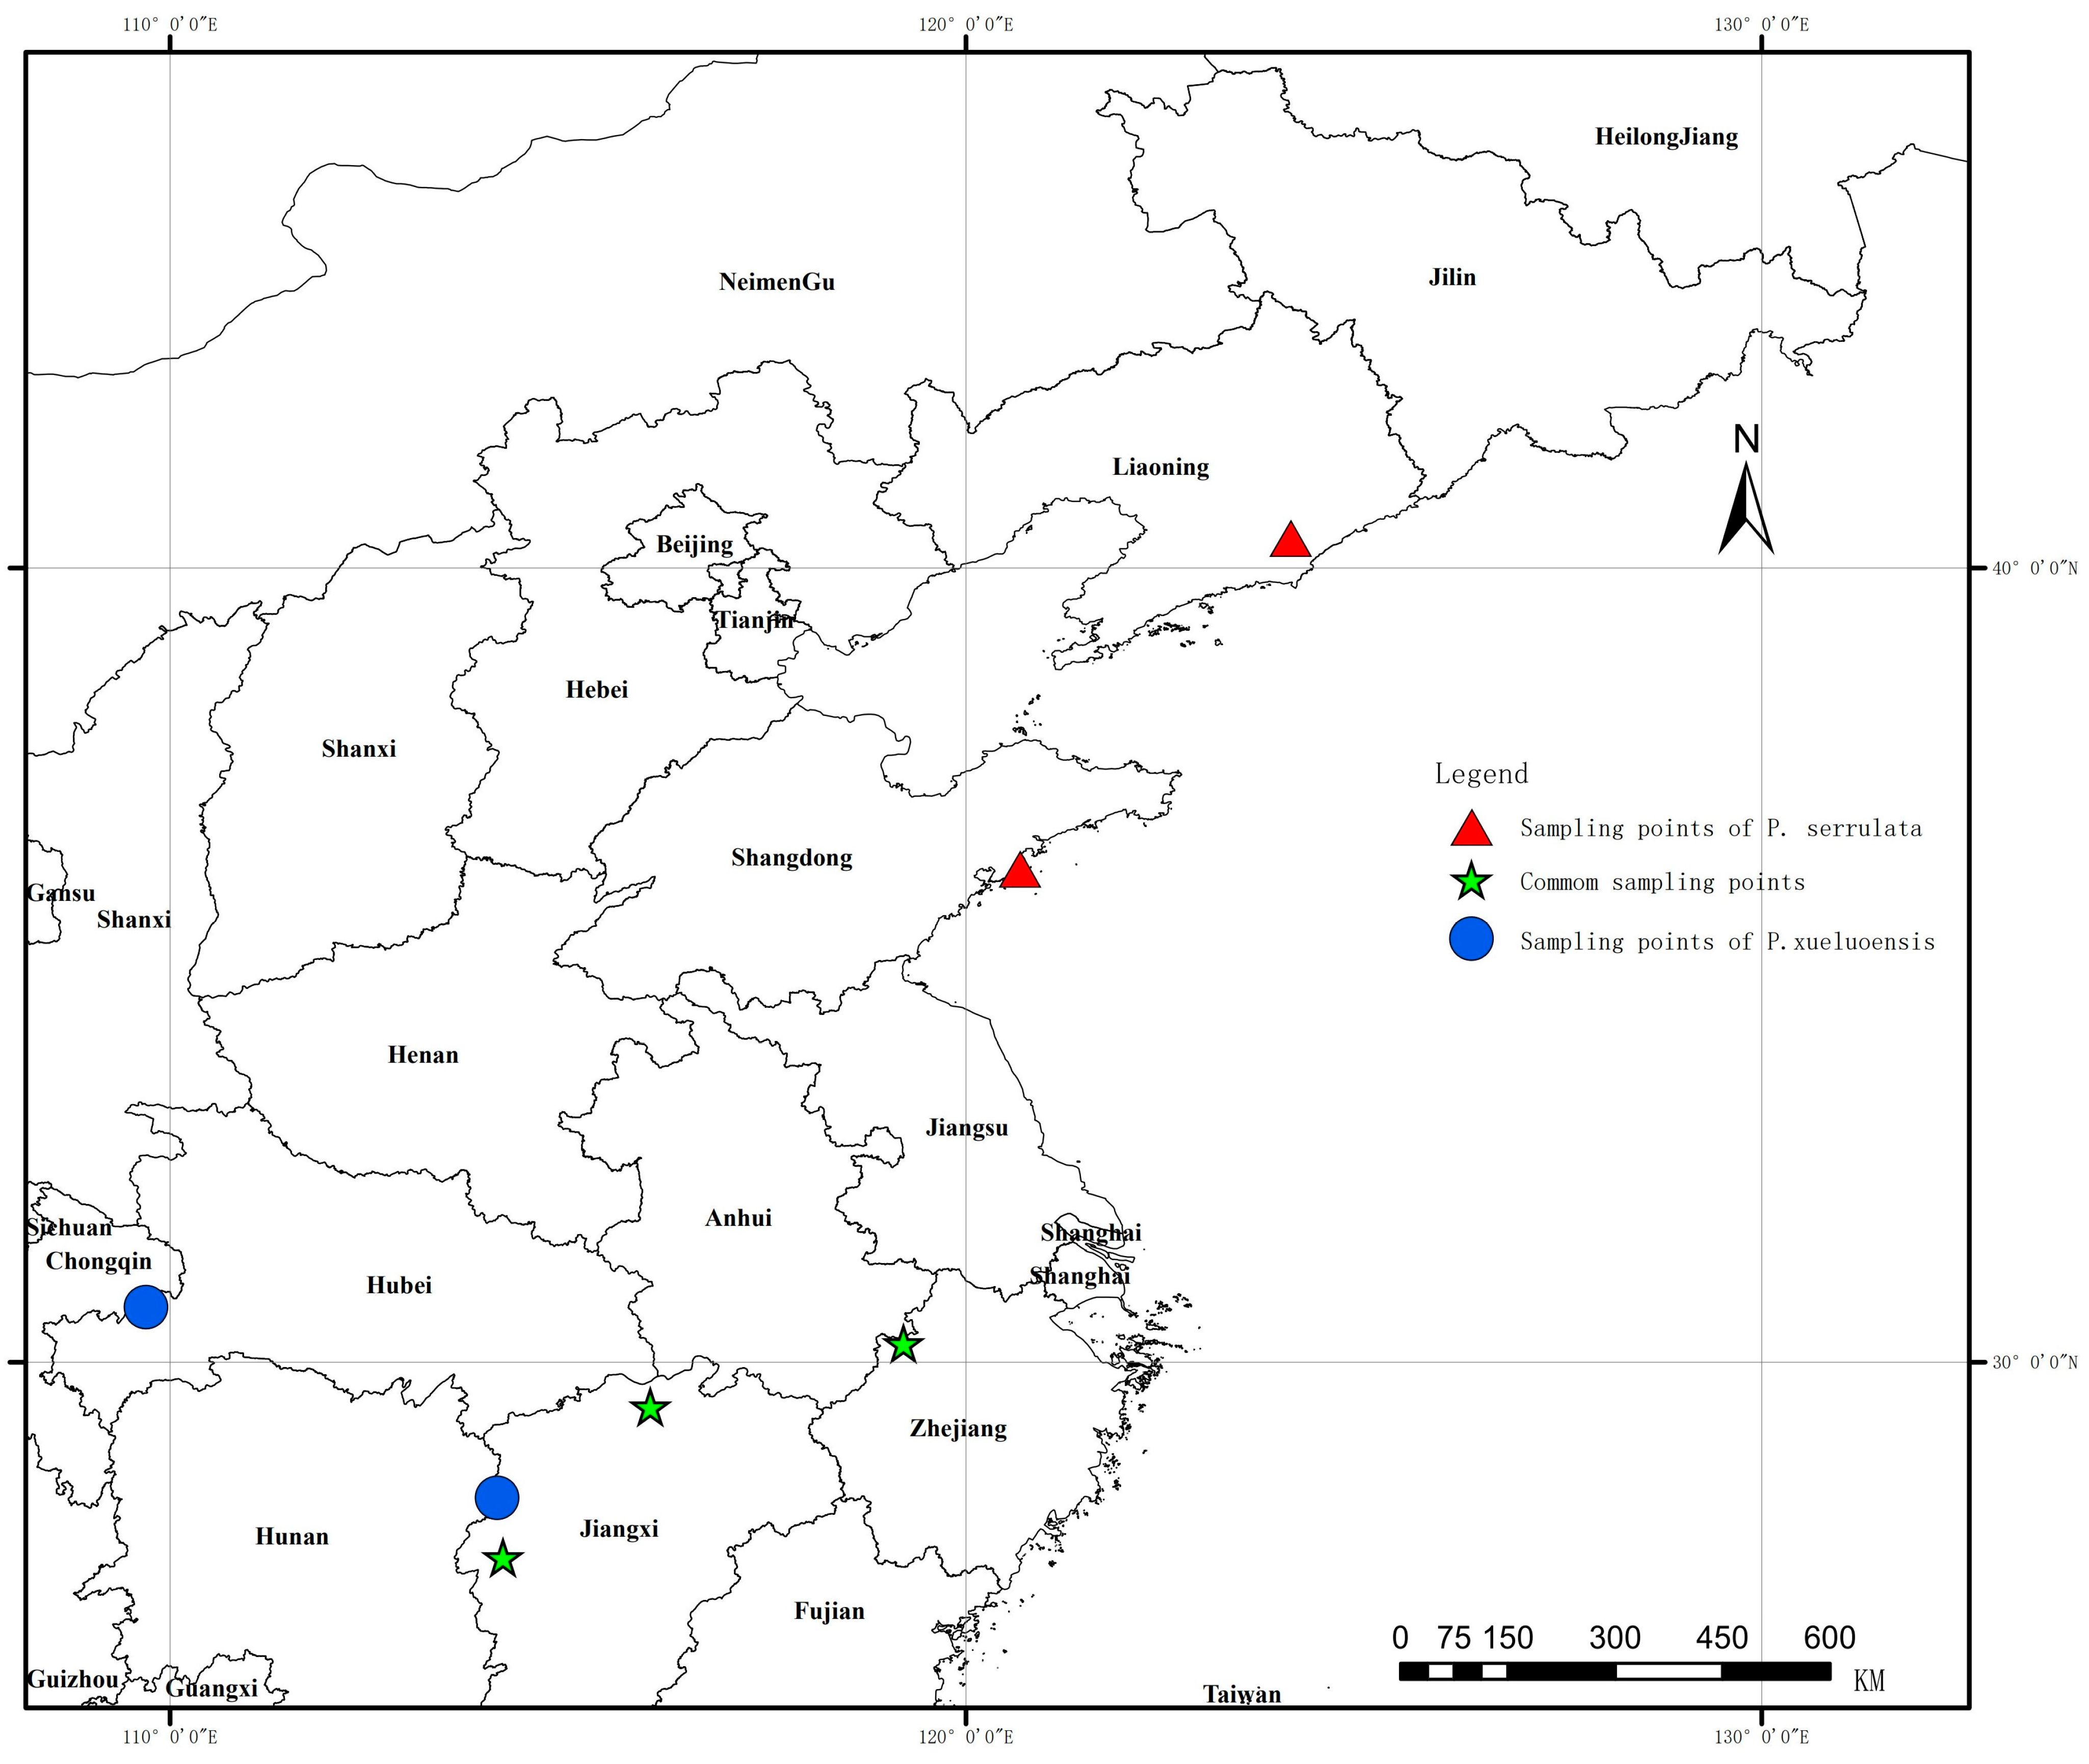
2.1. Plant Materials

Field samples were collected between 2018 and 2020, comprising a total of 341 individuals from naturally occurring provenances in good growth states across 6 provinces and 7 cities, including 110 samples from 5 P. serrulata populations and 231 samples from 8 P. xueluoensis populations. The P. xueluoensis populations from Qingliang Feng in Zhejiang, Lushan in Jiangxi, and Mingyue Shan in Jiangxi were divided into two sections based on higher and lower altitudes.
The geographical locations and sampling information of the 13 populations are shown in Table 1 and Figure 1. During sampling, each plant was used as a unit, with a horizontal distance greater than 50 m between each plant; the selected samples needed to have a diameter greater than 3 cm to avoid the impact of natural vegetative reproduction on the experiment [28]. Fresh and healthy young leaves were collected, promptly labeled, temporarily stored in a light-proof and well-ventilated mesh bag, and then immediately dried with silica gel for preservation. Upon returning to the laboratory, they were stored at −80 °C for subsequent experiments.

2.2. DNA Extraction, Polymerase Chain Reaction Amplification, Sequencing, and Sequence Alignment

DNA extraction was performed using the CTAB-bead method [21]. After extraction, DNA concentration and purity were checked using 1% agarose gel electrophoresis, with a voltage setting of 100 volts and a duration of 30 min. DNA samples that passed quality control were then stored in a −80 °C freezer and the qualified DNA samples were sent to Nanjing Zuhe and Nanjing Supergene Biotech Co, Ltd. DNA was extracted, and its quality was assessed. SSR primers were sought from the related literature [22,23,24,25,26], and a total of 47 primer pairs were selected. Samples were randomly chosen from the total pool to screen the primers, and eventually, 18 primer pairs with clear bands and strong polymorphism were selected for all experiments. Universal primers for cpDNA fragment sequences (matK-F: CGATCTATTCATTCAATATTTC; R: TCTAGCACACGAAAGTCGAAGT), (trnD-E-F: ACCAATTGAACTACAATCCC; R: AGGACATCTCTCTTTCAAGGAG), (trnS-G-F: GCCCCTTTAGTCCACTCAGC; R: GAACGAATCACACTTACCAC) [23] were selected based on literature reviews and consultation of the NCBI website for genetic diversity and phylogenetic structure analysis. The quantitative analysis of DNA used a UV-Vis spectrophotometer. The PCR amplification program consists of an initial denaturation step at 95.5 °C for 4 min, followed by 30–35 cycles of denaturation at 94 °C for 45 s, annealing at 50–65 °C for 45 s, and extension at 72 °C for 45 s. A final extension occurred at 72 °C for 5 min, with the reaction maintained at 10 °C for storage. The amplification system included 12.5 μL of 2× Taq PCR Master Mix, 0.5 μL each of Primer 1 and Primer 2, 2.5 μL of DNA (greater than 20 ng/μL), and 9 μL of ddH2O, resulting in a total volume of 25 μL.

2.3. SSR Polymorphism Analysis

Using GenAlEx 6.502 software, a Hardy–Weinberg equilibrium test was performed for the 18 SSR loci across all populations. Data on the number of alleles (Na), number of effective alleles (Ne), Shannon’s index (I), observed heterozygosity (Ho), expected heterozygosity (He), Nei’s diversity index (H), fixation index (F), Wright’s fixation index (Fis), Fit index, genetic differentiation coefficient (Fst), gene flow (Nm), and percentage of polymorphic loci (PPL) were calculated for molecular genetic variance (AMOVA) analysis to compute the genetic variance components within and among populations of P. serrulata and P. xueluoensis.
Population structure grouping analysis for all individuals from 13 populations of P. serrulata and P. xueluoensis was conducted using Structure 2.3.4 software. The Markov Chain Monte Carlo (MCMC) was set to 30,000, the length of the burn.in period was set to 100,000, and K was set from 2 to 13, with each K being run independently 10 times. The results from files with the suffix “f” were compressed and uploaded to the Structure Harvester website (http://taylor0.biology.ucla.edu/struet_harvest/, accessed on 23 December 2022), where the rate of change in the log probability of data (∆K) and the log likelihood value lnp (D) was calculated according to the method of Evanno et al. [31], to model the number of gene pools (K) and determine the optimal value of K [29].

2.4. CpDNA Haplotypes Analysis

The sequencing results were opened in “.abi” format returned by the gene company using ContigExpress (Vector NTI Express 1.6 software) [28]; trnD lacks a poly structure and only requires forward sequencing. We opened the chromatogram to check for misreads, and copied the sequence into a “txt” format document. matK and trnS had poly structures [29], requiring bidirectional sequencing. We opened the bidirectional sequencing chromatograms for comparison. In cases of nucleotide discrepancies, we selected the peaks with clear peaks and troughs, uniform distance between peaks, and no interference from miscellaneous peaks as the final sequencing result. We removed sequences corresponding to chaotic and unrecognizable peaks at both ends of the gene fragment, and recorded the corrected sequences into a “txt” format document. We compiled the same segments of sequences from all individuals into one “txt” format document, changed the file extension to “fas”, and opened it with MEGA X 10.2.8 software. We cut the sequences of each chloroplast fragment according to the alignment results to equal lengths, manually concatenated them in the same fragment order to obtain the final chloroplast sequence matrix, and saved it in formats such as “fasta”, “meg”, “mas”, “nexus”, etc., for subsequent analysis [30].
The compiled “.fas” format file was opened using DnaSP 6.12.03 software, which was utilized to calculate the number of haplotypes (Nh), the number of individuals containing each haplotype (N), haplotype diversity (Hd), and nucleotide polymorphism (Pi). With DnaSP 6.12.03, the variable sites between haplotypes and the base changes were cataloged, and ArcMap 10.5 was used to create a geographic distribution map of the haplotypes. DnaSP6 software was further used to calculate each population’s neutral test parameters [32] and record the data for the mismatch distribution analysis, which were replotted using Python to infer whether the species’ history had undergone balancing selection or an expansion event. The genetic differentiation of P. serrulata and P. xueluoensis was tested using the Analysis of Molecular Variance (AMOVA) approach. A haplotype network was constructed using TCS1.2.1 software; Prunus yedoensis from the NCBI database was chosen as the outgroup for the genus Prunus; iTOL: Interactive Tree of Life (https://itol.embl.de/, accessed on 15 January 2023) was employed for phylogenetic tree editing; and DnaSP 6.12.03 software was applied for chloroplast gene population history analysis. The data obtained were then imported into Python for graphing.

3. Results

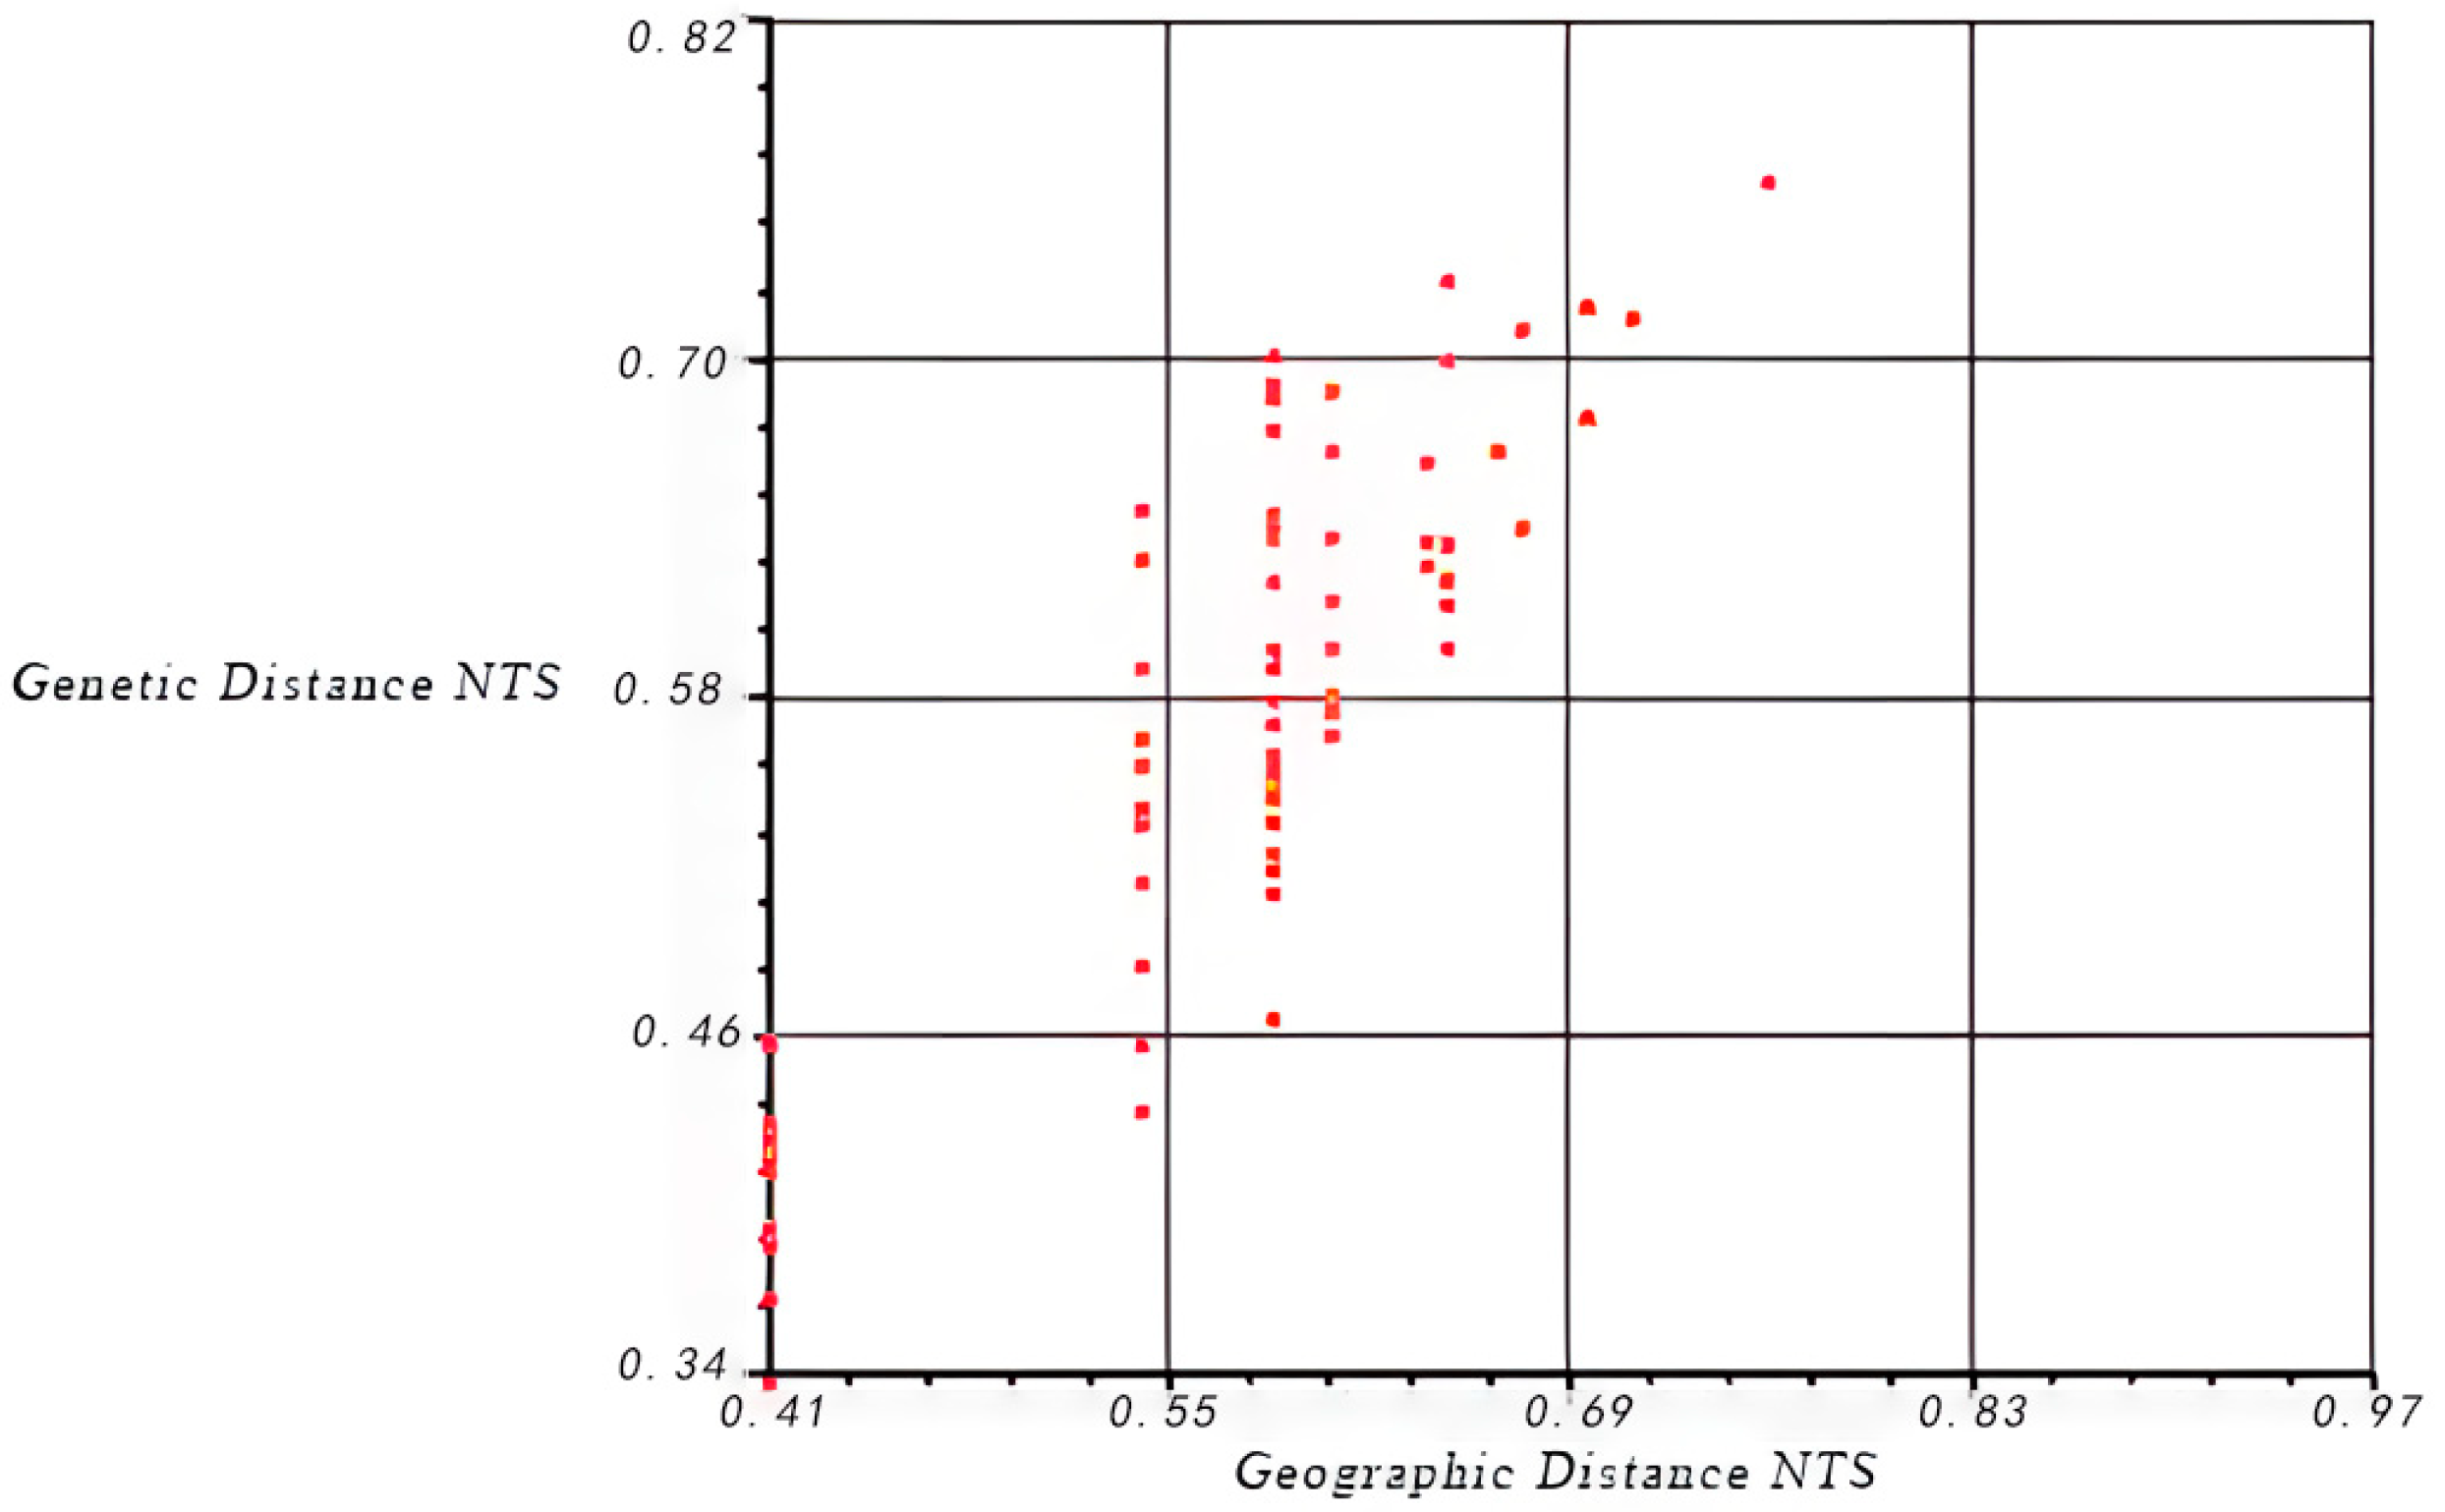
3.1. Genetic Diversity of SSR Microsateilite Locus and Gene Flow

Based on the relevant literature [32,33,34,35,36], a total of 47 pairs of SSR primers were selected. These primers were tested by randomly selecting samples from the total sample pool for initial screening. Ultimately, 18 pairs of SSR primers that exhibited clear bands and strong polymorphism were chosen for comprehensive testing. The sequences of the 18 selected SSR primers are shown in Table 2.
Among the 234 combinations of 13 populations and 18 loci, 26 combinations had p < 0.05 and did not meet the Hardy–Weinberg equilibrium; 36 combinations had p < 0.01, and 41 combinations had p < 0.001, all showing significant deviation from the Hardy–Weinberg equilibrium. Only about half of the combinations had p > 0.05, which satisfies the Hardy–Weinberg equilibrium. Table S1 shows that P. xueluoensis populations deviate from the Hardy–Weinberg equilibrium at 9, 11, 7, 11, 3, 8, 13, and 4 loci, with the following order of deviation: DWSx > QLFxU = LSxU > QLFxD > MYSxU > LSxD > Esx > MYSxD. For P. serrulata populations, the deviations occurred at 15, 9, 4, 2, and 12 loci in the order QLFs > FHSs > LuSs > LaoSs > MYSs. Significant deviations from the Hardy–Weinberg equilibrium occur more frequently in P. xueluoensis populations. The occurrence of monomorphic loci with different primers across different populations is rare, indicating that the 18 primers selected in this study are representative, and the results obtained have scientific validity. Based on the above evidence, it is hypothesized that a large amount of genetic mutation, genetic drift, and non-random mating (later refuted by the conclusions) may occur within both P. serrulata and P. xueluoensis populations.
During this experiment, a total of 105 alleles were detected (Table S2). The SSR loci selected exhibit rich polymorphism, possessing sufficient discriminatory power to differentiate between the two species.
Based on the genetic diversity of P. serrulata and P. xueluoensis populations as shown in Table S3, at the population level, the Nei’s genetic diversity index (H) and Shannon’s information index (I) for P. serrulata were 0.578 and 1.129, respectively, and for P. xueluoensis were 0.642 and 1.342. Compared with previous studies that reported H = 0.6893, I = 1.4269 for P. serrulata [37,38], H = 0.558, I = 0.7126 for Prunus cerasus [27], I = 1.280 for Prunus tomentosa [39], and H = 0.543, I = 0.812 for P. serrulata [32], both P. serrulata and P. xueluoensis have relatively high levels of genetic diversity at the population level, with P. xueluoensis showing greater diversity than P. serrulata. The observed heterozygosity (Ho) for P. serrulata, P. xueluoensis, and overall is less than the expected heterozygosity (He), and the difference between Ho and He for P. serrulata is larger than that for P. xueluoensis. This indicates that there is an imbalance in mating within the populations of P. serrulata and P. xueluoensis. The fixation index (F) indicates that inbreeding exists within both P. serrulata and P. xueluoensis populations, consistent with the results of the previous Hardy–Weinberg equilibrium test. The DWSx population has the highest F value, indicating the most severe inbreeding.
Gene flow between P. serrulata and P. xueluoensis populations, as shown in Table S4. Gene flow between populations of P. serrulata and P. xueluoensis is significantly correlated with their geographical distribution. Gene flow (Nm) among P. xueluoensis populations is generally greater than 1 with smaller variance, whereas gene flow among P. serrulata populations is slightly less and has larger variance. Gene flow (Nm) between P. serrulata and P. xueluoensis populations in the Lushan and Qingliang Feng regions is even higher than that within some P. serrulata populations, indicating no reproductive isolation and frequent gene exchange between the two species. The gene flow (Nm) between P. xueluoensis populations in Dawaishan, Hunan, and Enshi, Hubei, is the highest, and Dawaishan has various degrees of gene exchange with other populations. Northern P. serrulata populations (FHSs, LaoSs) have limited gene exchange with other populations, likely due to geographical distance and the ocean’s impact on seed and pollen dispersal.

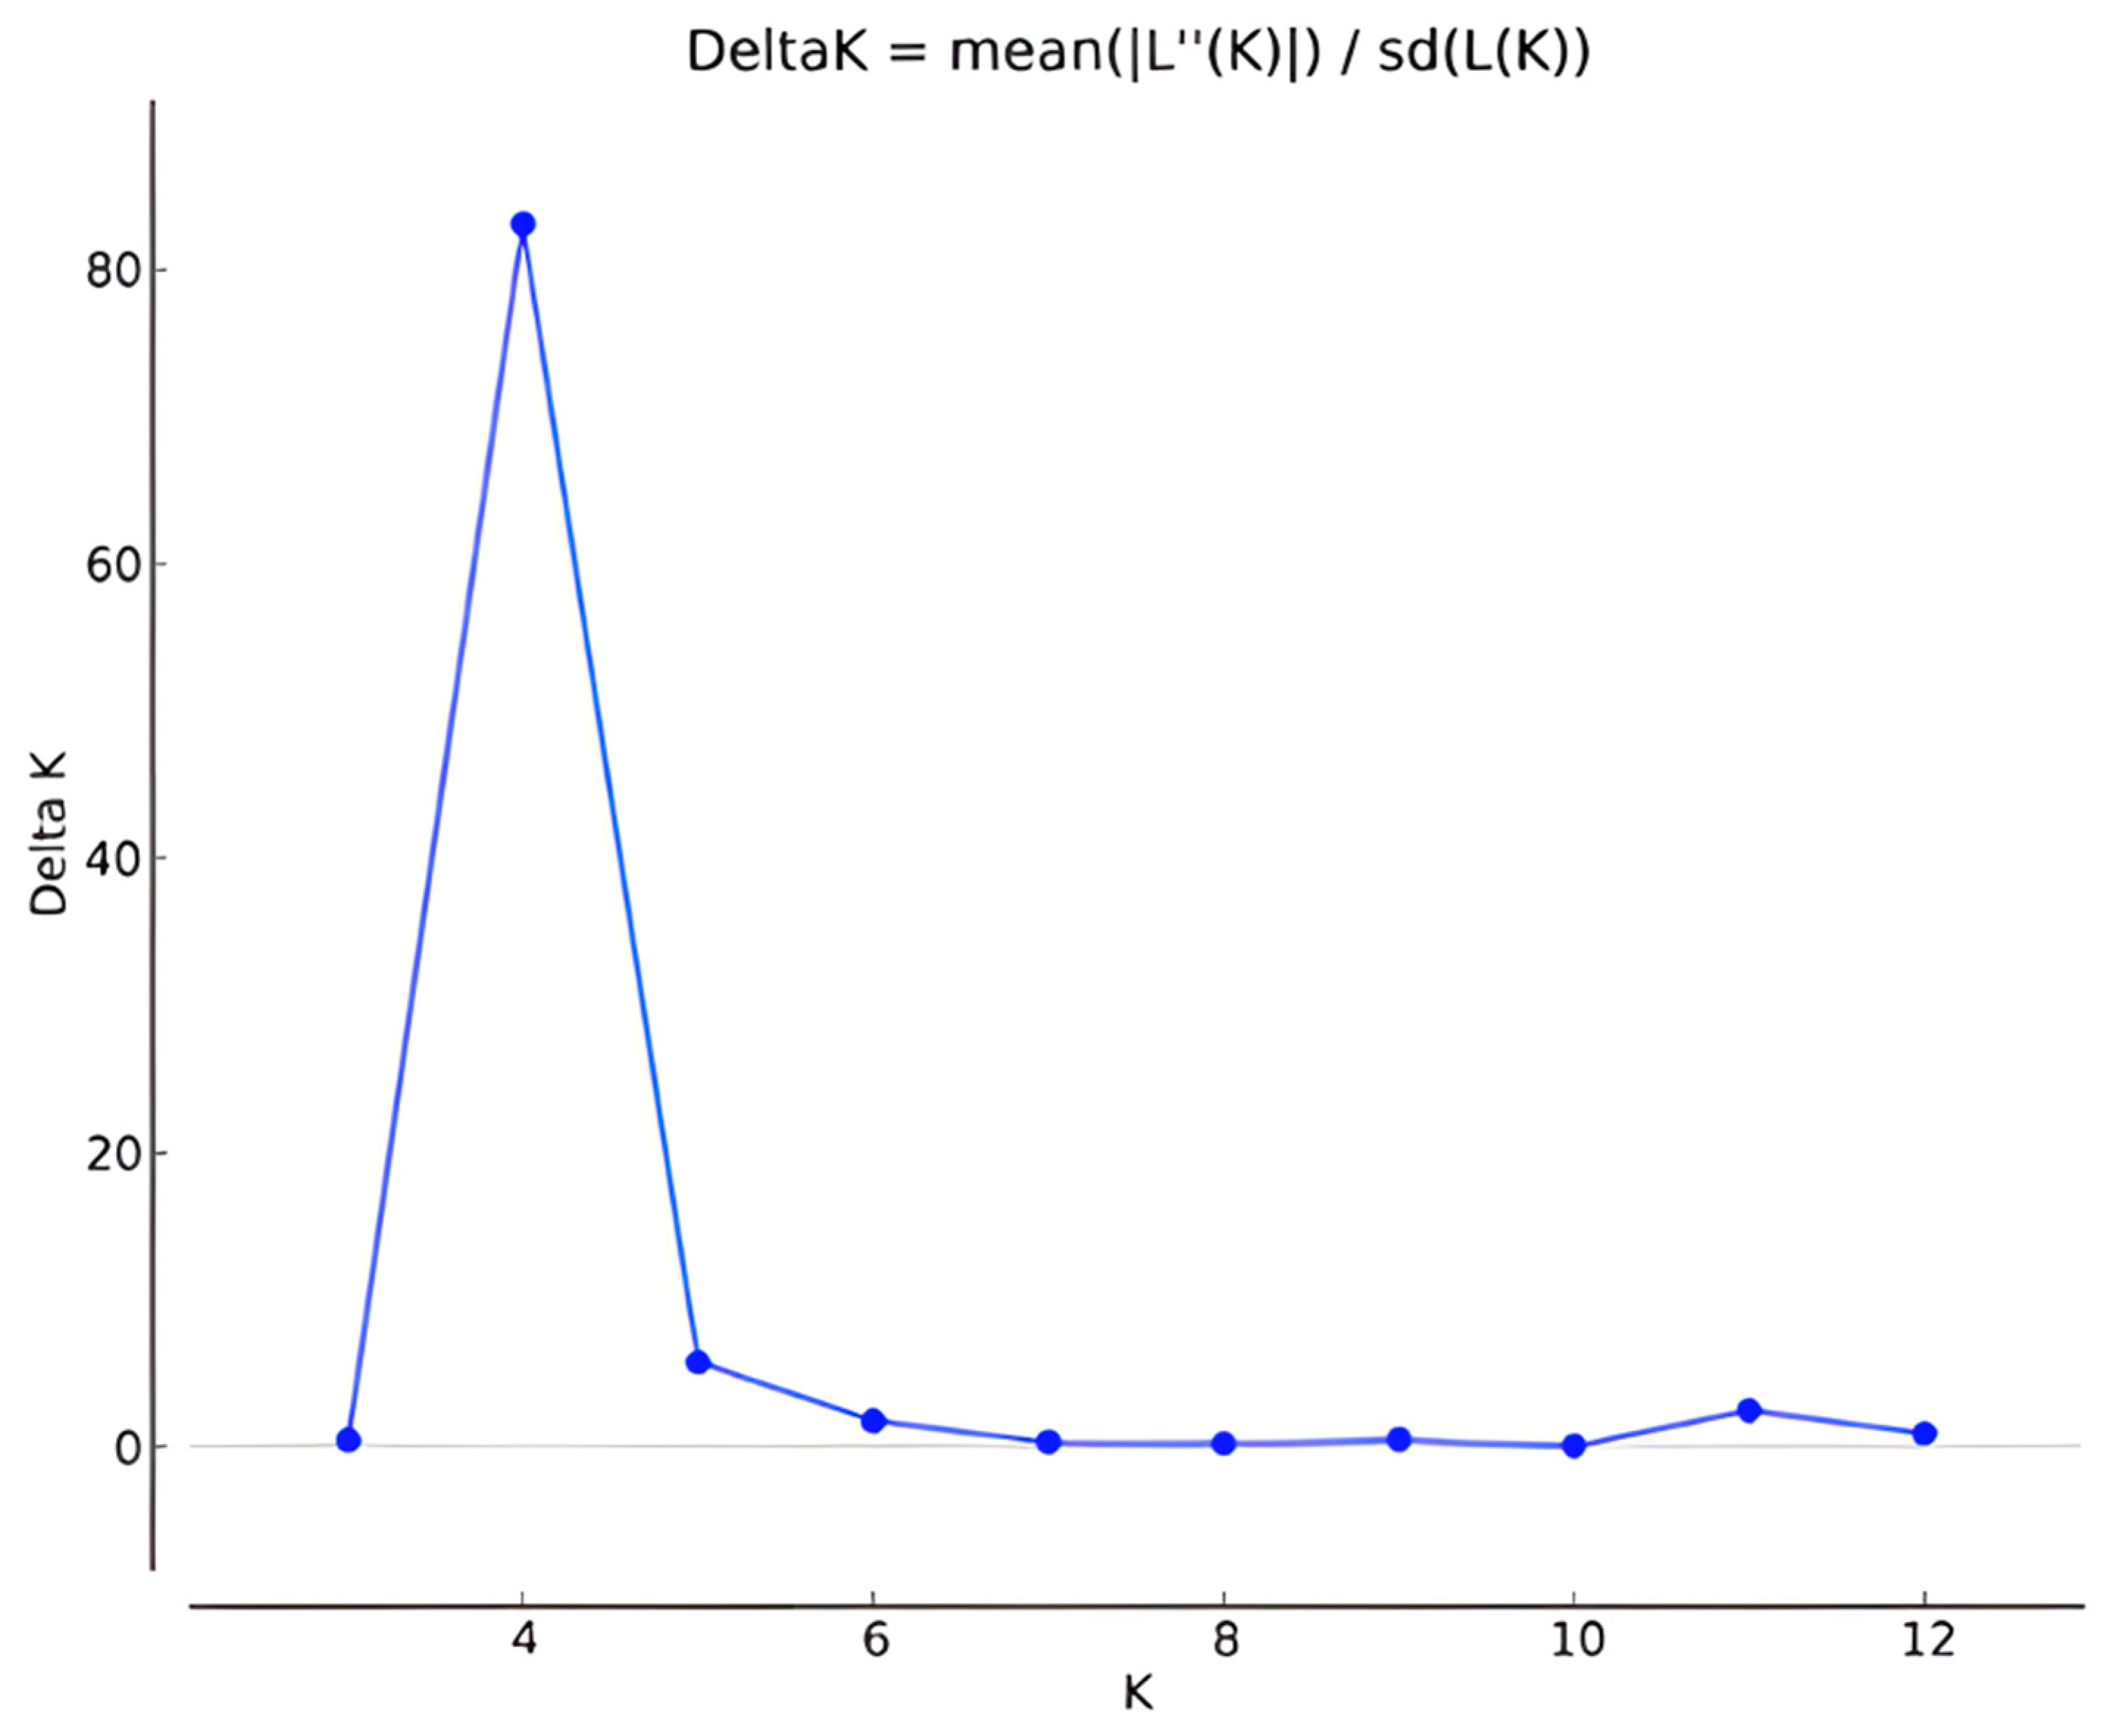
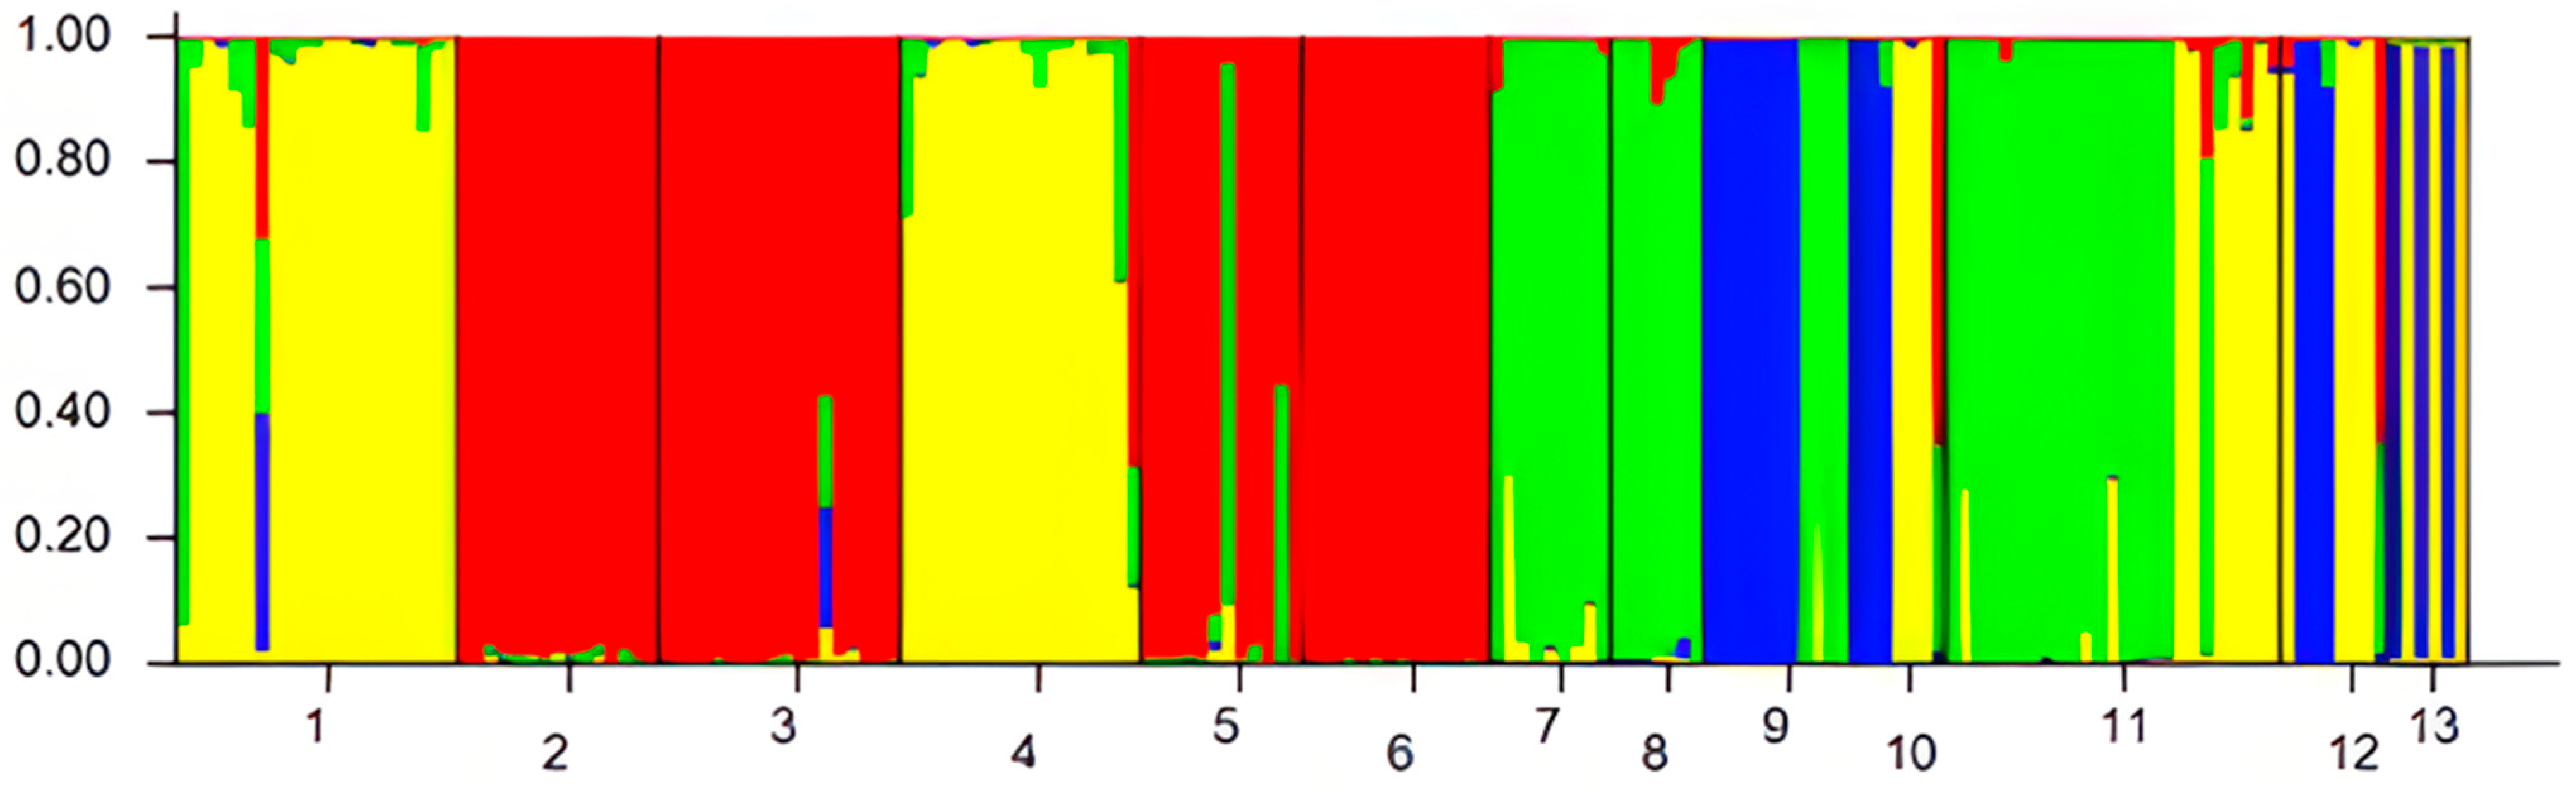
3.2. Genetic Differentiation, Structure, and Cluster Analysis

Tables S5–S7 represent the genetic variance analysis of P. serrulata, P. xueluoensis, and the overall populations, respectively. The genetic differentiation coefficient (FST) among all populations of P. serrulata and P. xueluoensis is listed in Table S8 and shows the FST among all populations. The percentages of total genetic variation attributable to both between and within populations for P. serrulata, P. xueluoensis, and their hybrids are all very similar. This suggests that the intraspecific composition of P. serrulata and P. xueluoensis is alike, indicating a close phylogenetic relationship and possibly similar dispersal pathways.
Figure 2 shows that when K = 4, ΔK reaches its highest peak, indicating that these 13 populations can be considered to originate from four gene pools. Similarly, at K = 4, the grouping of these 13 populations calculated by Structure is shown in Figure 3. The cluster analysis based on Nei’s genetic distance for the 13 populations of P. serrulata is presented in Figure 4, grouping them into three clusters: the first group consists of the populations FHSs and LaoSs from the Northeast and North China regions; the second group includes the populations MYSs, MYSxD, and MYSxU from Mingyue Shan, the QLFs and LuSs of P. serrulata from Qingliang Feng and Lushan, and the DWSx and ESx populations of P. xueluoensis from Dawei Moun and Enshi; and the third group includes the QLFxD, QLFxU, LuSxD, and LuSxU populations of P. xueluoensis from Qingliang Feng and Lushan in Zhejiang. Gene flow and genetic differentiation analyses suggest a moderate positive correlation between the degree of differentiation and geographical distance for P. serrulata and P. xueluoensis. This indicates that geographical distance has negatively impacted gene exchange between populations to some extent, leading to the formation of clusters like FHSs and LaoSs. The second group occupies the provinces of Hunan, Hubei, Jiangxi, and Zhejiang and may represent an older clade, serving as a central group within this study’s sample. Despite some genetic differentiation, gene exchange with other regional populations is frequent. The third group likely represents newly formed clades that adapted to the warm and rainy environments of Lushan in Jiangxi and Qingliang Feng in Zhejiang. Due to limited resources and increased competition in low-altitude areas, P. xueluoensis gradually shifted to higher altitudes, leading to closer geographical proximity and shared genetic factors among populations. This also explains the lower FST values observed between the QLFs and QLFx populations compared to those of MYSxU, MYSs, and LaoSs.
A correlation analysis between genetic distance and geographical distance among the populations (Figure 5) yielded a regression equation with r = 0.88082 and p = 0.9998, indicating a very high positive correlation between genetic distance and geographical distance for P. serrulata and P. xueluoensis. This result is consistent with the cluster analysis (Figure 4). It can be concluded that, to some extent, the primary factor determining gene flow between P. serrulata and P. xueluoensis is the geographical distance between populations. This also contributes to the rich genetic diversity observed in these populations.

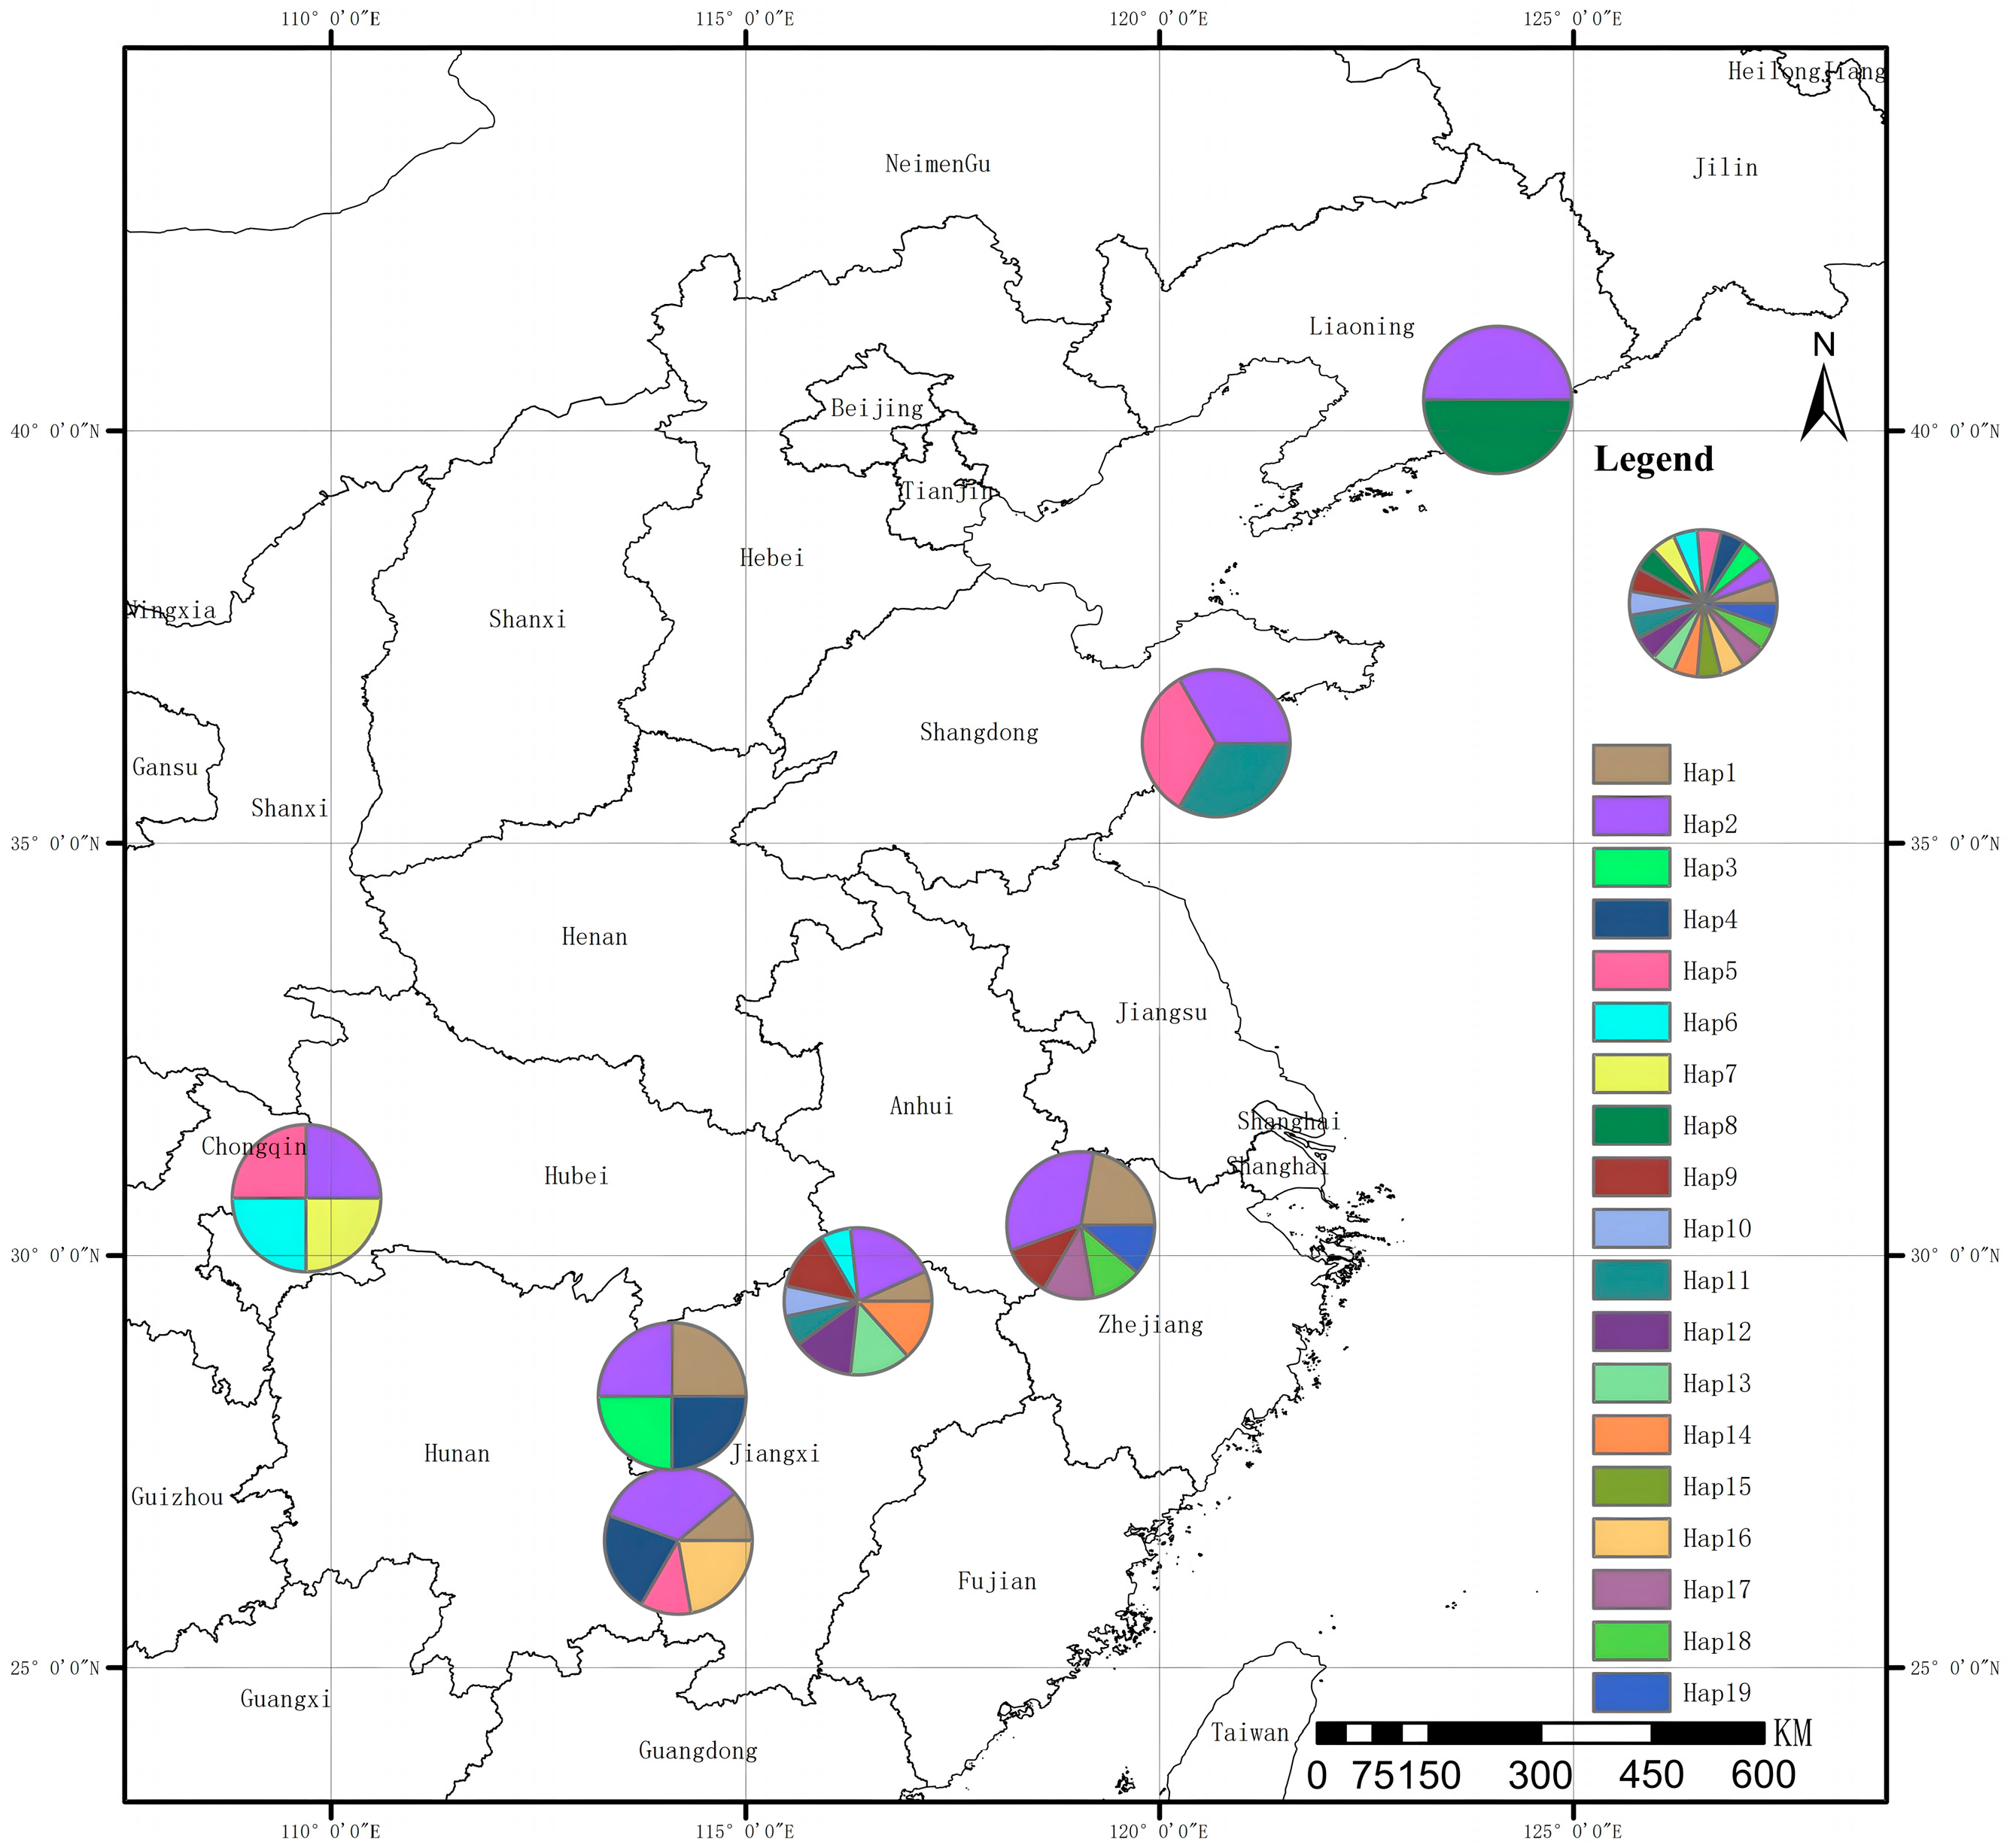
3.3. CpDNA Genetic Diversity and Structure

Chloroplast gene fragments were spliced to form a combined matrix of 1777 bp in length, consisting of matK 778 bp, trnD-E 615 bp, and trnS-G 384 bp. Using DNAsp software, the number of haplotypes for three species, P. serrulata, P. xueluoensis, and P. jingningensis, was calculated. MEGA was utilized to collate information on various polymorphic sites. Based on the sampling location data and the number of haplotypes in the population, the distribution of 19 haplotypes were statistically analyzed (Figure 6).
Based on the sampling location information and the number of haplotypes in each population, the distribution of 19 haplotypes was tabulated (Tables S9 and S10). The QLFs population contained the highest number of haplotypes, totaling six, while other populations mostly comprised two to five haplotypes. The haplotype Hap2 was found in all populations, indicating that it is the most widely distributed and earliest occurring haplotype shared among all P. serrulata and P. xueluoensis populations. Overall, P. serrulata exhibits a greater variety of haplotypes, with higher haplotype diversity (Hd) and nucleotide polymorphism (Pi); on the other hand, P. xueluoensis shows fewer haplotype varieties, with lower haplotype diversity (Hd) and nucleotide polymorphism (Pi).
Gst is only related to haplotype frequency, while Nst is determined by both haplotype frequency and the similarity between haplotypes, with the degree of differentiation being proportional to the ratio of Nst to Gst [40]. As shown in Table S11, at the species level, both P. serrulata (Nst = 0.254, Gst = 0.103, Nst/Gst = 2.466, p < 0.05) and P. xueluoensis (Nst = 0.366, Gst = 0.268, Nst/Gst = 1.366, p < 0.05) exhibit a phylogeographic structure. However, when considering P. serrulata and P. xueluoensis as a whole, there is no significant phylogeographic structure (Nst = 0.317, Gst = 0.400, Nst/Gst = 0.793, p < 0.05). Therefore, we can conclude that both P. serrulata and P. xueluoensis have their own distinct phylogeographic structures, with interspecies variation and intrapopulation variation accounting for ratios between 2:8 and 3:7, indicating that P. serrulata and P. xueluoensis have indeed completed differentiation.

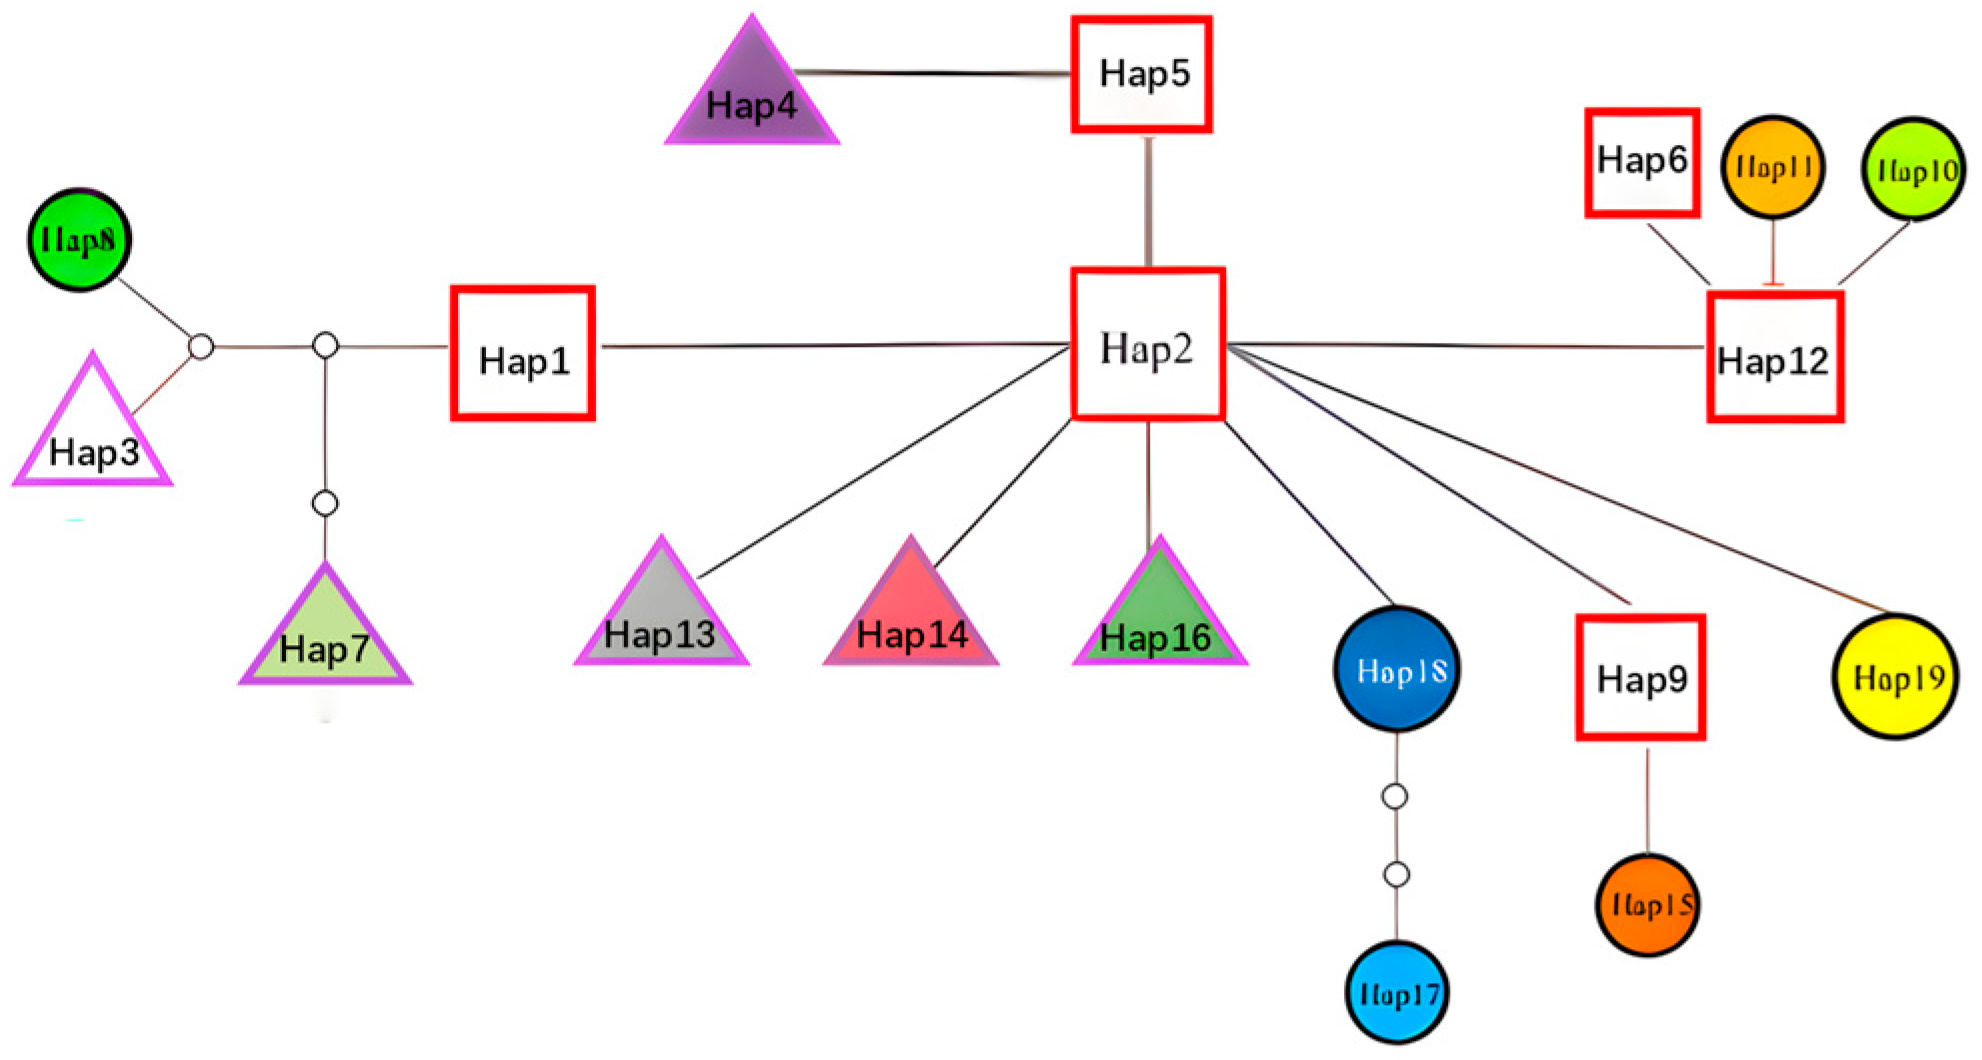
3.4. Haplotype Network

The haplotype network constructed based on chloroplast sequence fragment loci variations using the TCS 1.2.1 software is presented in Figure 7. Hap2 is the central haplotype of the network, suggesting that Hap2 is the oldest and most widely distributed haplotype. Eight older haplotypes extend from Hap2: Hap5, Hap8, Hap9, Hap13, Hap14, Hap16, Hap18, and Hap19. Although the haplotype network does not form a complete lineage, it is clear that the haplotypes specific to P. xueluoensis are only present at the terminal ends of the network. The center of the network (Hap2) and key nodes (Hap1, Hap5, Hap18) are composed of haplotypes specific to P. serrulata and shared haplotypes. According to coalescent theory, the P. serrulate-specific haplotype Hap8 and the P. xueluoensis haplotypes Hap3 and Hap7 are derived from the shared haplotype Hap1. The shared haplotype Hap4 is derived from Hap5 and possibly shares the estimate of average age of the latest common ancestor with the P. serrulate-specific haplotypes Hap6, Hap10, Hap11, and Hap12. Hap13 and Hap14 may be new haplotypes that arose from Hap2 to adapt to the Lushan environment, while Hap16 is a P. xueluoensis haplotype that arose from Hap2 to adapt to the Mingyue Shan environment. Hap3 and Hap7 are P. xueluoensis haplotypes that evolved from the shared haplotype Hap1 to adapt to the environments of Dawei Shan and Enshi, respectively.

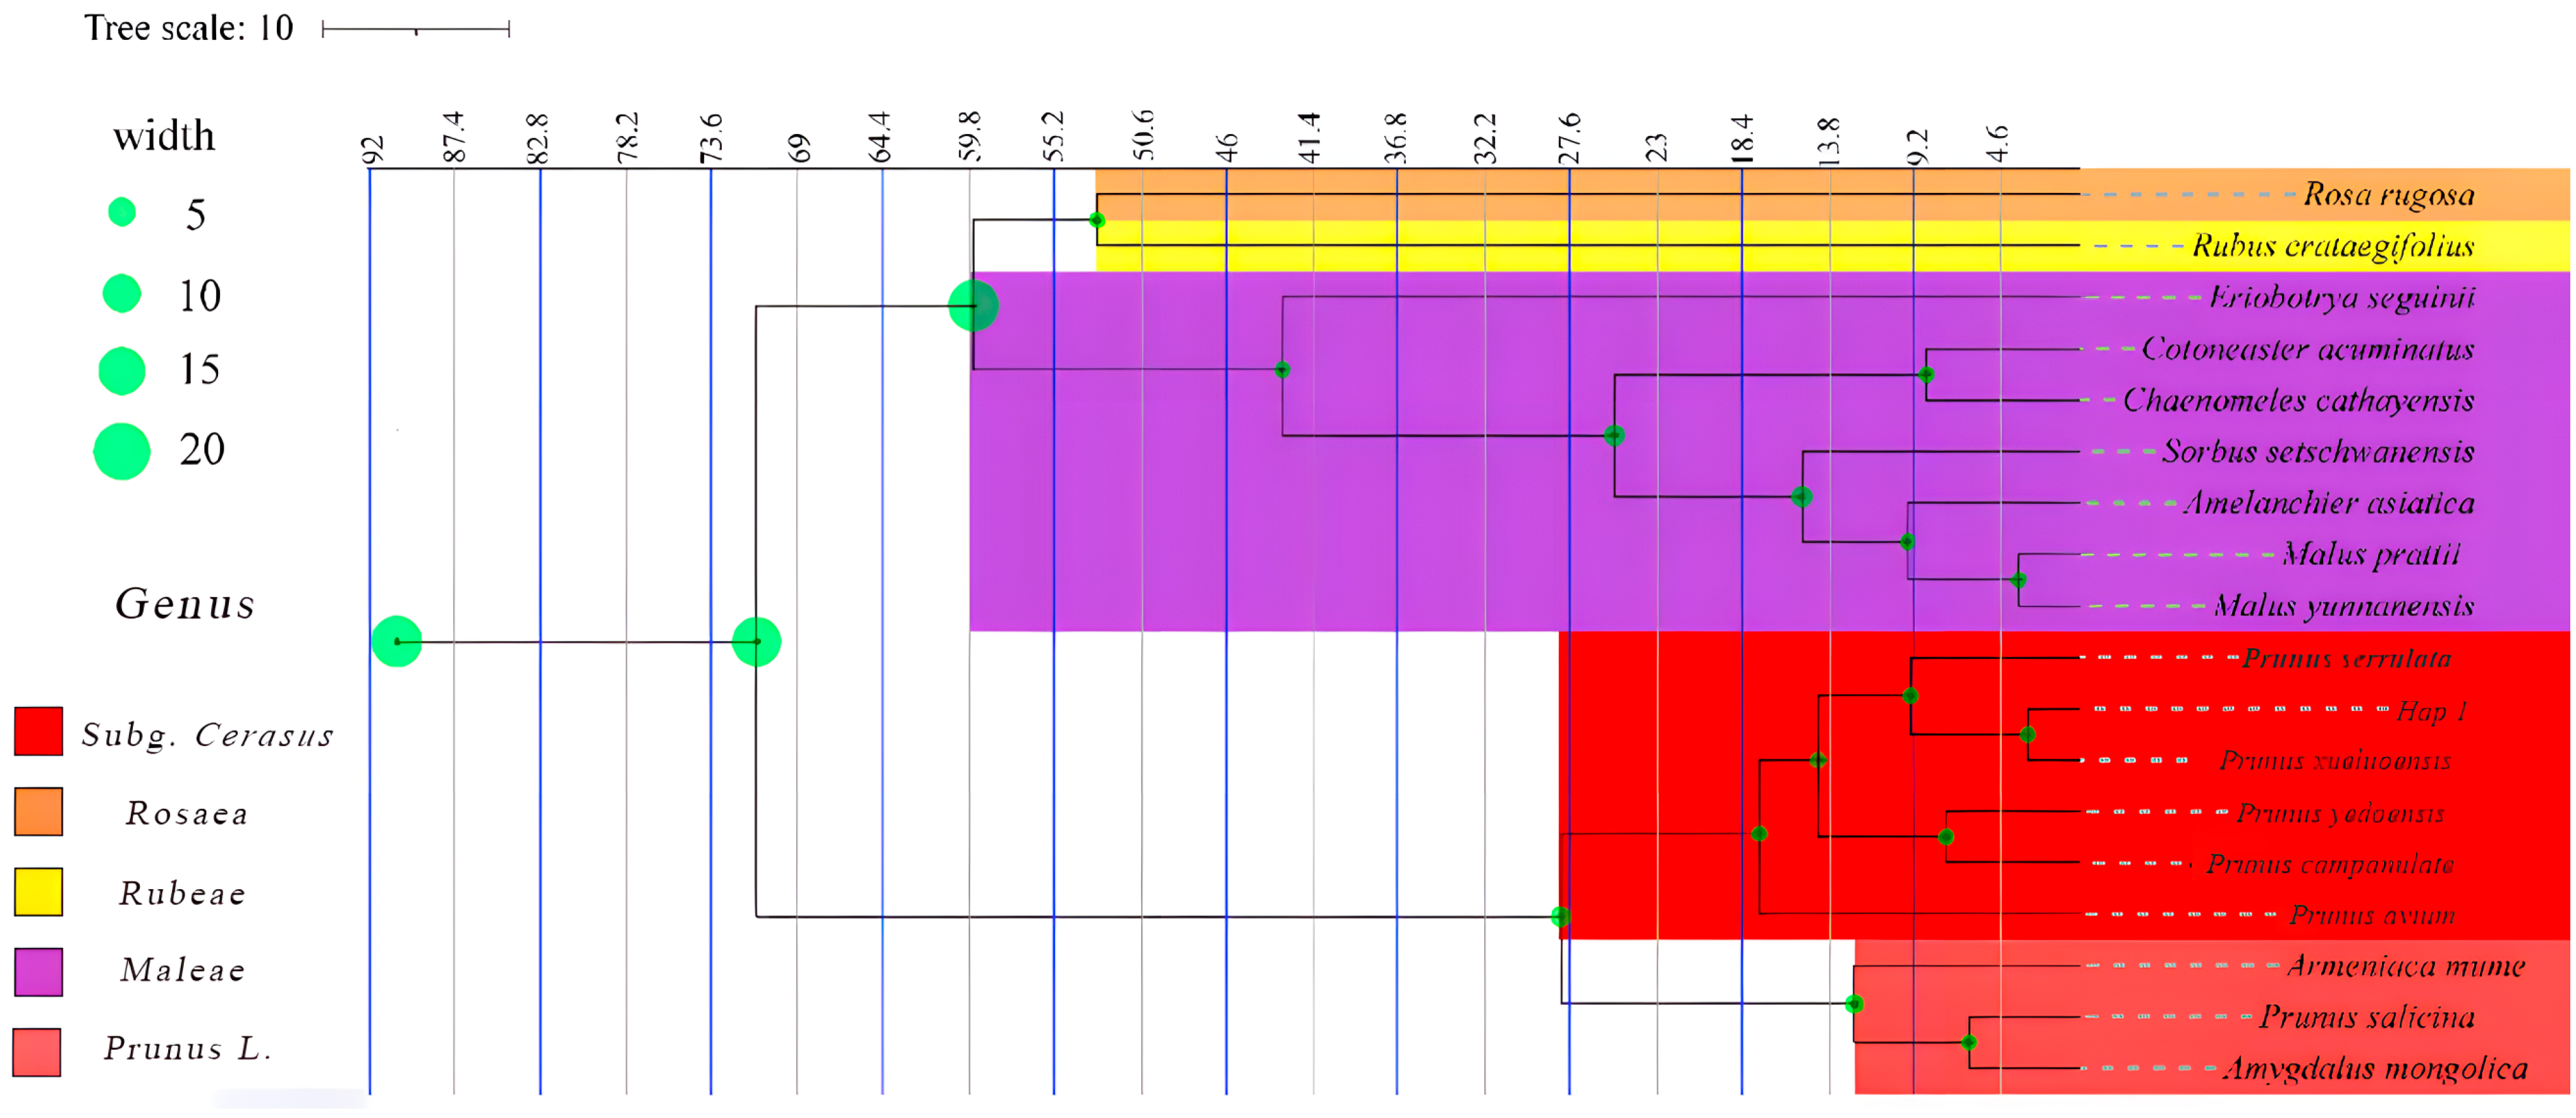
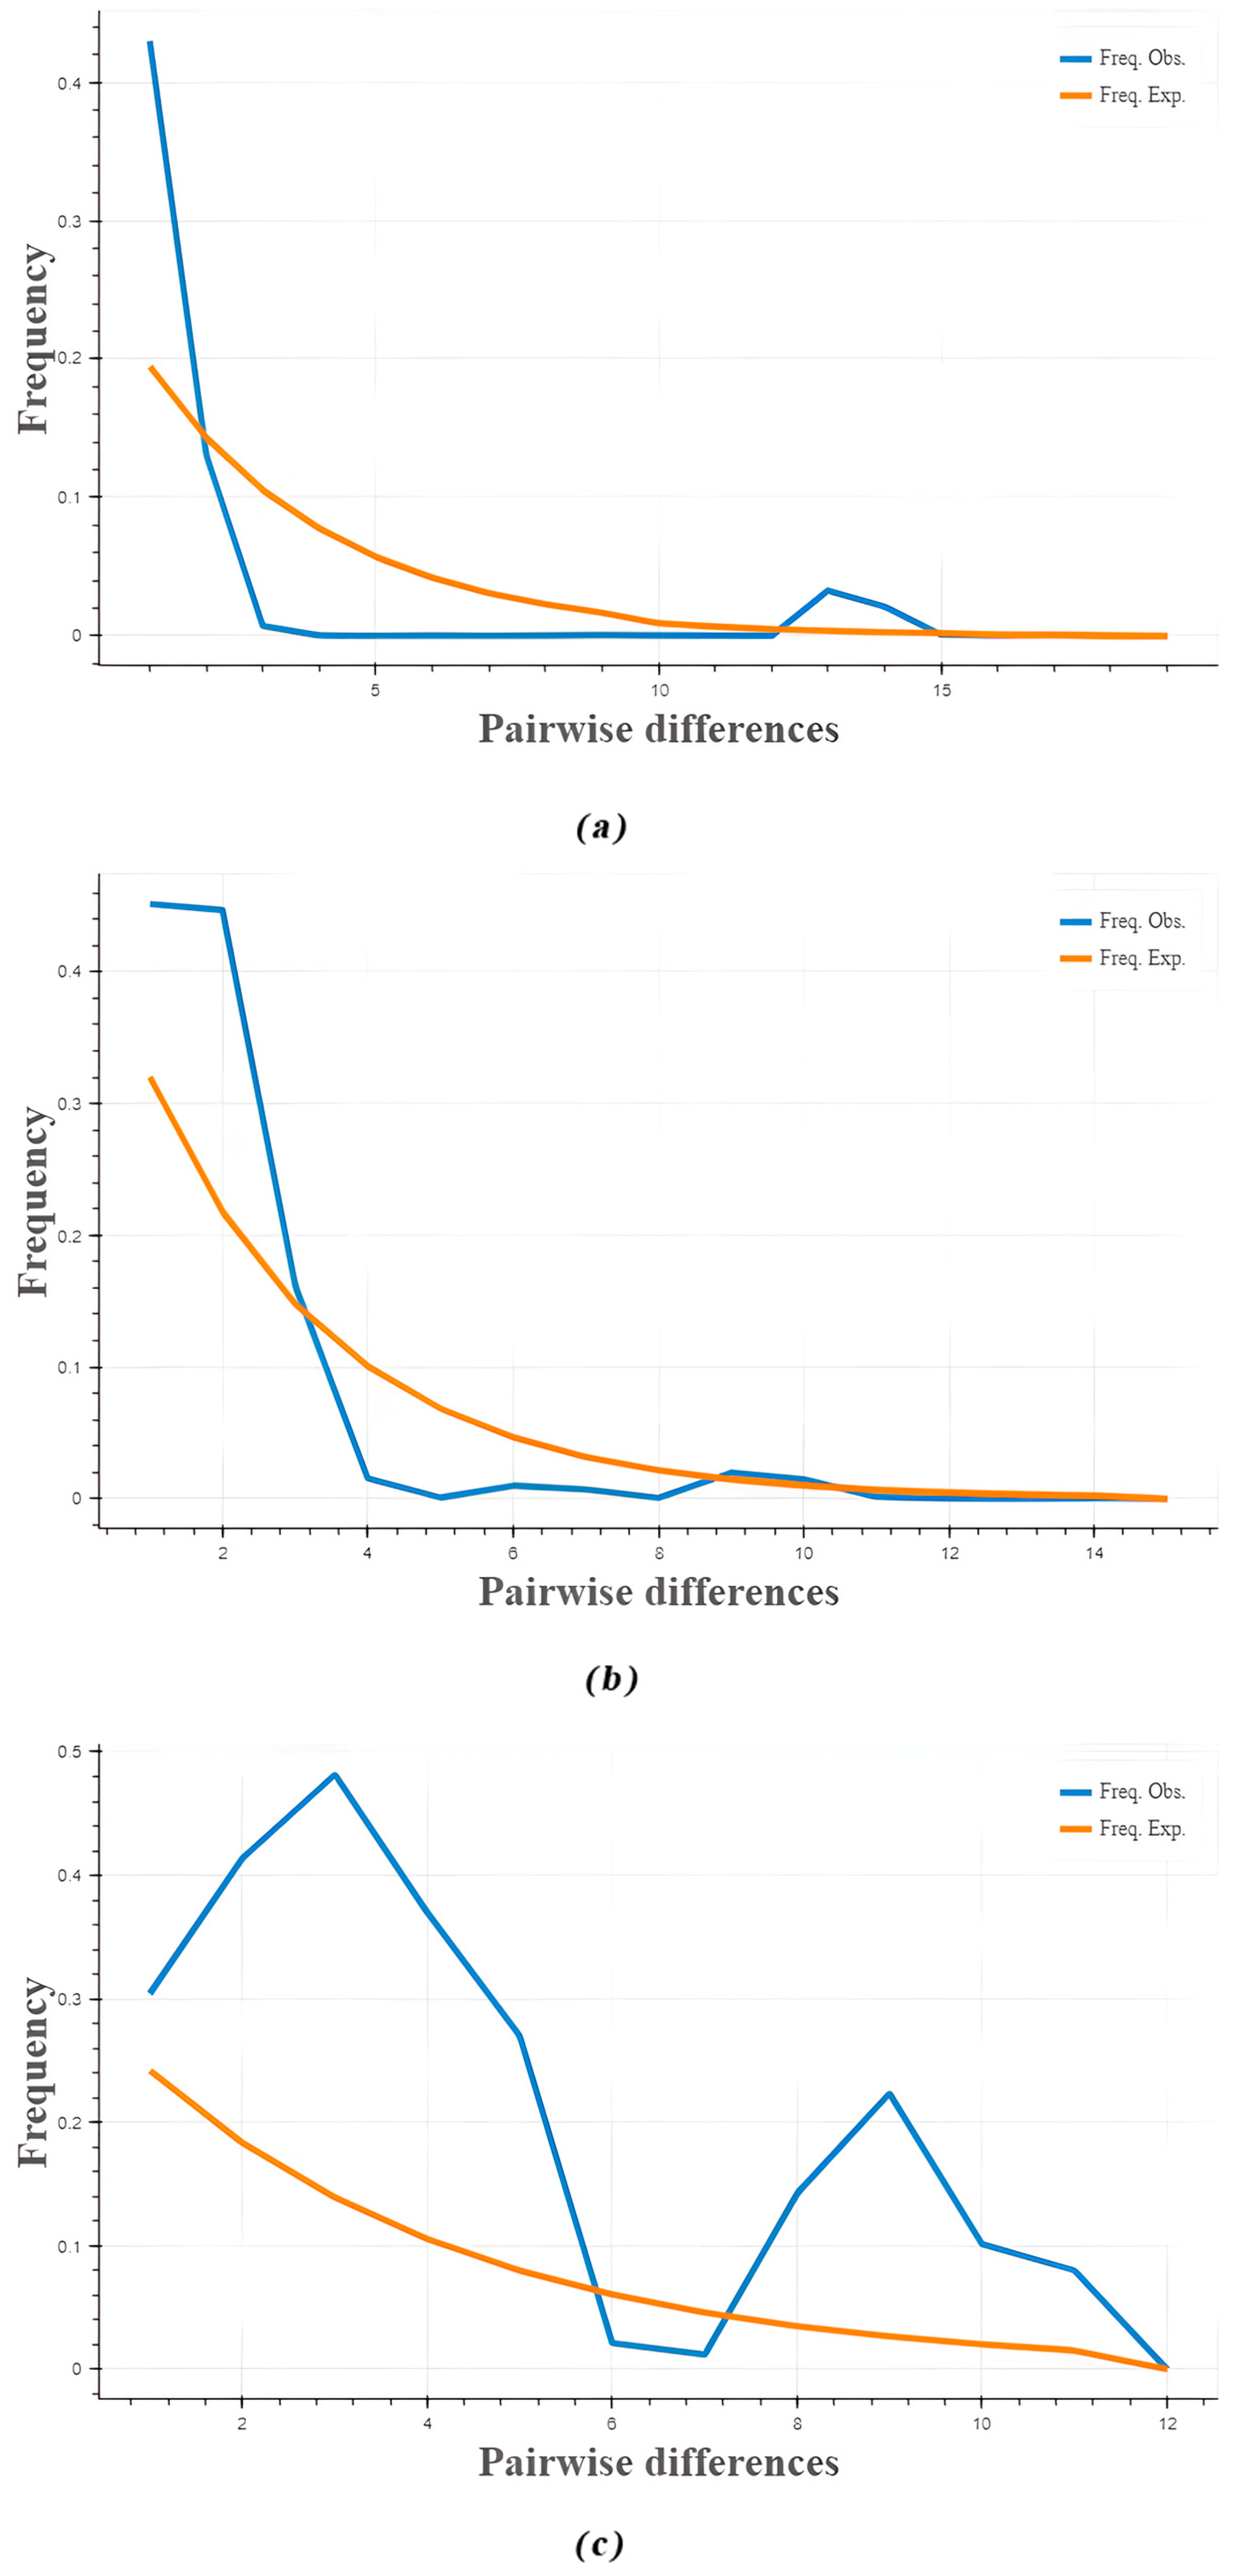
3.5. Phylogenetic Tree, Temporal Differentiation, and Collective Historical Events

The maximum parsimony tree (MP) constructed based on the matK, trnD-E, and trnS-G gene fragments is shown in Figure 8. Due to different algorithms, the maximum parsimony tree (MP), maximum likelihood tree (ML), and UPGMA tree do not produce identical results: P. xueluoensis—specific haplotypes form a highly supported independent clade at the end of the phylogenetic tree; shared haplotypes and P. serrulata—specific haplotypes are mostly located at the base of the phylogenetic tree, consistent with the TCS haplotype network results, suggesting the two species have a close genetic relationship and P. xueluoensis may have originated from P. serrulata.
Based on the latest phylogenetic tree of the Rosaceae, a genus-level phylogenetic tree within the family was constructed (Figure 9). This phylogenetic tree was built using matK chloroplast DNA sequence fragments from representative groups of the Rosaceae obtained from NCBI. Two molecular clocks were applied: the Rosaceae crown divergence time (90.98–94.95 Mya [41]) and the Prunus + Cerasus divergence time (24.79 Mya [42]). The resulting phylogenetic tree estimated the crown age of the genus Prunus at 17.81 Mya (PP = 1; 95% HPD: 13.52–22.1 Mya) and the divergence time between P. serrulata and P. xueluoensis at 3.22 Mya (PP = 1; 95% HPD: 3.07–3.46 Mya).
Neutral tests were performed at the species level and across different geographic groupings, with the results shown in Table S12. The results show that among the five populations of P. serrulata, the Fu’s FS values of the MYSs, FHSs, and LaoSs populations are positive, while those of the LuSs and QLFs populations are negative. All populations have non-significant p-values (p > 0.10). In the eight populations of P. xueluoensis, the Fu’s FS values of the QLFx-U, QLFx-D, MYSx-U, MYSx-D, and ESx populations, as well as the entire QLFx and MYSx populations, are positive. Conversely, the Fu’s FS values of the LuSx-U, LuSx-D, and DWSx populations, as well as the entire LuSx population, are negative. All populations have non-significant p-values (p > 0.10). The Fu’s FS values of each population are consistent with their Tajima’s D* values, indicating similar results from both tests, thus confirming the reliability of the findings.
Figure 10 shows that the mismatch distribution analysis for P. serrulata is unimodal, while that for P. xueluoensis reveals a clear bimodal pattern. Mismatch analysis conducted at the species level and across different geographic groupings only displays a bimodal distribution for P. xueluoensis, indicating that P. serrulata has experienced historical population expansion or a bottleneck event, whereas P. xueluoensis has not. Given that the southwestern region is considered the most likely origin of the Prunus genus and a refugium for P. serrulata [42], and considering the haplotype distribution, the TCS network graphs, the phylogenetic tree, and divergence timing, we can infer that P. serrulata expanded from the southwest and branched into two directions in the Hunan–Hubei region: one towards the northeast and north, and another towards the southeast. The lineage of P. serrulata that migrated toward the southeast differentiated due to environmental differences between higher and lower elevations, with individuals in the wet, warm alpine environment gradually diverging to eventually form a new species—P. xueluoensis. This hypothesis aligns with the conclusions of phylogeographic studies on the Prunus genus [43,44,45].

4. Discussion

4.1. Genetic Diversity and Variation

Plants of the Subg. Cerasus are widely distributed in the warm regions of the Northern Hemisphere, with P. serrulata extensively found across most areas of China as a common species at the edge of warm temperate forests. P. xueluoensis populations are more often located on the sunny or semi-sunny slopes at the edge of stunted shrub forests in the subtropical region. In their native conditions, the terrain, climate, soil, and other environmental factors all affect the community composition of P. serrulata and P. xueluoensis to varying degrees [46,47,48]. Given that interspecific reproductive isolation is uncommon within Rosaceae, and gene flow is relatively common among species of the same genus, coupled with the role of birds and rodent foraging behaviors in objectively aiding the dispersal of Prunus seeds, the genetic diversity within the Subg. Cerasus is generally high [49]. The genetic diversity within the Subg. Cerasus is typically influenced by factors such as sampling strategies, the evolutionary rate of the genes, and the historical dynamics of the populations [50]. In this study, the sampling of P. serrulata and P. xueluoensis covered three main distribution areas in north (Fenghuang Shan, Laoshan), central (Enshi, Daweishan), and southeast China (Lushan, Mingyue Shan, Qingliang Feng). Samples from both species were collected at the population level, minimizing the impact of sampling strategy differences on genetic diversity assessments.
At the species level, Nei’s genetic diversity index (H) and Shannon’s information index (I) for P. serrulata and P. xueluoensis were 0.578 and 1.129, and 0.642 and 1.342, respectively. At the population level, these indices revealed a gradation of genetic diversity across 13 groups: FHSs < MYSs < MYSxD < LuSs < LSxU < MYSxU < QLFs < DWSx < LSxD < QLFxU < LaoSs < QLFxD < Esx. Together with previous research showing H = 0.6893, I = 1.4269 for Prunus campanulate [37,38], H = 0.558, I = 0.7126 for Prunus discoidea [27], I = 1.280 for Prunus tomentosa [39], and H = 0.543, I = 0.812 for P. serrulata [32], it is evident that both P. xueluoensis and P. serrulata populations possess rich genetic diversity, with P. xueluoensis displaying higher levels than P. serrulata. Species-level chloroplast genetic diversity (Hd) for P. serrulata was 0.553 with nucleotide diversity (Pi) at 0.00136, and for P. xueluoensis Hd was 0.496 with Pi at 0.00180. The higher chloroplast genetic diversity in P. serrulata, with lower nucleotide diversity, may relate to its widespread geographical distribution. The heightened nucleotide diversity in P. xueluoensis might be attributed to the rapid mutation rates fostered by complex mountain environments. The population differentiation fixation index (F) for P. serrulata was 0.124, indicating significant genetic differentiation among populations, with a pronounced phylogeographic structure (Nst = 0.254, Gst = 0.103, Nst/Gst = 2.466, p < 0.05). For P. xueluoensis, a higher F value of 0.222 suggests even greater differentiation, corroborated by a defined phylogeographic structure (Nst = 0.366, Gst = 0.268, Nst/Gst = 1.366, p < 0.05).
The distribution of haplotypes, particularly Hap2, suggests an even frequency across different populations, indicating substantial gene flow yet incomplete differentiation. The Fst diversification coefficient and gene flow (Nm) analysis further supports these findings, where genetic differentiation between any two populations is inversely proportional to gene flow, suggesting less differentiation correlates with more gene exchange. Sometimes, the genetic differentiation coefficient (FST) between P. serrulata and P. xueluoensis is less than that within or between populations of each species alone, as seen with the FST values between the QLFs and QLFxD populations being lower than those between the QLFxD, MYSxU, MYSs, and LaoSs groups. This indicates greater gene flow between the two species within certain regions compared to within-species gene flow. Due to the differing fragment lengths and variability sites used in cpDNA and nrDNA sequences [50], as well as the resultant resolution differences, genetic differentiation results among populations were not entirely consistent. The TCS haplotype network diagram indicates clear differentiation between P. serrulata and P. xueluoensis populations, with unique haplotypes emerging in each region, likely as an adaptation to diverse habitats. Some haplotypes appear in both species within the same mountain, suggesting substantial gene flow and permeation between groups, likely related to the dispersal of seeds by animals consuming the fruits.

4.2. Genetic Differentiation and Evolution

Based on cluster analysis with Nei’s genetic distances, the 13 populations were divided into three groups: the first group consisted of the FHSs and LaoSs populations; the second group included the QLFs, LuSs, MYSs, MYSxD, MYSxU, DWSx, and ESx populations; and the third group contained the QLFxD, QLFxU, LuSxD, and LuSxU populations. This grouping does not entirely match the results from the Structure analysis. The Structure analysis suggests the 13 populations derive from four genetic pools: Group A is primarily composed of P. serrulata populations, with the ESx and DWSx populations closely genetically connected; Group B consists mostly of P. xueluoensis populations, concentrated in the eastern regions of Jiangxi and Zhejiang, with some genetic permeation into P. serrulata populations, such as QLFs; Group C is focused on P. xueluoensis populations in southern Jiangxi, Mingyue Shan, and the Hunan–Hubei area; and Group D includes a predominance of FHSs and LaoSs populations, with significant variations in the proportion of Group D among the populations. Hence, the first group’s composition is closely related to Group D, potentially due to the geographical distance between the two northern P. serrulata populations limiting gene flow; the second group’s scope is akin to the sum of Groups B and C; and the third group is most similar to Group A, likely due to the close geographical proximity and intense gene exchange between populations, reflecting high genetic similarity. This suggests that P. serrulata and P. xueluoensis have completed speciation, but the close distribution areas lead to significant gene flow between the two species.
The phylogenetic tree of haplotypes demonstrates that the 19 haplotypes follow three evolutionary directions: “shared haplotypes to P. serrulata-specific haplotypes”, “shared haplotypes to P. xueluoensis-specific haplotypes”, and “shared haplotypes to P. serrulata-specific haplotypes to P. xueluoensis-specific haplotypes” with no evolutionary direction from P. xueluoensis to P. serrulata haplotypes. This observation is corroborated by the results of phylogenetic trees (MP, ML, UPGMA)—all P. xueluoensis-specific haplotypes cluster at the tips of the evolutionary trees, forming branches with high support. P. serrulata-specific and shared haplotypes are located at the base of the phylogenetic tree, with populations that are geographically closer also positioned closer in the phylogenetic tree.
Neutral tests conducted at the species level and for various geographical groupings indicate that the neutrality test parameters for the majority of population gene fragments are not significant, suggesting that the three gene fragments selected in this study conform to a neutral evolutionary model. The differences in evolutionary rates among genes are not sufficient to affect the results of genetic diversity. Mismatch analysis suggests that P. serrulata has experienced population expansions or bottleneck events in its history, whereas P. xueluoensis has not. The divergence time tree constructed for the Rosaceae family estimated the average age of the latest common ancestor of Rosaea and Rubeae at about 53.61 million years ago (mya) (PP = 1; 95% HPD: 50.64–56.58 mya), the divergence time between Rosaea–Rubeae and Maleae at 59.31 mya (PP = 1; 95% HPD: 41.31–77.31 mya), the crown group age of the subg. Cerasus at 17.88 mya (PP = 1; 95% HPD: 15.76–20.00 mya), and the formation of P. serrulata at 9.33 mya (PP = 1; 95% HPD: 7.90–10.76 mya). These estimates are in close agreement with previous studies, and while there are some errors, they are within a reasonable range of fluctuation. The discrepancies could be due to differences in fragment selection or the fragment lengths used. Under these premises, it is believed that the coalescence time between P. serrulata and P. xueluoensis is 3.22 mya (PP = 1; 95% HPD: 3.07~3.46 mya).
Given that the southwestern region is most likely the origin of the Subg. Cerasus and a refugium for P. serrulata [32], combined with the analyses presented earlier, we can infer that the distribution center of P. serrulata had already been established before the onset of the Ice Ages. This is consistent with the hypothesis that the distribution center of the genus Prunus formed prior to the Quaternary glaciations [43,44,51,52,53]. As P. serrulata populations expanded outward from the southwestern region, upon reaching the Hunan and Hubei areas, the populations divided into two different directions: one towards the northeast and north, and another towards the southeast, which is also likely another refugium for P. serrulata. This inference aligns with findings from phylogeographic studies of the Subg. Cerasus [32,43,44,51,53] and is consistent with the divergence times proposed earlier. The differentiation of P. serrulata populations into cold, moist high mountain environments, resulting in the gradual formation of P. xueluoensis, can be attributed to the varying environmental conditions such as temperature, moisture, sunlight duration and intensity, wind direction and strength, and soil physicochemical properties between upland and lowland habitats.

5. Conclusions

In support of the taxonomic recognition of P. serrulata and P. xueluoensis as distinct species, it is posited that P. xueluoensis emerged as a separate entity evolved from P. serrulata, with a divergence time estimated at approximately 3.22 million years ago (mya) (Posterior Probability = 1; 95% Highest Posterior Density: 3.07–3.46 mya). The speciation process is characterized as parapatric, implying a regional divergence with shared geographic boundaries during speciation. Notably, there is no reproductive isolation between P. serrulata and P. xueluoensis, which facilitates extensive gene flow between the two species.

Supplementary Materials

The following supporting information can be downloaded at: https://www.mdpi.com/article/10.3390/f15111927/s1. Table S1: Results of Hardy–Weinberg equilibrium test for locus of P. serrulata and P. xueluoensis. Table S2: Genetic diversity analysis of the 18 SSR microsatellite locus in P. serrulata and P. xueluoensis. Table S3: Genetic variability analysis of P. serrulata and P. xueluoensis populations based on SSR microsatellite locus. Table S4: Gene flow among all populations of P. serrulata and P. xueluoensis. Table S5: AMOVA result of P. serrulata. Table S6: AMOVA result of P. xueluoensis. Table S7: AMOVA result of all populations. Table S8: FST among all populations. Table S9: Variation sites of cpDNA haplotype sequence. Table S10: Geographical information and genetic diversity parameters of chloroplast genes. Table S11: Analyses of molecular variance (AMOVAs) based on cpDNA data for populations of P. serrulata and P. xueluoensis. Table S12: Neutrality test of geographical groups.

Author Contributions

Conceptualization and conception of the study: X.Y. and X.W.; Methodology: Z.P. and S.G.; Data curation: X.C., X.Z. and Y.Y.; Software: S.G. and X.C.; Writing—review and editing: S.G. All authors have read and agreed to the published version of the manuscript.

Funding

This study was funded by Modern Agriculture Key Project in Jiangsu Province, China (BE2020343); Forestry Science Technology Innovation and Popularization Project in Jiangsu Province, China (LYKJ [2021] 30).

Data Availability Statement

The data presented in this study are available upon request from the corresponding author due to privacy restrictions.

Conflicts of Interest

The authors declare no conflicts of interest.

References

  1. Nan, C.H.; Wang, X.R.; Tang, G.G.; Yi, X.G.; Luo, S.J. Cerasus xueluoensis (Rosaceae), a new species from China. Ann. Bot. Fenn. 2013, 50, 79–82. [Google Scholar] [CrossRef]
  2. De Queiroz, K. Species concepts and species delimitation. Syst. Biol. 2007, 56, 879–886. [Google Scholar] [CrossRef] [PubMed]
  3. Scudder, G.G.E. Species concepts and speciation. Can. J. Zool. 1954, 9, 1121–1134. [Google Scholar] [CrossRef]
  4. Wiley, E.O. The Evolutionary Species Concept Reconsidered. Syst. Zool. 1978, 27, 17–26. [Google Scholar] [CrossRef]
  5. Su, N.; Liu, B.B.; Wang, J.R.; Tong, R.C.; Ren, C.; Chang, Z.Y.; Zhao, L.; Potter, D.; Wen, J. On the species delimitation of the Maddenia group of Prunus (Rosaceae): Evidence from plastome and nuclear sequences and morphology. Front. Plant Sci. 2021, 12, 743643. [Google Scholar] [CrossRef]
  6. Wang, L.; Guo, Z.H.; Shang, Q.H.; Sa, W.; Wang, L. The Complete chloroplast genome of Prunus Triloba Var. plena and comparative analysis of Prunus species: Genome structure, sequence divergence, and phylogenetic analysis. Braz. J. Bot. 2021, 44, 85–95. [Google Scholar] [CrossRef]
  7. Yang, Y.T.; Yang, X.C.; Wang, M.C.; Zhong, L.L.; Ma, R.; Ma, T.; Liu, J.Q.; Davis, C.C.; Xi, Z.X. Species delimitation of north American Nyssa species. J. Syst. Evol. 2022, 60, 747–758. [Google Scholar] [CrossRef]
  8. Steier, J.E.; Mandakova, T.; Wojciechowski, M.F.; Steele, K.P. Insights into species delimitation of selected species in the flowering plant genus Medicago section Buceras (Leguminosae). Syst. Bot. 2022, 47, 431–440. [Google Scholar] [CrossRef]
  9. Bai, W.N.; Zhang, D.Y. Current status and future directions in plant phylogeography. Chin. Bull. Life Sci. 2014, 26, 125–137. [Google Scholar] [CrossRef]
  10. Chang, K.S.; Chang, C.S.; Park, T.Y.; Roh, M.S. Reconsideration of the Prunus serrulata complex (Rosaceae) and related taxa in eastern Asia. Bot. J. Linn. Soc. 2007, 154, 35–54. [Google Scholar] [CrossRef]
  11. Nan, C.H. Study on Population Variation and Reproductive Biology of Cerasus discoidea Yü et Li; Nanjing Forestry University: Nanjing, China, 2012. [Google Scholar]
  12. Yi, X.G. Studies on Investigation and Exploitation of the Resources of Cerasus Mill. In Wuyi Mountain; Nanjing Forestry University: Nanjing, China, 2008. [Google Scholar]
  13. Zhu, H. Phylogenetic Position and Population Biogeography of Cerasus dielsiana (Rosaceae); Nanjing Forestry University: Nanjing, China, 2021. [Google Scholar]
  14. Zang, D.K. Cerasus Laoshanensis (Rosaceae), a new species from Shandong, China. Ann. Bot. Fenn. 2017, 54, 135–137. [Google Scholar] [CrossRef]
  15. Liu, R.X.; Zhang, F.G.; Chen, W.J.; Chen, F.; Chen, Z.H. Noteworthy plants in prunoideae of Rosaceae from Zhejiang. J. Hangzhou Norm. Univ. (Nat. Sci. Ed.) 2017, 16, 518–521. [Google Scholar]
  16. Katsuki, T. A new species, Cerasus kumanoensis from the southern Kii Peninsula, Japan. Acta Phytotaxon. Geobot. 2018, 69, 119–126. [Google Scholar] [CrossRef]
  17. Oginuma, K. Karyomorphological studies on Prunus in Japan. J. Sci. Hiroshima Univ. Ser. B. Div. Bot. 1987, 21, 1–66. [Google Scholar]
  18. Mowrey, B.D.; Werner, D.J. Phylogenetic relationships among species of Prunus as inferred by isozyme markers. Theor. Appl. Genet. 1990, 80, 129–133. [Google Scholar] [CrossRef]
  19. Granger, A.R.; Clarke, G.R.; Jackson, J.F. Sweet cherry cultivar identification by leaf isozyme polymorphism. Theor. Appl. Genet. 1993, 86, 458–464. [Google Scholar] [CrossRef]
  20. Zhou, C.L.; Chen, F.; Miao, J.G.; Han, D.D.; Li, C.L. Identification of 19 Cerasus cultivars on esterase isozyme in Qingdao. J. Northwest For. Univ. 2008, 23, 40–43. [Google Scholar]
  21. Li, Z.; Yi, X.G.; Gu, Y.; Wang, X.R. The genome size determination of Cerasus serrulata. J. Nanjing For. Univ. 2014, 38, 17–19. [Google Scholar]
  22. Chen, Z.L.; Chen, W.J.; Chen, H.; Zhou, Y.Y.; Tang, M.Q.; Fu, M.Q.; Jin, X.F. Prunus pananensis (Rosaceae), a new species from Pan’an of central Zhejiang, China. PLoS ONE 2013, 8, e54030. [Google Scholar] [CrossRef]
  23. Ye, L.X.; Lu, Y.F.; Wang, H.; Liu, S.L.; Jin, X.F. Cerasus fengyangshanica (Rosaceae), a new species from Zhejiang. J. Hangzhou Norm. Univ. 2017, 16, 19–24. [Google Scholar]
  24. Zhang, X.S.; Jiang, Z.L.; Yusupov, Z.; Zhang, M.H.; Zhang, D.G.; Tojibaev, K.; Meng, Y.; Deng, T. Prunus sunhangii: A new species of Prunus from central China. Plant Divers. 2019, 41, 19–25. [Google Scholar] [CrossRef] [PubMed]
  25. Liang, S.H.; Qin, B.; Huang, Y.H.; Tang, L.M.; Zhang, Z.J.; Li, C.; He, Y.H.; Jiang, R.H.; Li, J.L. Prunus quanzhouensis: A newly discovered species of Prunus subgen. Cerasus (Rosaceae) from northeastern Guangxi, China. Phytotaxa 2023, 622, 252–259. [Google Scholar] [CrossRef]
  26. Yi, X.G.; Dong, J.J.; Chen, J.; Zhou, H.J.; Wu, T.; Gao, S.C.; Chen, X.Z.; Li, M.; Wang, X.R. Molecular and morphological evidence support a new species of Rosaceae Prunus subg. Cerasus from Wuyishan National Park, Southeast China. PhytoKeys 2024, 237, 269–279. [Google Scholar] [CrossRef] [PubMed]
  27. Shang, T.; Wang, X.R.; Nan, C.H.; Zhang, Q. Genetic diversity in natural populations of Cerasus discoidea based on SSR markers. J. Gansu Agric. Univ. 2013, 48, 104–109+115. [Google Scholar] [CrossRef]
  28. Cong, R.; Zhang, K.W.; Yi, X.G.; Li, M.; Wang, X.R. Construction of DNA fingerprinting with SSR markers for 201 Kangding cherry (Cerasus tatsienensis) accessions. Mol. Plant Breed. 2020, 18, 6776–6784. [Google Scholar] [CrossRef]
  29. Wang, J.; Zhang, K.C.; Zhang, X.M.; Yan, G.H.; Zhou, Y.; Duan, X.W.; Chen, L. Identification of new polymorphic SSRs, fingerprinting and cluster analysis in sweet cherry. J. Fruit Sci. 2019, 36, 1619–1629. [Google Scholar] [CrossRef]
  30. Schueller, E.; Fernandez, F.F.; Antanaviciute, L.; Anhalt-Bruederl, U.; Spornberger, A.; Forneck, A. Autochthonous Austrian Varieties of Prunus Avium L. represent a regional gene pool, assessed using SSR and AFLP markers. Genes 2021, 12, 322. [Google Scholar] [CrossRef]
  31. Evanno, G.; Regnaut, S.; Goudet, J. Detecting the number of clusters of individuals Using the Software structure: A simulation study. Mol. Ecol. 2005, 14, 2611–2620. [Google Scholar] [CrossRef]
  32. Yi, X.G. The Variation and Phylogeography of Cerasus serrulata Mill. Populations; Nanjing Forestry University: Nanjing, China, 2022. [Google Scholar]
  33. Peakall, R.; Smouse, P.E. GenAlEx 6.5: Genetic analysis in excel. population genetic software for teaching and research an update. Bioinformatics 2012, 28, 2537–2539. [Google Scholar] [CrossRef]
  34. Tsuda, Y.; Kimura, M.; Kato, S.; Katsuki, T.; Mukai, Y.; Tsumura, Y. Genetic structure of Cerasus Jamasakura, a Japanese flowering cherry, revealed by nuclear SSRs: Implications for conservation. J. Plant. Res. 2009, 122, 367–375. [Google Scholar] [CrossRef]
  35. Ohta, S.; Katsuki, T.; Tanaka, T.; Hayashi, T.; Sato, Y.; Yamamoto, T. Genetic variation in flowering cherries (Prunus Subgenus Cerasus) characterized by SSR markers. Breed. Sci. 2005, 55, 415–424. [Google Scholar] [CrossRef]
  36. Dirlewanger, E.; Cosson, P.; Tavaud, M.; Aranzana, J.; Poizat, C.; Zanetto, A.; Arús, P.; Laigret, F. Development of microsatellite markers in peach [Prunus persica (L.) Batsch] and their use in genetic diversity analysis in peach and sweet cherry (Prunus avium L.). Theor. Appl. Genet. 2002, 105, 127–138. [Google Scholar] [CrossRef] [PubMed]
  37. Su, Q. Genetic Diversity Among Populations of Cerasus campanulate; Nanjing Forestry University: Nanjing, China, 2008. [Google Scholar]
  38. Lu, Y.X. Genetic Diversity and Breeding Strategy of Cerasus campanulata Maxim; Nanjing Forestry University: Nanjing, China, 2007. [Google Scholar]
  39. He, H.L. Genetic Diversity and Populations Genetic Structure of Wild Prunus tomentosa in Northern China Using Simple Sequence Repeats (SSRs) Markers; Northwest A&F University: Xianyang, China, 2016. [Google Scholar]
  40. Wei, S.; Yang, W.K.; Wang, X.Y.; Hou, Y.G. High genetic diversity in an endangered medicinal plant, Saussurea Involucrata (Saussurea, Asteraceae), in western Tianshan mountains, China. Conserv. Genet. 2017, 18, 1435–1447. [Google Scholar] [CrossRef]
  41. Zhang, S.D.; Jin, J.J.; Chen, S.Y.; Chase, M.W.; Soltis, D.E.; Li, H.T.; Yang, J.B.; Li, D.Z.; Yi, T.S. Diversification of Rosaceae since the late cretaceous based on plastid phylogenomics. New Phytol. 2017, 214, 1355–1367. [Google Scholar] [CrossRef]
  42. Yi, X.G.; Chen, J.; Zhu, H.; Li, Y.F.; Li, X.X.; Li, M.; Duan, Y.F.; Chen, L.; Wang, X.R. Phylogeography and the population genetic structure of flowering cherry Cerasus serrulata (Rosaceae) in subtropical and temperate China. Ecol. Evol. 2020, 10, 11262–11276. [Google Scholar] [CrossRef]
  43. Cao, D.W. Molecular Phylogeography of Prunus subgenus Cerasus; Northwest University: Xi’an, China, 2006. [Google Scholar]
  44. Li, M.M. Phylogeography of Prunus subgenus Cerasus and Genetic Diversity of P. pscudocerasas; Northwest University: Xi’an, China, 2009. [Google Scholar]
  45. Baek, S.; Choi, K.; Kim, G.B.; Yu, H.J.; Cho, A.; Jang, H.; Kim, C.; Kim, H.J.; Chang, K.S.; Kim, J.H.; et al. Draft genome sequence of wild Prunus yedoensis reveals massive inter-specific hybridization between sympatric flowering cherries. Genome Biol. 2018, 19, 127. [Google Scholar] [CrossRef]
  46. Peng, Z.Q.; Dong, P.; Zhu, H.; Zhu, S.X.; Dong, J.-J.; Zhong, Y.Q.; Zhai, F.F.; Zheng, A.C.; Wang, X.R.; Yi, X.G. Analyses of Cerasus serrulata population structure and point patterns in Yuntai mountain, Jiangsu. J. Nanjing For. Univ. 2021, 45, 167–176. [Google Scholar]
  47. Li, M.; Yi, X.G.; Wang, H.C.; Shang, T.; Gu, Y.; Wang, X.R. Studies on the relationship between Cerasus serrulata distribution region and the environmental factors. J. Nanjing For. Univ. 2014, 38, 74–80. [Google Scholar]
  48. Wang, P.C. Study on Living Environment and Seed Charateristics of Cerasus xueluoensisin Dawei Mountain in Hunan Province; Nanjing Forestry Univeristy: Nanjing, China, 2020. [Google Scholar]
  49. Cao, L. Seed Predation and di Spersal of Cherry (Cerasus pseudocerasus) by Animals in a Dujiangyan Subtropical Forest; SiChuan University: Chengdu, China, 2007. [Google Scholar]
  50. Zhang, W.X. Study on Stem Andleaf Structure and SSR Genetic Diversity of Cerasus; Central South University of Forestry and Technology: Changsha, China, 2021. [Google Scholar]
  51. Shi, S.; Li, J.L.; Sun, J.K.; Yu, J.; Zhou, S.L. Phylogeny and classification of Prunus Sensu Lato (Rosaceae). J. Integr. Plant Biol. 2013, 55, 1069–1079. [Google Scholar] [CrossRef]
  52. Chen, J. Genetic Diversity Analysis of Cerasus serrulata Populations Based on SSR Markers; Nanjing Forestry University: Nanjing, China, 2017. [Google Scholar]
  53. Cong, R. Genetic Diversity of Cerasus tatsienensis (Batal.) Yu et Li Populations by SSR Markers; Nanjing Forestry University: Nanjing, China, 2019. [Google Scholar]
Figure 1. The geographical distribution of P. serrulata and P. xueluoensis.
Forests 15 01927 g001
Figure 2. Logarithmic probability analysis estimated by structure of 13 populations.
Forests 15 01927 g002
Figure 3. When K = 4, the grouping results of 13 populations are calculated by structure. Numbers 1 to 13, respectively, represent the QLFs, QLFxD, QLFxU, LuSs, LSxD, LSxU, MYSxU, MYSxD, MYSs, DWSx, Esx, LaoSs, and FHSs populations. The yellow, red, green, and blue sections represent groups A, B, C, and D, respectively.
Forests 15 01927 g003
Figure 4. Clustering by UPGMA of 13 populations based on SSR genetic matrix. Numbers 1 to 13, respectively, represent the QLFs, QLFxD, QLFxU, LuSs, LSxD, LSxU, Mys, MYSxD, MYSs, DWSx, Esx, LaoSs, and FHSs populations.
Forests 15 01927 g004
Figure 5. Mantel test between the genetic and geographic distance of P. serrulata populations. The red dots represent the relationship between genetic distance and geographic distance among cherry blossom samples.
Forests 15 01927 g005
Figure 6. Geographic distribution of the cpDNA haplotypes in P. serrulata and P. serrlata.
Forests 15 01927 g006
Figure 7. TCS network of cpDNA haplotypes in P. serrulata and P. xueluoensis. The triangle represents the unique haplotype of P. xueluoensis, the circle represents the unique haplotype of P. serrulata, and the rectangle represents the shared haplotype.
Forests 15 01927 g007
Figure 8. (a) MP tree of haplotypes based on cpDNA (matK, trnD-E, trnS-G) sequence. (b) ML tree of haplotypes based on cpDNA (matK, trnD-E, trnS-G) sequence. (c) UPGMA tree of haplotypes based on cpDNA (matK, trnD-E, trnS-G) sequence.
Forests 15 01927 g008
Figure 9. Partial reconstruction of a phylogenetic tree of Rosaceae based on cpDNA (matK) sequences with two time calibration points.
Forests 15 01927 g009
Figure 10. (a) Mismatch distribution of all populations. (b) Mismatch distribution of P. serrulata. (c) Mismatch distribution of P. xueluoensis.
Forests 15 01927 g010
Table 1. Sampling site information of P. serrulata and P. xueluoensis.
Population LabelPlace,
Province
SpeciesSample SizeAltitude (m)Northern Latitude (° ′ ″)Eastern Longitude (° ′ ″)
QLFsQingliang Feng,
Zhejiang
P. serrulata31950–1376 m30°22′01″119°02′47″
QLFx-UQingliang Feng,
Zhejiang
P. xueluoensis301311–1500 m30°14′22″119°12′57″
QLFx-DQingliang Feng,
Zhejiang
P. xueluoensis301500–1743 m30°14′32″118°51′57″
LuSsLushan
Jiangxi
P. serrulata23111–1311 m29°26′41″116°02′08″
LuSx-ULushan
Jiangxi
P. xueluoensis301300–1410 m29°31′07″115°58′11″
LuSx-DLushan
Jiangxi
P. xueluoensis431147–1300 m29°31′13″115°57′14″
MYSsMingyue Shan,
Jiangxi
P. serrulata24786–939 m27°32′36″114°11′01″
MYSx-UMingyue Shan,
Jiangxi
P. xueluoensis301500–1611 m27°32′31″114°11′09″
MYSx-DMingyue Shan,
Jiangxi
P. xueluoensis151398–1500 m27°32′16″114°11′01″
FHSsFenghuangShan
Liaoning
P. serrulata16387–539 m40°22′36″124°04′53″
LaoSsLao Shan,
Shandong
P. serrulata16511–835 m36°12′38″120°40′53″
DWSxDawei Shan
Hunan
P. xueluoensis251321–1483 m28°17′31″114°06′36″
ESxEnshi City,
Hubei
P. xueluoensis281465–1578 m30°41′41″109°41′49″
Table 2. Information on SSR fluorescence-labeled microsatellite primers.
PrimersPrimer Sequences (5′-3′)
AM287648F: ATGATGCTACCACAAGGGACTCGT
R: GTTTAGCTGCACATACGCTTTTACCTCC
AM287842F: ATTTGACAGTGAGGACATGACCGA
R: GTTTACAATTAAAGGTGGGTTAGGGCCA
BP040F: ATGAGGACGTGTCTGAATGG
R: AGCCAAACCCCTCTTATACG
BPPCTO28F: TCAAGTTAGCTGAGGATCGC
R: GAGCTTGCCTATGAGAAGACC
BPPCTO41F: CAATAAGGCATTTGGAGGC
R: CAGCCGAACCAAGGAGAC
CPSCT044F: CCAGCACAGAGAAAACGATG
R: GAGCTCCTACTCTGAGTCTGTAAAA
DN554499F: ATAGTGCAGTTGAGAAACGAGCAG
R: GTTTAAGGTGCAGTTCGTTGTCGATGT
DY640849F: ATAGGCCAGGCAAATAGCGAAGTA
R:GTTTCCTCTGTAGCTCCCAAGTTTTCG
DY647422F: AGACACCCTATCACAATGTCGCAA
R: GTTTGCGAACAGCGATAACCTTAATCC
EMPA026F: ATTGAAAAAGCCAAAGAGCG
R: TTCACGGTTTGAAGCAAGTG
EMPaS02BF: CTACTTCCATGATTGCCTCAC
R: AACATCCAGAACATCAACACAC
MA007aF: GTGCATCGTTAGGAACTGCC
R: GCCCCTGAGATACAACTGCA
MA016bF: TGGCTGGTGGAGACGGAGGA
R: ATGATACCCAGCCTCCCGGG
pchgms1F: GGGTAAATATGCCCATTGTGCAATC
R: GGATCATTGAACTACGTCAATCCTC
pchgm3F: ACGCTATGTCCGTACCATCTCCATG
R: CAACCTGTGATTGCTCCTATTAAAC
PMS2F: CACTGTCTCCCAGGTTAAACT
R: CCTGAGCTTTTGACACATGC
UDPGA96-018F: TTCTAATCTGGGCTATGGCG
R: GAAGTTCACATTTACGACAGGG
UDPGA98-412F: AGGGAAAGTTTCTGCTGCAC
R: GCTGAAGACGACGATGCTGA
Disclaimer/Publisher’s Note: The statements, opinions and data contained in all publications are solely those of the individual author(s) and contributor(s) and not of MDPI and/or the editor(s). MDPI and/or the editor(s) disclaim responsibility for any injury to people or property resulting from any ideas, methods, instructions or products referred to in the content.

