Article

Multi-Omics Analysis of Exogenous Potassium (K+)’s Role in Alleviating Trehalose Effects Under NaCl Stress in Tamarix ramosissima

1
Jiangsu Academy of Forestry, Nanjing 211153, China
2
Collaborative Innovation Center of Sustainable Forestry in Southern China of Jiangsu Province, Nanjing Forestry University, Nanjing 210037, China
3
Fu Foundation School of Engineering and Applied Science, Columbia University, New York, NY 10027, USA
*
Authors to whom correspondence should be addressed.
Forests 2024, 15(11), 1905; https://doi.org/10.3390/f15111905
Submission received: 2 September 2024 / Revised: 4 October 2024 / Accepted: 21 October 2024 / Published: 29 October 2024
(This article belongs to the Section Genetics and Molecular Biology)

Abstract

:
Salt stress significantly impacts plant growth, and Tamarix ramosissima Ledeb is utilized for afforestation in China’s saline–alkali regions. Trehalose, an osmoregulatory compound, enhances plant tolerance to salt stress by stabilizing cell membranes and regulating oxidative states and ion distribution. However, its role in mitigating NaCl-induced damage in Tamarix species remains understudied. In this study, root samples of T. ramosissima were exposed to NaCl stress with exogenous K+ at 0 h, 48 h, and 168 h. Analyses revealed that soluble sugar content increased over time, especially in the 200 mM NaCl + 10 mM KCl treatment at 168 h. Transcriptome sequencing identified 19 trehalose-related genes involved in metabolic and sucrose pathways, with Unigene0015746 notably enhancing D-Glucose 6-phosphate accumulation, a key precursor for trehalose synthesis. This gene emerged as a crucial candidate for further research. The transcriptome data were validated using qRT-PCR. Overall, the study elucidates the molecular mechanisms of trehalose-related genes in T. ramosissima under salt stress with exogenous K+, providing valuable genetic resources for breeding salt-tolerant tree species.

1. Introduction

Salt stress is one of the most important environmental problems limiting agricultural productivity [1]. Incomplete statistics show that about 1/5 of irrigated land worldwide is affected by soil salinization [2]. High salt content in soil affects physiological activities related to plant growth and development, such as nutrient deficiency, osmotic stress, toxic ion uptake, reactive oxygen species generation, and antioxidant defenses [3,4,5]. Due to soil salinization, there is an annual loss of approximately 1.2 × 10⁹ USD in agricultural production worldwide [6]. Therefore, the rational and sustainable utilization of saline–alkali land resources and increasing the agricultural yield of saline–alkali lands are particularly important for global food security [7].
Trehalose is a stable non-reducing disaccharide consisting of two glucose molecules and is widely found in various organisms with multiple functions [8]. For instance, trehalose can serve as an energy and carbon source; act as a stabilizer and protector for proteins and membranes against various stress conditions (like drying, cold, and oxidation); and regulate plant growth and developmental processes [9]. In plants, trehalose plays a role in regulating responses to various environmental stresses [10]. Recent research has found that in plants, there is only one trehalose biosynthetic pathway, involving a two-step pathway catalyzed by Trehalose-6-phosphate synthase (TPS) and Thiamine pyrophosphate (TPP) through Trehalose 6-Phosphate (Tre6P) [11]. Trehalose content in plants is low and may co-regulate the plant’s response to environmental stresses together with its precursor trehalose-6-phosphate (T6P) [12,13,14]. Thus, under abiotic stress, trehalose can act as an osmoregulatory substance to regulate the physiological balance inside plants. Previous studies have reported that exogenous substances can alleviate the effects of abiotic stress [15]. Its levels can be influenced by endogenous regulation or exogenous application. Studies have reported that salt stress can enhance TPS activity in wheat [16] and induce the expression of the OsTPP1 gene in rice [17,18]. These reactions lead to an accumulation of trehalose. Research by Krasensky et al. found that overexpression of AtTPPD under salt stress increases the internal trehalose content, significantly enhancing plant tolerance [19]. Therefore, trehalose may act as a protectant in plants’ response to salt stress. Furthermore, the exogenous application of low concentrations of trehalose can reduce Na+ accumulation in plants, while applying higher concentrations can prevent chlorophyll loss and root damage caused by high salt, thereby reducing the damage of salt ions to plants [20]. Moreover, applying exogenous trehalose can alleviate salt stress in rice [21] and also mitigate ion imbalance, excessive Reactive oxygen species (ROS) accumulation, and programmed cell death (PCD) in Arabidopsis seedlings caused by high salt (150–250 mM NaCl) [22]. Hence, trehalose is an essential active substance in plants that resists abiotic stress [23], and its increased accumulation under salt stress can enhance the plant’s osmoregulatory capacity and plays a crucial role in scavenging reactive oxygen species and enhancing other antioxidant enzyme activities [24].
Potassium (K+) is one of the essential nutrients required for plant growth and development [25], existing in inorganic form within plants and accounting for approximately 2% to 10% of the plant dry matter [26]. Plants absorb K+ through K+ transporters and channels in root epidermal cells [27]. Maintaining an optimal cytoplasmic K+/Na+ ratio has been considered a key feature of salt tolerance in plants [28]. Under salt stress, even though K+ actively maintains ion homeostasis and osmotic balance [29], excess Na leads to a decrease in K+ in plant cells [30,31]. Therefore, the addition of K+ to plants can alleviate the adverse effects of Na+. K+ is activated in the plasma membrane through HKT transport proteins [32], enhancing the absorption of K+ and the K+/Na+ ratio, mitigating the stress plants face from NaCl [33,34]. It is worth noting that K+ is closely related to soluble sugars. It can activate fructose kinase, starch synthase, and α-amylase, thereby affecting the sugar metabolism pathway [35,36]. The roots of Tamarix ramosissima Ledeb (T. ramosissima) enhanced their absorption of K+ at 48 h and 168 h after being exposed to exogenous K+ in response to NaCl stress, reducing cellular oxidative damage and alleviating NaCl toxicity [37]. In addition, a study by Song et al. found that adding exogenous 10 mM KCl effectively alleviated the damage of drought stress on the growth of water hyacinth, improving the plant’s absorption of K+ [38].
T. ramosissima is a halophyte [39]. Halophytes are plants adapted to saline environments, and they adopt a series of strategies to handle salinity [40]. Compared to other halophytes, plants of the Tamarix plants have a strong adaptability to the environment and are important afforestation species in the saline–alkali areas of China [41,42]. They use salt glands to excrete salt to avoid salt damage [43] and enhance plant tolerance through osmotic regulation, scavenging of free radicals, and cellular detoxification, among other physiological and metabolic processes [44,45,46,47]. However, research by Lu Yan et al. reported that T. ramosissima grows normally at concentrations less than 100 mM NaCl and grows slowly at concentrations greater than 200 mM NaCl [48]. It has been reported that T. ramosissima has new roots and growth in 168 h treated with 200 mM NaCl + 10 mM KCl [49]. Therefore, in order to understand the role of K+ in alleviating the damage caused by NaCl stress to plants and maintaining or promoting the trehalose in plant growth. This study, based on physiological, transcriptomic, and metabolomic analyses, examines the effects of exogenous K+ application on soluble sugar content, trehalose-related gene expression levels, metabolite changes, and their associated metabolic pathways in T. ramosissima roots under NaCl stress. We aim to uncover the roles of key candidate genes related to trehalose and its associated metabolites and pathways in alleviating NaCl stress with exogenous K+. This research can provide a scientific theoretical basis and genetic resources for improving tree species in saline–alkali areas and breeding salt-tolerant tree species.

2. Materials and Methods

2.1. Plant Material

The study selected 5-month-old grafted seedlings of T. ramosissima that exhibited similar growth patterns. These seedlings were transferred to a hydroponic box with 24 slots, each measuring 40 cm × 30 cm × 16 cm. They were cultivated in a 1/2 strength Hoagland nutrient solution and placed in a greenhouse set at a temperature of 26 ± 2 °C and humidity ranging from 40% to 55% [50]. The nutrient solution was replaced every 3 days, and after 2 months the plants were subjected to experimental treatments.

2.2. Plant Treatment

Plants grown in the 1/2 Hoagland nutrient solution served as the control group. For experimental treatments, plants were cultivated in a solution of 1/2 Hoagland nutrient combined with either 200 mM NaCl or 200 mM NaCl + 10 mM KCl. The nutrient solution for each group was replaced every 3 days. Each group consisted of 8 plants and the experiment was replicated 3 times. Roots samples were collected 0 h, 48 h, and 168 h post-treatment and were quickly preserved in liquid nitrogen before being stored in a −80 °C freezer.

2.3. Soluble Sugar Measurement in Roots Under Different Treatments

Root samples from the control group, 200 mM NaCl group, and 200 mM NaCl + 10 mM KCl group were randomly collected 48 h and 168 h post-treatment, in three replicates [51]. The anthrone colorimetric method was used to determine soluble sugar content in these samples.

2.4. High-Throughput Transcriptome Sequencing and Differential Gene Expression Analysis

Total RNA was extracted from the roots of T. ramosissima using TRIzol reagent (Invitrogen, Carlsbad, CA, USA). The quality and purity of the total RNA were assessed using the Bioanalyzer 2100 and the RNA 6000 Nano LabChip Kit (Agilent, Santa Clara, CA, USA). Once the quality check was satisfactory, the samples were sent to GENE Denovo in Guangzhou for cDNA library construction, quality control, and transcriptome sequencing (Illumina HiSeqTM 4000, Illumina, Sand Diego, CA, USA). We submitted the raw sequencing data to the National Center for Biotechnology Information (NCBI) Short Reads Archive (SRA) database (ID: SRP356215). Reads count data from the sequencing were analyzed using DESeq2 software version 1.30 [27], and differentially expressed genes (DEGs) were filtered based on the criteria of FDR < 0.05 (FDR value is the p-value adjusted using BH correction) and |log2 FC| > 1. Finally, the DEGs were functionally annotated and subjected to pathway enrichment analysis using GO [52] and KEGG [53] databases. Both GO and KEGG enrichment analyses were performed on the DEGs.

2.5. Metabolite Extraction, Analysis, and Identification of Differential Metabolites

Root samples from Tamarix ramosissima, treated with liquid nitrogen, were analyzed following a protocol similar to that outlined by Chen et al. [37]. A liquid chromatography–mass spectrometry (LC–MS) was performed, utilizing three biological replicates and three technical replicates for each sample. The analysis employed a Vanquish UHPLC system (Thermo Fisher, Bremen, Germany) connected to an Orbitrap Q Exactive™ HF-X mass spectrometer (Thermo Fisher, Bremen, Germany). Separation was carried out on a Hypersil Gold column (100 × 2.1 mm, 1.9 μm) with a 17 min linear gradient at a flow rate of 0.2 mL/min. For positive mode ionization, the mobile phase consisted of eluent A (0.1% formic acid in water) and eluent B (methanol), while for negative mode, eluent A was 5 mM ammonium acetate at pH 9.0, with methanol as eluent B. The gradient started with 2% of eluent B for the first 1.5 min, gradually increasing to 100% over 12 min, held at 100% for 2 min, then rapidly reduced back to 2% in 0.1 min, and maintained at 2% for the final 2.9 min. The mass spectrometer operated in alternating polarity modes, with a spray voltage of 3.2 kV, a capillary temperature of 320 °C, and gas flow settings of 40 and 10 arbitrary units for the sheath gas and auxiliary gas, respectively. The resulting data were processed using Simca software 11.0 [54], where normalization, log transformation, and centralization were applied. Orthogonal projections to latent structures discriminant analysis (OPLS-DA) helped identify key metabolites, selected based on a Variable Importance in Projection (VIP) score greater than 1.0 from the first principal component of the OPLS-DA model, alongside a t-test p-value of less than 0.05 [55].

2.6. Prediction of Pfam Protein Structural Domains

Using the transcriptome sequencing data, members of the trehalose family annotated in the NCBI database were identified from T. ramosissima roots. These identified trehalose proteins were then aligned to the Pfam database with the Pfam_Scan program 90.0. This alignment yielded annotations related to the protein structure of these trehalose genes [56]. From this process, the definitive list of members of the trehalose family was established. To delve deeper into the characteristics of these trehalose proteins, their fundamental physicochemical properties were predicted online using the Protparam tool, available at (https://web.expasy.org/protparam/, accessed on 25 October 2023). This analysis provided insights into various attributes like Molecular Weight, Theoretical pI, Grand Average of Hydropathicity (GRAVY), Instability Index, and Aliphatic Index among others. For a comprehensive understanding, the identified trehalose proteins also underwent subcellular localization predictions. This was accomplished using the CELLOv.2.5 online platform, accessible at (http://cello.life.nctu.edu.tw/, accessed on 10 October 2023).

2.7. Construction of the Phylogenetic Tree for Key Candidate Genes

Key candidate genes were identified through the integrated analysis of transcriptomic and metabolomic datasets. Their corresponding protein and amino acid sequences were then selected for further analysis by performing a BLAST search using the National Center for Biotechnology Information (NCBI) database. Subsequently, a phylogenetic tree was constructed, incorporating these key candidate genes and their protein amino acid sequences along with sequences from homologous genes of related species.

2.8. Quantitative Real-Time PCR Verification

To validate the accuracy of the transcriptome sequencing, nine trehalose-related candidate genes were randomly selected. The total RNA was extracted from T. ramosissima root samples using the RNAprep Pure Kit (Tiangen, Beijing, China). Complementary DNA (cDNA) was synthesized with the Prime Script™ DEG II 1st Strand cDNA Synthesis Kit (Takara, Beijing, China). Gene-specific primers for the selected trehalose-related genes were designed (Supplementary Table S1). After diluting the cDNA template eightfold, qRT-PCR was performed following the TB Green Premix ExTaq (Tli RNaseH Plus) kit protocol (Takara, RR420A). The total reaction volume was 20 μL, including 10 μL of TB Green Premix Ex Taq, 0.8 μL each of forward and reverse primers (10 μmol·L−1), 1 μL of the cDNA template, and 7.4 μL of ddH2O. Each sample was prepared in triplicate, and all steps were carried out on ice. The amplification process was conducted on an ABI ViiA™ 7 Real-Time PCR System (Thermo Fisher Scientific Inc., Waltham, MA, USA) under the following conditions: an initial denaturation at 95 °C for 30 s, followed by 40 cycles at 95 °C for 5 s and 60 °C for 30 s. The melting curve analysis involved heating to 95 °C for 5 s, maintaining 60 °C for 1 min, increasing to 95 °C, and finally cooling to 50 °C for 30 s [57]. Each gene had three biological replicates, with Tubulin used as the reference gene. Relative expression levels were calculated using the 2−ΔΔCt method [58].

2.9. Data Analysis and Processing

Mean values and standard deviations were calculated using Microsoft Excel 2016 (Microsoft, Washington, DC, USA). To predict protein structural domains, the Pfam_Scan tool was utilized. Graphical representations were prepared using Origin 2019 software (OriginLab, Northampton, MA, USA), and phylogenetic tree construction was performed using MEGA 11 software (MEGA Software, State College, PA, USA). Variance analysis, including the LSD test, was conducted with SPSS 26.0 software (SPSS, New York, NY, USA).

3. Result

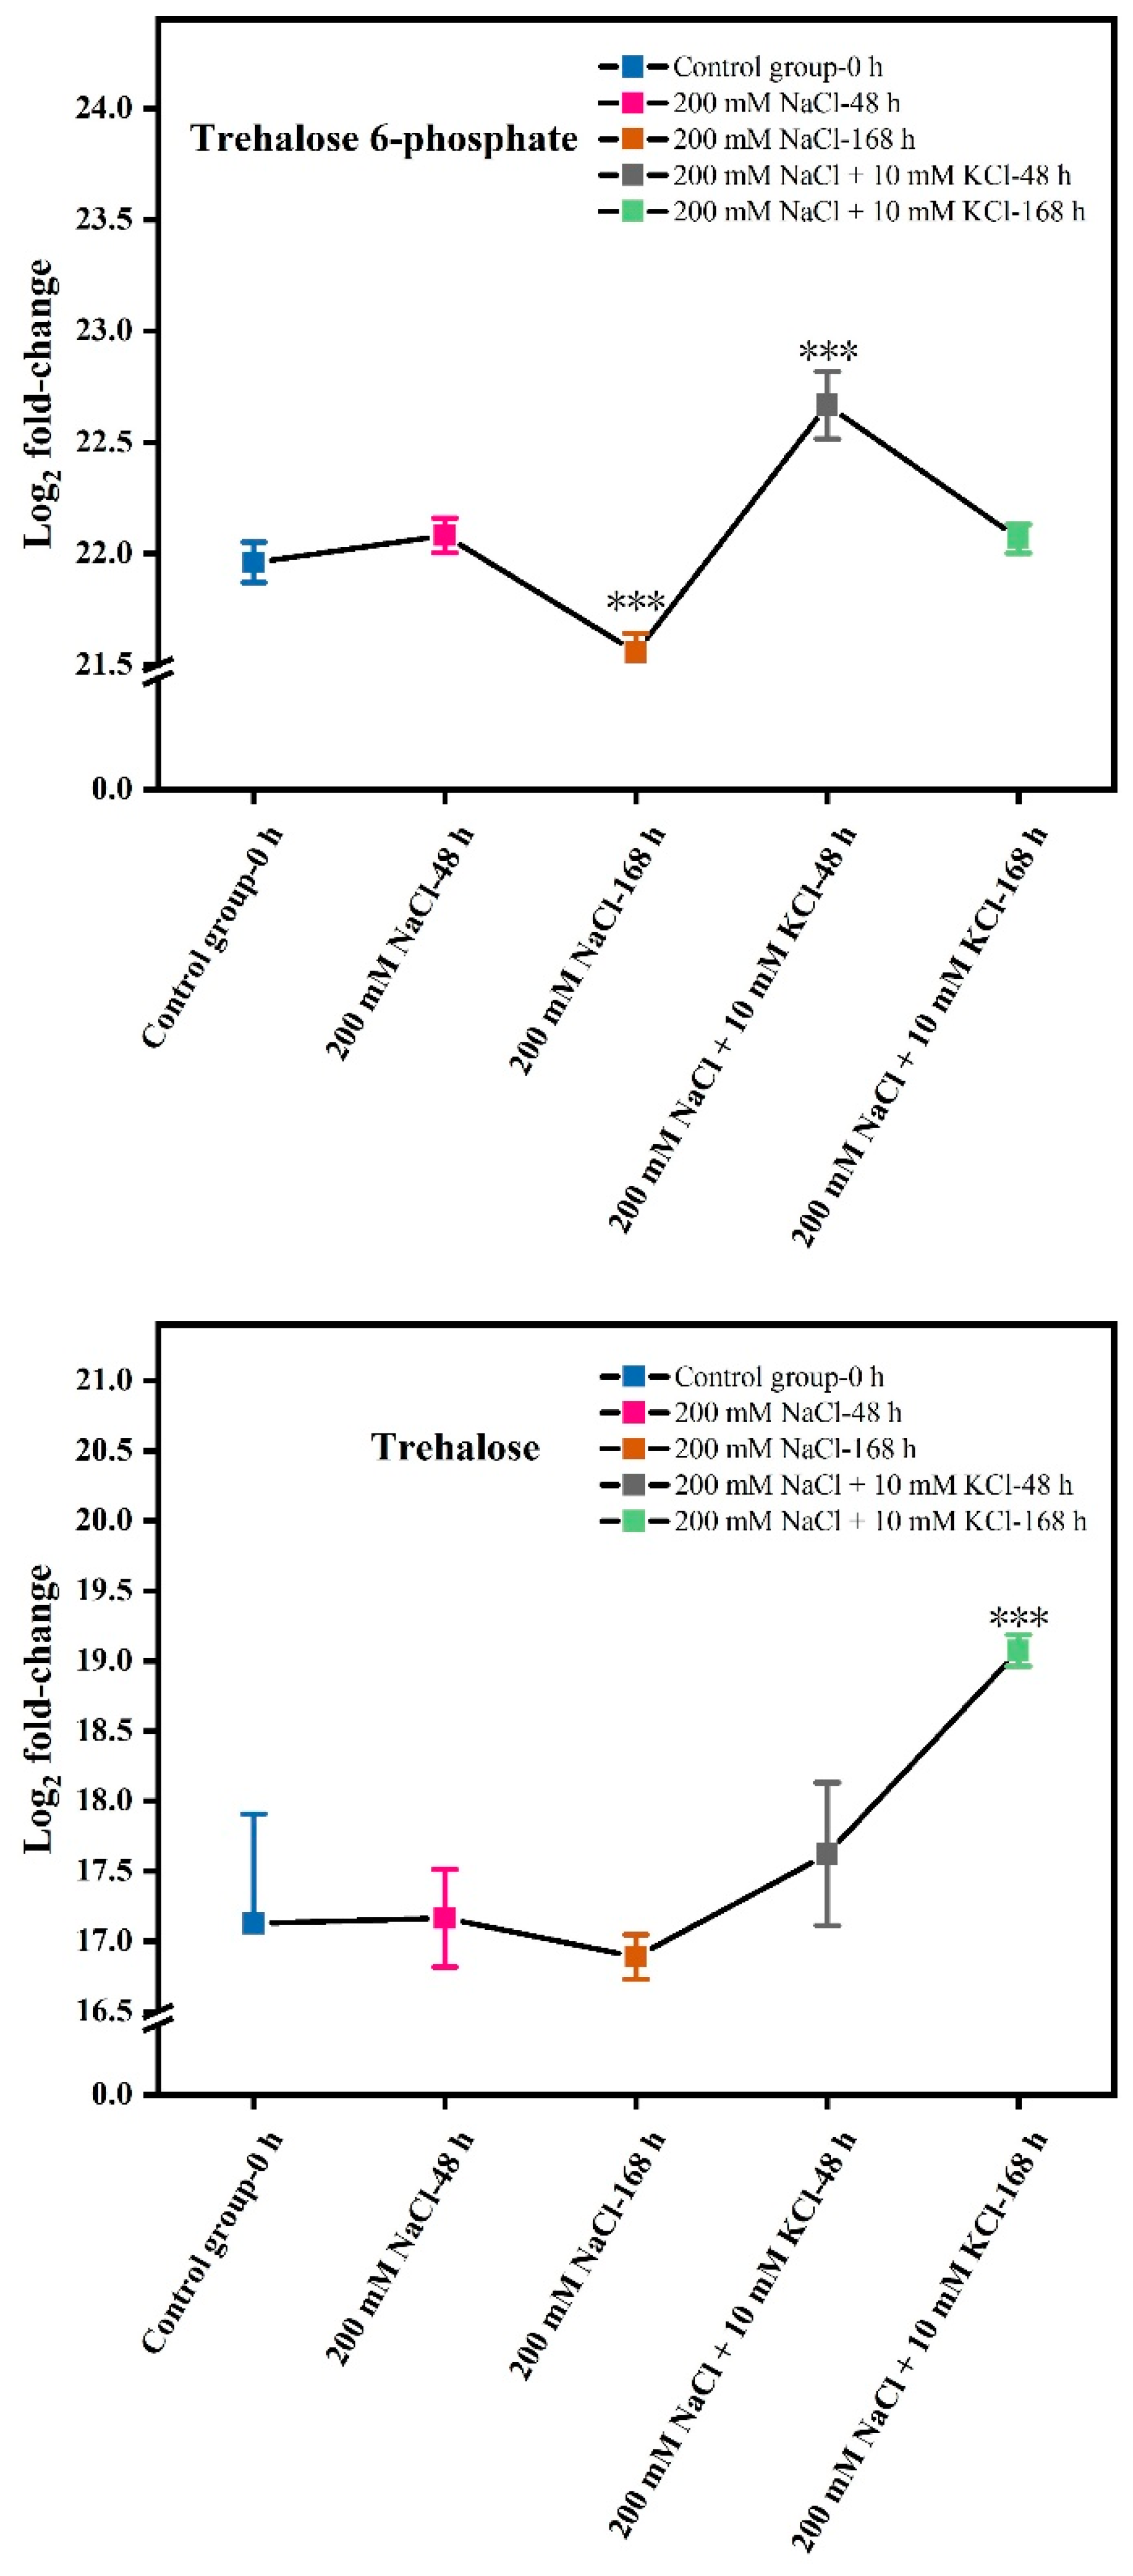
3.1. Changes in Trehalose 6-Phosphate and Trehalose Content

The contents of Trehalose 6-phosphate and Trehalose were measured in the roots of T. ramosissima under NaCl stress with the application of exogenous K+ for 48 h and 168 h (Table 1). The results showed (Figure 1) that the log2 fold-change in Trehalose 6-phosphate and Trehalose contents first increased and then decreased at 48 h and 168 h under 200 mM NaCl treatment. At 48 h and 168 h under the treatment of 200 mM NaCl + 10 mM KCl, the log2 fold-change in Trehalose 6-phosphate content initially increased and then decreased. However, the log2 fold-change in Trehalose content continuously increased at 48 h and 168 h under 200 mM NaCl + 10 mM KCl treatment.

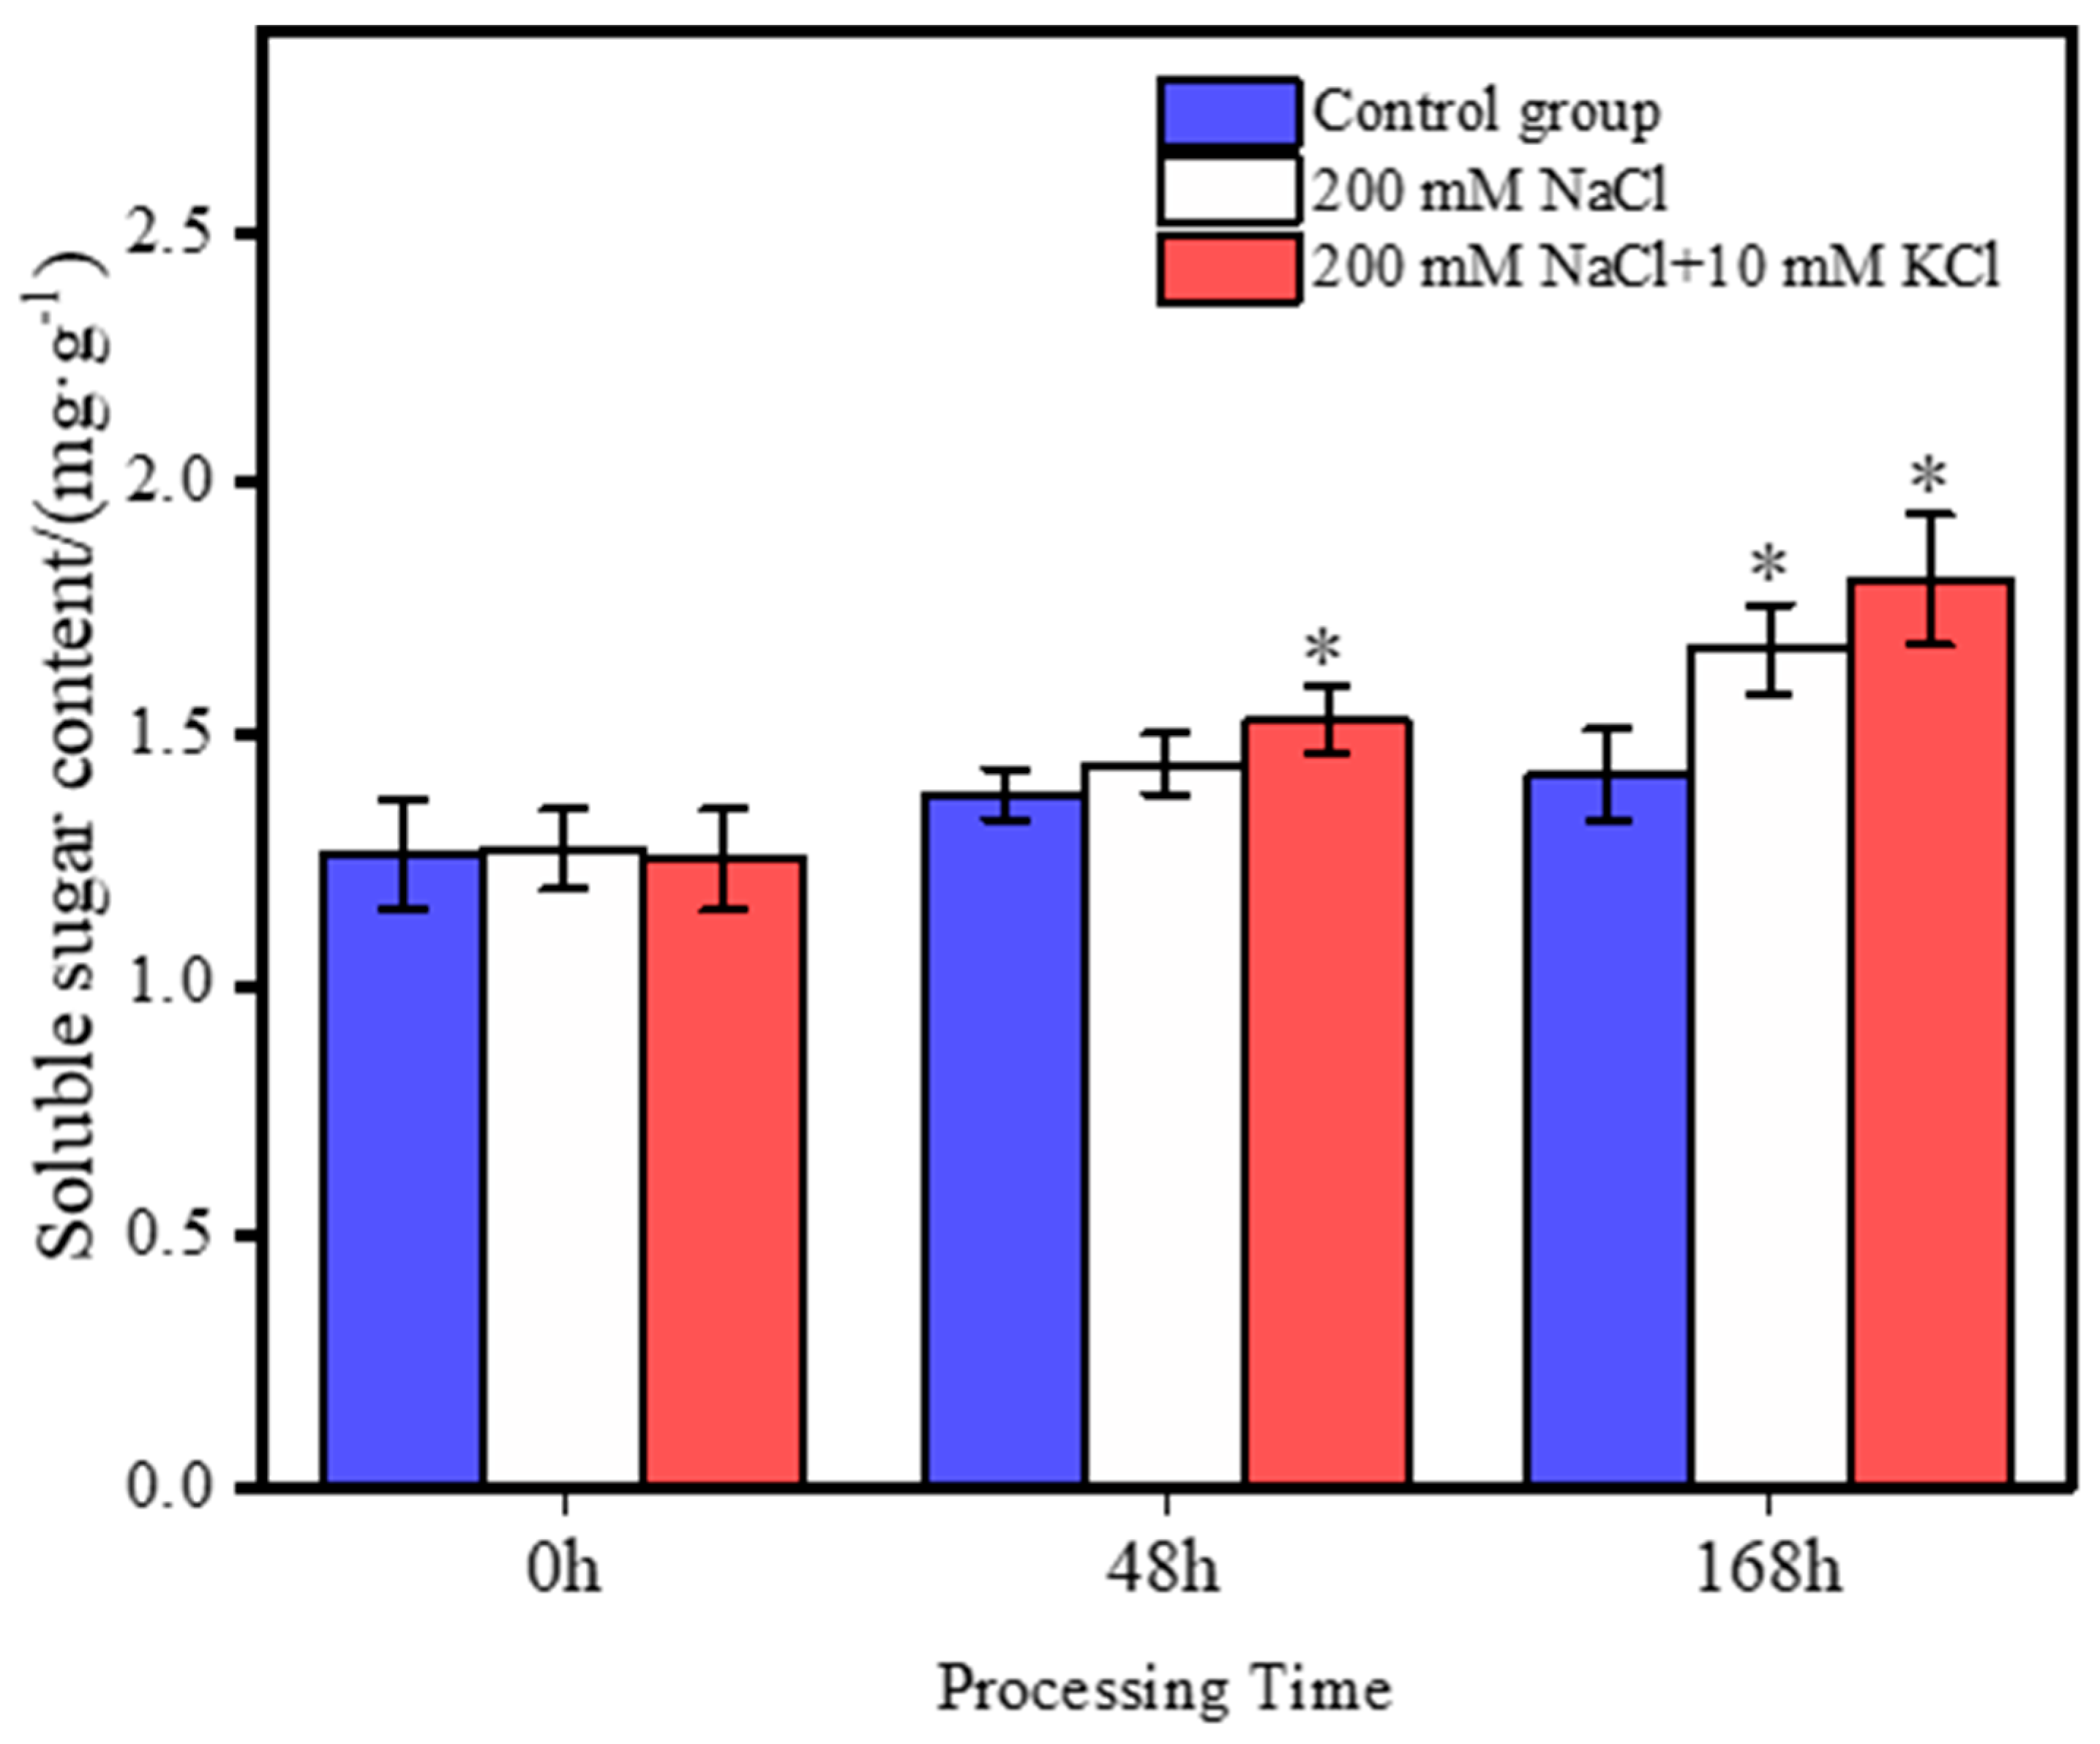
3.2. Changes in Soluble Sugar Content

In the roots of T. ramosissima, when exogenous K+ was applied in response to 168 h of NaCl exposure, the results (Figure 2) showed that the soluble sugar content in the control group did not change significantly within 168 h. The soluble sugar content in both the 200 mM NaCl and 200 mM NaCl + 10 mM KCl groups increased over time, with the 200 mM NaCl + 10 mM KCl group showing the greatest increase in soluble sugar content. At 48 h, the soluble sugar content in the 200 mM NaCl + 10 mM KCl treatment group significantly increased compared to the control group. However, the 200 mM NaCl group showed a slight increase in soluble sugar content compared to the control group, but the difference was not significant. At 168 h, both the 200 mM NaCl + 10 mM KCl and 200 mM NaCl groups had a significant increase in soluble sugar content compared to the control group, and there were significant differences in soluble sugar content between both these groups and the control group.

3.3. Analysis of Trehalose-Related Genes in the Roots of T. ramosissima

3.3.1. The Prediction and Analysis of Protein Domains of Trehalose-Related Genes in the Roots of T. ramosissima

Based on transcriptome data, 19 trehalose-related genes were selected to construct a clustering heatmap (Figure 1). Additionally, protein domain prediction analysis was conducted using the Pfam database. Based on the transcription data results of T. ramosissima roots under NaCl stress with exogenous K+ treatment at 0 h, 48 h, and 168 h, we predicted the protein structure domain of the obtained trehalose-related genes using the pfam database. Results show (Supplementary Table S2) that these 19 trehalose-related genes belong to trehalose-phosphatase. The predicted structural domains of the Unigene encoded protein sequences by the HMM model range from 1 to 831, the matched sequence range in the database is 1−233, the hmm length is 233, the bit score ranges from 45.4 to 268.7, the hmm acc is PF02358.16, and the clan is CL0137.

3.3.2. Analysis of the Physicochemical Properties of Proteins Related to Trehalose-Related Genes in the Roots of T. ramosissima

In this study, we utilized expasy (https://web.expasy.org/protparam/, accessed on 20 October 2023) and Molecular Bioinformatics Center (http://cello.life.nctu.edu.tw/, accessed on 13 October 2023) software to analyze the physicochemical properties of the proteins from the 19 obtained trehalose-related genes. Results show (Table 1) that the Number of amino acids ranges from 56 (Unigene0010527) to 865 (Unigene0008340) aa, with a large variation in amino acid numbers. The Molecular weight is between 6194.84 (Unigene0071652) and 98034.22 (Unigene0008340) Da, which is directly proportional to the number of amino acids. The Theoretical pI ranges from 4.36 (Unigene0010527 and Unigene0049771) to 9.07 (Unigene0021959). Among them, five members are alkaline proteins (pI > 7) and 14 members are acidic proteins (pI < 7). Four trehalose-related genes (Unigene0010527, Unigene0049771, Unigene0078133, and Unigene0091673) have an Instability index of less than 40, indicating that most are unstable proteins. The hydrophobicity results of these 19 trehalose gene proteins are all less than 0, indicating that the proteins of these 19 trehalose-related genes are hydrophilic. Subcellular prediction results show that the proteins of the 19 trehalose-related genes are all localized to the Cytoplasmic.

3.3.3. Exploring Variations in Expression Levels of Trehalose-Related Genes in T. ramosissima Roots and Annotating KEGG Pathways

Based on the expression level changes analysis of the obtained 19 trehalose-related genes under NaCl stress with exogenous K+ treatment at 0 h, 48 h, and 168 h. Results (Supplementary Figure S1) indicate that the expression level of Unigene0025943 increased initially and then decreased under 48 h and 168 h of NaCl stress. However, its expression level continually rose under 48 h and 168 h of NaCl stress with exogenous K+, and there was a significant difference in its expression level at 48 h and 168 h with 200 mM NaCl + 10 mM KCl compared to the control group. Five trehalose-related genes (Unigene0001622, Unigene0008166, Unigene0015746, Unigene0021959, and Unigene0095053) showed a pattern of initial decline followed by an increase in their expression levels under 48 h and 168 h of NaCl stress. However, their expression levels were consistently rising under 48 h and 168 h of NaCl stress with exogenous K+. Notably, Unigene0015746 and Unigene0021959 showed a significant difference in their expression levels at 48 h and 168 h with 200 mM NaCl + 10 mM KCl compared to the control group. Furthermore, the expression level of Unigene0042390 consistently increased in both treatments (NaCl treatment group and NaCl + KCl treatment group) at 48 h and 168 h.
According to Supplementary Table S3, these 19 trehalose-related genes were annotated to 3 KEGG pathways, namely, Metabolic pathways (ko01100), Biosynthesis of secondary metabolites pathway (ko01110), and starch and sucrose metabolism pathway (ko00500).

3.4. Analysis of DEGs and Metabolites in the Starch and Sucrose Metabolism Pathway

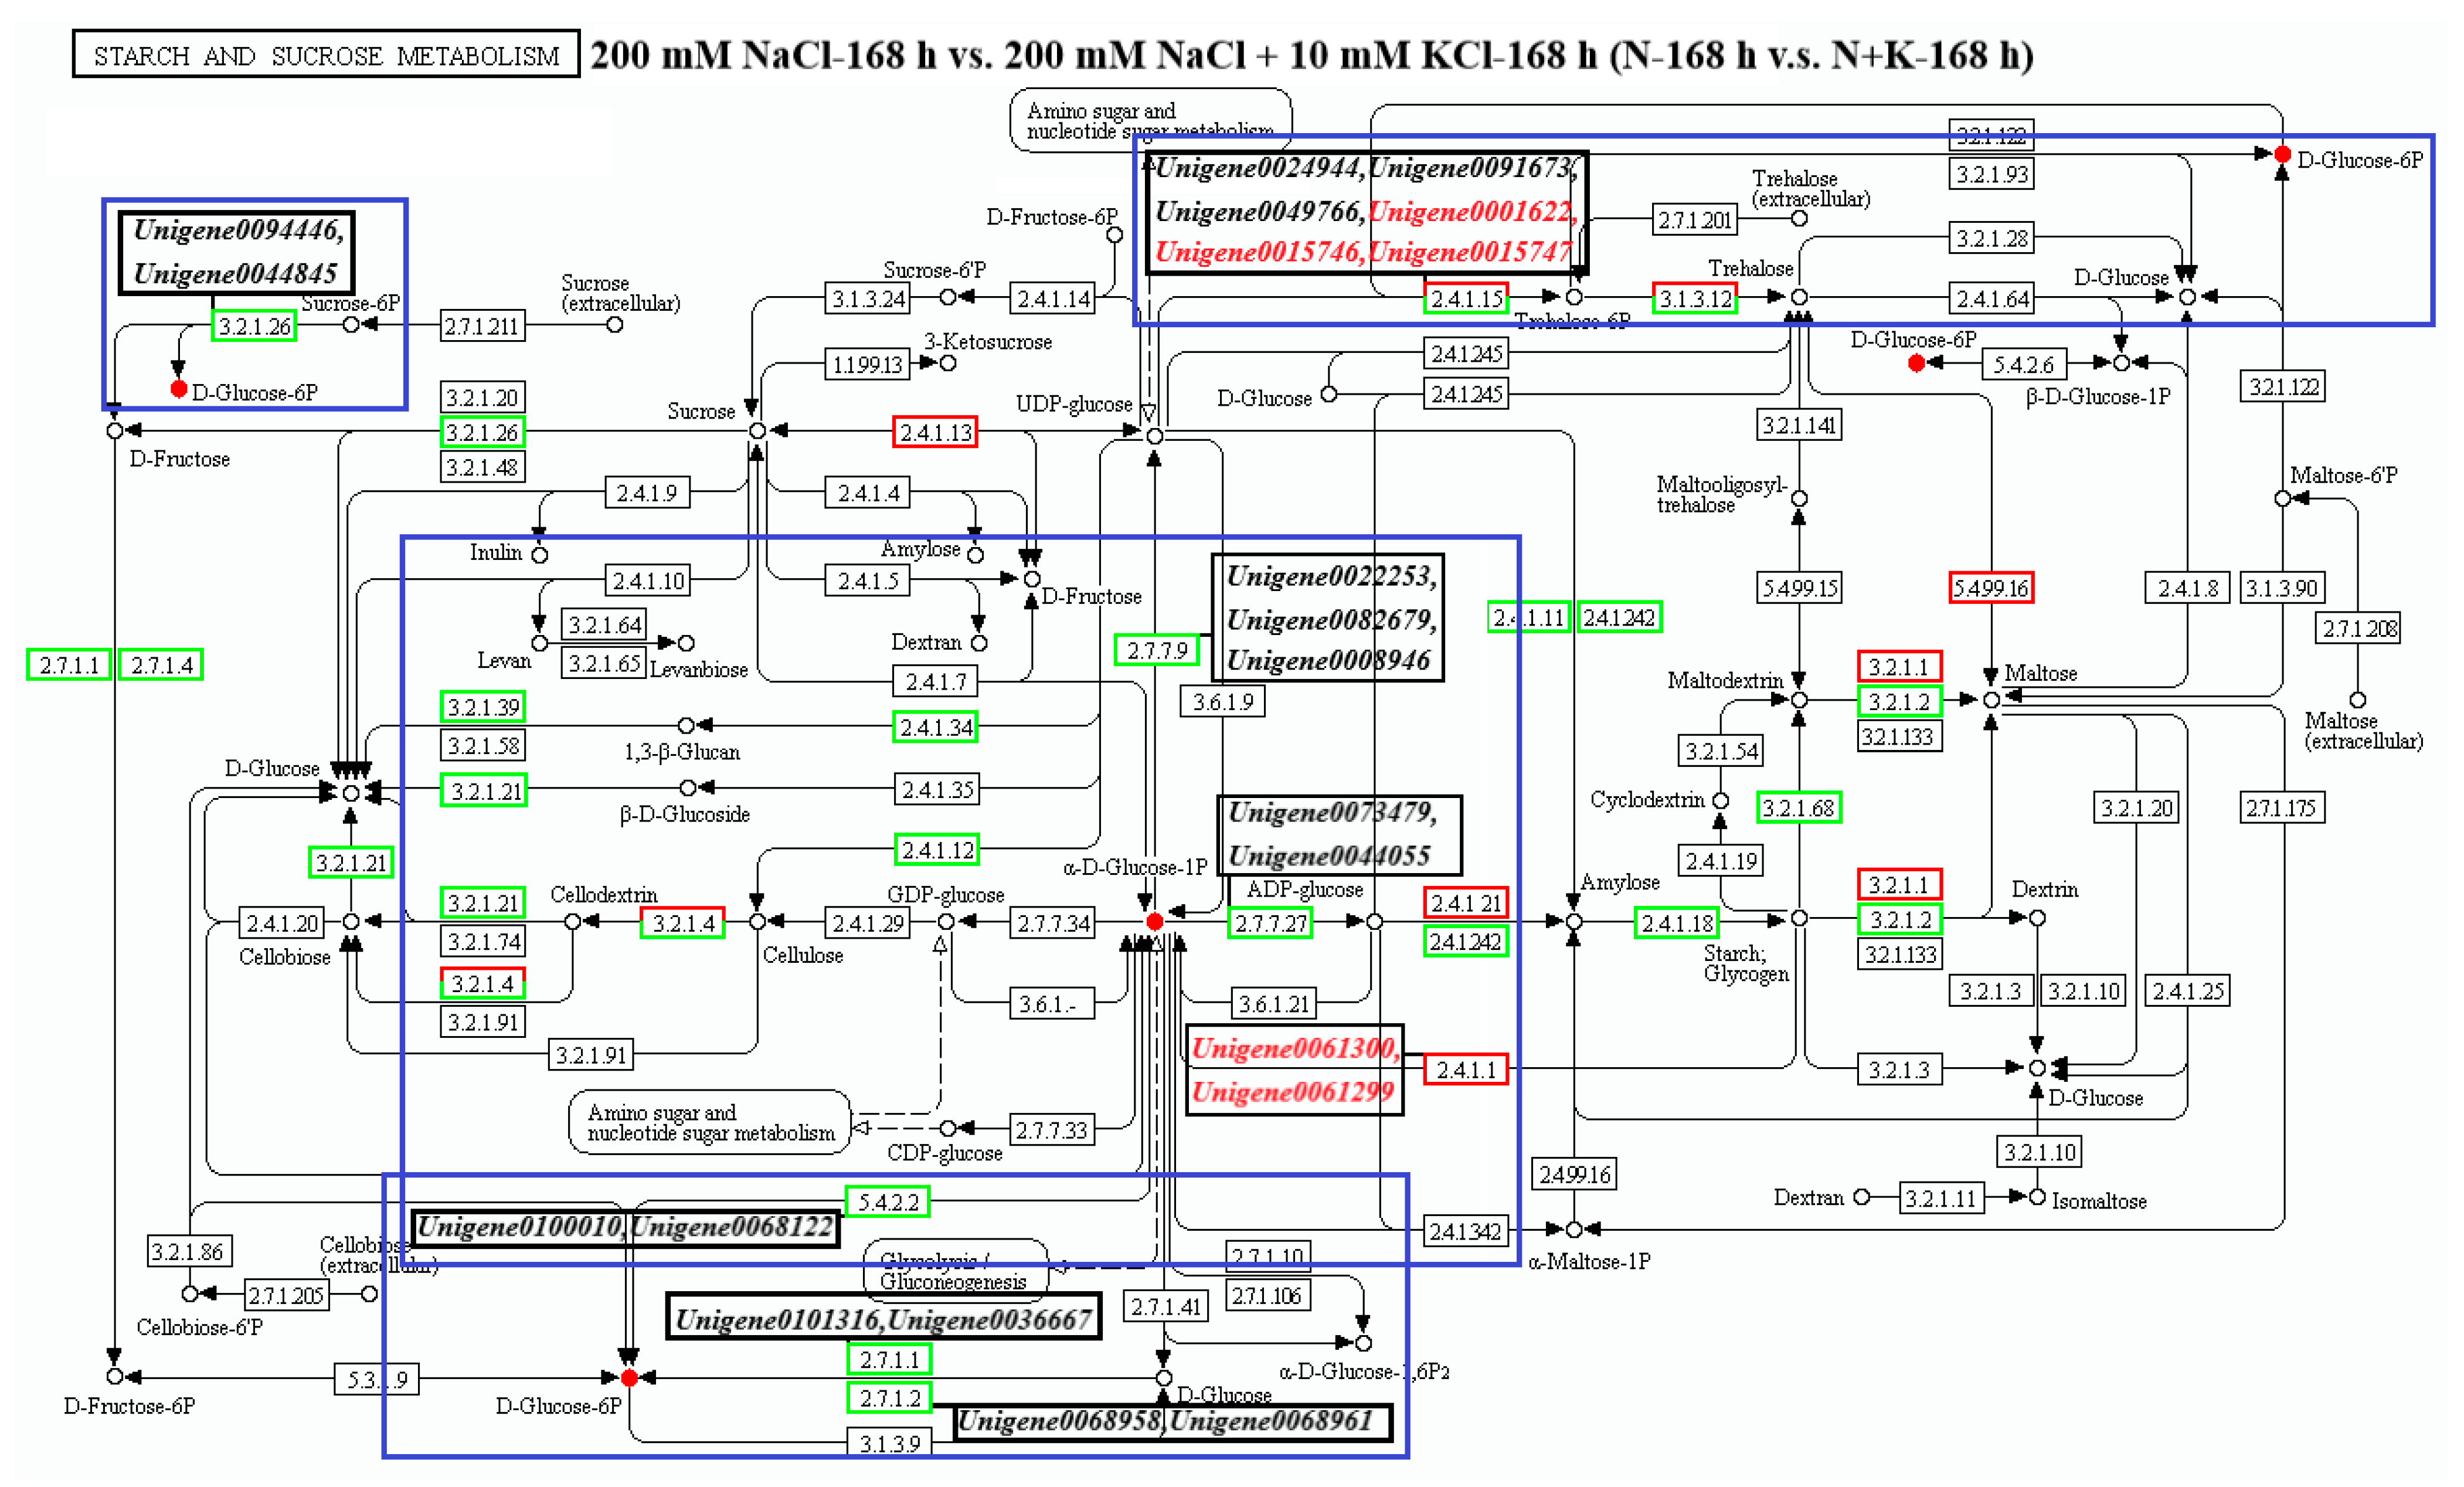
3.4.1. Analysis of DEGs Annotated to the Starch and Sucrose Metabolism Pathway

Based on the annotation of 19 trehalose-related genes to the KEGG pathway, this study focuses on the starch and sucrose metabolism pathway. According to the analysis table of the starch and sucrose metabolism pathway (Supplementary Table S4), there are 71 DEGs enriched in the comparison group of 200 mM NaCl-48 h vs. 200 mM NaCl + 10 mM KCl-48 h (N-48 h vs. N + K-48 h), with 22 upregulated and 49 downregulated (Figure 2). Among them, 6 trehalose-related genes are annotated to the starch and sucrose metabolism pathway, and they regulate the differential metabolite (D-Glucose 6-phosphate). They are Unigene0015746, Unigene0049770, Unigene0008340, Unigene0049766, Unigene0008340, Unigene0000288, and Unigene0049771. Notably, except for Unigene0008340, which is downregulated in the N-48 h vs. N + K-48 h group, the other 5 trehalose-related genes are upregulated.
In the comparison group of 200 mM NaCl-168 h vs. 200 mM NaCl + 10 mM KCl-168 h (N-168 h vs. N + K-168 h), 59 DEGs are enriched in the starch and sucrose metabolism pathway. Of these, 13 are upregulated and 46 are downregulated (Figure 2). Eight trehalose-related genes are annotated, namely Unigene0021959, Unigene0010526, Unigene0074391, Unigene0001622, Unigene0091673, Unigene0015746, Unigene0015747, and Unigene0049766. However, only 5 of these (Unigene0001622, Unigene0091673, Unigene0015746, Unigene0015747, Unigene0049766) regulate the metabolite (D-Glucose 6-phosphate). Except for Unigene0091673, which is downregulated in the N-168 h vs. N + K-168 h group, the other 4 trehalose-related genes are upregulated.

3.4.2. Analysis of Differential Metabolites Annotated to the Starch and Sucrose Metabolism Pathway

According to Supplementary Table S4, in the comparison groups N-48 h vs. N + K-48 h and N-168 h vs. N + K-168 h, two differential metabolites are annotated to the starch and sucrose metabolism pathway: D-Glucose 6-phosphate (D-Glucose 6P) and alpha-D-Glucose 1-phosphate (αD-Glucose 1P) (Supplementary Table S5). Interestingly, both D-Glucose 6P and αD-Glucose 1P are accumulated in these groups (Figure 2). Results show that the log2 fold-change of D-Glucose 6P is rising under 48 h and 168 h of NaCl stress (Supplementary Figure S2). After exogenous K+ is added under NaCl stress, it first rises and then falls at 48 h and 168 h. Although the log2-fold change of D-Glucose 6P drops under the addition of exogenous K+ at 168 h under NaCl stress, it is still higher than the log2-fold change of the Control group. The log2 fold-change of αD-Glucose 1P first rises and then falls under 48 h and 168 h of NaCl stress. After the addition of K+ under NaCl stress, the log2 fold-change of αD-Glucose 1P continues to rise at both 48 h and 168 h.

3.4.3. Analysis of the Correlation between Differential Metabolites and Their Related DEGs in the Starch and Sucrose Metabolism Pathway

DEGS in the starch and sucrose metabolism pathway participate in regulating related differential metabolites. There are 26 DEGs whose expression levels changed in N-48 h vs. N + K-48 h and in N-168 h vs. N + K-168 h (Supplementary Figure S3), and they are involved in regulating the accumulation of D-Glucose 6P. In N-48 h vs. N + K-48 h and in N-168 h vs. N + K-168 h, 22 DEGs show changes in expression levels (Supplementary Figure S4), and they are involved in regulating the accumulation of αD-Glucose 1P. Results (Figure 3) showed that in the N-48 h vs. N + K-48 h comparison group, two DEGs (Unigene0094446 and Unigene0027498) upstream of D-Glucose 6P positively regulate its accumulation. Unigene0064950 upstream negatively regulates its accumulation. Five genes (Unigene0049771, Unigene0000288, Unigene0015746, Unigene0049770, and Unigene0049766) downstream positively regulate D-Glucose 6P accumulation, while Unigene0008340 downstream negatively regulates it. Notably, two genes (Unigene0068122 and Unigene00100010) are both upstream and downstream and positively regulate D-Glucose 6P accumulation. Six genes (Unigene0073991, Unigene0000469, Unigene0037695, Unigene0073993, Unigene0008531, and Unigene0008530) both upstream and downstream negatively regulate D-Glucose 6P accumulation. In the N-48 h vs. N + K-48 h group, genes (Unigene0076242, Unigene0049268, Unigene0076244, Unigene0075677, and Unigene0022108) upstream negatively regulate αD-Glucose 1P accumulation. Unigene0073479 downstream positively regulates αD-Glucose 1P accumulation. Five genes (Unigene0069293, Unigene0040458, Unigene0044055, Unigene0104581, and Unigene0083047) downstream negatively regulate αD-Glucose 1P accumulation. Notably, two genes (Unigene0068122 and Unigene00100010) are both upstream and downstream and negatively regulate αD-Glucose 1P accumulation. Four genes (Unigene0073991, Unigene0000469, Unigene0037695, and Unigene0073993) both upstream and downstream negatively regulate αD-Glucose 1P accumulation.
In the N-168 h vs. N + K-168 h group, six genes (Unigene0094446, Unigene0044845, Unigene00101316, Unigene0036667, Unigene0068958, and Unigene0068961) upstream negatively regulate D-Glucose 6P accumulation. Three genes (Unigene0001622, Unigene0015746, and Unigene0015747) downstream positively regulate D-Glucose 6P accumulation. Three genes (Unigene0024944, Unigene0091673, and Unigene0049766) downstream negatively regulate D-Glucose 6P accumulation. Notably, Unigene0100010 and Unigene0036667 are both upstream and downstream and negatively regulate D-Glucose 6P accumulation. In the same group, Unigene0061300 and Unigene0061299 upstream positively regulate αD-Glucose 1P accumulation. Five genes (Unigene0022253, Unigene0082679, Unigene0008946, Unigene0073479, and Unigene0044055) downstream negatively regulate αD-Glucose 1P accumulation. Notably, Unigene0100010 and Unigene0036667 are both upstream and downstream and negatively regulate αD-Glucose 1P accumulation.
Using Pearson’s correlation coefficient with an absolute value |Corr| > 0.8 and p < 0.05 as the criteria, we performed a correlation analysis between DEGs and their associated differential metabolites in the starch and sucrose metabolism pathway. Results (Figure 4) showed that in the N-48 h vs. N + K-48 h group, two genes (Unigene0000288 and Unigene0015746) positively regulate D-Glucose 6P accumulation and have a significant correlation with D-Glucose 6P. Seven genes (Unigene0008340, Unigene0008531, Unigene0064950, Unigene0000469, Unigene0037695, Unigene0073991, and Unigene0073993) negatively regulate D-Glucose 6P accumulation and have a significant correlation with D-Glucose 6P. Moreover, Unigene0083047 negatively regulates αD-Glucose 1P accumulation and has a significant correlation with αD-Glucose 1P. In the N-168 h vs. N + K-168 h group, two genes (Unigene0015746 and Unigene0001622) positively regulate D-Glucose 6P accumulation and have a significant correlation with D-Glucose 6P. Two genes (Unigene0068958 and Unigene0091673) negatively regulate D-Glucose 6P accumulation, and it has a significant correlation with D-Glucose 6P. Also, Unigene002679 negatively regulates αD-Glucose 1P accumulation and has a significant correlation with αD-Glucose 1P. Notably, Unigene0015746, related to trehalose, in both the N-48 h vs. N + K-48 h and N-168 h vs. N + K-168 h groups, positively regulates D-Glucose 6P accumulation and has a significant correlation. Unigene0015746 can be considered as a key candidate gene for special attention.

3.5. Phylogenetic Analysis of Key Candidate Genes Related to Trehalose in the Starch and Sucrose Metabolism Pathway

In the starch and sucrose metabolism pathway, the expression level of Unigene0015746 under NaCl stress initially declined at 48 h and then increased at 168 h. However, with the influence of exogenous K+, its expression level continually rose under NaCl stress at both 48 h and 168 h when K+ was added (Supplementary Figure S1). Notably, the expression level of Unigene0015746, when compared to the control group, showed significant differences at 48 h and 168 h under NaCl stress with exogenous K+. Moreover, Unigene0015746, a gene associated with trehalose, is positively regulating the accumulation of D-Glucose 6P in both the N-48 h vs. N + K-48 h and N-168 h vs. N + K-168 h comparison groups (Figure 2) and has a significant correlation (Figure 3). Thus, we infer that Unigene0015746 is a key candidate gene related to trehalose.
Using the protein amino acid sequence of Unigene0015746 obtained, we performed a BLAST search on the National Center for Biotechnology Information (NCBI) database. From the results, 20 homologous protein amino acid sequences, along with the sequence of Unigene0015746, were selected to construct a phylogenetic tree (Supplementary Table S6). The results indicate that Unigene0015746 shares a close phylogenetic relationship with Chenopodium quinoa (Supplementary Figure S5).

3.6. qRT-PCR Validation of Trehalose-Related Candidate Genes

In this study, nine trehalose-related candidate genes were randomly selected for qRT-PCR to validate the reliability of the transcriptome sequencing data obtained. The results (Supplementary Figure S6) indicate that the expression trends from the qRT-PCR validation align with those from the transcriptome sequencing analysis. This confirms that the transcriptome data obtained in this study are accurate and reliable, providing a scientific basis for identifying key candidate genes involved in resistance to NaCl stress in the roots of T. ramosissima.

4. Discussion

Plants encounter salt stress when exposed to saline environments, primarily due to NaCl [59]. The detrimental effects of NaCl on plants result from the accumulation of Na+ ions [60] and the toxic impacts of both Na+ and Cl ions [61]. Elevated NaCl levels can induce various adverse effects, including disruptions in photosynthesis, osmotic stress, increased ROS production, oxidative stress, ionic toxicity, and nutritional imbalances, all of which can impede plant growth [62,63]. To withstand salt stress, plants maintain osmotic potential by utilizing internal osmoprotectants [20]. In response to salt stress, plants implement strategies to adjust the cell’s osmotic potential by synthesizing osmoprotectants or compatible solutes, such as sugars like trehalose [64]. Specifically, soluble sugars play a crucial role in maintaining the overall structure and growth of plants. They actively participate in regulating growth, photosynthesis, carbon allocation, carbohydrate and lipid metabolism, osmotic homeostasis, protein synthesis, and gene expression [65], as well as in stabilizing membranes [66,67]. Notably, the accumulation of soluble sugar content under salt stress increases the proline content [68]. Proline acts by enhancing antioxidant activity, functioning as an osmolyte, scavenging reactive oxygen species, and stabilizing biomolecular structures [69]. It helps maintain turgor and stabilize cellular structures under salt stress [70]. In T. ramosissima, the proline content increased when exposed to 200 mM NaCl stress and supplemented with 10 mM KCl for 48 h to 168 h, enhancing the plant’s salt tolerance [71]. In this study, the content of soluble sugars consistently increased under both 200 mM NaCl and 200 mM NaCl + 10 mM KCl treatments at 48 h and 168 h. Moreover, there was a significant increase in soluble sugar content in the 200 mM NaCl + 10 mM KCl treatment at both 48 h and 168 h compared to the control group. These results suggest that soluble sugars in T. ramosissima roots continuously accumulate under NaCl stress, actively responding to the stressor. Especially with the addition of exogenous K+, there is an even higher accumulation of soluble sugars in T. ramosissima under NaCl stress. This increase in the sugar content enhances the proline content in the T. ramosissima root system, boosts its antioxidant activity, and helps the plant better resist and alleviate the damage brought about by NaCl stress.
Trehalose, a soluble sugar [72], serves as an osmoprotectant and stabilizing molecule, playing a crucial role in plant growth, development, and responses to adverse conditions [24,73,74,75]. Specifically, trehalose is an essential osmoregulatory substance [76] that effectively stabilizes dehydrating enzymes, proteins, antioxidants, and lipids under abiotic stress, protecting biomembranes from damage and enhancing plant stress tolerance by modulating carbohydrate sugar signals [77,78]. Additionally, trehalose acts as a signaling metabolite in abiotic stress responses, with its intermediate, Tre6P, likely regulating plant sucrose metabolism and growth [79,80]. In rice, overexpression of TPSP increases trehalose accumulation, elevating soluble sugar content and enhancing drought and salt tolerance [81]. Moreover, under NaCl stress, exogenous trehalose application reduces intracellular Na+ accumulation, preventing salt-induced chlorophyll loss in leaves and root damage, thereby minimizing salt ion harm to the plant [20]. Notably, TPS is a key enzyme gene in trehalose biosynthesis with a protective role against salt stress [82].
In this study, although Trehalose 6-phosphate was detected and annotated in the starch and sucrose metabolism pathway, it did not show significant changes. Therefore, we focused on the Log2 fold-change of Trehalose 6-phosphate under NaCl stress with added exogenous K+ at 48 h and 168 h (Figure 1). Under 200 mM NaCl treatment, the Log2 fold-change of Trehalose 6-phosphate initially increased then decreased at both 48 h and 168 h, with significant differences observed at 168 h compared to the control. Similarly, under 200 mM NaCl + 10 mM KCl treatment, the Log2 fold-change first increased then decreased at both time points. However, significant differences were noted at 48 h compared to the NaCl control, and the Log2 fold-change at 168 h was higher than the control. These results indicate that exogenous K+ addition allows Trehalose 6-phosphate to actively counteract NaCl stress at both 48 h and 168 h, alleviating NaCl-induced damage in T. ramosissima.
Furthermore, in rice, overexpression of OsTPS1 enhances tolerance to cold, salt, drought, and other abiotic stresses [83]. In our study, we identified 19 trehalose-related genes categorized under Trehalose-phosphatase in the PfamA_definition of the Pfam database. All 19 genes are annotated to the starch and sucrose metabolism pathway (ko00500), with varying expression levels. Specifically, Unigene0025943 showed increased expression followed by a decrease under NaCl stress at 48 h and 168 h. However, its expression continued to rise when exogenous K+ was applied under NaCl stress at both time points, with significant differences observed in the 200 mM NaCl + 10 mM KCl treatment compared to the control. Five trehalose-related genes (Unigene0001622, Unigene0008166, Unigene0015746, Unigene0021959, and Unigene0095053) initially decreased and then increased their expression under NaCl stress at 48 h and 168 h. In contrast, their expression consistently rose when exogenous K+ was applied under NaCl stress at both time points. Notably, Unigene0015746 and Unigene0021959 in the 200 mM NaCl + 10 mM KCl treatment at 48 h and 168 h showed significant expression differences compared to the control. Additionally, Unigene0042390 consistently increased its expression at both 48 h and 168 h under both treatments (NaCl and NaCl + KCl). These findings suggest that exogenous K+ influences these genes to regulate trehalose by upregulating their expression, enhancing K+ absorption and accumulation in T. ramosissima roots, and mitigating NaCl-induced damage.
In plants, trehalose is mainly synthesized from glucose as a substrate. The synthesis process begins with TPS, which catalyzes the reaction between UDPG and G6P to produce trehalose-6-phosphate. This intermediate is then dephosphorylated by TPP to form trehalose [80,81,82]. In this study, D-Glucose 6P was annotated to the starch and sucrose metabolism pathway in the comparison groups N-48 h vs. N + K-48 h and N-168 h vs. N + K-168 h, showing continuous accumulation. In the N-48 h vs. N + K-48 h group, five trehalose-related genes (Unigene0049771, Unigene0000288, Unigene0015746, Unigene0049770, and Unigene0049766) positively regulated the accumulation of D-Glucose 6P downstream. Among these, Unigene0000288 and Unigene0015746 were significantly correlated with D-Glucose 6P. In the N-168 h vs. N + K-168 h group, three trehalose-related genes (Unigene0001622, Unigene0015746, and Unigene0015747) positively regulated the accumulation of D-Glucose 6P downstream. Notably, Unigene0015746 and Unigene0001622 showed significant correlations with D-Glucose 6P. In summary, D-Glucose 6P, as an intermediate in trehalose production, was positively regulated by trehalose-related genes and accumulated at 48 h and 168 h after exogenous K+ was applied under NaCl stress. The results indicate that trehalose-related genes actively upregulate their expression levels to catalyze the accumulation of D-Glucose 6P, thereby accelerating trehalose production in response to NaCl stress, protecting the root cells of T. ramosissima from NaCl damage. Additionally, it is noteworthy that Unigene0015746 consistently positively regulated the accumulation of D-Glucose 6P downstream of D-Glucose 6P in both the N-48 h vs. N + K-48 h and N-168 h vs. N + K-168 h comparison groups, and it showed a significant correlation with D-Glucose 6P.
In summary, the results of this manuscript indicate that trehalose is involved in the response of T. ramosissima to NaCl stress through the application of exogenous K+. The upregulation of trehalose-related genes modulates the accumulation of related metabolites and participates in several crucial metabolic pathways, thereby forming a more systematic defense system to mitigate the damage caused by NaCl in T. ramosissima. In particular, one trehalose candidate gene (Unigene0015746) plays a significant role in some of these crucial metabolic pathways, making it a key candidate gene for further research and validation.

5. Conclusions

Trehalose, a vital soluble sugar, enhances plant abiotic stress tolerance by stabilizing proteins and membranes and modulating sugar signaling. In T. ramosissima roots exposed to NaCl stress for 48 and 168 h, numerous trehalose-related genes within the starch and sucrose metabolism pathway regulated the accumulation of D-Glucose 6P and αD-Glucose 1P. These genes and metabolites support plant growth, development, and defense against salt stress, thereby improving tolerance and maintaining normal growth. Notably, Unigene0015746 positively regulates D-Glucose 6P accumulation and is strongly correlated with it, making it a key candidate gene for further trehalose-related research.

Supplementary Materials

The following are available online at https://www.mdpi.com/article/10.3390/f15111905/s1, Table S1: Sequences of specific primers; Table S2: Prediction data table of Pfam protein structure domains of trehalose-related genes; Table S3: KEGG pathway annotations and Log2 fold-Change variations of trehalose-related genes; Table S4: starch and sucrose metabolism pathway analysis; Table S5: Analysis of differential metabolites in the starch and sucrose metabolism pathway; Table S6: Information table of 20 species; Figure S1: Expression level changes of trehalose-related genes; Figure S2: Log2 fold-change of differential metabolites annotated in the starch and sucrose metabolism pathway; Figure S3: Differential expression of genes in the starch and sucrose metabolism pathway involved in regulating D-Glucose 6-phosphate; Figure S4: Differential expression genes in the starch and sucrose metabolism pathway involved in regulating alpha-D-Glucose 1-phosphate; Figure S5: Phylogenetic tree analysis of the key candidate genes related to trehalose in T. ramosissima; Figure S6: Validation of candidate key trehalose-related genes by qRT-PCR.

Author Contributions

Conceptualization, Y.C.; Methodology, Y.C.; Software, Y.C. and S.Z.; Validation, Y.C.; Formal analysis, Y.C.; Investigation, Y.C.; Resources, Y.C.; Data curation, Y.C. and S.Z.; Writing—original draft, Y.C.; Writing—review & editing, Y.C., J.J. and L.W.; Visualization, Y.C. and S.Z.; Supervision, J.J. and L.W.; Project administration, M.Z., D.S., J.J. and L.W.; Funding acquisition, J.J. and L.W. All authors have read and agreed to the published version of the manuscript.

Funding

This research was funded by Jiangsu Provincial Forestry Science and Technology Innovation and Promotion Project “Jiangsu Provincial Long-term Research Base for Breeding Salttolerant Native Tree Species” [Grant No. LYKJ2021108] and Independent Scientific Research Project of Jiangsu Academy of Forestry “Selection and Breeding of Salt-Tolerant Precious Native Tree Species such as the Maclura tricuspidate” [Grant No. ZZKY202103].

Data Availability Statement

The data presented in this study are openly available in National Center for Biotechnology Information (NCBI) at https://www.ncbi.nlm.nih.gov/sra, accessed on 21 January 2022, reference number [SRP356215].

Conflicts of Interest

The authors declare no conflicts of interest.

References

  1. Shahid, M.A.; Sarkhosh, A.; Khan, N.; Balal, R.M.; Ali, S.; Rossi, L.; Gómez, C.; Mattson, N.; Nasim, W.; Garcia-Sanchez, F. Insights into the Physiological and Biochemical Impacts of Salt Stress on Plant Growth and Development. Agronomy 2020, 10, 938. [Google Scholar] [CrossRef]
  2. Morton, M.J.L.; Awlia, M.; Al Tamimi, N.; Saade, S.; Pailles, Y.; Negrão, S.; Tester, M. Salt stress under the scalpel—Dissecting the genetics of salt tolerance. Plant J. Cell Mol. Biol. 2019, 97, 148–163. [Google Scholar] [CrossRef]
  3. Parida, A.K.; Das, A.B. Salt tolerance and salinity effects on plants: A review. Ecotox. Environ. Safe. 2005, 60, 324–349. [Google Scholar] [CrossRef] [PubMed]
  4. Tang, X.; Mu, X.; Shao, H.; Wang, H.; Brestic, M. Global plant-responding mechanisms to salt stress: Physiological and molecular levels and implications in biotechnology. Crit. Rev. Biotechnol. 2015, 35, 425–437. [Google Scholar] [CrossRef]
  5. Koyro, H.W. Effect of salinity on growth, photosynthesis, water relations and solute composition of the potential cash crop halophyte Plantago coronopus (L.). Environ. Exp. Bot. 2006, 56, 136–146. [Google Scholar] [CrossRef]
  6. Zhu, J. Plant salt tolerance. Trends Plant Sci. 2001, 6, 66–71. [Google Scholar] [CrossRef]
  7. Ma, L.; Liu, X.; Lv, W.; Yang, Y. Molecular Mechanisms of Plant Responses to Salt Stress. Front. Plant Sci. 2022, 13, 934877. [Google Scholar] [CrossRef]
  8. Chen, A.; Tapia, H.; Goddard, J.M.; Gibney, P.A. Trehalose and its applications in the food industry. Compr. Rev. Food. Sci. Food Saf. 2022, 21, 5004–5037. [Google Scholar] [CrossRef] [PubMed]
  9. Elbein, A.D.; Pan, Y.T.; Pastuszak, I.; Carroll, D. New insights on trehalose: A multifunctional molecule. Glycobiology 2003, 13, 17R–27R. [Google Scholar] [CrossRef]
  10. Paul, M.J.; Primavesi, L.F.; Jhurreea, D.; Zhang, Y. Trehalose Metabolism and Signaling. Annu. Rev. Plant Biol. 2008, 59, 417–441. [Google Scholar] [CrossRef]
  11. Avonce, N.; Mendoza-Vargas, A.; Morett, E.; Iturriaga, G. Insights on the evolution of trehalose biosynthesis. BMC Evol. Biol. 2006, 6, 109. [Google Scholar] [CrossRef] [PubMed]
  12. Schluepmann, H.; van Dijken, A.; Aghdasi, M.; Wobbes, B.; Paul, M.; Smeekens, S. Trehalose mediated growth inhibition of Arabidopsis seedlings is due to trehalose-6-phosphate accumulation. Plant Physiol. 2004, 135, 879–890. [Google Scholar] [CrossRef] [PubMed]
  13. van Dijken, A.J.; Schluepmann, H.; Smeekens, S.C. Arabidopsis trehalose-6-phosphate synthase 1 is essential for normal vegetative growth and transition to flowering. Plant Physiol. 2004, 135, 969–977. [Google Scholar] [CrossRef] [PubMed]
  14. O’Hara, L.E.; Paul, M.J.; Wingler, A. How do sugars regulate plant growth and development? New insight into the role of trehalose-6-phosphate. Mol. Plant. 2013, 6, 261–274. [Google Scholar] [CrossRef]
  15. Khan, M.K.; Pandey, A.; Hamurcu, M.; Vyhnánek, T.; Zargar, S.M.; Kahraman, A.; Topal, A.; Gezgin, S. Exploring strigolactones for inducing abiotic stress tolerance in plants. Czech J. Genet. Plant Breed. 2024, 60, 55–69. [Google Scholar] [CrossRef]
  16. El-Bashiti, T.; Hamamci, H.; Oktem, H.A.; Yucel, M. Biochemical analysis of trehalose and its metabolizing enzymes in wheat under abiotic stress conditions. Plant Sci. 2005, 169, 47–54. [Google Scholar] [CrossRef]
  17. Habibur, R.P.M.; Imai, R. Functional identification of a trehalose 6-phosphate phosphatase gene that is involved in transient induction of trehalose biosynthesis during chilling stress in rice. Plant Mol.Biol. 2005, 58, 751–762. [Google Scholar] [CrossRef]
  18. Shima, S.; Matsui, H.; Tahara, S.; Imai, R. Biochemical characterization of rice trehalose-6-phosphate phosphatases supports distinctive functions of these plant enzymes. FEBS J. 2007, 274, 1192–1201. [Google Scholar] [CrossRef]
  19. Krasensky, J.; Broyart, C.; Rabanal, F.A.; Jonak, C. The redox-sensitive chloroplast trehalose-6-phosphate phosphatase AtTPPD regulates salt stress tolerance. Antioxid. Redox Signal. 2014, 21, 1289–1304. [Google Scholar] [CrossRef]
  20. Garcia, A.B.; Almeida Engler, J.D.; Iyer, S.; Gerats, T.; Montagu, M.V.; Caplan, A.B. Effects of osmoprotectants upon NaCl stress in rice. Plant Physiol. 1997, 115, 159–169. [Google Scholar] [CrossRef]
  21. Nounjan, N.; Nghia, P.T.; Theerakulpisut, P. Exogenous proline and trehalose promote recovery of rice seedlings from salt-stress and differentially modulate antioxidant enzymes and expression of related genes. J. Plant Physiol. 2012, 169, 596–604. [Google Scholar] [CrossRef] [PubMed]
  22. Yang, L.; Zhao, X.; Zhu, H.; Paul, M.; Zu, Y.; Tang, Z. Exogenous trehalose largely alleviates ionic unbalance, ROS burst, and PCD occurrence induced by high salinity in Arabidopsis seedlings. Front. Plant Sci. 2014, 5, 570. [Google Scholar] [CrossRef]
  23. Schluepmann, H.; Pellny, T.; van Dijken, A.; Smeekens, S.; Paul, M. Trehalose 6-phosphate is indispensable for carbohydrate utilization and growth in Arabidopsis thaliana. Proc. Natl. Acad. Sci. USA 2003, 100, 6849–6854. [Google Scholar] [CrossRef]
  24. Fichtner, F.; Lunn, J.E. The Role of Trehalose 6-Phosphate (Tre6P) in Plant Metabolism and Development. Annu. Rev. Plant Biol. 2021, 72, 737–760. [Google Scholar] [CrossRef] [PubMed]
  25. Leigh, R.A.; Storey, R. Intercellular Compartmentation of Ions in Barley Leaves in Relation to Potassium Nutrition and Salinity. J. Exp. Bot. 1993, 44, 755–762. [Google Scholar] [CrossRef]
  26. Munns, R. Comparative physiology of salt and water stress. Plant Cell Environ. 2002, 25, 239–250. [Google Scholar] [CrossRef] [PubMed]
  27. Wang, Y.; Wu, W.H. Regulation of potassium transport and signaling in plants. Curr. Opin. Plant Biol. 2017, 39, 123–128. [Google Scholar] [CrossRef]
  28. Zhang, Y.; Fang, J.; Wu, X.; Dong, L. Na+/K+ Balance and Transport Regulatory Mechanisms in Weedy and Cultivated Rice (Oryza sativa L.) Under Salt Stress. BMC Plant Biol. 2018, 18, 375. [Google Scholar] [CrossRef]
  29. Kumar, P.; Kumar, T.; Singh, S.; Tuteja, N.; Prasad, R.; Singh, J. Potassium: A key modulator for cell homeostasis. J. Biotechnol. 2020, 324, 198–210. [Google Scholar] [CrossRef]
  30. Park, H.J.; Kim, W.Y.; Yun, D.J. A New Insight of Salt Stress Signaling in Plant. Mol. Cells 2016, 39, 447–459. [Google Scholar] [CrossRef]
  31. Zhao, S.; Zhang, Q.; Liu, M.; Zhou, H.; Ma, C.; Wang, P. Regulation of Plant Responses to Salt Stress. Int. J. Mol. Sci. 2021, 22, 4609. [Google Scholar] [CrossRef] [PubMed]
  32. Horie, T.; Hauser, F.; Schroeder, J.I. HKT transporter-mediated salinity resistance mechanisms in Arabidopsis and monocot crop plants. Trends Plant Sci. 2009, 14, 660–668. [Google Scholar] [CrossRef] [PubMed]
  33. Kumar, S.; Beena, A.S.; Awana, M.; Singh, A. Physiological, Biochemical, Epigenetic and Molecular Analyses of Wheat (Triticum aestivum) Genotypes with Contrasting Salt Tolerance. Front. Plant Sci. 2017, 8, 1151. [Google Scholar] [CrossRef] [PubMed]
  34. Sandhu, D.; Cornacchione, M.V.; Ferreira, J.F.; Suarez, D.L. Variable salinity responses of 12 alfalfa genotypes and comparative expression analyses of salt-response genes. Sci. Rep. 2017, 7, 42958. [Google Scholar] [CrossRef] [PubMed]
  35. Di Cera, E. A Structural Perspective on Enzymes Activated by Monovalent Cations. J. Biol. Chem. 2006, 281, 1305–1308. [Google Scholar] [CrossRef]
  36. Nieves-Cordones, M.; Al, S.F.; Sentenac, H. Roles and Transport of Sodium and Potassium in Plants. Met. Ions Life Sci. 2016, 16, 291–324. [Google Scholar] [CrossRef]
  37. Chen, Y.; Zhang, S.; Du, S.; Jiang, J.; Wang, G. Transcriptome and Metabonomic Analysis of Tamarix ramosissima Potassium (K+) Channels and Transporters in Response to NaCl Stress. Genes 2022, 13, 1313. [Google Scholar] [CrossRef]
  38. Song, Z.; Su, Y. Distinctive Potassium-Accumulation Capability of Alligatorweed (Alternanthera philoxeroides) Links to High-Affinity Potassium Transport Facilitated by K+-Uptake Systems. Weed Sci. 2013, 61, 77–84. [Google Scholar] [CrossRef]
  39. Long, R.W.; D’Antonio, C.M.; Dudley, T.L.; Hultine, K.R. Variation in salinity tolerance and water use strategies in an introduced woody halophyte (Tamarix spp.). J. Ecol. 2021, 109, 3807–3817. [Google Scholar] [CrossRef]
  40. Flowers, T.J.; Munns, R.; Colmer, T.D. Sodium chloride toxicity and the cellular basis of salt tolerance in halophytes. Ann. Bot. 2015, 115, 419–431. [Google Scholar] [CrossRef]
  41. Zeng, Y.; Zhao, C.; Kundzewicz, Z.W.; Lv, G. Distribution pattern of Tugai forests species diversity and their relationship to environmental factors in an arid area of China. PLoS ONE 2020, 15, e0232907. [Google Scholar] [CrossRef] [PubMed]
  42. Yang, H.; Xia, J.; Cui, Q.; Liu, J.; Wei, S.; Feng, L.; Dong, K. Effects of different Tamarix chinensis-grass patterns on the soil quality of coastal saline soil in the Yellow River Delta, China. Sci. Total Environ. 2021, 772, 145501. [Google Scholar] [CrossRef]
  43. Wei, X.; Yan, X.; Yang, Z.; Han, G.; Wang, L.; Yuan, F.; Wang, B. Salt glands of recretohalophyte Tamarix under salinity: Their evolution and adaptation. Ecol. Evol. 2020, 10, 9384–9395. [Google Scholar] [CrossRef]
  44. Gao, C.; Wang, Y.; Jiang, B.; Liu, G.; Yu, L.; Wei, Z.; Yang, C. A novel vacuolar membrane H+-ATPase c subunit gene (ThVHAc1) from Tamarix hispida confers tolerance to several abiotic stresses in Saccharomyces cerevisiae. Mol. Biol. Rep. 2011, 38, 957–963. [Google Scholar] [CrossRef]
  45. Gupta, B.; Huang, B.; Catuvelli, L. Mechanism of Salinity Tolerance in Plants: Physiological, Biochemical, and Molecular Characterization. Int. J. Genom. 2014, 2014, 701596. [Google Scholar] [CrossRef] [PubMed]
  46. Che, B.; Cheng, C.; Fang, J.; Liu, Y.; Jiang, L.; Yu, B. The Recretohalophyte Tamarix TrSOS1 Gene Confers Enhanced Salt Tolerance to Transgenic Hairy Root Composite Cotton Seedlings Exhibiting Virus-Induced Gene Silencing of GhSOS1. Int. J. Mol. Sci. 2019, 20, 2930. [Google Scholar] [CrossRef] [PubMed]
  47. Duan, Q.; Zhu, Z.; Wang, B.; Chen, M. Recent Progress on the Salt Tolerance Mechanisms and Application of Tamarisk. Int. J. Mol. Sci. 2022, 23, 3325. [Google Scholar] [CrossRef]
  48. Lu, Y.; Lei, J.Q.; Zeng, F.J.; Xu, L.S.; Peng, S.L.; Gao, H.H.; Liu, G.J. Effects of NaCl treatment on growth and Ecophysiology Characteristics of Tamarix ramossisma. J. Des. Res. 2014, 34, 1509–1515. (In Chinese) [Google Scholar] [CrossRef]
  49. Chen, Y.; Li, H.; Zhang, S.; Du, S.; Zhang, J.; Song, Z.; Jiang, J. Analysis of the main antioxidant enzymes in the roots of Tamarix ramosissima under NaCl stress by applying exogenous potassium (K+). Front. Plant Sci. 2023, 14, 1114266. [Google Scholar] [CrossRef]
  50. Li, H.; Cheng, Z. Hoagland nutrient solution promotes the growth of cucumber seedlings under light-emitting diode light. Acta Agric. Scand. Sect. B Soil Plant Sci. 2015, 65, 74–82. [Google Scholar] [CrossRef]
  51. Yan, J.; Li, H.; Li, Y.; Zhang, N.; Zhang, S. Abscisic acid synthesis and root water uptake contribute to exogenous methyl jasmonate-induced improved tomato drought resistance. Plant Biotechnol. Rep. 2022, 16, 183–193. [Google Scholar] [CrossRef]
  52. Conesa, A.; Gotz, S.; Garcia-Gomez, J.M.; Terol, J.; Talon, M.; Robles, M. Blast2GO: A universal tool for annotation, visualization and analysis in functional genomics research. Bioinformatics 2005, 21, 3674–3676. [Google Scholar] [CrossRef]
  53. Ashburner, M.; Ball, C.A.; Blake, J.A.; Botstein, D.; Butler, H.; Cherry, J.M.; Davis, A.P.; Dolinski, K.; Dwight, S.S.; Eppig, J.T.; et al. Gene Ontology: Tool for the unification of biology. Nat. Genet. 2000, 25, 25–29. [Google Scholar] [CrossRef]
  54. Ernst, J.; Bar-Joseph, Z. STEM: A tool for the analysis of short time series gene expression data. BMC Bioinform. 2006, 7, 191. [Google Scholar] [CrossRef]
  55. Saccenti, E.; Hoefsloot, H.C.J.; Smilde, A.K.; Westerhuis, J.A.; Heniks, M.M.W.B. Reflections on univariate and multivariate analysis of metabolomics data. Metabolomics 2014, 10, 361–374. [Google Scholar] [CrossRef]
  56. Finn, R.D.; Coggill, P.; Eberhardt, R.Y.; Eddy, S.R.; Mistry, J.; Mitchell, A.L.; Potter, S.C.; Punta, M.; Qureshi, M.; Sangrador-Vegas, A.; et al. The Pfam protein families database: Towards a more sustainable future. Nucleic Acids Res. 2016, 44, D279–D285. [Google Scholar] [CrossRef] [PubMed]
  57. Taniguchi, T.; Imada, S.; Acharya, K.; Iwanaga, F.; Yamanaka, N. Effect of soil salinity and nutrient levels on the community structure of the root-associated bacteria of the facultative halophyte, Tamarix ramosissima, in southwestern United States. J. Gen. Appl. Microbiol. 2015, 61, 193–202. [Google Scholar] [CrossRef]
  58. Livak, K.J.; Schmittgen, T.D. Analysis of Relative Gene Expression Data Using Real-Time Quantitative PCR and the 2−ΔΔCT Method. Methods 2001, 25, 402–408. [Google Scholar] [CrossRef]
  59. Shavrukov, Y. Salt stress or salt shock: Which genes are we studying? J. Exp. Bot. 2013, 64, 119–127. [Google Scholar] [CrossRef]
  60. Munns, R.; Tester, M. Mechanisms of salinity tolerance. Annu. Rev. Plant Biol. 2008, 59, 651–681. [Google Scholar] [CrossRef]
  61. van Zelm, E.; Zhang, Y.; Testerink, C. Salt Tolerance Mechanisms of Plants. Annu. Rev. Plant Biol. 2020, 71, 403–433. [Google Scholar] [CrossRef] [PubMed]
  62. Yadav, S.; Irfan, M.; Ahmad, A.; Hayat, S. Causes of salinity and plant manifestations to salt stress: A review. J. Environ. Biol. 2011, 32, 667–685. [Google Scholar] [PubMed]
  63. Barkla, B.J.; Castellanos-Cervantes, T.; Diaz De León, J.L.; Matros, A.; Mock, H.; Perez-Alfocea, F.; Salekdeh, G.H.; Witzel, K.; Zörb, C. Elucidation of salt stress defense and tolerance mechanisms of crop plants using proteomics-Current achievements and perspectives. Proteomics 2013, 13, 1885–1900. [Google Scholar] [CrossRef]
  64. Shahbaz, M.; Abid, A.; Masood, A.; Waraich, E.A. Foliar-applied trehalose modulates growth, mineral nutrition, photosynthetic ability, and oxidative defense system of rice (Oryza sativa L.) under saline stress. J. Plant Nutr. 2017, 40, 584–599. [Google Scholar] [CrossRef]
  65. Rosa, M.; Prado, C.; Podazza, G.; Interdonato, R.; González, J.A.; Hilal, M.; Prado, F.E. Soluble sugars: Metabolism, sensing and abiotic stress: A complex network in the life of plants. Plant Signal. Behav. 2009, 4, 388–393. [Google Scholar] [CrossRef] [PubMed]
  66. Koch, K.E. Carbohydrate-modulated gene expression in plants. Ann. Rev. Plant Physiol. Plant Mol. Biol. 1996, 47, 509–540. [Google Scholar] [CrossRef] [PubMed]
  67. Hoekstra, F.A.; Golovina, E.A.; Buitink, J. Mechanisms of plant desiccation tolerance. Trends Plant Sci. 2001, 6, 431–438. [Google Scholar] [CrossRef]
  68. Hellmann, H.; Funck, D.; Rentsch, D.; Frommer, W.B. Hypersensitivity of an Arabidopsis Sugar Signaling Mutant toward Exogenous Proline Application. Plant Physiol. 2000, 123, 779–789. [Google Scholar] [CrossRef]
  69. Hayat, S.; Hayat, Q.; Alyemeni, M.N.; Wani, A.S.; Pichtel, J.; Ahmad, A. Role of proline under changing environments: A review. Plant Signal. Behav. 2012, 7, 1456–1466. [Google Scholar] [CrossRef]
  70. Bartels, D.; Sunkar, R. Drought and Salt Tolerance in Plants. Crit. Rev. Plant Sci. 2005, 24, 23–58. [Google Scholar] [CrossRef]
  71. Chen, Y.; Zhang, S.; Du, S.; Zhang, X.; Jiang, J.; Wang, G. Analysis of amino acids in the roots of Tamarix ramosissima by application of exogenous potassium (K+) under NaCl Stress. Int. J. Mol. Sci. 2022, 23, 9331. [Google Scholar] [CrossRef] [PubMed]
  72. Lin, Q.; Wang, J.; Gong, J.; Zhang, Z.; Wang, S.; Sun, J.; Li, Q.; Gu, X.; Jiang, J.; Qi, S. The Arabidopsis thaliana trehalose-6-phosphate phosphatase gene AtTPPI improve chilling tolerance through accumulating soluble sugar and JA. Environ. Exp. Bot. 2023, 205, 105117. [Google Scholar] [CrossRef]
  73. Lin, Q.; Wang, S.; Dao, Y.; Wang, J.; Wang, K. Arabidopsis thaliana trehalose-6-phosphate phosphatase gene TPPI enhances drought tolerance by regulating stomatal apertures. J. Exp. Bot. 2020, 71, 4285–4297. [Google Scholar] [CrossRef] [PubMed]
  74. Li, F.; Xiong, X.S.; Yang, Y.Y.; Wang, J.J.; Wang, M.M.; Tang, J.W.; Liu, Q.H.; Wang, L.; Gu, B. Effects of NaCl Concentrations on Growth Patterns, Phenotypes Associated with Virulence, and Energy Metabolism in Escherichia coli BW25113. Front. Microbiol. 2021, 12, 705326. [Google Scholar] [CrossRef]
  75. Kosar, F.; Akram, N.A.; Ashraf, M.; Ahmad, A.; Alyemeni, M.N.; Ahmad, P. Impact of exogenously applied trehalose on leaf biochemistry, achene yield and oil composition of sunflower under drought stress. Physiol. Plant. 2021, 172, 317–333. [Google Scholar] [CrossRef]
  76. Kosar, F.; Akram, N.A.; Sadiq, M.; Al-Qurainy, F.; Ashraf, M. Trehalose: A Key Organic Osmolyte Effectively Involved in Plant Abiotic Stress Tolerance. J. Plant Growth Regul. 2019, 38, 606–618. [Google Scholar] [CrossRef]
  77. Joshi, R.; Sahoo, K.K.; Singh, A.K.; Anwar, K.; Pundir, P.; Gautam, R.K.; Krishnamurthy, S.L.; Sopory, S.K.; Pareek, A.; Singla-Pareek, S.L. Enhancing trehalose biosynthesis improves yield potential in marker-free transgenic rice under drought, saline, and sodic conditions. J. Exp. Bot. 2020, 71, 653–668. [Google Scholar] [CrossRef]
  78. Garg, A.K.; Kim, J.K.; Owens, T.G.; Ranwala, A.P.; Choi, Y.D.; Kochian, L.V.; Wu, R.J. Trehalose accumulation in rice plants confers high tolerance levels to different abiotic stresses. Proc. Natl. Acad. Sci. USA 2002, 99, 15898–15903. [Google Scholar] [CrossRef] [PubMed]
  79. Fernandez, O.; Béthencourt, L.; Quero, A.; Sangwan, R.S.; Clément, C. Trehalose and plant stress responses: Friend or foe? Trends Plant Sci. 2010, 15, 409–417. [Google Scholar] [CrossRef]
  80. Lunn, J.E.; Feil, R.; Hendriks, J.H.; Gibon, Y.; Morcuende, R.; Osuna, D.; Scheible, W.R.; Carillo, P.; Hajirezaei, M.R.; Stitt, M. Sugar-induced increases in trehalose 6-phosphate are correlated with redox activation of ADPglucose pyrophosphorylase and higher rates of starch synthesis in Arabidopsis thaliana. Biochem. J. 2006, 397, 139–148. [Google Scholar] [CrossRef]
  81. Redillas, M.C.F.R.; Park, S.; Lee, J.W.; Kim, Y.S.; Jeong, J.S.; Jung, H.; Bang, S.W.; Hahn, T.; Kim, J. Accumulation of trehalose increases soluble sugar contents in rice plants conferring tolerance to drought and salt stress. Plant Biotechnol. Rep. 2012, 6, 89–96. [Google Scholar] [CrossRef]
  82. Tekdal, D. Characterization of trehalose-6-phosphate synthase and Na+/H+ antiporter genes in Vuralia turcica and expression analysis under salt and cadmium stresses. An. Acad. Bras. Cienc. 2021, 93, e20200252. [Google Scholar] [CrossRef] [PubMed]
  83. Li, H.W.; Zang, B.S.; Deng, X.W.; Wang, X.P. Overexpression of the trehalose-6-phosphate synthase gene OsTPS1 enhances abiotic stress tolerance in rice. Planta 2011, 234, 1007–1018. [Google Scholar] [CrossRef] [PubMed]
Figure 1. Changes in Trehalose 6-phosphate and Trehalose content. (The log2 fold-change in Trehalose 6-phosphate and Trehalose contents in the roots of T. ramosissima under NaCl stress with the application of exogenous K+ for 48 h and 168 h; Note: p ≤ 0.001 is marked as ***).
Forests 15 01905 g001
Figure 2. Changes in soluble sugar content under different treatments. (Changes in the soluble sugar content of T. ramosissima roots in response to exogenous K+ during 48 h and 168 h of NaCl exposure). Note: 0.01 < p < 0.05 is marked as *.
Forests 15 01905 g002
Figure 3. The starch and sucrose metabolism pathway analysis focused on the annotated differentially expressed genes (DEGs) and metabolites in T. ramosissima roots under NaCl stress with exogenous potassium (K+) applied at 0 h, 48 h, and 168 h. DEGs and differential metabolites involved in this pathway were identified. Note: blue boxes indicate DEGs linked to metabolic pathways that regulate the metabolism of various metabolites; : accumulation of differential metabolites; : degradation of differential metabolites; black genes in the box: decrease in the expression levels of DEGs; red genes in the box: increase in the expression levels of differentially expressed genes.
Forests 15 01905 g003aForests 15 01905 g003b
Figure 4. Correlation analysis between differential metabolites and their associated DEGs in the starch and sucrose metabolism pathway. (DEGs and associated differential metabolites in the starch and sucrose metabolism pathway of T. ramosissima roots under NaCl stress at 48 h and 168 h, based on Pearson correlation. Note: p ≥ 0.05 is not marked; 0.01 < p < 0.05 is marked as *; 0.001 < p < 0.01 is marked as **; p ≤ 0.001 is marked as ***).
Forests 15 01905 g004
Table 1. Physicochemical properties of proteins related to trehalose genes.
Gene IDORF/aaMolecular WeightTheoretical pIGRAVYInstability IndexAliphatic IndexSubcellular Localization
Unigene0078133889840.144.85−0.3928.990.68Cytoplasmic
Unigene009167347252,709.656.04−0.3932.3780.13Cytoplasmic
Unigene0010527566194.844.36−0.4537.2381.61Cytoplasmic
Unigene004977118420,316.594.36−0.2739.9177.88Cytoplasmic
Unigene002195940544,766.249.07−0.3641.2172.74Cytoplasmic
Unigene004976666275,539.646.8−0.2343.3986.40Cytoplasmic
Unigene000162285896,748.925.93−0.1744.6791.89Cytoplasmic
Unigene009505333638,567.167.27−0.3745.1486.46Cytoplasmic
Unigene000834086598,034.225.99−0.2245.2289.87Cytoplasmic
Unigene001574684395,638.475.85−0.1845.5687.60Cytoplasmic
Unigene001574785697,310.286.13−0.2446.0587.63Cytoplasmic
Unigene001491738443,234.508.86−0.4847.279.95Cytoplasmic
Unigene007439136941,510.608.61−0.4247.5373.96Cytoplasmic
Unigene001052641346,173.916.18−0.1647.5789.42Cytoplasmic
Unigene008094635339,269.076.11−0.2147.7285.30Cytoplasmic
Unigene000816685796,801.286.11−0.1548.5592.57Cytoplasmic
Unigene004239076186,768.746.11−0.2249.3192.44Cytoplasmic
Unigene000028875385,842.196.18−0.2549.3986.83Cytoplasmic
Unigene002594337042,442.608.99−0.4649.5277.46Cytoplasmic
Note: ORF: Open reading frame; GRAVY: Grand average of hydropathicity.
Disclaimer/Publisher’s Note: The statements, opinions and data contained in all publications are solely those of the individual author(s) and contributor(s) and not of MDPI and/or the editor(s). MDPI and/or the editor(s) disclaim responsibility for any injury to people or property resulting from any ideas, methods, instructions or products referred to in the content.

