Article

Potential Global Distribution and Habitat Shift of Prunus subg. Amygdalus Under Current and Future Climate Change

1
Shaanxi Key Laboratory of Ecological Restoration in Northern Shaanxi Mining Area, College of Life Science, Yulin University, Yulin 719000, China
2
Shaanxi Hygrogeology Engineering Geology and Environment Geology Survey Center, Shaanxi Institute of Geological Survey, Xi’an 710000, China
3
Research Institute of Subtropical Forestry, Chinese Academy of Forestry Hangzhou, Hangzhou 311400, China
*
Authors to whom correspondence should be addressed.
These authors contributed equally to this work.
Forests 2024, 15(11), 1848; https://doi.org/10.3390/f15111848
Submission received: 28 September 2024 / Revised: 18 October 2024 / Accepted: 20 October 2024 / Published: 23 October 2024
(This article belongs to the Section Forest Meteorology and Climate Change)

Abstract

:
The genus of Prunus subg. Amygdalus are endangered Tertiary-relict plants that are an essential source of woody plant oil. In order to provide a theoretical basis for better protection and utilization of species in the Prunus subg. Amygdalus. This study collected global distribution information for six species within the Prunus subg. Amygdalus, along with data on 29 environmental and climatic factors. The Maximum Entropy (MaxEnt) model was used to simulate the globally suitable distribution areas for these species within the subgenus. The suitable results showed that the area under the test curve (AUC) values of the simulation results were more than 0.8, indicating that the simulation results have high accuracy. Temperature, precipitation, UV-B, and altitude were critical environmental factors affecting the distribution of each species in Prunus subg. Amygdalus. Currently, the distribution area of six species in this genus, from largest to smallest, is Prunus triloba (Lindl.) Ricker, Prunus tenella Batsch, Prunus amygdalus Batsch, Prunus pedunculata Maxim, Prunus mongolica Maxim and Prunus tangutica (Batal.) Korsh. The simulation results of distribution areas showed that under the ssp2.45 and ssp5.85 scenarios, the potential distribution areas of P. amygdalus, P. tangutica, and P. pedunculata all show a decreasing trend, while the distribution areas of P. mongolica and P. tenella, and P. triloba exhibit an increasing trend. The general distribution of P. amygdalus, P. mongolica, and P. tenella will trend to transfer in a northwest direction. P. tangutica and P. pedunculata were affected by other environmental factors (such as slope, altitude, and soil pH), and the distribution area has a tendency to move northeastward. The P. triloba moved to the southwest. The spatiotemporal distribution patterns of Prunus subg. Amygdalus can be used as a reference for forest management and to formulate species conservation strategies.

1. Introduction

The correlation between climate change and vegetation is a prominent subject of study in the field of biology [1]. According to the Sixth Assessment Report of the Intergovernmental Panel on Climate Change (IPCC), the global average surface temperature increased by 0.85 °C (0.65–1.06 °C) from 1880 to 2012, and the average surface temperature is predicted to continue to rise in the future [2]. Future climate change will have a significant impact on the distribution of species, posing problems for both biodiversity conservation and human adaptation [3]. As climate change progresses, vegetation adjusts to the changing conditions by migrating to more suitable habitats [4]. In the future, as the climate continues to warm, certain plant species will migrate towards locations with higher latitudes or higher altitudes [5,6], for example, Codonopsis pilosula (Franch.) Nannf. and Pinus massoniana Lamb. Studying different scenarios of future climate change, analyzing the impact of factors that influence climate change on vegetation distribution, and predicting the geographical distribution of suitable vegetation habitats are essential to protecting plant diversity and conserving endangered species [7].
The genus Prunus subg. Amygdalus belongs to the subfamily Prunoideae in the Rosaceae. Six species are classified in this subgenus, comprising Prunus amygdalus Batsch, Prunus tenella Batsch, Prunus mongolica Maxim, Prunus tangutica (Batal.) Korsh, Prunus pedunculata Maxim, and Prunus triloba (Lindl.) Ricker [8]. Previous studies on Prunus subg. Amygdalus has focused on phylogeny, nutritional value, and species conservation [8,9,10]. P. amygdalus is the only cultivated species of this subgenus, which has high nutritional value and numerous pharmacological properties and is a popular dry fruit and woody oil tree grown worldwide [9]. In addition, almonds have good drought and cold resistance and have medicinal and nutritional value. Among them, P. amygdalus is mainly distributed on arid slopes of Central Asia, West Asia, Mediterranean coastal areas, North America, and Australia [10]. P. tenella is a rare relict species of Tertiary deciduous forest in ancient Central Asia, an endangered species on the Mongolian Plateau, and is a xerophytic deciduous shrub in the Gobi desert area of Central Asia of medicinal and ecological importance [11]. P. tangutica is a light-loving species that is strongly tolerant to cold and drought and is mainly distributed in southern Gansu and northwestern Sichuan in China [12]. P. tangutica is the only species of Prunus subg. Amygdalus distributed on the margin of the Qinghai–Tibet Plateau [9] P. pedunculata is a rare and endangered species endemic to the temperate steppe region of China and is a woody oil tree species of ecological and economic importance [13]. P. triloba is a deciduous tall shrub or small tree, which is a famous traditional flower in the world [9]. P. mongolica is a kind of strong xerophytic shrub in the desert area of Central Asia. It has the function of wind prevention, sand fixation, soil and water conservation, and its seed oil can be used as medicine [9]. Therefore, this genus is as important species in arid regions, predicting the suitable distribution areas of this genus is of great significance for its conservation, as well as for its application in ecological management of arid regions and enhancing ecological stability in arid areas.
Species distribution models (SDMs) have been widely used to study the impact of climate change on the potential distribution of species and to predict the migration of suitable habitats for species under different climate change projections [14]. To date, the generalized additive model (GAM) [15], domain model [16], bioclimatic model (BIOCLIM) [17], niche factor analysis model (ENFA) [18], and maximum entropy model (MaxEnt) have been commonly used for niche analysis [19]. The MaxEnt model uses a machine-learning algorithm and typically produces the accurate fitting predictions of distribution models, has broad application, and is simple to operate [5,6,9]. Specifically, MaxEnt is used to predict the presence and absence of species by interpolating identified relationships between collection data [20]. All ecological niche models (or species distribution models) use distribution and environmental data [21].
The field survey found that the growth of the Chinese endemic species P. tangutica has been greatly damaged, and there is fragmentation in the distribution area. At the same time, the P. pedunculata, an important economic plant, has been affected by human activities. As a desert plant, P. mongolica may be better adapted to arid climates. It is hypothesized that Prunus subg. Amygdalus may find more suitable conditions for survival as the average temperature increases and anthropogenic impacts intensify in the future. The suitable habitat of P. mongolica may expand and migrate to more arid areas in the northwest direction. Under the influence of climate and human activities, P. tangutica and P. pedunculata will continue to decrease. Using the optimized MaxEnt model, we have, respectively, predicted the potential global distribution and geographic changes of six species within the Prunus subg. Amygdalus, including Prunus amygdalus Batsch, Prunus tenella Batsch, Prunus mongolica Maxim, Prunus tangutica (Batal.) Korsh, Prunus pedunculata Maxim, and Prunus triloba (Lindl.). The aims of the study were (1) to predict the future distribution range and area of the six species of Prunus subg. Amygdalus, (2) to determine the critical environmental factors that affect the distribution of Prunus subg. Amygdalus species, and (3) to determine the habitat shift of the core distribution area of Prunus subg. Amygdalus species. The results of these analyses are intended to provide a scientific basis for introductory cultivation strategies and for the conservation of subsistence habitats for Prunus subg. Amygdalus.

2. Methods

This study follows the methodology of data acquisition, data processing, model optimization, model operation, species geographic distribution, suitable habitat change, and centroid analysis. The specific research workflow is presented in Figure S1.

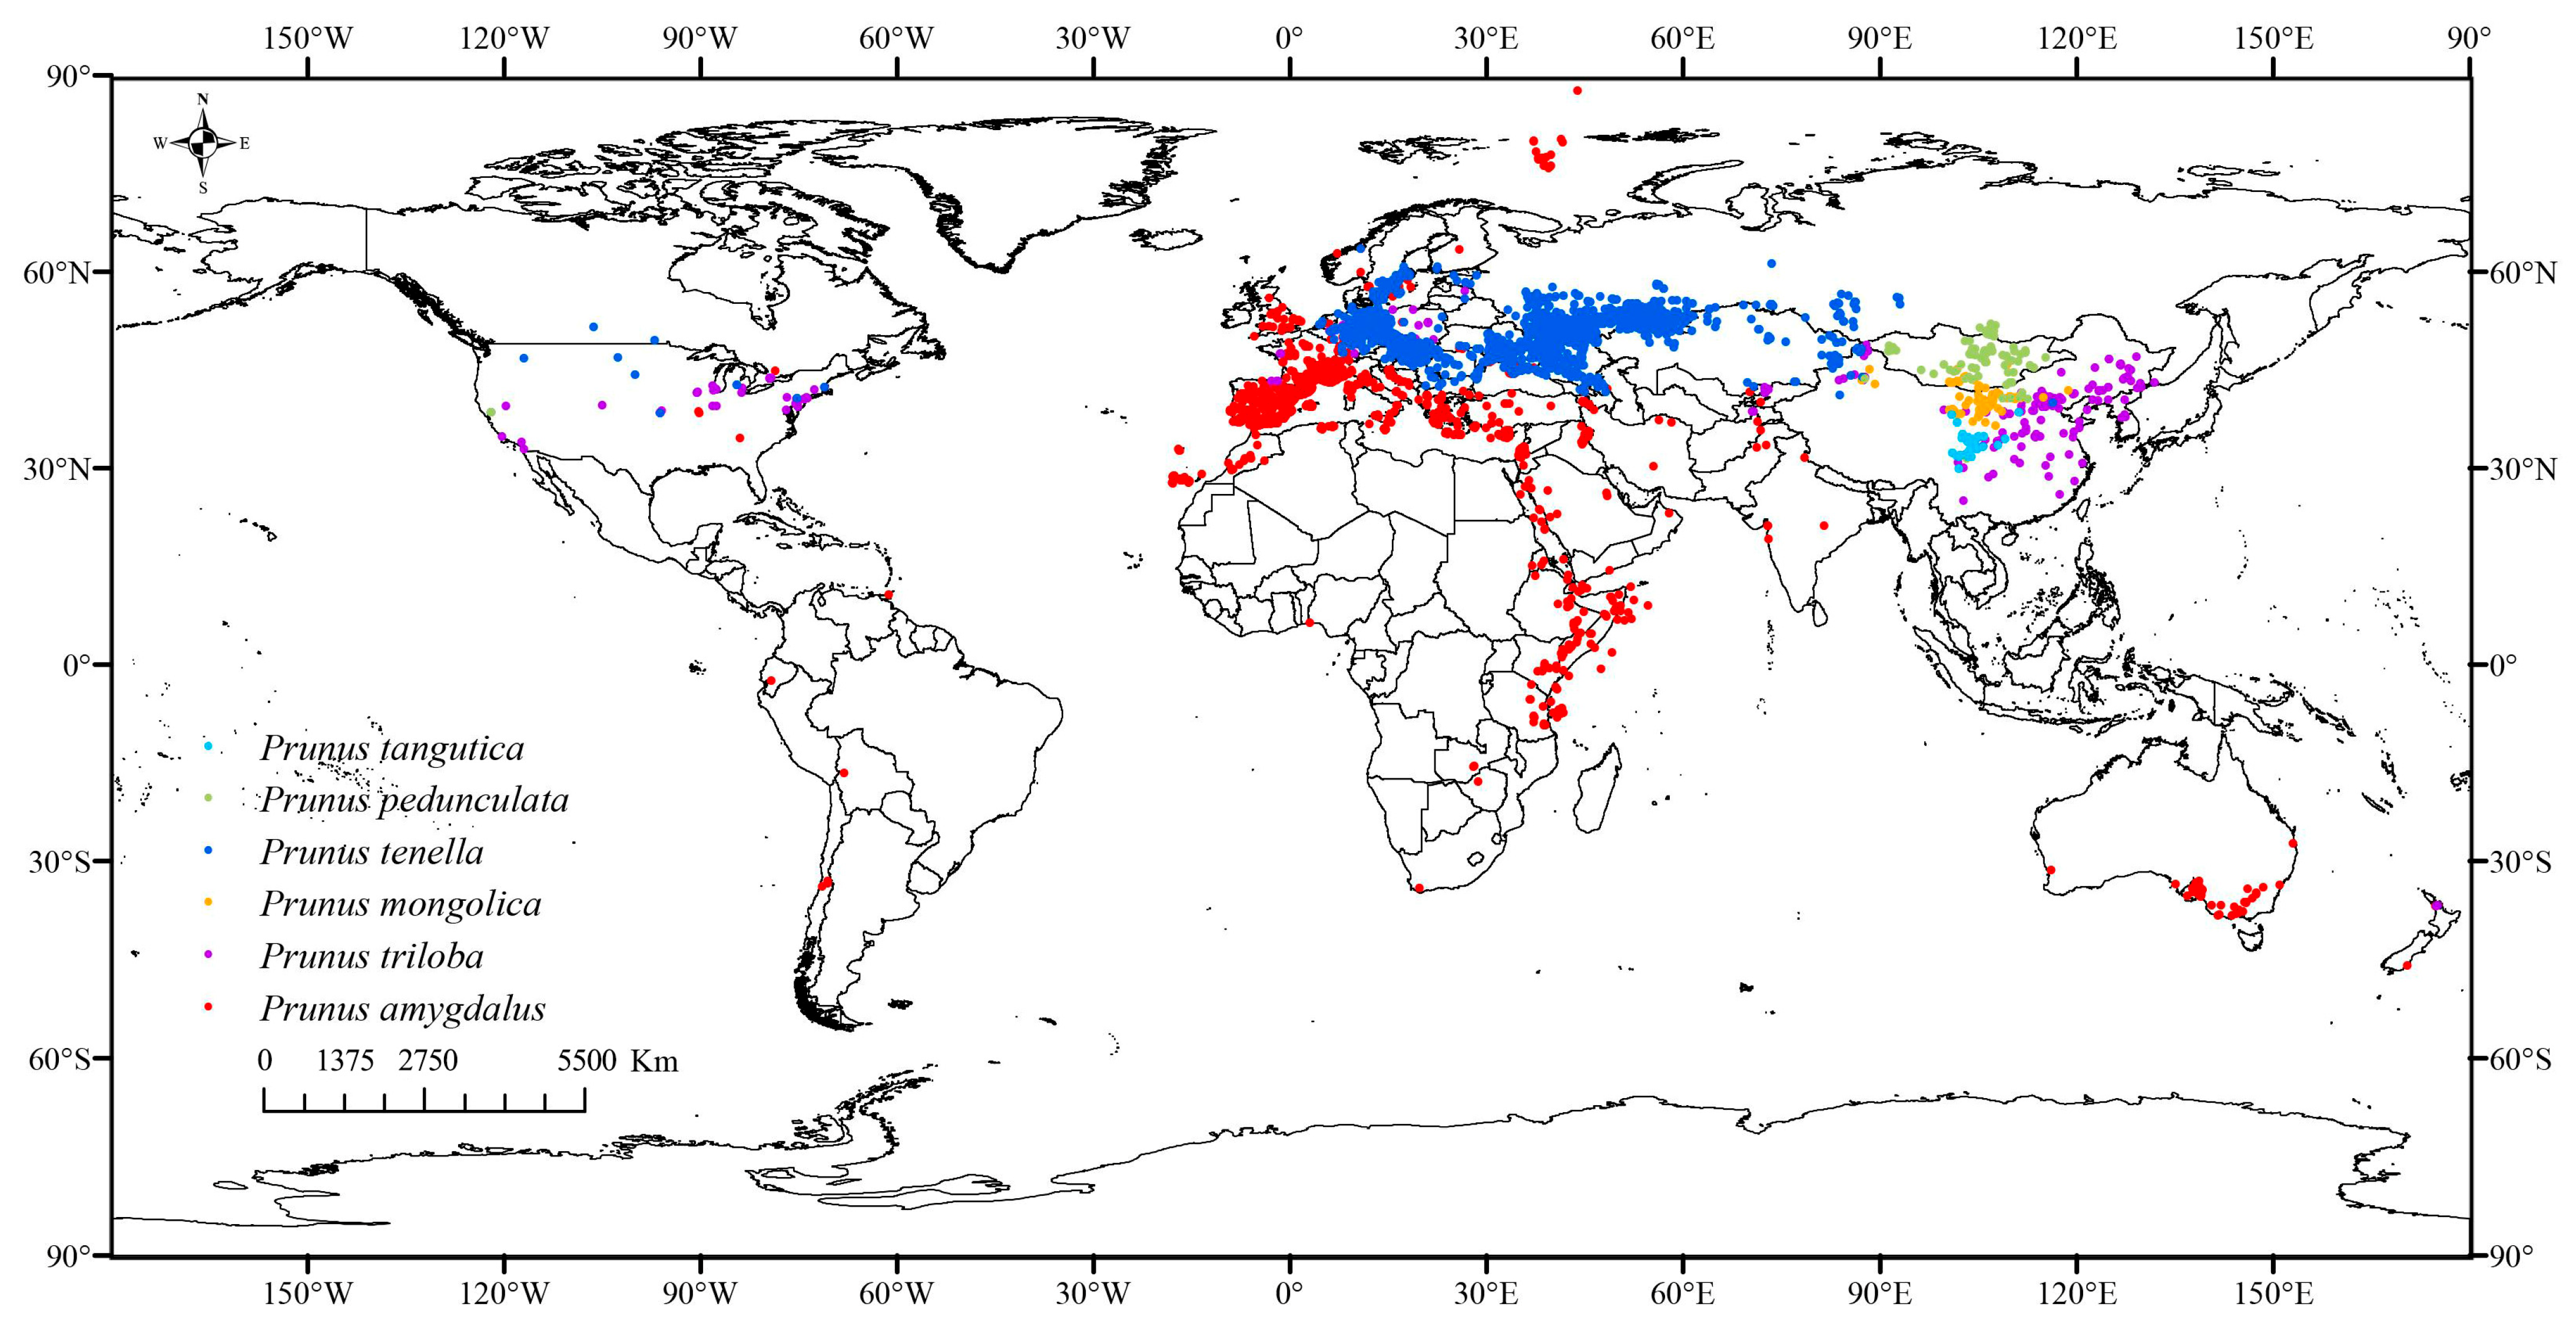
2.1. Species Occurrence Information

The geographic distribution information of six Prunus subg. Amygdalus species were collected through a field survey conducted by our research group, relevant literature, and the Global Biodiversity Information Facility (GBIF: https://www.gbif.org, accessed on 17 July 2024, Tables S1 and S2) [6]. Occurrence records without precise geographical information were excluded. After removing uncertain loci, to avoid overfitting, ENMTools v1.3 (https://www.example.com/enmtools, accessed on 20 July 2024) was used to retain only one occurrence record for each 5 × 5 km grid [22]. Finally, 6076 natural occurrence records of six Prunus subg. Amygdalus species were selected for modeling using the MaxEnt model (Figure 1), including 3205 Prunus amygdalus Batsch distribution sites, 2399 Prunus tenella Batsch distribution sites, 104 Prunus pedunculata Maxim distribution sites, 94 Prunus mongolica Maxim distribution sites, 46 Prunus tangutica (Batal.) Korsh distribution sites and 274 Prunus triloba (Lindl.) Ricker distribution sites.

2.2. Environmental Parameters

A total of 4 soil variables were obtained from the Harmonized World Soil Database (HWSD, https://www.fao.org/soils-portal/en/, accessed on 17 July 2024, Table 1). A total of 4 global UVB radiation (UVB1–4) variables were obtained from the gIUV database (a global UV-B radiation data set for macroecological studies) (http://www.ufz.de/gluv/, accessed on 17 July 2024, Table 1). Three terrain factors and 19 bioclimatic variables (BIO1–BIO19) were obtained from the WorldClim global climate database (version 2.1, with a spatial resolution of 2.5 min, accessible at http://www.worldclim.org/, accessed on 17 July 2024, Table 1) [23]. The currently available climate data spans from the 1970s and 2000s. The future climate data were derived from two time periods: the 2050s (2041–2060s) and the 2070s (2061–2080s). Future data utilized the second-generation National Climate Center’s Medium-Resolution Climate System Model (BCC-CSM2-MR). Future climate data were adopted from the Sixth Coupled Model Intercomparison Project (CMIP6), including two socio-economic pathways, namely ssp2.45 and ssp5.85. These pathways represent moderate and maximum emission scenarios for greenhouse gas emissions, respectively.
In species distribution modeling (SDM), the multicollinearity among environmental variables can lead to model overfitting, reducing the precision of prediction outcomes [24]. To address this, a Spearman rank correlation analysis was conducted to examine the interrelationships among variables using R 3.6.3 (Figure S2). The contribution analysis of 29 variables was determined using the Jackknife test method in MaxEnt 3.4.4 software [25]. Finally, for each pair of correlated variables (r > |0.7|), only one variable with a large contribution was retained [26].

2.3. Calibration, Construction, and Evaluation of the MaxEnt Model

The default settings in MaxEnt often lead to overfitting and are usually not the most optimal configuration [20]. The ENMeval package in R version 3.6.3 was utilized to optimize and fine-tune the MaxEnt model [27]. The optimization process involved testing eight different values of the regularization multiplier (RM), ranging from 0.1 to 4, and six types of feature combinations (FC), including L, LQ, LQH, H, LQHP, and LQHPT, where L stands for linear, H for hinge, Q for quadratic, P for product, and T for threshold. These were cross-combined in a comprehensive evaluation. The ENMeval package was employed to test the 48 resulting combinations, selecting the optimal parameter combination based on the lowest delta Akaike Information Criterion (delta_AICc = 0), after multiple combinations and screenings, the related settings can be viewed in Table S3.
Input geographical distribution points and environmental variables into MaxEnt 3.4.4 for modeling. A total of 75% of the data were designated for model training and 25% of the dataset was set aside for model testing. The maximum number of iterations was set to 500, and the maximum background point number was set to 10,000, with 10 repetitions [25].
The Receiver Operating Characteristic Curve (ROC)’s Area Under the test Curve (AUC) was used to evaluate the accuracy of the model results [28]. The test AUC value is independent of threshold values in the model and ranges from 0 to 1, where 0 to 0.6 indicates poor predictive performance, 0.7 to 0.8 represents fair predictive performance, 0.8 to 0.9 indicates good predictive performance, and 0.9 to 1.0 represents excellent predictive performance. Generally, the closer the value is to 1, the better the model fits the data [29].

2.4. Geospatial Analysis

The suitable areas for each period were simulated using ArcGIS 10.4. The “Reclass” function was used to reclassify the suitable habitat of six species with the natural segment method. The habitat was divided into four grades based on the assessing probabilities method in the IPCC report using the suitability index p as the basis, including unsuitable (p < 0.05), low suitable (0.05 ≤ p < 0.33), medium suitable (0.33 ≤ p < 0.66) and high suitable (p ≥ 0.66) [2]. The different suitability zones were calculated using the Grid Calculation tool in ArcGIS 10.4.
In order to illustrate the temporal and spatial evolution route of the six species in Prunus subg. Amygdalus, we have performed the analysis of the displacement of the geometric center of the potential distribution range using the Centroid Changes (Lines) tool [30].

3. Results

3.1. Model Evaluations

Based on the results of correlation analysis and contribution analysis, variables (Table 2) were ultimately selected for predicting the potential geographic distribution of six Prunus subg. Amygdalus species. The MaxEnt model successfully predicted and evaluated the potential distribution areas of six species in Prunus subg. Amygdalus. The mean AUC value of Prunus amygdalus Batsch, Prunus tenella Batsch, Prunus Pedunculata Maxim, Prunus Mongolica Maxim, Prunus Tangutica (Batal.) Korsh, and Prunus triloba (Lindl.) Ricker was 0.895, 0.914, 0.980, 0.988, 0.997, and 0.951, respectively (Figure S3), indicating that the simulation results were excellent and reliable.

3.2. Important Environmental Variables Preference

The percentage contribution showed that UVB-4 (mean UV-B of the lowest month), Bio19 (precipitation of the coldest quarter), and Bio1 (annual mean temperature) are the top three environmental variables in the six species of Prunus subg. Amygdalus (Table 2). In the P. amygdalus species, Bio6 (Min temperature of coldest month), Bio19, and UVB-4 are the top three environmental variables, and the cumulative contribution was 61.4% of the total variation. In the P. tenella species, sort the top three variables according to the contribution, which are Bio14 (Precipitation of driest month, 38.4%), Bio11 (Mean temperature of coldest quarter, 30.1%), UVB-4 (15.4%) in orders. In the P. pedunculata species, UVB-4, Bio19, and DEM (Digital Elevation Model) are the top three variables that contributed to 41.3%, 19.8%, and 13.2%, respectively. In the P. mongolica species, the top three environmental variables are Bio19, Bio4, and DEM and their proportions are 36.3%, 26.7%, and 26.4%, respectively. In the P. tangutica species, the three top variables for model construction are DEM (36.9%) > Bio18 (24.0%) > Bio9 (20.3%). In the P. pedunculata species, Bio4 (Temperature seasonality), Bio15 (Precipitation seasonality), and Bio19 are the top three variables that contributed to 23.1%, 18.7%, and 13.9%, respectively. In the P. triloba species, the variables that occupy the top three are Bio1, Bio18, and Bio19, which, respectively explain the contributed 59.9%, 15.9%, and 11.6%.
Based on the response curve, the logistics prediction for the main environmental variables of Prunus subg. Amygdalus specie. The suitable environmental conditions for survival of Prunus subg. Amygdalus were as follows (Figures S4–S9): for P. amygdalus, Bio19 was 0 to 600.7 mm, Bio6 was −15.0 to 16.0 °C, UVB-4 was 0 to 7600.0 J·m−2 day−1, the peak occurred when 230.5 mm, 4.1 °C, and 408.3 J·m−2 day−1, respectively; for P. tenella, Bio14, Bio11 and UVB-4 the peak occurred when 30.5 mm, 4.2 °C, and 218.5 J·m−2 day−1, respectively; for P. pedunculata, UVB-4, Bio19 and DEM the peak occurred when 200.5 J·m−2 day−1, 20.2 mm, and 1400.5 m, respectively; for P. mongolica, Bio19, Bio4, and DEM the peak occurred when 8.2 mm, 1200.0, and 1400.9 m, respectively; for P. tangutica, DEM, Bio18, and Bio9 the peak occurred when 3300.0 m, 370.8 mm, and 1.0 °C, respectively; for P. triloba, Bio1, Bio18, and Bio19 the peak occurred when 12.5 °C, 470.5 mm, and 20.0 mm, respectively.

3.3. Potential Distribution Areas Under Current Climate

The simulation results of the current potential distribution areas of the Prunus subg. Amygdalus showed that six species occupied different habitats, with P. triloba having the largest distribution area, followed by P. amygdalus, P. tenella, P. pedunculata, P. mongolica, and P. tangutica (Table 3).
The current total potential distribution area for P. amygdalus was 22.16 × 10⁶ km2, with high suitable habitat accounting for 17.24% (3.82 × 10⁶ km2) (Table 3). Currently, P. amygdalus is mainly located in Central Asia and northwestern Europe, including the Russian Federation, Ukraine, Sweden, Kazakhstan, Austria, Hungary, Czech Republic, Latvia, Romania, Germany, and China, and some habitats situated in southern Canada and the Northern United States (Figure 2a).
The potentially suitable area of P. tenella was 18.56 × 10⁶ km2 (Table 3), which was primarily distributed in northwestern Europe and East Asia (Figure 2b). The suitable habitats for P. tenella were also slightly distributed in North America.
The suitable habitat areas for P. pedunculata are currently located in Central and East Asia, including the southern Russian Federation, Mongolia, and northwestern China (Figure 2c). The total suitable area for P. pedunculata was 5.62 × 10⁶ km2, and the highly suitable area was 1.33 × 10⁶ km2.
Currently, the highly suitable habitat areas of P. mongolica are distributed in China and Mongolia (Figure 2d), while P. tangutica only has branches in northern China (Figure 2e). The total and high potential distribution areas for P. mongolica and P. tangutica were 3.77 × 10⁶ km2 and 0.82 × 10⁶ km2, 1.52 × 10⁶ km2 and 0.16 × 10⁶ km2, respectively.
P. triloba currently suitable habitat areas were mainly situated in western Europe, East Asia, and parts of North America (Figure 2f). The total suitable habitats for P. triloba were 24.95 × 10⁶ km2. The highly suitable area, moderately suitable area, and poorly suitable area were 2.05 × 10⁶ km2, 7.34 × 10⁶ km2, and 15.56 × 10⁶ km2, which account for 8.22%, 29.41%, and 62.37% of the total habitat, respectively.

3.4. Changes in the Suitable Habitat Areas of Prunus subg. Amygdalu in the Future

These are quite interesting and the results of climatic change affect the potential distribution for Prunus subg. Amygdalus in the future (2050s and 2070s) under two climate scenarios (ssp2.45 and ssp5.85). The potential distribution areas of Prunus subg. Amygdalus species in the ssp2.45 and ssp5.85 scenarios were very similar.
In P. amygdalus, the main suitable distribution areas were located in northwest Europe, East Asia, and a few habitats scattered in southeast North America, Southern South America, Southern Australia, and the Gulf of Mexico. Under the ssp2.45-2050s climate scenario, the total suitable areas were 32.30 × 10⁶ km2, accounting for 21.56% of the total land area of the world. The highly suitable distribution areas were 3.75 × 10⁶ km2 (Figure 3a1 and Figure 4a1, Table 3). Under the ssp2.45-2070s climate scenario, the total suitable distribution areas decreased by 1.6% compared with the current climate distribution. The highly suitable areas were contracted by 2.10%, but the moderately suitable habitats were increased by 9.69% (Figure 3a2 and Figure 4a2, Table 3). Under the ssp5.85-2050s and ssp5.85-2070s climate scenario, the total suitable distribution areas have been decreasing, but the highly suitable areas have increased by 7.55% (2050s) and 6.31% (2070s) compared to the current, respectively (Figures S10a1,a2 and S11a1,a2, Table 3). Southern South America, southern Australia, and the southwestern United States experienced varying degrees of contraction, new habitable areas appear in the northern Gulf of Mexico.
In P. tenella, the MaxEnt model predicted that the main suitable distribution areas were located in Central Asia and northwestern Europe under the ssp2.45-2050s climate scenario (Figure 3b1 and Figure 4b1, Table 3). The total suitable distribution areas decreased by 1.91% compared with the current climate distribution areas, but the highly suitable areas would expand by 4.03 × 10⁶ km2. Under the ssp2.45-2070s climate scenario, the total suitable habitats seem to be a slight increase compared to 2050s (Figure 3b2 and Figure 4b2, Table 3). Under the ssp5.85-2050s climate scenario, MaxEnt predicted that the suitable distribution areas of P. tenella have a similar tendency with ssp2.45 (Figures S10b1 and S11b1, Table 3). However, the highly and moderately suitable areas were decreased would compare with the current climate of the P. tenella in the ssp5.85-2050s climate scenario (Figures S10b1 and S11b1, Table 3). Contractions have occurred in areas southwest of Hasselkestan, southeast of Hasselkestan, eastern Spain, and parts of Canada, and new suitable areas have appeared in the Gulf of northeastern Canada and northern Pyrenees of France.
In P. pedunculata, MaxEnt predicted that the total suitable distribution areas decreased by 6.38%–13.22% from the current time to 2050s and 2070s of the ssp2.45 and ssp5.85 climatic scenario. The main spatial location for the suitable distribution areas was in Central and East Asia, and northwest China, including southern Russian Federation, Mongolia, Inner Mongolia, northern Shaanxi, northern Ningxia, and parts of Hebei, and Central America have small distribution areas (Figure 3c1,c2, Figure 4c1,c2, Figures S10c1,c2 and S11 c1,c2, Table 3). In the eastern edge of the Krakum Desert in Central Asia, there is a large shrinkage from Shuanghe to Altai in Xinjiang, Harbin in Northeast China, and other places in Central America, while new suitable areas appear in Aksu in Xinjiang and Alxa in Inner Mongolia.
In P. mongolica, the main suitable distribution areas were located in East Asia and southern Mongolia, including Inner Mongolia, Xinjiang, northern Gansu, northern Ningxia, and parts of Hebei under the ssp2.45-2050s climate scenario. In P. pedunculata, MaxEnt predicted that the total suitable distribution areas were increased by 21.65%–32.65% from current to 2050s and 2070s of the ssp2.45 and ssp5.85 climatic scenario (Figure 3d1,d2, Figure 4d1,d2, Figures S10d1,d2 and S11d1,d2, Table 3). There are significant contractions in Kashgar to Aksu in Xinjiang, Haimun in Qinghai, and Tongliao in Inner Mongolia, China, while new suitable areas appear in southern Russia and northern Canada.
In P. tangutica, the simulation results showed that the suitable distribution areas were mainly distributed in central China. Under the ssp2.45-2050s and ssp5.85-2050s climate scenario, the total suitable areas were increased by 7.17% and 4.37% compared with the current climate distribution. In the ssp2.45-2070s and ssp5.85-2070s climate scenario, the total suitable areas were decreased compared with the current time and the suitable areas were decreased by 10.22% and 4.47% (Figure 3e1,e2, Figure 4e1,e2, Figures S10e1,e2 and S11e1,e2, Table 3).
P. triloba is an important horticultural plant in the Prunus subg. Amygdalus, the MaxEnt simulation results showed that the suitable distribution areas were located in Western Europe, East Asia, parts of North America, and parts of China in the future. MaxEnt predicted that the total suitable distribution areas would increase 13.42%–27.40% from the current time to 2050s and 2070s of the ssp2.45 and ssp5.85 climatic scenario. Contractions have occurred in western and southeastern Russia and northeastern Spain, while new habitats have emerged in North America, southern South America, and eastern Kazakhstan (Figure 3f1,f2, Figure 4f1,f2, Figures S10f1,f2 and S11f1,f2, Table 3).

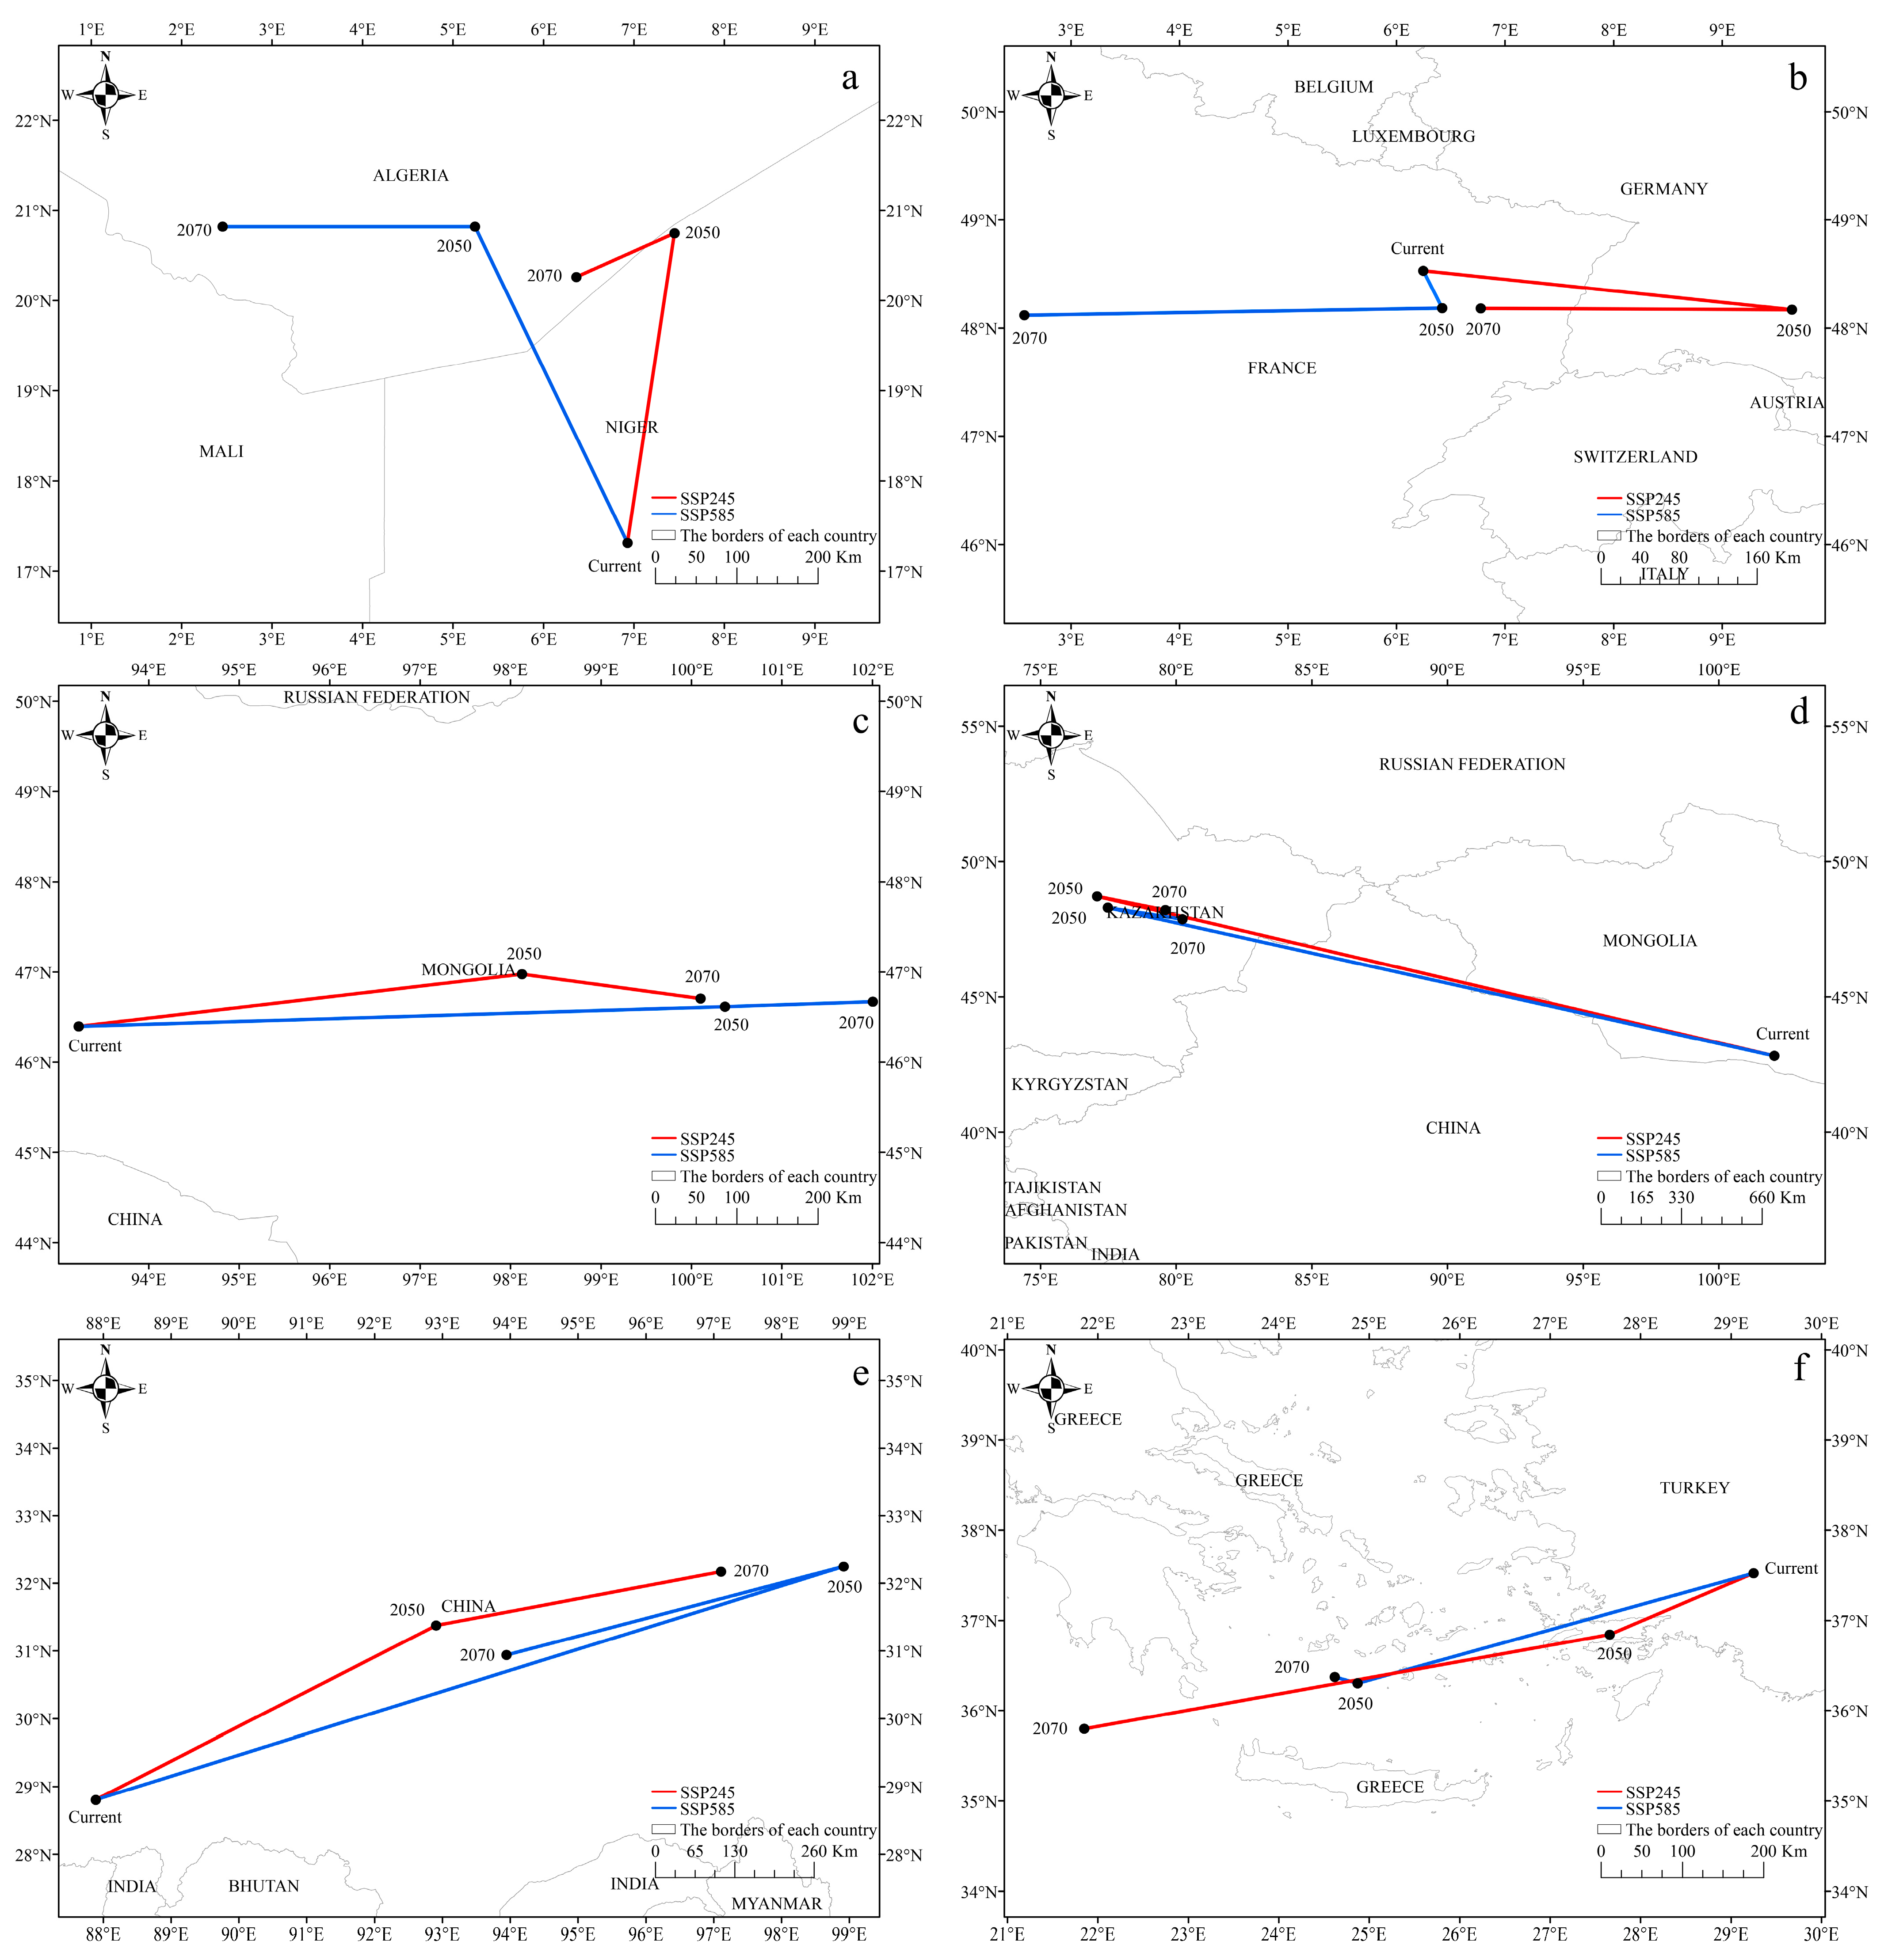
3.5. The Spatial Shift of Potential Habitats Centroid in the Future

The results of the spatial shift of geographical coordinates in Prunus subg. Amygdalus showed that six species have different moving trends in the future (Figure 5, Table S4). The distribution center of P. amygdalus were currently located in central Tchirozerine, Agadez, Niger (6°54′5.447″ E, 17°18′5.094″ N). With the passage of time, in the four carbon emission scenarios, the center of gravity in the suitable distribution area gradually shifted to the northwest area (Figure 5a). The center of gravity has shifted to southern Algeria (Figure 5a, Table S4). The distribution center of P. tenella was currently located in Lorraine, France (6°6′9.475″ E, 48°33′0.443″ N), and the center of gravity distribution gradually shifted towards the western area, but it was still in the center of France in the future (Figure 5b, Table S4). Currently, the distribution center of P. pedunculata is located in Sakya County, Shigatse City, Tibet Autonomous Region, China (87°54′4.435″ E, 28°48′4.370″ N), and the area from Garze in Sichuan Province to Yushu in Qinghai Province is the main distribution area in the future (Figure 5c, Table S4). The current distribution center of P. mongolica is located in Jinta County, Jiuquan, Gansu Province, China (110°2′28.374″ E, 40°33′8.374″ N), and it will move northwestward to eastern Kazakhstan in the future (Figure 5d, Table S4). The distribution center of P. tangutica was slightly shifted, and the current centroid was located in Tsetsegnuur, Khovd, Mongolia (93°27′7.578″ E, 46°24′43.247″ N), and the centroid might shift farther northeastward under four scenarios in the future (Figure 5e, Table S4). The current distribution center of P. triloba was located in Denizli, Türkiye (29°6′9.058″ E, 37°36′36.907″ N). In the future, the four scenarios shifted to the Southwest direction in different degrees, and the center of gravity shifted to Greece (Figure 5f, Table S4).

4. Discussion

The geographical distribution of plants is mainly controlled by climatic variables [31] The genus Prunus subg. Amygdalus grows in high-latitude areas, the environment is generally characterized by low temperature, drought, high heat (in summer), high light intensity, and other stress factors. Although, Prunus subg. Amygdalus species has cold tolerance and drought tolerance, environmental factors change still has an impact on its distribution [32]. Therefore, in this study, the distribution of 6 species of Prunus subg. Amygdalus was simulated based on MaxEnt model and discussed the dominant environmental factors affecting Prunus subg. Amygdalus species and its potential suitable habitats using the model. The high AUC values indicated that our simulation results have high accuracy. Meanwhile, it showed that MaxEnt maintains high accuracy when dealing with limited geographical distribution information [24,33].

4.1. Environmental Effecting

In this study, we found that ultraviolet, precipitation, and temperature are the main environmental factors affecting the geographical distribution of Prunus subg. Amygdalus species. These results are consistent with previous studies of alpine plants indicating that ultraviolet, precipitation, and temperature are the main environmental factors affecting the habitat and existence probability of alpine plants, such as Larix griffithiana J. D. Hooker, L. speciosa W. C. Cheng & Y. W. Law, and Abies delavayi Diels [34,35].
The six Prunus subg. Amygdalus species exhibited responses to the environmental factors in varying degrees. Based on our prediction results, precipitation in the coldest season (bio 19), min temperature of the coldest month (bio 6), and mean UV-B of the lowest month (UVB-4) made the greatest contributions to Prunus amygdalus Batsch and the pooled contribution rate of these three was 61.4%. Similarly, environmental factors with greater impact on the Prunus tenella Batsch, Prunus mongolica Maxim, Prunus tangutica (Batal.) Korsh, Prunus pedunculata Maxim and Prunus triloba (Lindl.) Ricker, distribution mainly included ultraviolet, precipitation, and temperature. Vegetation distribution is closely linked to precipitation. As an important part of the ecosystem, the vegetation zone is largely influenced by local climatic conditions. Different vegetation zones have different water requirements, and their distribution is closely related to precipitation patterns and precipitation amounts [26]. Precipitation is the main source of water required for the growth of Prunus subg. Amygdalus species [9]. The lack of precipitation limits plants growth rate and plant size. Uneven distribution of precipitation also affects plants [36]. If precipitation is concentrated in certain periods, while other periods are dry with little rain, Prunus subg. Amygdalus plants need to adapt to these phases of water shortages [32]. Most Prunus subg. Amygdalus plants are found in arid regions [9]. This study found that the water contribution rate of P. mongolica, P. pedunculata, and P. tangutica was 43.1%, 42.6%, and 42.8%, respectively, and they were suitable for growing in the regions where the coldest monthly precipitation was 0–25 mm and the warmest monthly precipitation was 0–700 mm. This is consistent with them being a strong perennial dry shrub that grows mainly in deserts, rocky slopes, and dry riverbeds [37]. Hence, precipitation is an important factor affecting the distribution of the Prunus subg. Amygdalus.
Although precipitation has a great influence on the potential geographic variability of the plants. However, the effect of temperature fluctuations on the latitudinal migration of plants is also important [38]. A suitable temperature range is essential for the growth of plants [39]. Excessively high or low temperatures can adversely affect them [32]. Low temperatures may lead to frost damage to plants, affecting their growth and development, especially in areas with colder winters [32]. For example, seedlings and new shoots of P. mongolica may be frostbitten or even killed by extremely low temperatures [40]. High temperatures, on the other hand, may accelerate the evaporation of water from flat peach plants, exposing them to water shortages [41]. At the same time, may also affect photosynthesis and respiration, leading to metabolic imbalances [42]. Studies have shown that in the context of the increasing global greenhouse effect, areas subject to thermal limitation will gradually become more and more restricted if the effects of natural precipitation factors on changes in plant growth areas are not taken into account. Despite the cold tolerance of Prunus subg. Amygdalus, the minimum temperature of the coldest month still has a significant effect on their growth. When the minimum temperature (bio6) is below −15 °C or above 16 °C, normal growth may be affected. The results of this study are in good agreement with those of Duan Yizhong et al. [8].
UV-B radiation is the third environmental factor that affects the distribution of plum trees [43]. Light intensity and light duration have important effects on plant growth and development [44]. Intense light intensifies the transpiration of plant leaves, leading to faster water loss [45]. It has been shown that UV-B radiation has a significant effect on plant above-ground organs, and in order to reduce water evaporation, it causes morphological changes including thickening of leaves, shorter petioles, shorter stems, and increased axillary branching [46,47]. The duration of radiation can also affect plant growth rhythms [48]. For example, changes in radiation duration may affect the flowering time and dormancy period of plants [49]. Such as P. mongolica can improve stress tolerance by having small leaves [41]. In this study, the UV contribution rate of the amygdala, dwarf amygdala, and long petiolar amygdala reached 32.7%, 15.4%, and 41.3%, respectively, and were suitable for growing in the UVB-4 areas of 0–7600.0, 0–1400.0 and 0–2200.0 J/m2/day, respectively. This is consistent with the prediction that these plants are mainly distributed in Xinjiang, Inner Mongolia, and other areas with high radiation intensity [37].
Soil factors and altitude also affect plant distribution. Climatic conditions and soil types may vary at different altitudes [50]. In general, fertile loamy or clay soils may dominate at lower elevations, while poor sandy or stony soils may dominate at higher elevations [51]. Plants of the s Prunus subg. Amygdalus are somewhat adapted to land types, but adaptations vary from species to species. For example, P. pedunculata may be better adapted to soil conditions such as desert edges, while P. tenella may grow on a variety of land types such as grasslands and arid slopes [8]. In this study, the P. mongolica is mainly found between 1000–2400 m above sea level, the P. tangutica is mainly found between 1500–2600 m above sea level and generally grows on loamy, sandy gravelly, and stony soils. Soil pH has a great influence on plants, and high or low pH may affect the effectiveness of nutrients in the soil, thus adversely affecting plant growth [52]. Soil pH is an important environmental factor affecting the habitat of P. tenella, it has a certain ability to resist acid and alkali, can only survive in the pH range of 2–10 range, but grows best in neutral soil with a pH of about 7, and previous studies have shown that the soil microenvironment has an effect on photosynthesis, light saturation point, and stomatal conductance in P. tenella [11].

4.2. Change of the Distribution Areas Under Future Climate Changes

The climatic characteristics of a region are a crucial factor in plant growth regeneration [53]. With climate change, precipitation may decrease, thereby exacerbating drought stress and reducing soil moisture availability, which may lead to the inability of plants to reproduce, grow, and survive [54]. Some scholars predicted that by 2050, the average drought stress of forests will exceed the most severe drought stress experienced in the past 1000 years, indicating that a large number of individual plants may not survive under the predicted future climate [55]. Order to study the effect of climate change on the geographic distribution areas of species in Prunus subg. Amygdalus, we used two greenhouse gas emission scenarios (ssp2.45 and ssp5.85) of the CMIP6 model in the IPPC were selected as the climate variable. The results showed that the distribution area of six species in this genus, from largest to smallest are P. triloba, P. tenella, P. amygdalus, P. pedunculata, P. mongolica, and P. tangutica currently. The simulation results of distribution areas showed that under the ssp2.45 and ssp5.85 scenarios, the potential distribution areas of P. amygdalus, P. tangutica and P. pedunculata all show a decreasing trend, while the distribution areas of P. mongolica and P. tenella, and P. triloba exhibit an increasing trend. The potential distribution areas of Paeonia rockii (S. G. Haw and Lauener) T. Hong and J. J. Li were increased in the future under ssp2.6 and ssp8.5 [30]. The simulated results showed that Artemisia ordosica Krasch. distribution areas will be expressed in the future [56]. Previous studies suggested that climate change will lead to changes in the suitable distribution of species [57,58]. At the same time, the change in the geometric center of species distribution area may be caused by the expansion or contraction, migration, and distribution area of species distribution area [59].
With the continuous rise of global temperature in the future, species will migrate to higher latitudes or higher elevations in order to seek similar habitats. For example, the species of Nitraria sibirica Pall. in China are expected to migrate northwest to high-altitude areas such as Qinghai in the future [60]. In the future (2050s), the area of suitable habitat for Ammopiptanthus mongolicus (Maxim. ex Kom.) will decrease, and the suitable habitat will show a fragmented distribution, and the migration trend will be to the northeast and northwest high latitude areas [61]. This study shows that under different climate scenarios from the present to the future (2050s, 2070s), apart from the shrinkage and expansion of the distribution area edges of the P. amygdalus, the P. tenella, and the P. mongolica, the center of mass of suitable habitat also moves from Agadez in central Niger to the southern edge of Algeria in Africa, from Baden-Wurttemberg in Germany to the eastern part of France and From Mongolia to Kazakhstan, respectively. They all moved to the high latitude and high-altitude areas in the northwest direction. Northern Nepal has a tropical desert climate, and the environment is very harsh, with the future warming of the climate, the region may no longer be suitable for the survival of P. amygdalus. The climatic characteristics of eastern France are influenced by the continental and Marine climate, which may be more suitable for the growth of P. tenella. In addition, some studies have shown that under future climate conditions, precipitation in the arid region of Central Asia will show a downward trend, but a small increase may occur in the eastern region of Central Asia [62], which may be one of the factors leading to the centroid migration of suitable habitats in P. mongolica, consistent with our previous forecast.
Previous studies showed that some species will migrate to higher altitudes and latitude regions to adapt to the environment of climate warming in the future [63,64]. In the Prunus subg. Amygdalus, P. tangutica, and P. pedunculata potential, distribution areas will moved to the eastern region. It is consistent with the trend that the suitable distribution areas of Zelkova serrata (Thunb.) Makino and Litsea coreana var. sinensis (Allen) will move to the northeast as the climate warms, which may be the reason for the higher latitude in the northeast [36,65]. But the distribution areas of P. triloba would move to the southwest region in the future, as a commonly used afforestation tree, P. triloba has a wider range of suitable habitats. P. tangutica and P. pedunculata mainly grow in valleys, scrub forests, and other complex topographic environments. The distributions of the two species differ from other species, and may be related to various environmental factors (such as slope, altitude, and Soil pH) except climatic variables [8,12,50,66]. Consequently, the interplay of these factors, coupled with climate variables, orchestrates a complex and fragmented distribution pattern of Prunus subg. Amygdalus’s potential geographic spread.

5. Conclusions

It is important to predict the effects of climate change on the distribution of Prunus subg. Amygdalus for the conservation of its constituent taxa. The results showed that the MaxEnt model could simulate the distribution areas of six species in Prunus subg. Amygdalus well. Temperature, precipitation, UV-B, and altitude are the main environmental factors affecting the distribution of the six species. Currently, the suitable areas of Prunus mongolica and Prunus tangutica are restricted to Asia. In the future, the suitable growth areas of the six species except for the increase of the distribution area of P. triloba and P. mongolica will increase or decrease in different degrees global under the intermediate and high concentrations of greenhouse gas emission scenario (ssp2.45 and ssp5.85). The spatial and temporal distribution patterns of the species can be used as a reference for forest management and the formulation of conservation strategies for these ecologically important species.

Supplementary Materials

The following supporting information can be downloaded at: https://www.mdpi.com/article/10.3390/f15111848/s1, Table S1. GBIF the DOI of the downloaded data. Table S2. Detailed survey locations. Table S3. Evaluation metrics of MaxEnt model generated by ENMeval. Table S4. Location of the centroid shift and migration distance of Prunus subg. Amygdalus. under different climate scenarios. Figure S1. Study framework diagram. Figure S2. Heat map of correlation between 29 environmental variables. Figure S3. ROC curve for Prunus subg. Amygdalus. using the MaxEnt model. P. amygdalus (a), P. tenella (b), P. pedunculata (c), P. mongolica (d), P. tangutica (e), and P. triloba (f). Figure S4. Response curves for key environmental predictors in the species distribution model for P. amygdalus. (a) BIO2, (b) BIO6, (c) BIO8, (d) BIO16, (e) BIO19, (f) UVB2, and (g) UVB4. (The red line represents the average value of all candidate models, and the blue range indicates the standard deviation, the same as below). Figure S5. Response curves for key environmental predictors in the species distribution model for P. tenella. (a) BIO2, (b) BIO11, (c) BIO12, (d) BIO14, (e) BIO15, (f) UVB4, and (g) SpH. Figure S6. Response curves for key environmental predictors in the species distribution model for P. pedunculata. (a) BIO13, (b) BIO14, (c) BIO15, (d) BIO19, (e) UVB4, (f) Slope, (g) SpH. Figure S7. Response curves for key environmental predictors in the species distribution model for P. mongolica. (a) BIO4, (b) BIO14, (c) BIO18, (d) BIO19, and (e) DEM. Figure S8. Response curves for key environmental predictors in the species distribution model for P. tangutica. (a) BIO9, (b) BIO14, (c) BIO18, (d) BIO19, and (e) DEM. Figure S9. Response curves for key environmental predictors in the species distribution model for P. triloba. (a) BIO1, (b) BIO2, (c) BIO14, (d) BIO15, (e) BIO18, (f) BIO19, (g) DEM, and (h) Slope. Figure S10. Future species distribution models (SDMs) of Prunus subg. Amygdalus. under climate change scenarios ssp5.85. Dark blue, light blue, green and red indicate no suitability, low suitability, medium suitability, and high suitability, respectively. Figure S11. Distribution changes of ssp5.85 in the future climate scenario of Prunus subg. Amygdalus. compared to the current. Dark blue, light blue, green, and red indicate no occupancy, range expansion, no changed and range contraction, respectively.

Author Contributions

Y.D. and Z.D. conceived and designed the study. K.L., M.L. and H.B. performed the experiments. Y.D., K.H., Y.H. and K.L. contributed materials/analysis tools. K.L. drafted the manuscript. K.L., M.L. and Y.L. revised the paper. All authors have read and agreed to the published version of the manuscript.

Funding

This project was funded by the National Natural Science Foundation of China (32060095, 32300324 and 32460323), Yulin Major Science and Technology Project Special Project (YLKJ-2024-RCZD-001), Yulin Industry-University-Research Project (CXY 2021-81), Natural Science Basic Research Program of Shaanxi Province (2023-JC-QN-0252), and Shaanxi Province “Four subjects and One Union” Sandy Land Ecological Protection and Restoration and Sand Industry Joint Research Center (2022PTJB010).

Data Availability Statement

Data are contained within the article.

Acknowledgments

Thanks to reviewers for their constructive comments that greatly helped us to improve the quality of this manuscript.

Conflicts of Interest

The authors declare no conflicts of interest.

References

  1. Cong, M.; Xu, Y.; Tang, L.; Yang, W.; Jian, M. Predicting the dynamic distribution of Sphagnum bogs in China under climate change since the last interglacial period. PLoS ONE 2020, 15, e0230969. [Google Scholar] [CrossRef] [PubMed]
  2. Allan, R.P.; Arias, P.A.; Berger, S.; Canadell, J.G.; Cassou, C.; Chen, D.; Cherchi, A.; Connors, S.L.; Coppola, E.; Cruz, F.A.; et al. Summary for Policymakers. In Climate Change 2021: The Physical Science Basis; Contribution of working group I to the sixth assessment report of the intergovernmental panel on climate change; Cambridge University Press: Cambridge, UK, 2023; pp. 3–32. [Google Scholar]
  3. Vorosmarty, C.J.; Green, P.; Salisbury, J.; Lammers, R.B. Global water resources: Vulnerability from climate change and population growth. Science 2000, 289, 284–288. [Google Scholar] [CrossRef] [PubMed]
  4. Scholze, M.; Knorr, W.; Arnell, N.W.; Prentice, I.C. A climate-change risk analysis for world ecosystems. Proc. Natl. Acad. Sci. USA 2006, 103, 13116–13120. [Google Scholar] [CrossRef] [PubMed]
  5. Guo, J.; Liu, X.P.; Zhang, Q.; Zhang, D.F.; Liu, X. Prediction for the potential distribution area of Codonopsis pilosula at global scale based on Maxent model. J. Appl. Ecol. 2017, 28, 992–1000. [Google Scholar]
  6. He, Y.; Ma, J.; Chen, G. Potential geographical distribution and its multi-factor analysis of Pinus massoniana in China based on the maxent model. Ecol. Indic. 2023, 154, 110790. [Google Scholar] [CrossRef]
  7. Parmesan, C. Ecological and evolutionary responses to recent climate change. Annu. Rev. Ecol. Evol. Syst. 2006, 37, 637–669. [Google Scholar] [CrossRef]
  8. Duan, C.; Zhang, K.; Duan, Y. Comparison of complete chloroplast genome sequences of Amygdalus pedunculata Pall. Nat. Biotechnol. 2020, 36, 2850–2859. [Google Scholar]
  9. Wang, W.; Yang, T.; Wang, H.L.; Li, Z.J.; Ni, J.W.; Su, S.; Xu, X.Q. Comparative and phylogenetic analyses of the complete chloroplast genomes of six almond species (Prunus spp. L.). Sci. Rep. 2020, 10, 10137. [Google Scholar] [CrossRef]
  10. Asgari, K.; Khadivi, A. Morphological and pomological characterizations of almond (Prunus amygdalus L.) genotypes to choose the late-blooming superiors. Euphytica 2021, 217, 42. [Google Scholar] [CrossRef]
  11. Liu, X.; Zhang, D.; Yu, Z.; Zeng, B. Assembly and analysis of the complete mitochondrial genome of the Chinese wild dwarf almond (Prunus tenella). Front. Genet. 2024, 14, 1329060. [Google Scholar] [CrossRef]
  12. Peng, S.; Ting-Duan, Z.; Fu-Rong, L.; Wei, W.; Jian-Xun, L.; Chen, J. Superior Variety Selection and Overall Evaluations of Amygdalus tangutica in Western Sichuan. J. Sichuan For. Sci. 2017, 38, 79–84. [Google Scholar]
  13. Wang, X.Q.; Wang, J.X.; Ma, X.; Zhang, Y.Y.; Long, D.I. Effects of leaf extracts of Amorpha fruticosa on seed germination and seedling growth of Amygdalus pedunculata. J. Appl. Ecol. 2021, 32, 57–65. [Google Scholar]
  14. Wiens, J.A.; Stralberg, D.; Jongsomjit, D.; Howell, C.A.; Snyder, M.A. Niches, models, and climate change: Assessing the assumptions and uncertainties. Proc. Natl. Acad. Sci. USA 2009, 106 (Suppl. S2), 19729–19736. [Google Scholar] [CrossRef] [PubMed]
  15. Stockwell, D. The GARP modelling system: Problems and solutions to automated spatial prediction. Int. J. Geog. Inf. Sci. 1999, 13, 143–158. [Google Scholar] [CrossRef]
  16. Lemmen, C.; Van Oosterom, P.; Bennett, R. The land administration domain model. Land Use Policy 2015, 49, 535–545. [Google Scholar] [CrossRef]
  17. Booth, T.H.; Nix, H.A.; Busby, J.R.; Hutchinson, M.F. BIOCLIM: The first species distribution modelling package, its early applications and relevance to most current MAXENT studies. Divers. Distrib. 2014, 20, 1–9. [Google Scholar] [CrossRef]
  18. Hirzel, A.H.; Hausser, J.; Chessel, D.; Perrin, N. Ecological-niche factor analysis: How to compute habitat-suitability maps without absence data? J. Ecol. 2002, 83, 2027–2036. [Google Scholar] [CrossRef]
  19. Elith, J.; Phillips, S.J.; Hastie, T.; Dudík, M.; Chee, Y.E.; Yates, C.J. A statistical explanation of MaxEnt for ecologists. Divers. Distrib. 2011, 17, 43–57. [Google Scholar] [CrossRef]
  20. Bradie, J.; Leung, B. A quantitative synthesis of the importance of variables used in MaxEnt species distribution models. J. Biogeogr. 2017, 44, 1344–1361. [Google Scholar] [CrossRef]
  21. Merow, C.; Smith, M.J.; Silander, J.A. A practical guide to MaxEnt for modeling species’ distributions: What it does, and why inputs and settings matter. Ecography 2013, 36, 1058–1069. [Google Scholar] [CrossRef]
  22. Muscarella, R.; Galante, P.J.; Soley-Guardia, M.; Boria, R.A.; Kass, J.M.; Uriarte, M.; Anderson, R.P. ENM eval: An R package for conducting spatially independent evaluations and estimating optimal model complexity for Maxent ecological niche models. Methods Ecol. Evol. 2014, 5, 1198–1205. [Google Scholar] [CrossRef]
  23. Fick, S.E.; Hijmans, R.J. WorldClim 2: New 1-km spatial resolution climate surfaces for global land areas. Int. J. Climatol. 2017, 37, 4302–4315. [Google Scholar] [CrossRef]
  24. Elith, J.; Graham, C.H.; Anderson, R.P.; Dudik, M.; Ferrier, S.; Guisan, A.; Hijmans, R.J.; Huettmann, F.; Leathwick, J.R.; Lehmann, A. Novel methods improve prediction of species’ distributions from occurrence data. Ecography 2006, 29, 129–151. [Google Scholar] [CrossRef]
  25. Phillips, S.J.; Anderson, R.P.; Dudík, M.; Schapire, R.E.; Blair, M.E. Opening the black box: An open-source release of Maxent. Ecography 2017, 40, 887–893. [Google Scholar] [CrossRef]
  26. Hou, J.; Xiang, J.; Li, D.; Liu, X. Prediction of potential suitable distribution areas of Quasipaa spinosa in China based on MaxEnt optimization model. Biology 2023, 12, 366. [Google Scholar] [CrossRef]
  27. Kass, J.M.; Muscarella, R.; Galante, P.J.; Bohl, C.L.; Pinilla-Buitrago, G.E.; Boria, R.A.; Soley-Guardia, M.; Anderson, R.P. ENMeval 2.0: Redesigned for customizable and reproducible modeling of species’ niches and distributions. Methods Ecol. Evol. 2021, 12, 1602–1608. [Google Scholar] [CrossRef]
  28. Hanley, J.A.; Mcneil, B.J. The meaning and use of the area under a receiver operating characteristic (ROC) curve. Radiology 1982, 143, 29–36. [Google Scholar] [CrossRef]
  29. Raes, N.; ter Steege, H. A null-model for significance testing of presence-only species distribution models. Ecography 2007, 30, 727–736. [Google Scholar] [CrossRef]
  30. Zhang, K.; Yao, L.; Meng, J.; Tao, J. Maxent modeling for predicting the potential geographical distribution of two peony species under climate change. Sci. Total Environ. 2018, 634, 1326–1334. [Google Scholar] [CrossRef]
  31. Wittlinger, L.; Petrikovičová, L. Phytogeographical analysis and ecological factors of the distribution of Orchidaceae taxa in the Western Carpathians (Local study). Plants 2021, 10, 588. [Google Scholar] [CrossRef]
  32. Sun Lei, S.L.; Ding ChunRui, D.C. Nutritional components of Amygdalus communis L. and Amygdalus communis L. kernel oil in Xinjiang. China Oils Fats 2018, 43, 87–89. [Google Scholar]
  33. Hernandez, P.A.; Graham, C.H.; Master, L.L.; Albert, D.L. The effect of sample size and species characteristics on performance of different species distribution modeling methods. Ecography 2010, 29, 773–785. [Google Scholar] [CrossRef]
  34. Amin, P.; Akhavan-Ghalibaf, M. Assessment of Soils and Plants Loss as a Result of Darrezar Copper Mining in South-Eastern Iran. Eurasian J. Soil Sci. 2021, 54, 1608–1617. [Google Scholar] [CrossRef]
  35. Deng, G.; Li, M.; Hao, Z.; Shao, X. Responses to Climate Change of Maximum Latewood Density from Larix speciosa Cheng et Law and Abies delavayi Franch. in the Northwest of Yunnan Province, China. Forests 2022, 13, 720. [Google Scholar] [CrossRef]
  36. Pan, J.; Fan, X.; Luo, S.; Zhang, Y.; Qian, Z. Predicting the Potential Distribution of Two Varieties of Litsea coreana (Leopard-Skin Camphor) in China under Climate Change. Forests 2020, 11, 1159. [Google Scholar] [CrossRef]
  37. Wang, X.; Zhang, R.; Wang, J.; Di, L.; Sikdar, A. The Effects of Leaf Extracts of Four Tree Species on Amygdalus pedunculata Seedlings Growth. Front Plant Sci. 2021, 11, 587579. [Google Scholar] [CrossRef]
  38. Shi, X.; Wang, J.; Zhang, L.; Chen, S.; Zhao, A.; Ning, X.; Fan, G.; Wu, N.; Zhang, L.; Wang, Z. Prediction of the potentially suitable areas of Litsea cubeba in China based on future climate change using the optimized MaxEnt model. Ecol. Indic. 2023, 148, 110093. [Google Scholar] [CrossRef]
  39. Wang, J.; Zhou, H.; Wu, T.; Wu, P.; Shi, S. Amygdalin isolated from Amygdalus mongolica protects against hepatic fibrosis in rats. Acta Pharm. 2021, 71, 459–471. [Google Scholar] [CrossRef]
  40. Wang, J.; Zheng, R.; Bai, S.; Gao, X.; Liu, M.; Yan, W. Mongolian almond (Prunus mongolica Maxim): The morpho-physiological, biochemical and transcriptomic response to drought stress. PLoS ONE 2015, 10, e0124442. [Google Scholar] [CrossRef]
  41. Guo, Y.; Yu, H.; Kong, D.; Yan, F.; Liu, D.; Zhang, Y. Effects of gradual soil drought stress on the growth, biomass partitioning, and chlorophyll fluorescence of Prunus mongolica seedlings. Turk. J. Biol. 2015, 39, 532–539. [Google Scholar] [CrossRef]
  42. Chieb, M.; Gachomo, E.W. The role of plant growth promoting rhizobacteria in plant drought stress responses. BMC Plant Biol. 2023, 23, 407. [Google Scholar] [CrossRef] [PubMed]
  43. Zlatev, Z.S.; Lidon, F.J.; Kaimakanova, M. Plant physiological responses to UV-B radiation. Emir. J. Food Agric. 2012, 24, 481–501. [Google Scholar] [CrossRef]
  44. Zuk-Golaszewska, K.; Upadhyaya, M.; Golaszewski, J. The effect of UV-B radiation on plant growth and development. Plant Soil Environ. 2003, 49, 135–140. [Google Scholar] [CrossRef]
  45. Mannucci, A.; Mariotti, L.; Castagna, A.; Santin, M.; Trivellini, A.; Reyes, T.H.; Mensuali-Sodi, A.; Ranieri, A.; Quartacci, M.F. Hormone profile changes occur in roots and leaves of Micro-Tom tomato plants when exposing the aerial part to low doses of UV-B radiation. Plant Physiol Bioch. 2020, 148, 291–301. [Google Scholar] [CrossRef] [PubMed]
  46. Shi, C.; Liu, H. How plants protect themselves from ultraviolet-B radiation stress. Plant Physiol. 2021, 187, 1096–1103. [Google Scholar] [CrossRef]
  47. Garcia-Corral, L.S.; Holding, J.M.; Carrillo-De-Albornoz, P.; Steckbauer, A.; Pérez-Lorenzo, M.; Navarro, N.; Serret, P.; Duarte, C.M.; Agusti, S. Effects of UVB radiation on net community production in the upper global ocean. Glob. Ecol. Biogeogr. 2016, 26, 54–64. [Google Scholar] [CrossRef]
  48. Robson, T.M.; Klem, K.; Urban, O.; Jansen, M.A. Re-interpreting plant morphological responses to UV-B radiation. Plant Cell Environ. 2015, 38, 856–866. [Google Scholar] [CrossRef]
  49. Rozema, J.; Björn, L.O.; Bornman, J.; Gaberščik, A.; Häder, D.-P.; Trošt, T.; Germ, M.; Klisch, M.; Gröniger, A.; Sinha, R. The role of UV-B radiation in aquatic and terrestrial ecosystems—An experimental and functional analysis of the evolution of UV-absorbing compounds. J. Photochem. Photobiol. B Biol. 2002, 66, 2–12. [Google Scholar] [CrossRef]
  50. Miao, G.; Zhao, Y.; Wang, Y.; Yu, C.; Xiong, F.; Sun, Y.; Cao, Y. Suitable Habitat Prediction and Analysis of Dendrolimus houi and Its Host Cupressus funebris in the Chinese Region. Forests 2024, 15, 162. [Google Scholar] [CrossRef]
  51. Djukic, I.; Zehetner, F.; Tatzber, M.; Gerzabek, M.H. Soil organic-matter stocks and characteristics along an Alpine elevation gradient. J. Plant Nutr. Soil Sci. 2010, 173, 30–38. [Google Scholar] [CrossRef]
  52. Neina, D.J.A. The role of soil pH in plant nutrition and soil remediation. Appl. Environ. Soil Sci. 2019, 2019, 5794869. [Google Scholar] [CrossRef]
  53. Grabherr, G. Climate effects on mountain plants. Nature 1994, 369, 448. [Google Scholar] [CrossRef] [PubMed]
  54. Lee, H.; Calvin, K.; Dasgupta, D.; Krinner, G.; Mukherji, A.; Thorne, P.; Trisos, C.; Romero, J.; Aldunce, P.; Barrett, K. Climate Change 2023: Synthesis Report. Contribution of Working Groups I, II and III to the Sixth Assessment Report of the Intergovernmental Panel on Climate Change; The Australian National University: Canberra, Australia, 2023; pp. 1–34. [Google Scholar]
  55. Hong, D.Y.; Zhou, S.; He, X.; Yuan, J.; Zhang, X. Current status of wild tree peony species with special reference to conservation. Biodivers. Sci. 2017, 25, 781–793. [Google Scholar] [CrossRef]
  56. Lu, K.; He, Y.-M.; Mao, W.; Zy, D.; Wang, L.-J.; Liu, G.-M.; Feng, W.-J.; Duan, Y.-Z. Potential geographical distribution and changes of Artemisia ordosica in China under future climate change. J. Appl. Ecol. 2020, 31, 3758–3766. [Google Scholar]
  57. Hampe, A.; Petit, R.J. Conserving biodiversity under climate change: The rear edge matters. Ecol. Lett. 2005, 8, 461–467. [Google Scholar] [CrossRef]
  58. Thuiller, W.; Albert, C.; Araújo, M.B.; Berry, P.M.; Cabeza, M.; Guisan, A.; Hickler, T.; Midgley, G.F.; Paterson, J.; Schurr, F.M. Predicting global change impacts on plant species’ distributions: Future challenges. Perspect. Plant Ecol. Evol. Syst. 2008, 9, 137–152. [Google Scholar] [CrossRef]
  59. Zhang, J.M.; Song, M.; Li, Z.J.; Peng, X.; Su, S.; Li, B.; Xu, X.Q.; Wang, W. Effects of Climate Change on the Distribution of Akebia quinata. Front. Ecol. Evol. 2021, 9, 752682. [Google Scholar] [CrossRef]
  60. Temirbayeva, K.; Zhang, M.-L. Molecular phylogenetic and biogeographical analysis of Nitraria based on nuclear and chloroplast DNA sequences. Plant Syst. Evol. 2015, 301, 1897–1906. [Google Scholar] [CrossRef]
  61. Du, Z.; He, Y.; Wang, H.; Wang, C.; Duan, Y. Potential geographical distribution and habitat shift of the genus Ammopiptanthus in China under current and future climate change based on the MaxEnt model. J. Arid Environ. 2021, 184, 104328. [Google Scholar] [CrossRef]
  62. Lioubimtseva, E.; Henebry, G.M. Climate and environmental change in arid Central Asia: Impacts, vulnerability, and adaptations. J. Arid Environ. 2009, 73, 963–977. [Google Scholar] [CrossRef]
  63. VanDerWal, J.; Murphy, H.T.; Kutt, A.S.; Perkins, G.C.; Bateman, B.L.; Perry, J.J.; Reside, A.E. Focus on poleward shifts in species’ distribution underestimates the fingerprint of climate change. Nat. Clim. Chang. 2013, 3, 239–243. [Google Scholar] [CrossRef]
  64. Tian, L.; Benton, M.J. Predicting biotic responses to future climate warming with classic ecogeographic rules. Curr. Biol. 2020, 30, R744–R749. [Google Scholar] [CrossRef] [PubMed]
  65. Cao, C.; Tao, J. Predicting the areas of suitable distribution for Zelkova serrata in China under climate change. Sustainability 2021, 13, 1493. [Google Scholar] [CrossRef]
  66. Quamme, H.A.; Layne, R.E.C.; Ronald, W.G. Relationship of supercooling to cold hardiness and the northern distribution of several cultivated and native Prunus species and hybrids. Can. J. Plant Sci. 1982, 62, 137–148. [Google Scholar] [CrossRef]
Figure 1. Locations of 6076 distribution points of Prunus subg. Amygdalus in the world. The map data were downloaded from the National Basic Geographic Information System (https://nfgis.nsdi.gov.cn/, accessed on 17 July 2024).
Forests 15 01848 g001
Figure 2. Maps of current potential habitat, P. amygdalus (a), P. tenella (b), P. pedunculata (c), P. mongolica (d), P. tangutica (e), and P. triloba (f) in the world. Dark blue, light blue, green, and red indicate no suitability, low suitability, medium suitability, and high suitability, respectively.
Forests 15 01848 g002
Figure 3. Future species distribution of Prunus subg. Amygdalus in the world under climate change scenarios ssp2.45. P. amygdalus (a1,a2), P. tenella (b1,b2), P. pedunculata (c1,c2), P. mongolica (d1,d2), P. tangutica (e1,e2) and P. triloba (f1,f2). Dark blue, light blue, green and red indicate no suitability, low suitability, medium suitability, and high suitability, respectively.
Forests 15 01848 g003
Figure 4. Distribution changes of ssp2.45 in the future climate scenario of Prunus subg. Amygdalus. compared to the current. P. amygdalus (a1,a2), P. tenella (b1,b2), P. pedunculata (c1,c2), P. mongolica (d1,d2), P. tangutica (e1,e2) and P. triloba (f1,f2). Dark blue, light blue, green and red indicate no occupancy, range expansion, no changed and range contraction, respectively.
Forests 15 01848 g004
Figure 5. The core distributional shifts under different climate scenario/year for P. amygdalus (a), P. tenella (b), P. pedunculata (c), P. mongolica (d), P. tangutica (e), and P. triloba (f). The red line represents the ssp2.45 scenario and the blue line represents the ssp5.85 scenario.
Forests 15 01848 g005
Table 1. Environmental variables used for MaxEnt model prediction for Prunus subg. Amygdalus.
Environment VariableDescriptionUnit
Bio1Annual mean temperature temp°C
Bio2Mean diurnal temperature range°C
Bio3Isothermality (Bio2/Bio7) (×100)-
Bio4Temperature seasonality (standard deviation×100)-
Bio5Maximum temperature of the warmest month
Bio6Min temperature of coldest month°C
Bio7Range of annual temperature variation°C
Bio8Mean temperature of the wettest quarter°C
Bio9Mean temperature of driest quarter°C
Bio10Mean temperature of warmest quarter°C
Bio11Mean temperature of coldest quarter°C
Bio12Annual precipitationmm
Bio13Precipitation of wettest monthmm
Bio14Precipitation of driest monthmm
Bio15Precipitation seasonality (coefficient of variation)mm
Bio16Precipitation of wettest quartermm
Bio17Precipitation of the driest quartermm
Bio18Precipitation of warmest quartermm
Bio19Precipitation of coldest quartermm
SCSoil organic carbong/kg
SpHSoil pH-
STSoil texture-
UVB1Annual mean UV-BJ/m2/day
UVB2UV-B seasonalityJ/m2/day
UVB3Mean UV-B of lightest monthJ/m2/day
UVB4Mean UV-B of lowest monthJ/m2/day
DEMDigital Elevation Modelm
AspectAspect-
SlopeSlope°
Note: The variables isothermality (bio3), temperature seasonality (bio4), Soil pH (SpH), Soil texture (ST), and Aspect are expressed as dimensionless indices or percentages. Given their nature as ratios or standardized scales, they are presented without physical units in this table.
Table 2. Contribution of environmental variables and suitable value ranges.
Environment
Variable
UnitContribution (%)
P. amygdalusP. tenellaP. mongolicaP. pedunculataP. tanguticaP. triloba
Bio1°C×××××59.9
Bio2°C3.35.6×××4.2
Bio4-××26.7×××
Bio6°C20.2×××××
Bio8°C11.6×××××
Bio9°C××××20.3×
Bio11°C×31.0××××
Bio12mm×5.5××××
Bio13mm×××2.9××
Bio14mm×38.43.80.33.81.8
Bio15-×××19.6×1.1
Bio16mm8.1×××××
Bio18mm××6.8×24.015.9
Bio19mm24.0×36.319.815.011.6
SpH-×3.7×2.6××
UVB2J/m2/day15.5×××××
UVB4J/m2/day17.215.4×41.3××
DEMm××26.413.236.93.6
Slope°×××0.3×1.9
Note: Variables without any values (indicated by ×) were removed because of high cross-correlations.
Table 3. Portions of different classes of potential distribution area of Prunus subg. Amygdalus under current and future climate scenarios/years.
SpeciesPeriodPoorly Suitable AreaModerately Suitable AreaHighly Suitable AreaTotal Suitable Area
Area of each suitable area ×106 km2 (change in the area compared to current)
P. amygdalusCurrent-13.765.143.8222.16
ssp2.45205021.49 (56.18%)7.06 (37.33%)3.75 (14.94%)32.30 (45.74%)
207012.98 (−5.70%)5.64 (9.69%)3.19 (−2.10%)21.81 (−1.60%)
ssp5.85205012.71 (−7.62%)5.79 (12.48%)3.51 (7.55%)22.00 (−0.72%)
207012.36 (−10.18%)5.46 (6.24%)3.47 (6.31%)21.29 (−3.95%)
P. tenellaCurrent-9.705.043.8218.56
ssp2.4520509.45 (−2.58%)4.73 (−6.16%)4.03 (5.42%)18.21 (−1.91%)
207010.42 (7.41%)5.19 (3.06%)4.05 (6.11%)19.67 (5.96%)
ssp5.8520509.93 (2.29%)4.80 (−4.66%)3.80 (−0.55%)18.53 (0.18%)
207010.91 (12.42%)4.51 (−10.56%)3.98 (4.29%)19.40 (4.51%)
P. mongolicaCurrent-1.881.070.823.77
ssp2.4520502.38 (26.31%)1.47 (37.06%)1.16 (41.42%)5.00 (32.65%)
20702.32 (23.11%)1.51 (40.68%)1.12 (36.53%)4.94 (31.02%)
ssp5.8520502.35 (24.89%)1.26 (17.80%)0.98 (19.24%)4.59 (21.65%)
20702.38 (26.60%)1.43 (33.22%)1.05 (28.49%)4.86 (28.89%)
P. tanguticaCurrent-0.980.380.161.52
ssp2.4520500.96 (−1.92%)0.46 (19.70%)0.21 (33.13%)1.63 (7.17%)
20700.81 (−16.63%)0.37 (−3.58%)0.18 (13.53%)1.36 (−10.22%)
ssp5.8520500.98 (0.54%)0.41 (7.58%)0.19 (20.37%)1.58 (4.37%)
20700.87 (−10.78%)0.40 (3.53%)0.18 (15.33%)1.45 (−4.47%)
P. pedunculataCurrent-3.061.231.335.62
ssp2.4520502.44 (−20.00%)1.08 (−12.71%)1.35 (1.92%)4.87 (−13.22%)
20702.78 (−9.01%)1.12(−8.93%)1.23 (−6.94%)5.14 (−8.50%)
ssp5.8520502.80 (−8.20%)1.07 (−13.52%)1.39 (4.45%)5.26 (−6.38%)
20702.64 (−13.71%)0.99 (−20.11%)1.32 (−0.44%)4.94 (−11.98%)
P. trilobaCurrent-15.567.342.0524.95
ssp2.45205019.25 (23.69%)8.60 (17.24%)2.44 (18.90%)30.29 (21.40%)
207019.14 (23.00%)8.92 (21.54%)2.72 (32.60%)30.78 (23.36%)
ssp5.85205020.58 (32.28%)8.69 (18.41%)2.51 (22.50%)31.79 (27.40%)
207017.70 (13.76%)8.13 (10.78%)2.47 (20.19%)28.30 (13.42%)
Disclaimer/Publisher’s Note: The statements, opinions and data contained in all publications are solely those of the individual author(s) and contributor(s) and not of MDPI and/or the editor(s). MDPI and/or the editor(s) disclaim responsibility for any injury to people or property resulting from any ideas, methods, instructions or products referred to in the content.

